Figure
1.
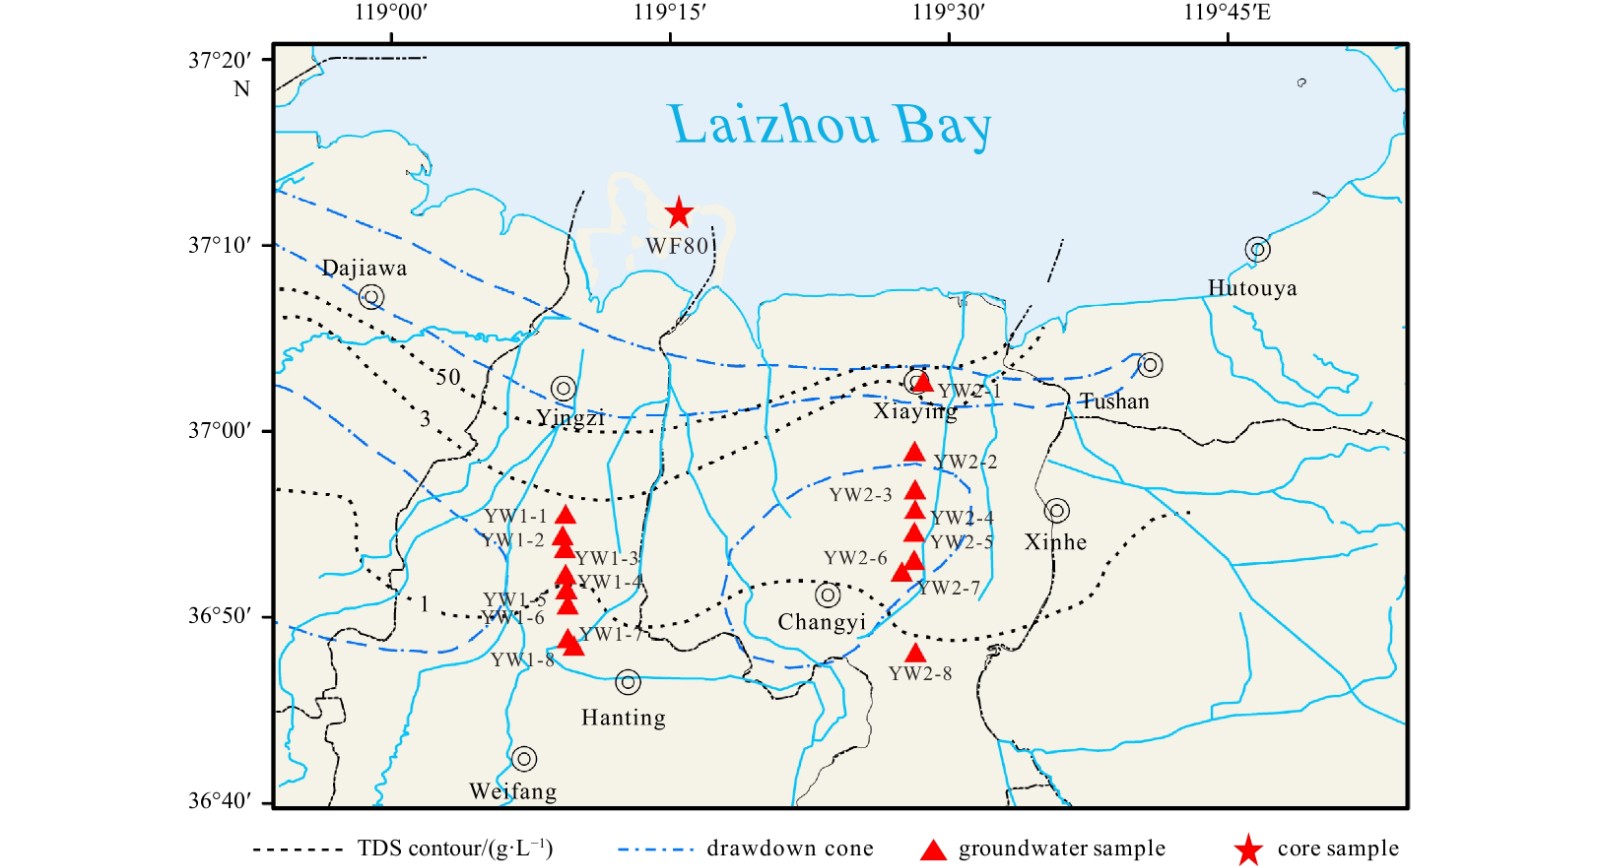
Location of the study area and samples. The blue lines are rivers. TDS: total dissolved solid content.
| Citation: | Yancheng Wang, Guangquan Chen, Hongjun Yu, Xingyong Xu, Yinqiao Zou, Wenqing Zhao, Weitao Han, Wenzhe Lyu, Zhen Cui, Runtian Ding. Simulation of transport mechanism of radium isotopes in aquifer on the southern coast of Laizhou Bay[J]. Acta Oceanologica Sinica, 2023, 42(8): 40-48. doi: 10.1007/s13131-022-2096-z

|
Submarine groundwater discharge (SGD) is an important process for the global hydrological cycle (Moore, 1996; Burnett et al., 2003; Santos et al., 2021). SGD has a significant influence on marine environments and elemental biogeochemical cycles, as it delivers large quantities of substances (e.g., nutrients, trace metals, carbon, and rare earth elements) to the coastal ocean (Kim et al., 2005; Rodellas et al., 2015; Garcia-Orellana et al., 2021; Santos et al., 2021). Thanks to their conservative behavior in seawater (Ivanovich and Harmon, 1992; Burnett et al., 2001), radium isotopes are widely used to trace land-ocean interaction processes (Charette et al., 2016; Knauss et al.,1978; Swarzenski et al., 2013; Garcia-Orellana et al., 2021) and to estimate mixing rates, apparent ages, or residence times in coastal and ocean waters (Moore et al., 1995; Moore, 2000; Tomasky-Holmes et al., 2013; Diego-Feliu et al., 2021).
The selection of groundwater endmembers is an important factor affecting the SGD process of radium isotope tracing (Gonneea et al., 2008; Cho and Kim, 2016). However, natural variability in groundwater radium may span several orders of magnitude (Gonneea et al., 2013), which is due to the differences in aquifer lithology, groundwater residence time, or both (Krishnaswami et al., 1982; Luo et al., 2018). This variability can be the main driver of uncertainties in SGD estimates. Without taking into account the impact of salinity, just using the mean radium activity of randomly collected coastal groundwater as an endmember may result in a twofold to threefold overestimation of SGD at the global scale (Cho and Kim, 2016). Consequently, it is necessary to understand the behavior of radium isotopes in aquifers, particularly the adsorption/desorption behavior of radium isotopes in the solid-liquid phase, to reduce the uncertainty in the selection of groundwater endmembers and obtain more accurate SGD estimates.
At present, the desorption fluxes of radium isotopes, suspended particulate matter, and sediment diffusion fluxes are largely obtained by laboratory experiments (Beck et al., 2007; Charette et al., 2008). To quantify the exchange rate of radium isotopes between sediments and water, Webster et al. (1995) designed the leaching experiment. Previous studies related to leaching experiments have focused on the different conditions (e.g., salinity, grain size, pH, and Fe/Mn oxides content) that affect the desorption amount of radium isotopes on the surface of sediment grains (Yuan et al., 2014; Luo et al., 2019). Webster et al. (1995) demonstrated the control mechanism of water salinity and sediment grain size on radium distribution behavior. Gonneea et al. (2008) proposed that pH, redox potential, and Fe/Mn oxides were important factors affecting radium distribution behavior based on field observations. And finally, Beck and Cochran (2013) systematically discussed the effects of the pH, temperature, sediment grain size, Fe/Mn oxides, and Fe and Mn ion content on the distribution coefficient of radium by means of an indoor desorption experiment.
Due to the influence of high sea level since the Late Pleistocene and the unique palaeogeography and palaeoclimate conditions (Zhang et al., 1996), there are abundant underground brine sources and high concentrations of radioactive uranium-thorium isotopes in the southern coast of Laizhou Bay, which provide the area with high salinity water and radium isotopes (Wang et al., 2015; Xu, 2008). In order to demonstrate the characteristics of radium isotope variation with salinity in different sedimentary units and reveal radium isotope transport mechanisms in aquifers, we selected samples from sediment cores at different depths on the southern coast of Laizhou Bay to simulate the adsorption/desorption process of radium isotope through leaching experiments. We also used Cl− to replace the salinity index and more accurately characterize the relationship between salinity and desorption amount. Furthermore, we selected different layers (depths) of the sediment cores for radium isotope desorption analysis, which provided a new perspective for leaching experiments and enriched the understanding of radium isotope geochemical behavior in different aquifers. The transport mechanisms of Ca2+, Mg2+, Na+, and Ba2+ were analyzed by comparing the relationship between radium isotopes and these ions. Based on the 1-D reactive transport model of radium isotopes (Liu et al., 2019), we simulated the transport process of radium isotopes in aquifers under different salinity conditions in different layers, and a good fitting result was obtained. The results reveal the distribution characteristics and influencing factors of radium isotopes in aquifers and provide a scientific basis for further understanding of the geochemical behavior of radium isotopes in aquifers when employing radium isotopes in marine environment geochemical tracing.
Sediment samples from Core WF80 were collected from the coastal area of the southern coast of Laizhou Bay (37°12.15′N, 119°16.04′E) in August 2020. The core depth is 80 m and the lithology consists of mainly fine sand and clay. Five typical layers of sediments were selected for leaching experiments under different salinity conditions. Four of them are aquitard with sandy silt lithology, and the sampling depths include 7.00−8.00 m (Layer 1), 20.48−21.00 m (Layer 2), 23.00−24.08 m (Layer 3), and 30.00−30.58 m (Layer 5). The other sand-rich layer is the aquifer, with silty sand lithology and sampling depth of 28.00−28.68 m (Layer 4). After natural air drying, 1 000 g sediment from each layer was ground and poured into the clear glass column to carry out the leaching experiment.
Groundwater affected by seawater intrusion from the southern coast of Laizhou Bay was selected as a comparison to verify the results of laboratory experiment (Fig. 1). The groundwater sampling points are distributed perpendicular to the coastline, and the distance to the sea is about 8−36 km. As the distance to the sea decreases, the impact of seawater intrusion on groundwater increases, and the content of Cl− gradually increases, which agrees with the salinity gradient set in the laboratory experiment.
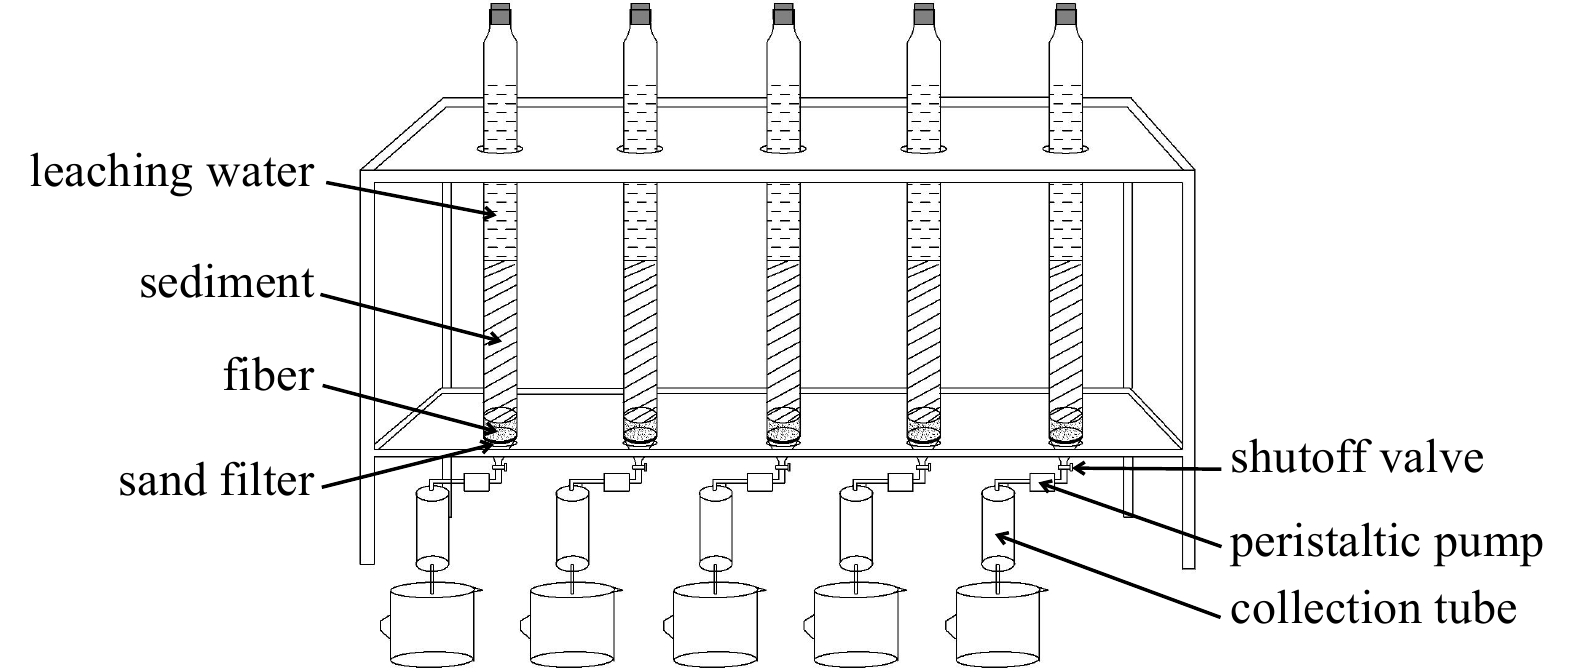
In contrast to desorption experiments, leaching experiments can fully simulate the flow process of groundwater (Webster et al., 1995; Gonneea et al., 2008; Beck and Cochran, 2013). In this study, the natural groundwater flow rate was simulated at room temperature, and the salinity gradients of 0.1, 1, 3, 10, 20, 30 were set to simulate the desorption process of radium isotopes (224Ra and 226Ra) in the sediments of aquifer.
The leaching experiment setup consists of five clear glass columns with an inner diameter of 8 cm and a height of 80 cm (Fig. 2). The bottom of the column is equipped with sand filter to support the sediment and shutoff valve. First, the acrylonitrile fiber was put into the column, then the sediment was added, and finally the leaching water with different salinity was added. The acrylonitrile fiber was employed to filter the leaching water and prevent the blockage of the sand filter. The leaching water, controlled by a peristaltic pump, flowed slowly through the sediment and eventually into the collection tube filled with Mn-fibers (Xia et al., 2016).

The leaching water samples with different salinities were prepared by mixing high-salinity non-radium groundwater with Milli-Q water. The high salinity non-radium groundwater sample was prepared by using underground brine from the southern coast of Laizhou Bay, in which 224Ra and 226Ra isotopes were adsorbed by Mn-fiber at a flow rate of less than 1 L/min (Moore, 2008).
The collected samples (groundwater and leaching water) were placed into precleaned polyethylene plastic bottles immediately after being filtered through a 0.45 μm membrane. Thereafter, the collected samples were stored in refrigerators at temperatures below 4℃ until they were analyzed. The cation concentrations were measured with an Inductively Coupled Plasma Optical Emission Spectrometer (ICP-OES, Thermo Fisher) at the China Ocean Sample Repository in Qingdao. The anion concentrations were analyzed with an Ion Chromatograph (ICS-3000, DIONEX) at Ocean University of China.
The grain size samples were measured in the Key Laboratory of Marine Geology and Mineralization in the Ministry of Natural Resources using a Malvern Mastersizer 2000 laser grain size analyzer (Malvern Panalytical Ltd., United Kingdom). A subsample of 0.5 g of sediment was selected from each sample, each of which was then pretreated with both a 15 mL H2O2 solution (15%) to remove organic matter and a 5 mL HCl solution (10%) for 12 h to remove carbonates. All samples were rinsed 3 times with Milli-Q water in a centrifuge and dispersed by ultrasonic treatment before being tested.
After flowing through the sediment, the leaching water flowed through the Mn-fiber in the collection tube with a flow rate <1 L/min (Moore, 2008). The Mn-fiber was cleaned immediately after adsorption of radium isotope with Milli-Q water to remove the salt and particulate matter on the fiber surface, and its water content was adjusted to approximately 100%. Radium isotopes were measured using a Radium Delayed Coincidence Counter (RaDeCC) system. The prepared Mn-fiber was placed in the closed loop of RaDeCC system to measure 224Ra and 226Ra activities at Ocean University of China (Moore and Arnold, 1996).
The average grain size in Layers 1−5 was 41.71 μm, 35.07 μm, 33.43 μm, 79.88 μm, and 40.22 μm, respectively. Except for the larger average grain size of Layer 4, the differences in average grain size of the other four layers were not significant.
The mean values of 224Ra desorption of the five sediment layers with different salinities (0.1, 1, 3, 10, 20, 30) were 7.53 Bq/m3, 11.83 Bq/m3, 32.86 Bq/m3, 105.63 Bq/m3, 177.11 Bq/m3, 218.85 Bq/m3, respectively. The mean values of 226Ra desorption were 2.23 Bq/m3, 4.04 Bq/m3, 11.14 Bq/m3, 33.65 Bq/m3, 43.83 Bq/m3 and 52.46 Bq/m3, respectively (Table 1).
| Salinity | Layer 1 | Layer 2 | Layer 3 | Layer 4 | Layer 5 | Mean value | |||||||||||
| 224Ra | 226Ra | 224Ra | 226Ra | 224Ra | 226Ra | 224Ra | 226Ra | 224Ra | 226Ra | 224Ra | 226Ra | ||||||
| 0.1 | 3.62 | 2.35 | 1.37 | 1.77 | 26.66 | 2.61 | 2.32 | 2.32 | 3.66 | 2.13 | 7.53 | 2.23 | |||||
| 1 | 13.16 | 5.13 | 7.24 | 3.22 | 6.38 | 3.49 | 24.06 | 4.26 | 8.30 | 4.10 | 11.83 | 4.04 | |||||
| 3 | 47.32 | 16.81 | 26.13 | 9.65 | 30.60 | 10.27 | 32.32 | 12.78 | 27.96 | 6.20 | 32.86 | 11.14 | |||||
| 10 | 115.70 | 43.14 | 102.94 | 35.23 | 100.79 | 33.97 | 109.30 | 38.61 | 99.41 | 17.33 | 105.63 | 33.65 | |||||
| 20 | 134.86 | 35.52 | 148.89 | 49.47 | 187.97 | 44.14 | 209.91 | 54.63 | 203.91 | 35.39 | 177.11 | 43.83 | |||||
| 30 | 179.74 | 42.81 | 173.68 | 55.10 | 224.72 | 49.32 | 270.24 | 74.99 | 245.86 | 40.06 | 218.85 | 52.46 | |||||
 DownLoad:
CSV
DownLoad:
CSV
The 16 groundwater samples on the southern coast of Laizhou Bay were divided according to salinity (Table 2). The mean salinity of the Group 1 was 0.34, the average activity of 224Ra was 11.26 Bq/m3, and that of 226Ra was 3.41 Bq/m3. The mean salinity of the Group 2 was 1.15, the average activity of 224Ra was 28.11 Bq/m3, and that of 226Ra was 3.99 Bq/m3. The mean salinity of the Group 3 was 4.60, the average activity of 224Ra was 21.09 Bq/m3, and that of 226Ra was 6.02 Bq/m3. The mean salinity of the Group 4 was 12.10, the average activity of 224Ra was 230.23 Bq/m3, and that of 226Ra was 6.75 Bq/m3. The mean salinity of the Group 5 was 4.35, the average activity of 224Ra was 403.60 Bq/m3, and that of 226Ra was 36.40 Bq/m3.
| Sample code | Latitude | Longitude | Salinity | Group type | 224Ra/ (Bq·m−3) | 226Ra/ (Bq·m−3) |
| YW1-1 | 36.926°N | 119.156°E | 10.6 | 4 | 60.10 | 1.15 |
| YW1-2 | 36.907°N | 119.154°E | 9.9 | 4 | 54.28 | 8.93 |
| YW1-3 | 36.895°N | 119.156°E | 4.3 | 3 | 11.11 | 5.72 |
| YW1-4 | 36.872°N | 119.156°E | 0.4 | 1 | 8.26 | 6.68 |
| YW1-5 | 36.859°N | 119.157°E | 0.5 | 1 | 11.17 | 5.67 |
| YW1-6 | 36.830°N | 119.158°E | 0.4 | 1 | 12.43 | 1.30 |
| YW1-7 | 36.815°N | 119.158°E | 0.4 | 1 | 9.77 | 1.51 |
| YW1-8 | 36.808°N | 119.164°E | 1.2 | 2 | 12.54 | 1.34 |
| YW2-1 | 37.045°N | 119.477°E | 26.1 | 5 | 403.60 | 36.40 |
| YW2-2 | 36.983°N | 119.469°E | 14.9 | 4 | 578.51 | 13.92 |
| YW2-3 | 36.948°N | 119.470°E | 4.9 | 3 | 31.08 | 6.32 |
| YW2-4 | 36.930°N | 119.470°E | 13.0 | 4 | 228.03 | 3.01 |
| YW2-5 | 36.910°N | 119.469°E | 1.1 | 2 | 43.67 | 6.64 |
| YW2-6 | 36.885°N | 119.469°E | 0.2 | 1 | 8.59 | 2.06 |
| YW2-7 | 36.874°N | 119.458°E | 0.3 | 1 | 14.85 | 2.87 |
| YW2-8 | 36.802°N | 119.470°E | 0.2 | 1 | 13.71 | 3.78 |
DownLoad:
CSV
Radium isotopes in groundwater are the result of the interaction of groundwater with rocks, sediments, and minerals in aquifers. The most common natural mechanisms that affect the activity of radium isotopes in groundwater are the decay of radioactive thorium isotopes and subsequent production, adsorption and desorption from the aquifer solids, weathering and precipitation, and the decay of radium isotopes as groundwater transits through aquifers (Garcia-Orellana et al., 2021).
The content of U and Th isotopes in aquifer solids directly determines the production rate of radium isotopes in groundwater. In aquifers with different lithology, the contents of uranium and thorium is different, and the content of uranium and thorium in igneous and metamorphic rocks is higher than that in sedimentary rocks (Ivanovich and Harmon, 1992). The dissolution and breakdown of radium-containing rocks or minerals may also contribute to the activity of radium isotopes in groundwater as it flows through aquifers. Moreover, radium isotopes in groundwater are also reduced by precipitation with oxides, sulfates, or carbonates (Beneš et al., 1984; Gonneea et al., 2008). As a radioactive element, the transit time of radium isotopes in groundwater will also affect their activity in groundwater. Different radium isotopes will decay to different degrees due to their varying half-lives. At the same time, a long water residence time is conducive to water-rock interaction, which, in turn, increases the activity of radium isotopes in groundwater.
In fresh groundwater, radium is usually adsorbed on the surface of solids. With the aggravation of salt water intrusion, the salinity and ionic strength of groundwater increase. Competitive adsorption between Ca2+, Mg2+ and other alkaline earth metal ions in addition to the major cation Na+ and radium isotope was enhanced, resulting in the weakening of the adsorption of radium isotope and the increase of desorption. Thus, radium entered the water in the form of dissolved Ra2+ (Li et al., 1977; Garcia-Orellana et al., 2021). In the mixed zone of brackish and fresh water, the water salinity in the aquifer rises continuously due to seawater backflow, which leads to an increase of radium isotope activity in the water. However, salinity is not the only factor affecting the activity of radium isotopes in groundwater. Sediment grain size, pH, temperature, Fe/Mn oxide content, and α recoil also influence the desorption amount of radium isotopes (Webster et al., 1995; Beck and Cochran, 2013).
The occurrence and mobilization of radium in aquifers are largely dependent on the adsorption/desorption at the solid-liquid interface (Vinson et al., 2013; Hao et al., 2022), which can be represented by Kd:
| $$ {{K}}_{\rm{d}}=\frac{{{A}}_{\rm{s}}}{{{A}}_{\rm{w}}}, $$ | (1) |
where Kd (m3/kg) is the radium distribution coefficient, As (Bq/kg) is the activity concentration of adsorbed radium isotopes and Aw (Bq/m3) is the activity concentration of dissolved radium isotopes.
Webster et al. (1995) deduced the desorption behavior of radium isotopes in aquifers under a water salinity gradient, the static model established can be expressed as
| $$ {{A}}_{\rm{w}}={\left({R}+\frac{{a}}{{b}{S}}\right)}^{-1}{{A}}_{0} ,$$ | (2) |
where S is the salinity, A0 (Bq/m3) is the total exchangeable radium isotope activity on the surface of particulate matter. a and b are the degree of attraction of radium isotopes and sodium ions to the sediment surface. R is the ratio of the total water volume, which can be expressed as R=n/(1−n), n is the porosity. Combining R=n/(1−n) and Eq. (2) leads to
| $$ \frac{{{A}}_{0}}{{{A}}_{\rm{w}}}-\frac{{n}}{1-{n}}=\frac{{a}}{{b}{S}}. $$ | (3) |
In this study, the mean of the measurement n is 0.3. In this case, R is approximately 0.43. The salinity range is 0.1−30, and the mean grain size of the sediments is ~63 μm, and the a/b is ~1000−14000 (Webster et al., 1995). Consequently, a/(bS)
| $$ {{A}}_{\rm{w}}=\frac{{{A}}_{0}}{{a}/{b}}{S}. $$ | (4) |
In the laboratory experiments, the redox potential, pH conditions and temperature of the leachate water were basically the same, so A0·(a/b)−1 was constant. Therefore, the activity of radium isotopes in aquifers is positively correlated with salinity.
In order to discuss the influence of salinity on radium desorption more accurately, the salinity index was replaced by Cl− concentration in this work. By comparing the relationship between Cl− and radium desorption amount (Fig. 3), it was found that there was a significant positive correlation between Cl− and radium isotope desorption amount in field groundwater samples. However, the correlation coefficient was not high (224Ra: R2=0.64, n=16, P<0.01; 226Ra: R2=0.62, n=16, P<0.01). When the concentration of Cl− was between 100−6000 mg/L, the activity of 224Ra was consistently between 6 Bq/m3 and 60 Bq/m3 (Fig. 3, the blue dashed oval). Furthermore, a phenomenon of low salinity and high radium activity appeared, possibly due to the short half-life of 224Ra and its greater susceptibility to environmental influences. The different content of uranium and thorium isotopes in the aquifer solids leads to the varying content of radium isotopes that can be desorbed on the surface of sediment grains. At the same time, the contact time between groundwater and rocks may also be different, which complicates intuitive observation of the response of radium isotopes to salinity in aquifer (Vinson et al., 2013).


Leaching experiments can explore the influence of single salinity by controlling the flow velocity (water-rock contact time) and keeping sediment sources constant. The simulated experimental salinity (Cl−) is also positively correlated with the desorption amount of the two radium isotopes, showing a better correlation (224Ra: R2=0.92, n=30, P<0.01; 226R: R2=0.82, n=30, P<0.01) (Fig. 3). Due to the increase of salinity, the ionic strength of the water body increases, and Ca2+ and Mg2+ in leaching water will hinder the adsorption of radium isotopes and promote the desorption of bonded radium isotopes on the surface of sediments through cation exchange (Li et al., 1977).
Additionally, both the desorption amount of 224Ra and its increase with salinity are higher than the corresponding 226Ra desorption amount in both field water samples and leaching water, which are related to the fast regeneration rate of 224Ra (Fig. 3). Meanwhile, Yuan et al. (2014) found that the desorption degree reached the maximum when the salinity of water body was 25. Luo et al. (2019) specifically demonstrated that the desorption activity of 224Ra reached the maximum when the salinity was ~27.8, and the desorption activity of 226Ra reached the maximum when the salinity was ~18.7. Theoretically, the desorption amount of radium isotopes cannot be continuously increased, and different sediments may lead to different salinities, corresponding to the maximum desorption amount. In this paper, the sediment samples are sufficient, and the maximum desorption amount described by previous studies does not appear.
The comparison of radium isotope content and salinity in different layers (Fig. 4) shows that the change in the trend of low salinity is different from that of high salinity. At low salinity, the positive correlation between the two is not obvious, and even the situation of high radium isotope content in low salinity occurs. This is due to the contact time (8−12 h) between the leaching water and the sediments in the experiment, which is enough for the ion exchange process of the bonded radium ions on the surface of the sediments. The time scale is broadly several minutes to several hours. However, at low salinity, the radium isotope desorption on the surface of the sediments is insufficient, and the ion exchange process is slow. The lower the flow rate, the more complete the contact between the leachating water and the sediments, results in higher desorption.
As mentioned previously, the field data and the leaching experiment data showed a significant positive correlation between the salinity and radium isotope activity. The higher the salinity, the lower the Kd value, that is, more adsorbed radium desorption into the aquifer.
The groundwater on the southern coast of Laizhou Bay mainly comes from atmospheric precipitation and rivers (Chen et al., 2021). With the infiltration of surface water into the ground, the desorption behavior of radium isotopes on the surface of solid grains commences. At the same time, in order to understand the desorption behavior of radium isotopes in groundwater recharge and runoff, it is necessary to study the amount of radium isotope desorption in each layer. The following serves to evaluate the influence of layers on the amount of radium isotope desorption.
Regardless of whether it is 224Ra or 226Ra, the desorption amount of radium isotopes in each layer follow the same trend with the salinity gradient, that is, the higher the salinity, the higher the desorption amount (Fig. 5). When the salinity was 0.1, 1, and 3, the desorption amount not significantly vary among different layers. Whereas when the salinity was higher than 10, the difference was more obvious. With the increase of salinity, the desorption amount of the aquifer (Layer 4) increased significantly, and the total desorption value of two radium isotopes in this layer was the largest.

The influence of layers was analyzed from the perspective of sediment grain size. Previous studies on the characteristics of radium isotope desorption under different grain size conditions were roughly the same (Beck and Cochran, 2013; Yuan et al., 2014; Luo et al., 2019). The salinity was selected as about 28−35, and the sediment weight was 50.0 g. After stirring for 2 h to fully desorb the radium isotopes, the supernatant was taken for radium isotope determination after standing for 1 h (Table 3). In the sample selection of this study, the 1000 g of sediment are sufficient, and six salinity gradients are set, including the salinity of 30. Although this experiment cannot fully desorb radium isotopes, it is more consistent with the field situation.
| Salinity | Grain sizes/μm | Conclusions | References |
| 35 | <63 710 | Small grain size has strong adsorption capacity and desorption is difficult. | Beck and Cochran (2013) |
| 28 | >2000, 2000−1000, 1000−500, 500−250, 250−125, <125 | The desorption capacity is higher when the average grain size is >2000 μm, the maximum when the average grain size is <125 μm, and the other four grain sizes are similar. | Yuan et al. (2014) |
| 33.9 | 0.9, 5.5, 13.6, 43.7, 76.5, 136 | The desorption capacity decreases with the increase of grain size. But, when the average grain size is 136 μm, the desorption is slightly higher than that of the previous grain size. | Luo et al. (2019) |
| 0.1, 1, 3, 10, 20, 30 | 33.43, 35.07, 40.22, 41.71, 79.88 | The sediment is abundant without complete desorption, with large grain size and large desorption capacity. | this study |
DownLoad:
CSV
In contrast to the conclusion of salinity, the previous analysis of grain size is not uniform, and there is no obvious positive correlation. From the perspective of different grain size, when the grain size is more than 2000 μm, the sediment has large pores and strong interstitial water fluidity, which is conducive to the diffusion of radium isotopes. When the grain size is 2000−150 μm, there is no significant difference in desorption capacity. When the grain size is less than 150 μm, the smaller the grain size, the larger the specific surface area, the more radium isotopes can be desorbed. However, at the same time, the smaller the space between the grains, the stronger the adsorption capacity, which is not conducive to the release of radium isotopes, the comprehensive effect between the two is different under different circumstances.
In general, the total desorption capacity of 224Ra and 226Ra in aquifers is greater than that of other aquitards, indicating that aquifers provide more groundwater and radium isotopes to coastal seawater than other aquitards. Aquifers have large sediment grain size and poor adsorption capacity, and radium isotopes are easily desorbed. Likewise, because the sediments analyzed here are abundant, the influence of more radium isotopes that can be desorbed due to the large surface area can be ignored. The four aquitards (Layers 1, 2, 3 and 5) have little difference in grain size, no significant change in desorption capacity, and the total desorption capacity is small, but it cannot be ignored (Fig. 5). As such, when understanding the source of radium isotopes in groundwater or selecting the endmembers of the SGD, the sediment layer should be taken into consideration.
In this experiment, under the condition of sufficient sediment, it is concluded that the larger the sediment grain size, the smaller the Kd value, the greater the radium desorption capacity.
Radium mobility may be affected by changes in groundwater ion concentration, as ions in water compete with radium for adsorption sites, which leads to higher radium activity (Nathwani and Phillips, 1979; Krest et al., 1999; Vinson et al., 2013). 224Ra with a short half-life in the aquifer is recharged mainly by α recoil, while 226Ra with a long half-life is recharged mainly by chemical mechanisms such as desorption (Vinson et al., 2018). In order to assess the adsorption/desorption reaction of radium isotopes, relationships between 226Ra and Na+, and other alkali earth element ions such as Mg2+, Ca2+, and Ba2+ are plotted in Fig. 6.

As seen in Figs 6a and b, 226Ra concentrations seem to correlate roughly with Ca2+ and Mg2+ concentrations (Ca: R2=0.83, n=30, P<0.01; Mg: R2=0.83, n=30, P<0.01). The concentrations of 226Ra also correlate with Na+ (R2=0.82, n=30, P<0.01) (Fig. 6c). As mentioned previously, competitive adsorption between Ca2+, Mg2+ and other alkaline earth metal ions as well as the major cation Na+ and radium isotopes was enhanced, resulting in the weakening of the adsorption of radium isotopes and the enhancement of desorption, that is, the decrease of Kd. As a result, radium enters the water in the form of dissolved Ra2+.
Barium is in the same main family as radium and is the closest divalent cation analogue to radium. The increase of Ba2+ concentration in aquifers may be consistent with the concentration of Ra2+ (Szabo et al., 2012). However, the results of this experiment show that Ba2+ and Ra2+ are negatively correlated (R2=0.30, n=12, P<0.05) (Fig. 6d). This is due to an important mechanism of Ra2+ removal, which is the co-precipitation of radium in solid solution with its chemical analogue barium in the secondary mineral barite (BaSO4) (Martin and Akber, 1999). The water sample has a high concentration of
In order to simulate the vertical flow of groundwater in the experiment, a model of increasing radium isotope activity in leaching water with increasing depth was established (Kiro et al., 2013; Liu et al., 2019). This model assumes that the radium isotopes adsorbed on the surface of solids does not change with time and that the α recoil efficiency of parent nuclides on the surface is 100%. As a dissolved ion, radium is transported with pore fluids, and its gain or loss near sediment-water interfaces can be modeled as a balance of its production, decay, advection, dispersion, and exchange with particles (Krest and Harvey, 2003). A model considering dispersion, advection, decay, production, and adsorption/desorption can be expressed as
| $$ \frac{\partial {C}}{\partial {t}}=-{v}\frac{{{\rm{d}}}{C}}{{{\rm{d}}}{z}}+{D}\frac{{\partial }^{2}{C}}{\partial {{z}}^{2}}-{{\text{λ}}}\left({K}+1\right){C}+{P},$$ | (5) |
where C (Bq/m3) is the activity of dissolved radium in leaching water; t (d) is time; v (m/d) is the average velocity of the leaching water; D (m2/d) is the dispersion coefficient; λ (1/d or 1/a) is the decay constant; K is the dimensionless adsorption partition coefficient; and P (Bq/(m3·d) or Bq/(m3·a)) is the production rate of radium isotopes by α recoil, decay of parent nuclides and in the dissolved phase, and net desorption from surface coating. P increases with depth as a function of depth z (m) (Cai et al., 2014; Liu et al., 2019).
| $$ {P}={{P}}_{0}\left(1-{\rm{e}}^{-{\beta }\frac{{z}}{{{z}}_{0}}}\right), $$ | (6) |
where P0 (Bq/(m3·d) or Bq/(m3·a)) is the production rate of radium isotopes in equilibrium state, z0 (m) is the depth where the production rate reaches 90%P (Porcelli, 2008). β is a fitting parameter.
In this paper, to improve the understanding of the ingrowth of radium isotopes in the coastal aquifer, here we have assumed the radium distribution under steady phase-averaged hydrodynamic conditions with
| $$ {v}\frac{{{\rm{d}}}{C}}{{{\rm{d}}}{z}}=-{\text{λ}}\left({K}+1\right){C}+{{P}}_{0}\left(1-{\rm{e}}^{-{\beta }\frac{{z}}{{{z}}_{0}}}\right). $$ | (7) |
The general solution of the Eq. (7) is Eq. (8). The process of solving this equation can be found in the article published by Liu et al. (2019) and its supporting information.
| $$\begin{split} {C}\left({z}\right)=&\left[{{C}}'-\frac{{{P}}_{0}}{{{\text{λ}} }\left({K}+1\right)}+\frac{{{P}}_{0}{{z}}_{0}}{{{\text{λ}} }\left({K}+1\right){{z}}_{0}-{\beta }{v}}\right]\cdot {\rm{e}}^{-\frac{{{\text{λ}} }\left({K}+1\right){z}}{{v}}}-\\ &\left[\frac{{{P}}_{0}{{z}}_{0}}{{{\text{λ}} }\left({K}+1\right){{z}}_{0}-{\beta }{v}}\right]\cdot {\rm{e}}^{-{\beta }\frac{{z}}{{{z}}_{0}}}+\frac{{{P}}_{0}}{{{\text{λ}} }\left({K}+1\right)},\end{split} $$ | (8) |
where
By definition, when z is equal to z0, P is equal to 90%P0, so β=ln (10). The decay constant λ of 224Ra is 0.19 d−1, the optimal fitting P0 value of 224Ra is 5×10³ Bq/(m3·d), and the characteristic depth z0 of 224Ra is 2.42 m (Liu et al., 2019). The decay constant λ of 226Ra is 4.3×10⁻⁴ a−1, the optimal fitting P0 value of 226Ra is 8.33 Bq/(m3·a), and the characteristic depth z0 of 226Ra is 10.8 m.
From the relationship between As, A0 and Aw (
| $$ {{K}}_{\rm{d}}=\dfrac{{{A}}_{\rm{s}}}{{{A}}_{\rm{w}}}=\dfrac{{{A}}_{0}-\dfrac{{n}}{1-{n}}{{A}}_{\rm{w}}}{{A}_{{\rm{w}}}} .$$ | (9) |
Combining Eq. (3) and Eq. (9) leads to
| $$ {{K}}_{\rm{d}}=\frac{{a}}{{b}{S}}. $$ | (10) |
In order to minimize the particle concentration effect, a dimensionless K value is introduced (Beck and Cochran, 2013; Hao et al., 2022). Its definition is
| $$ {K}={{K}}_{\rm{d}}\frac{{\rho }}{{R}}=\frac{{a}}{{b}{S}}\cdot \frac{{\rho }}{{R}}, $$ | (11) |
where ρ (g/cm3) is the dry bulk mass density of the sediment; and the other parameters are mentioned in Eq. (2).
In Eq. (8), the value of K has an important influence on the simulation results, and radium isotopes are very sensitive to the dimensionless adsorption partition coefficient K. According to Eqs (8) and (11), the reactive transport model diagram was obtained, and the corresponding K value of the water sample was calculated.
The simulation of the activities of 224Ra and 226Ra at different layers with K value is shown in Fig. 7. The general trend demonstrates that with the increase in salinity, the K value decreases, and the activities of 224Ra and 226Ra increases. The measured data are evenly distributed on both sides of the model, indicating that the model successfully simulated the transport of radium isotopes in aquifers with variation in salinity. However, as many factors affect radium isotope activity in the field aquifer, the fitting effect of field data is not as accurate as that of laboratory experiment. Meanwhile, the fitting results of 224Ra are better than those of 226Ra, regardless of whether the data are from the field or leaching experiments.

The sediment samples from the Core WF80 on the southern coast of Laizhou Bay were selected for the leaching experiment, and the groundwater sampling test was carried out on the perpendicular coastline. The leaching experiment and the field data were compared to discuss the adsorption/desorption behaviors of 224Ra and 226Ra in solid-liquid phase under the control of water salinity gradients and aquifer layer depth. The transport mechanism of ion and radium isotope exchange was analyzed. The results exhibited that: (1) Both the field data and the leaching experiment data showed a significant positive correlation between the salinity and radium isotope activity, and the correlation was higher in the leaching experiment. (2) It is necessary to research the radium isotope desorption amount of each aquifer layer, as desorption varies significantly by layer. The total desorption amount of 224Ra and 226Ra in the aquifer is greater than that of other aquitards. When the sediments are abundant, that is, the larger the sediment size is, the larger the desorption amount will be. (3) There was a significant positive correlation between Na+, Ca2+, Mg2+, and radium isotope desorption (Na: R2=0.82; Ca: R2=0.83; Mg: R2=0.83). There was a negative correlation between Ba2+ and radium isotope desorption (R2=0.30). (4) Taking 224Ra and 226Ra as examples, a 1-D vertical reaction transport model of radium isotope was established, which successfully simulated the transport process of radium isotope with salinity changes in aquifer. The calculated values of the model are in agreement with the measured values of the leaching experiment and the field.
This study comprehensively describes the desorption and diffusion characteristics of radium isotopes in sediments, establishes a basis for better understanding of the geochemical behavior of radium isotopes in aquifers, and provides important information for the selection of representative groundwater endmember in SGD estimation.
Acknowledgements: We thank the basic data provided by Observation and Research Station of Seawater Intrusion and Soil Salinization through the First Institute of Oceanography, Ministry of Natural Resources.|
Beck A J, Cochran M A. 2013. Controls on solid-solution partitioning of radium in saturated marine sands. Marine Chemistry, 156: 38–48. doi: 10.1016/j.marchem.2013.01.008
|
|
Beck A J, Rapaglia J P, Cochran J K, et al. 2007. Radium mass-balance in Jamaica Bay, NY: Evidence for a substantial flux of submarine groundwater. Marine Chemistry, 106(3–4): 419–441
|
|
Beneš P, Strejc P, Lukavec Z. 1984. Interaction of radium with freshwater sediments and their mineral components. I. Ferric hydroxide and quartz. Journal of Radioanalytical and Nuclear Chemistry, 82(2): 275–285. doi: 10.1007/BF02037050
|
|
Burnett W C, Bokuniewicz H, Huettel M, et al. 2003. Groundwater and pore water inputs to the coastal zone. Biogeochemistry, 66(1–2): 3–33
|
|
Burnett W C, Taniguchi M, Oberdorfer J. 2001. Measurement and significance of the direct discharge of groundwater into the coastal zone. Journal of Sea Research, 46(2): 109–116. doi: 10.1016/S1385-1101(01)00075-2
|
|
Cai Pinghe, Shi Xiangming, Moore W S, et al. 2014. 224Ra: 228Th disequilibrium in coastal sediments: Implications for solute transfer across the sediment–water interface. Geochimica et Cosmochimica Acta, 125: 68–84. doi: 10.1016/j.gca.2013.09.029
|
|
Charette M A, Lam P J, Lohan M C, et al. 2016. Coastal ocean and shelf-sea biogeochemical cycling of trace elements and isotopes: lessons learned from GEOTRACES. Philosophical Transactions of the Royal Society A: Mathematical, Physical and Engineering Sciences, 374(2081): 20160076
|
|
Charette M A, Moore W S, Burnett W C. 2008. Uranium-and thorium-series nuclides as tracers of submarine groundwater discharge. Radioactivity in the Environment, 13: 155–191
|
|
Chen Guangquan, Xiong Guiyao, Lin Jin, et al. 2021. Elucidating the pollution sources and groundwater evolution in typical seawater intrusion areas using hydrochemical and environmental stable isotope technique: A case study for Shandong Province, China. Lithosphere, 2021: 4227303. doi: 10.2113/2021/4227303
|
|
Cho H M, Kim G. 2016. Determining groundwater Ra end-member values for the estimation of the magnitude of submarine groundwater discharge using Ra isotope tracers. Geophysical Research Letters, 43(8): 3865–3871. doi: 10.1002/2016GL068805
|
|
Diego-Feliu M, Rodellas V, Saaltink M W, et al. 2021. New perspectives on the use of 224Ra/228Ra and 222Rn/226Ra activity ratios in groundwater studies. Journal of Hydrology, 596: 126043. doi: 10.1016/j.jhydrol.2021.126043
|
|
Garcia-Orellana J, Rodellas V, Tamborski J, et al. 2021. Radium isotopes as submarine groundwater discharge (SGD) tracers: Review and recommendations. Earth-Science Reviews, 220: 103681. doi: 10.1016/j.earscirev.2021.103681
|
|
Gonneea M E, Morris P J, Dulaiova H, et al. 2008. New perspectives on radium behavior within a subterranean estuary. Marine Chemistry, 109(3–4): 250–267
|
|
Gonneea M E, Mulligan A E, Charette M A. 2013. Seasonal cycles in radium and barium within a subterranean estuary: Implications for groundwater derived chemical fluxes to surface waters. Geochimica et Cosmochimica Acta, 119: 164–177. doi: 10.1016/j.gca.2013.05.034
|
|
Hao Xin, Yi Lixin, Li Luxuan, et al. 2022. Distribution coefficient of Ra in groundwater and its determination technique. Geoscience (in Chinese), 36(2): 552–562
|
|
Ivanovich M, Harmon R S. 1992. Uranium-Series Disequilibrium: Applications to Earth, Marine, and Environmental Sciences. 2nd ed. Oxford: Clarendon Press; Oxford, New York: Oxford University Press
|
|
Kim G, Ryu J W, Yang H S, et al. 2005. Submarine groundwater discharge (SGD) into the Yellow Sea revealed by 228Ra and 226Ra isotopes: Implications for global silicate fluxes. Earth and Planetary Science Letters, 237(1–2): 156–166
|
|
Kiro Y, Weinstein Y, Starinsky A, et al. 2013. Groundwater ages and reaction rates during seawater circulation in the Dead Sea aquifer. Geochimica et Cosmochimica Acta, 122: 17–35. doi: 10.1016/j.gca.2013.08.005
|
|
Knauss K G, Ku T L, Moore W S. 1978. Radium and thorium isotopes in the surface waters of the East Pacific and coastal Southern California. Earth and Planetary Science Letters, 39(2): 235–249. doi: 10.1016/0012-821X(78)90199-1
|
|
Krest J M, Harvey J W. 2003. Using natural distributions of short-lived radium isotopes to quantify groundwater discharge and recharge. Limnology and Oceanography, 48(1): 290–298. doi: 10.4319/lo.2003.48.1.0290
|
|
Krest J M, Moore W S, Rama. 1999. 226Ra and 228Ra in the mixing zones of the Mississippi and Atchafalaya rivers: indicators of groundwater input. Marine Chemistry, 64(3): 129–152. doi: 10.1016/S0304-4203(98)00070-X
|
|
Krishnaswami S, Graustein W C, Turekian K K, et al. 1982. Radium, thorium and radioactive lead isotopes in groundwaters: Application to the in situ determination of adsorption-desorption rate constants and retardation factors. Water Resources Research, 18(6): 1663–1675. doi: 10.1029/WR018i006p01663
|
|
Li Yuanhui, Mathieu G, Biscaye P, et al. 1977. The flux of 226Ra from estuarine and continental shelf sediments. Earth and Planetary Science Letters, 37(2): 237–241. doi: 10.1016/0012-821X(77)90168-6
|
|
Liu Yi, Jiao J J, Mao Rong, et al. 2019. Spatial characteristics reveal the reactive transport of radium isotopes (224Ra, 223Ra, and 228Ra) in an intertidal aquifer. Water Resources Research, 55(12): 10282–10302. doi: 10.1029/2019WR024849
|
|
Luo Xin, Jiao J J, Moore W S, et al. 2018. Significant chemical fluxes from natural terrestrial groundwater rival anthropogenic and fluvial input in a large-river deltaic estuary. Water Research, 144: 603–615. doi: 10.1016/j.watres.2018.07.004
|
|
Luo Hao, Li Linwei, Wang Jinlong, et al. 2019. The desorption of radium isotopes in river sediments in Qinzhou Bay. Haiyang Xuebao (in Chinese), 41(4): 27–41
|
|
Martin P, Akber R A. 1999. Radium isotopes as indicators of adsorption–desorption interactions and barite formation in groundwater. Journal of Environmental Radioactivity, 46(3): 271–286. doi: 10.1016/S0265-931X(98)00147-7
|
|
Moore W S. 1996. Large groundwater inputs to coastal waters revealed by 226Ra enrichments. Nature, 380(6575): 612–614. doi: 10.1038/380612a0
|
|
Moore W S. 2000. Ages of continental shelf waters determined from 223Ra and 224Ra. Journal of Geophysical Research: Oceans, 105(C9): 22117–22122. doi: 10.1029/1999JC000289
|
|
Moore W S. 2008. Fifteen years experience in measuring 224Ra and 223Ra by delayed-coincidence counting. Marine Chemistry, 109(3–4): 188–197
|
|
Moore W S, Arnold R. 1996. Measurement of 223Ra and 224Ra in coastal waters using a delayed coincidence counter. Journal of Geophysical Research: Oceans, 101(C1): 1321–1329. doi: 10.1029/95JC03139
|
|
Moore W S, Astwood H, Lindstrom C. 1995. Radium isotopes in coastal waters on the Amazon shelf. Geochimica et Cosmochimica Acta, 59(20): 4285–4298. doi: 10.1016/0016-7037(95)00242-R
|
|
Nathwani J S, Phillips C R. 1979. Adsorption of 226Ra by soils in the presence of Ca2+ ions. Specific adsorption (II). Chemosphere, 8(5): 293–299. doi: 10.1016/0045-6535(79)90112-7
|
|
Porcelli D. 2008. Investigating groundwater processes using U- and Th-series nuclides. Radioactivity in the Environment, 13: 105–153
|
|
Rodellas V, Garcia-Orellana J, Masqué P, et al. 2015. Submarine groundwater discharge as a major source of nutrients to the Mediterranean Sea. Proceedings of the National Academy of Sciences of the United States of America, 112(13): 3926–3930. doi: 10.1073/pnas.1419049112
|
|
Santos I R, Chen Xiaogang, Lecher A L, et al. 2021. Submarine groundwater discharge impacts on coastal nutrient biogeochemistry. Nature Reviews Earth & Environment, 2(5): 307–323
|
|
Swarzenski P W, Baskaran M, Rosenbauer R J, et al. 2013. A combined radio- and stable-isotopic study of a California coastal aquifer system. Water, 5(2): 480–504. doi: 10.3390/w5020480
|
|
Szabo Z, dePaul V T, Fischer J M, et al. 2012. Occurrence and geochemistry of radium in water from principal drinking-water aquifer systems of the United States. Applied Geochemistry, 27(3): 729–752. doi: 10.1016/j.apgeochem.2011.11.002
|
|
Tomasky-Holmes G, Valiela I, Charette M A. 2013. Determination of water mass ages using radium isotopes as tracers: implications for phytoplankton dynamics in estuaries. Marine Chemistry, 156: 18–26. doi: 10.1016/j.marchem.2013.02.002
|
|
Vinson D S, Lundy J R, Dwyer G S, et al. 2018. Radium isotope response to aquifer storage and recovery in a sandstone aquifer. Applied Geochemistry, 91: 54–63. doi: 10.1016/j.apgeochem.2018.01.006
|
|
Vinson D S, Tagma T, Bouchaou L, et al. 2013. Occurrence and mobilization of radium in fresh to saline coastal groundwater inferred from geochemical and isotopic tracers (Sr, S, O, H, Ra, Rn). Applied Geochemistry, 38: 161–175. doi: 10.1016/j.apgeochem.2013.09.004
|
|
Wang Qidong, Song Jinming, Li Xuegang, et al. 2015. Environmental radionuclides in a coastal wetland of the southern Laizhou Bay, China. Marine Pollution Bulletin, 97(1–2): 506–511
|
|
Webster I T, Hancock G J, Murray A S. 1995. Modelling the effect of salinity on radium desorption from sediments. Geochimica et Cosmochimica Acta, 59(12): 2469–2476. doi: 10.1016/0016-7037(95)00141-7
|
|
Xia Dong, Mi Tiezhu, Zhen Yu, et al. 2016. Simulating the process of radium desorption from coastal aquifer sediments by seawater. Marine Environmental Science (in Chinese), 35(1): 63–67
|
|
Xu Bochao. 2008. Study of the chronology of aquifer strata and the geochemical behavior of uranium of the underground brine along the southern coast of Laizhou Bay (in Chinese) [dissertation]. Qingdao: Ocean University of China
|
|
Yuan Xiaojie, Guo Zhanrong, Liu Jie, et al. 2014. Characteristics of radium desorption from sediments in the salt water environment. Acta Geoscientica Sinica (in Chinese), 35(5): 582–588
|
|
Zhang Yongxiang, Xue Yuqun, Chen Honghan. 1996. Deposit seawater characteristics in the Strata and its formation environment in the south coastal plain of Laizhou Bay since late Pleistocene. Haiyang Xuebao (in Chinese), 18(6): 61–68
|


Figures(7) / Tables(3)

Supported by:
Beijing Renhe Information Technology Co. Ltd


| Salinity | Layer 1 | Layer 2 | Layer 3 | Layer 4 | Layer 5 | Mean value | |||||||||||
| 224Ra | 226Ra | 224Ra | 226Ra | 224Ra | 226Ra | 224Ra | 226Ra | 224Ra | 226Ra | 224Ra | 226Ra | ||||||
| 0.1 | 3.62 | 2.35 | 1.37 | 1.77 | 26.66 | 2.61 | 2.32 | 2.32 | 3.66 | 2.13 | 7.53 | 2.23 | |||||
| 1 | 13.16 | 5.13 | 7.24 | 3.22 | 6.38 | 3.49 | 24.06 | 4.26 | 8.30 | 4.10 | 11.83 | 4.04 | |||||
| 3 | 47.32 | 16.81 | 26.13 | 9.65 | 30.60 | 10.27 | 32.32 | 12.78 | 27.96 | 6.20 | 32.86 | 11.14 | |||||
| 10 | 115.70 | 43.14 | 102.94 | 35.23 | 100.79 | 33.97 | 109.30 | 38.61 | 99.41 | 17.33 | 105.63 | 33.65 | |||||
| 20 | 134.86 | 35.52 | 148.89 | 49.47 | 187.97 | 44.14 | 209.91 | 54.63 | 203.91 | 35.39 | 177.11 | 43.83 | |||||
| 30 | 179.74 | 42.81 | 173.68 | 55.10 | 224.72 | 49.32 | 270.24 | 74.99 | 245.86 | 40.06 | 218.85 | 52.46 | |||||
DownLoad:
CSV
| Sample code | Latitude | Longitude | Salinity | Group type | 224Ra/ (Bq·m−3) | 226Ra/ (Bq·m−3) |
| YW1-1 | 36.926°N | 119.156°E | 10.6 | 4 | 60.10 | 1.15 |
| YW1-2 | 36.907°N | 119.154°E | 9.9 | 4 | 54.28 | 8.93 |
| YW1-3 | 36.895°N | 119.156°E | 4.3 | 3 | 11.11 | 5.72 |
| YW1-4 | 36.872°N | 119.156°E | 0.4 | 1 | 8.26 | 6.68 |
| YW1-5 | 36.859°N | 119.157°E | 0.5 | 1 | 11.17 | 5.67 |
| YW1-6 | 36.830°N | 119.158°E | 0.4 | 1 | 12.43 | 1.30 |
| YW1-7 | 36.815°N | 119.158°E | 0.4 | 1 | 9.77 | 1.51 |
| YW1-8 | 36.808°N | 119.164°E | 1.2 | 2 | 12.54 | 1.34 |
| YW2-1 | 37.045°N | 119.477°E | 26.1 | 5 | 403.60 | 36.40 |
| YW2-2 | 36.983°N | 119.469°E | 14.9 | 4 | 578.51 | 13.92 |
| YW2-3 | 36.948°N | 119.470°E | 4.9 | 3 | 31.08 | 6.32 |
| YW2-4 | 36.930°N | 119.470°E | 13.0 | 4 | 228.03 | 3.01 |
| YW2-5 | 36.910°N | 119.469°E | 1.1 | 2 | 43.67 | 6.64 |
| YW2-6 | 36.885°N | 119.469°E | 0.2 | 1 | 8.59 | 2.06 |
| YW2-7 | 36.874°N | 119.458°E | 0.3 | 1 | 14.85 | 2.87 |
| YW2-8 | 36.802°N | 119.470°E | 0.2 | 1 | 13.71 | 3.78 |
DownLoad:
CSV
| Salinity | Grain sizes/μm | Conclusions | References |
| 35 | <63 710 | Small grain size has strong adsorption capacity and desorption is difficult. | Beck and Cochran (2013) |
| 28 | >2000, 2000−1000, 1000−500, 500−250, 250−125, <125 | The desorption capacity is higher when the average grain size is >2000 μm, the maximum when the average grain size is <125 μm, and the other four grain sizes are similar. | Yuan et al. (2014) |
| 33.9 | 0.9, 5.5, 13.6, 43.7, 76.5, 136 | The desorption capacity decreases with the increase of grain size. But, when the average grain size is 136 μm, the desorption is slightly higher than that of the previous grain size. | Luo et al. (2019) |
| 0.1, 1, 3, 10, 20, 30 | 33.43, 35.07, 40.22, 41.71, 79.88 | The sediment is abundant without complete desorption, with large grain size and large desorption capacity. | this study |
DownLoad:
CSV
| Salinity | Layer 1 | Layer 2 | Layer 3 | Layer 4 | Layer 5 | Mean value | |||||||||||
| 224Ra | 226Ra | 224Ra | 226Ra | 224Ra | 226Ra | 224Ra | 226Ra | 224Ra | 226Ra | 224Ra | 226Ra | ||||||
| 0.1 | 3.62 | 2.35 | 1.37 | 1.77 | 26.66 | 2.61 | 2.32 | 2.32 | 3.66 | 2.13 | 7.53 | 2.23 | |||||
| 1 | 13.16 | 5.13 | 7.24 | 3.22 | 6.38 | 3.49 | 24.06 | 4.26 | 8.30 | 4.10 | 11.83 | 4.04 | |||||
| 3 | 47.32 | 16.81 | 26.13 | 9.65 | 30.60 | 10.27 | 32.32 | 12.78 | 27.96 | 6.20 | 32.86 | 11.14 | |||||
| 10 | 115.70 | 43.14 | 102.94 | 35.23 | 100.79 | 33.97 | 109.30 | 38.61 | 99.41 | 17.33 | 105.63 | 33.65 | |||||
| 20 | 134.86 | 35.52 | 148.89 | 49.47 | 187.97 | 44.14 | 209.91 | 54.63 | 203.91 | 35.39 | 177.11 | 43.83 | |||||
| 30 | 179.74 | 42.81 | 173.68 | 55.10 | 224.72 | 49.32 | 270.24 | 74.99 | 245.86 | 40.06 | 218.85 | 52.46 | |||||
| Sample code | Latitude | Longitude | Salinity | Group type | 224Ra/ (Bq·m−3) | 226Ra/ (Bq·m−3) |
| YW1-1 | 36.926°N | 119.156°E | 10.6 | 4 | 60.10 | 1.15 |
| YW1-2 | 36.907°N | 119.154°E | 9.9 | 4 | 54.28 | 8.93 |
| YW1-3 | 36.895°N | 119.156°E | 4.3 | 3 | 11.11 | 5.72 |
| YW1-4 | 36.872°N | 119.156°E | 0.4 | 1 | 8.26 | 6.68 |
| YW1-5 | 36.859°N | 119.157°E | 0.5 | 1 | 11.17 | 5.67 |
| YW1-6 | 36.830°N | 119.158°E | 0.4 | 1 | 12.43 | 1.30 |
| YW1-7 | 36.815°N | 119.158°E | 0.4 | 1 | 9.77 | 1.51 |
| YW1-8 | 36.808°N | 119.164°E | 1.2 | 2 | 12.54 | 1.34 |
| YW2-1 | 37.045°N | 119.477°E | 26.1 | 5 | 403.60 | 36.40 |
| YW2-2 | 36.983°N | 119.469°E | 14.9 | 4 | 578.51 | 13.92 |
| YW2-3 | 36.948°N | 119.470°E | 4.9 | 3 | 31.08 | 6.32 |
| YW2-4 | 36.930°N | 119.470°E | 13.0 | 4 | 228.03 | 3.01 |
| YW2-5 | 36.910°N | 119.469°E | 1.1 | 2 | 43.67 | 6.64 |
| YW2-6 | 36.885°N | 119.469°E | 0.2 | 1 | 8.59 | 2.06 |
| YW2-7 | 36.874°N | 119.458°E | 0.3 | 1 | 14.85 | 2.87 |
| YW2-8 | 36.802°N | 119.470°E | 0.2 | 1 | 13.71 | 3.78 |
| Salinity | Grain sizes/μm | Conclusions | References |
| 35 | <63 710 | Small grain size has strong adsorption capacity and desorption is difficult. | Beck and Cochran (2013) |
| 28 | >2000, 2000−1000, 1000−500, 500−250, 250−125, <125 | The desorption capacity is higher when the average grain size is >2000 μm, the maximum when the average grain size is <125 μm, and the other four grain sizes are similar. | Yuan et al. (2014) |
| 33.9 | 0.9, 5.5, 13.6, 43.7, 76.5, 136 | The desorption capacity decreases with the increase of grain size. But, when the average grain size is 136 μm, the desorption is slightly higher than that of the previous grain size. | Luo et al. (2019) |
| 0.1, 1, 3, 10, 20, 30 | 33.43, 35.07, 40.22, 41.71, 79.88 | The sediment is abundant without complete desorption, with large grain size and large desorption capacity. | this study |
 DownLoad:


 DownLoad: