
Figure
1.
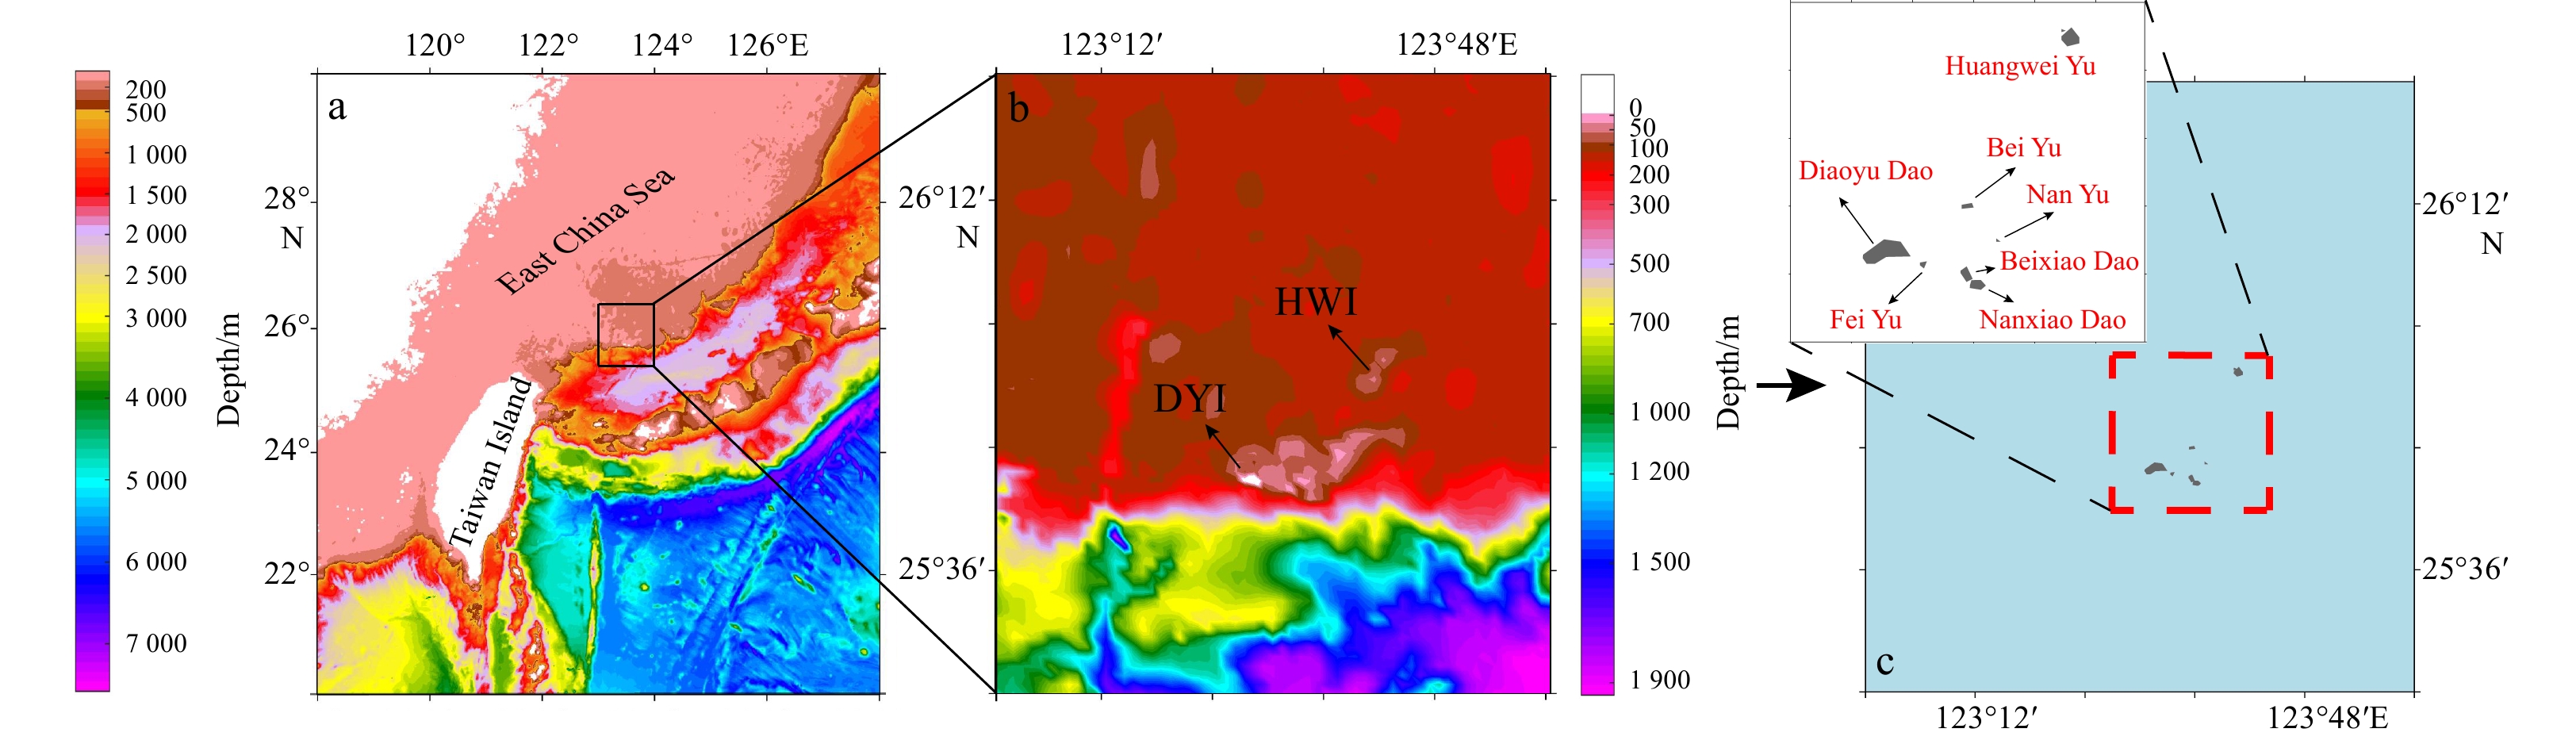
Location of Diaoyu Dao and its affiliated islands (a, c), and the topography of this study area (b). “DYI” in b is the abbreviation of Diaoyu Dao, “HWI” in b is Huangwei Yu.
| Citation: | Lina Cai, Xiaoqi Jiang, Xiaojun Yan, Yan Bai, Jianqiang Liu, Menghan Yu, Rong Tang, Jingjing Jiang. Study of coexisting upstream solitary wave packet and downstream wakes induced by Diaoyu Dao and its affiliated islands detected by satellite sun glitter[J]. Acta Oceanologica Sinica, 2023, 42(4): 1-15. doi: 10.1007/s13131-022-2099-9

|
Currents interacting with islands can induce water dynamic changes, including island wakes, island-induced ocean vortex train (IOVT) (Dong and McWilliams, 2007; Larock, 1996) and other phenomena. These types of small-scale or mesoscale ocean phenomena in the path of ocean currents may cause the change of physical and biological phenomena downstream (Caldeira et al., 2002, 2005; Arístegui et al., 1994).
Prior studies mainly focused on the downstream currents, the case in upstream of islands received much less attention (Qin et al., 2019). Governing parameters of the characteristic of an island wake are mainly the prevailing water velocity, the water depth, and the island shape (Dong and McWilliams, 2007; Wolanski and Hamner, 1988). The “island wake parameter” effective Reynolds number is a non-dimensional parameter controlling the flow separation and eddy shedding that can be used to distinguish different flow regimes (Wolanski et al., 1984; Lamura and Gompper, 2002). With an increasing Reynolds number, vortices downstream island appear as periodic oscillation, shedding of standing eddies which is referred to as a von Karman vortex street (Pattiaratchi et al., 1987). The island shape as well as the depth of sea has a great influence on the oceanic current wakes (Hamner and Hauri, 1981). The island shape shows a strong controlling influence on wake retention (Coutis and Middleton, 2002), while the shallow water around Island leads to a strong reduction of the intensity the vortex street (Teinturier et al., 2010). However, the analysis of the upstream characteristics is relatively lacking.
Sun glitter (SG), a direct solar reflection from the sea surface at certain geometric imaging angles (Cox and Munk, 1954; Kay et al., 2009, 2013), happens when single scattering predominates (Morel and Gentili, 1996). SG is usually considered as an image noise for the super-saturation that leads to serious data losses (Zhang and Wang, 2010; Kay et al., 2013). A large number of SG removal methods are proposed for multi-spectral images (Wang et al., 2018a; Bernardo et al., 2018). Ocean color sensors are also usually designed to tilt up to 20° from nadir to minimize SG (Caldeira et al., 2002), like Sea-Viewing Wide Field-of-View Sensor (SeaWiFS), Ocean Color and Temperature Scanner (OCTS) and Coastal Zone Color Scanner (CZCS) (Wang and Bailey, 2001; Wang et al., 2002; Gordon and Wang, 1992). However, high-resolution sensors such as IKONOS and Quickbird as well as Gaofen-1 (GF-1) and Gaofen-6 (GF-6) are useful for coastal and reef studies (Kutser et al., 2009; Lyzenga et al., 2006; Hochberg et al., 2003), and their missions are primarily targeted for land observation that do not have a tilting capability to avoid SG (Kay et al., 2009). Therefore, SG is obvious in these high resolution images such as GF-1 and GF-6 Panchromatic and Multispectral Sensors (PMS) images with the resolution of 2 m.
SG is a strong function of the sea surface roughness (SSR) (Cox and Munk, 1954), and the texture and intensity of SG depend on the sun zenith angle, viewing angle and the probability distribution of the slopes of the reflecting facets on the ocean surface (Wang et al., 2019b; Jackson and Alpers, 2010; Zhang and Wang, 2010). Vorticity or strain creates anisotropic SSR anomalies and suppresses the strong glint signatures in these otherwise calm waters (Rascle et al., 2017). Not only fine-scale slope at the ocean surface can be observed by SSR (Fu and Holt, 1983; Alpers, 1985; Yoder et al., 1994), but also the class of eddy with different physical properties can be varied (Caldeira et al., 2005). Therefore, it is the apparent character instead of inherent optical character that has been used to observe ocean internal waves (Matthews, 2005; Jackson and Alpers, 2010), oil slick (Jackson and Alpers, 2010; Lu et al., 2016), underwater topography (Yang et al., 2015) from the sea surface texture and roughness information retrieved from SG.
The current interacting with island, induces the change of water dynamic factors, impacts the slopes of the reflecting facets on the ocean surface leading to the change of SG (Wang et al., 2019b; Jackson and Alpers, 2010; Zhang and Wang, 2010), and induces sea surface texture and tone change in local areas. Existing methods for textural image classification could be mainly divided into four categories: statistical, structural, model-based, and transform-based methods (Sun et al., 2011; Materka and Strzelecki, 1998). The most common method for texture analysis in satellite image is gray level co-occurrence matrix (GLCM) (Haralick et al., 1973), which has also been used in GF-1 panchromatic band to extract the texture information (Shabat and Tapamo, 2017; Haralick, 1979; Gonzalez and Woods, 1981; Carr and de Miranda, 1998). For texture information extraction based on filter, the applied filter window size as well as convolution kernel for texture feature extraction is crucial (Puissant et al., 2005; Chen et al., 2020). The median filter is inclined to the loss of information in sharp image that may ignore small scale current (Vassiliou et al., 1988). There exists inapplicability in the above methods for extracting the roughness information of the sea surface.
Kuroshio dominates in the Diaoyu Dao and its affiliated islands area, which is a western boundary current in the North Pacific. The Kuroshio originates from the North Equatorial Current and flows northward from the east of Philippines to the south of Japan (Hsu et al., 2017), and it can be identified by higher surface temperatures and stronger current vectors (Chang et al., 2019). As the entrance of the Kuroshio invading the East China Sea shelf (Kondo, 1985), the sea area around Diaoyu Dao and its affiliated islands is rich in wind energy, wave energy (Zheng et al., 2014), and fishery resources (Yu et al., 2004).
In the past, however, few studies focused on the influence of Diaoyu Dao and its affiliated islands on marine environment. It is of great significance to study the influence of Diaoyu Dao and its affiliated islands on the surrounding water for the development and protection of Diaoyu Dao and its affiliated islands and its surrounding waters. In this study, the GF-1 and GF-6 PMS data were applied to analyze the influence of Diaoyu Dao and its affiliated islands on surrounding water environment. In addition, Landsat-8 Thermal Infrared Sensor (TIR) and HY1-C Coastal Zone Imager (CZI) observations were also applied as complement to describe the change of the temperature and chlorophyll a (Chl a) induced by the Diaoyu Dao and its affiliated islands as a secondary proof.
The structure of this article is as follows. Section 2 is an introduction to the data and methods. Section 3 describes changes of current, sea surface temperature (SST) and Chl a distributions induced by the Diaoyu Dao and its affiliated islands. Sections 4 and 5 are the discussion and conclusion, respectively.
The Diaoyu Dao and its affiliated islands (25°24'−26°24'N, 123°00'−124°00'E) include Diaoyu Dao with an area of 3.91 km2, Huangwei Yu with an area of 0.91 km2, Fei Yu with an area of 100 m2, Beixiao Dao and Nanxiao Dao with a gap of 150 m long, 200 m wide and 10 m deep, Bei Yu and Nan Yu (Fig. 1c). Located at the continental shelf in East China Sea (Fig. 1a), the topography of Diaoyu Dao and its affiliated islands area is high in the west and low in the east, and there are sporadic seamounts, ocean basins and trenches that all within a depth of 300 m (Fig. 1b). The Diaoyu Dao is 3.6 km in length from east to west, 1.9 km in width from north to south, locating on an east-west olive shaped platform with high terrain around and low lying in the middle (Fig. 1b) with the highest altitude of 362 m. Huangwei Yu (Fig. 1b) is located in the middle of the sea plateau in a good conical shape with about 1.2 km long and 1.1 km wide, and its highest altitude is about 117 m.
GF-6 and GF-1, launched in 2018 and 2013 respectively in China, are both high-resolution optical satellites transiting at around 10:30 a.m. for earth observation, and carrying PMS with a width of 90 km and a width of 60 km field view, respectively (Zhou et al., 2017; Liu et al., 2020). GF-1/6 satellite data were provided by National Satellite Ocean Application Service, Ministry of Natural Resources of the People Republic of China, obtained from the website:
| Sensor | Band | Wavelength/μm | Resolution/m | Date |
| GF-6PMS | Band1 (blue) | 0.45−0.52 | 8 | Sept. 8, 2019 |
| Band2 (green) | 0.52−0.60 | 8 | Sept. 8, 2019 | |
| Band3 (red) | 0.63−0.69 | 8 | Sept. 8, 2019 | |
| Band4 (NIR) | 0.76−0.90 | 8 | Sept. 8, 2019 | |
| PAN | 0.45−0.90 | 2 | Sept. 8, 2019 | |
| GF-1PMS1/PMS2 | Band1 (blue) | 0.45−0.52 | 8 | Aug. 25, 2016 |
| Band2 (green) | 0.52−0.59 | 8 | Aug. 25, 2016 | |
| Band3 (red) | 0.63−0.69 | 8 | Aug. 25, 2016 | |
| Band4 (NIR) | 0.77−0.89 | 2 | Jul. 31, 2019 | |
| PAN | 0.45−0.90 | 2 | Jul. 31, 2019 | |
| Landsat-8 TIRS | 100 | Jul. 17, 2014 | ||
| Band10 (TIR) | 10.60−11.19 | 100 | Aug. 10, 2017 | |
| 10.60−11.19 | 100 | Jun. 26, 2018 | ||
| Band11 (TIR) | 11.50−12.51 | 100 | Jul. 28, 2018 | |
| 11.50−12.51 | 100 | Dec. 3, 2018 | ||
| HY-1CCZI | Band1 | 0.421−0.500 | 50 | Oct. 3, 2020 |
| Band2 | 0.517−0.598 | 50 | Oct. 3, 2020 | |
| Band3 | 0.608−0.690 | 50 | Oct. 3, 2020 | |
| Band4 | 0.761−0.891 | 50 | Oct. 3, 2020 | |
| Note: PMS, Panchromatic and Multispectral Sensors; TIRS, Thermal Infrared Sensor; CZI, Coastal Zone Imager; NIR, near-infrared; PAN, panchromatic band. | ||||
 DownLoad:
CSV
DownLoad:
CSV
Ocean current was analyzed using the data obtained from Global Ocean Forecasting System (GOFS) 3.1 (
| Data introduction | Data acquisition time |
| Seasonal variation | summer: Jul. 2014; autumn: Oct. 2014; winter: Jan. 2015; spring: Apr. 2015 |
| Inter-annual variation | Aug. 2012; Aug. 2013; Aug. 2014; Aug. 2015 |
DownLoad:
CSV
The monthly average statistic for wind field of 10 m above sea was obtained using the data with spatial resolution of 0.25° and time resolution of three hours (
Satellite data pre-procession, including radiometric calibration, atmospheric correction and ortho-rectification, was performed to eliminate the influence of inaccuracy from atmosphere and systematic error (Ren et al., 2018). Radiation calibration is the process of converting the digital number of the satellite images into a physical quantity such as radiance and reflectance (Gordon, 1997; Peng and Zhang, 2019). To get ground elevation of images for atmospheric correction, the Global Multi-resolution Terrain Elevation Data (GMTED) 2010, which can be found on United States Geological Survey’s website (
In addition, ortho-rectification can correct the spatial and geometrical distortion precisely for images with the resolution less than or equal to 15 m, was utilized in PMS image correction (Wu and Ma, 2020; Peng and Zhang, 2019). Finally, the Gram–Schmidt transformation, which preserves the spectral characteristics of the low spatial resolution data, was applied to fuse the two processed PMS images into a multispectral image with 2 m resolution (Wang et al., 2018b; Aiazzi et al., 2009; Ehlers, 2008).
The current interacting with island influences the local area SG (Wang et al., 2019b; Jackson and Alpers, 2010; Zhang and Wang, 2010), inducing sea surface texture and tone change in local areas. Texture, carrying fundamental characteristics of the appearance of all natural surface, is a key cue employed in visual interpretation (Roy et al., 2018; Chen et al., 2020). It is an intricate visual pattern comprising of sub-patterns or entities which contains attributes such as color, brightness, size, slope, etc. (Marceau et al., 1990; Aghav and Narkhede, 2017). Based on high spatial resolution satellite GF-6 PMS data, a new method for extracting Shield and Vortex (SAV, including SAV1 and SAV2) was proposed. The formulas were as follows:
| $$ \mathrm{SAV}1=\mathrm{Directiona}{\mathrm{l}}_{\mathrm{angle}140^{\circ}}-10\times \left(\mathrm{H}\mathrm{i}\mathrm{g}\mathrm{h}{\text{-}}\mathrm{p}\mathrm{a}\mathrm{s}\mathrm{s}\mathrm{ }\mathrm{F}\mathrm{F}\mathrm{T}\right), $$ | (1) |
where SAV1 is the sea surface texture characteristics of Diaoyu Dao, Beixiao Dao and Nanxiao Dao (Fig. 2). Directional-filter angle140° is the directional filtered result. High-pass FFT is the high-pass Fast Fourier Transform result. Directional filter can retrieve the anisotropic information in the textural images that identify isotropic and anisotropic properties (Sun et al., 2011). Based on the different properties of sea surface texture, we changed the degrees through directional filter and found the best angle for displaying texture—140°. For SAV1, high-pass FFT as well as directional filter was performed based on the pre-processed multi-spectral image. Ten times high-pass FFT result was added to the directional filtered result to enhance the fine textures.

| $$ \mathrm{S}\mathrm{A}\mathrm{V}2={\left(\mathrm{H}\mathrm{i}\mathrm{g}\mathrm{h}{\text{-}}\mathrm{p}\mathrm{a}\mathrm{s}\mathrm{s}\mathrm{ }\mathrm{F}\mathrm{F}\mathrm{T}\right)}^{2}-{\mathrm{O}\mathrm{M}}^{2}, $$ | (2) |
where SAV2 is the sea surface texture characteristics of Huangwei Yu, Bei Yu and Nan Yu (Fig. 3). OM is the occurrence matrix result describing grey-level distribution using discrete values. Occurrence matrix greatly relies on the spectral difference to descript texture content, but is not suitable for similarity measures (Chu et al., 2019; Jebali et al., 2018). The first-order measure preserves certain spatial, structural and statistical properties, and the visualization capability can capture small changes while maintaining the global structure (Verma et al., 2020). For SAV2, occurrence matrix processing was performed on the fused 2 m resolution image. After that, high-pass FFT was carried out to selectively filter out a part of the low-frequency signal, which was obtained through the calculation and integration of the occurrence matrix. Then calculate the two results in Eq. (2), and finally get the SAV2 image.

The SST distribution is an indicator of the performance of the texture measure. We adopted radiative transfer theory equation-based method to retrieve SST (Yu et al., 2014; Nikam et al., 2016). Radiation calibration is the process of converting the digital number into radiance Lλ10 (Vermote et al., 1997) and was performed before SST retrieving. A simplified radiative transfer equation can express the apparent radiance received by a sensor (Mao et al., 2005):
| $$ {B}_{10}\left({T}_{10}\right)={\tau }_{10}\left(\theta \right)\times \left[{\varepsilon }_{10}\times {B}_{10}\left({T}_{s}\right)+\left(1-{\varepsilon }_{10}\right)\times {I}_{10}\downarrow \right]+{I}_{10}\uparrow , $$ | (3) |
where B10(T10) is the radiance received by channel 10 of the sensor with brightness temperature T10. B10(Ts) is the ground radiance. And τ10(θ) is the atmospheric transmittance for channel 10 when view zenith angle is θ. TIRS is treated as nadir viewing since the view angle is no more than 7.5° (Schott et al., 2012). ε10 is surface emissivity for channel 10. I10↓ is downwelling path radiance, and I10↑ is upwelling path radiance. In this paper, the specific emissivity ε10 of the sea surface was 0.991 (Wang et al., 2015, 2019a). Atmospheric profile parameters were found on NASA’s website (
According to Plank’s law, B10(Ts) can be expressed as
| $$ {B}_{10}\left({T}_{s}\right)=2h{c}^{2}/\left({\text{λ}}_{10}\frac{1}{5}\times (\mathrm{e}\mathrm{x}\mathrm{p}\left(h\times c/\left({{\text{λ}} }_{10}\times k\times {T}_{s}\right)\right)-1)\right), $$ | (4) |
where Ts is the land surface temperature, c is the light speed (c=2.997 9×10⁸ m/s), h is the Planck constant (h=6.626 1×10⁻³⁴ J·s), k is the Boltzmann constant (k=1.380 6×10⁻²³ J/K), λ10 is the effective band wavelength for band 10.
Solving Eq. (3) and Eq. (4), SST can be estimated as Eq. (5):
| $$ \begin{split}{T}_{s}=&{C}_{1}/\Biggr({{\text{λ}} }_{10}\times \mathrm{l}\mathrm{n}\Biggr({C}_{2}/\Biggr({{\text{λ}} }_{10}\frac{1}{5}\times (L{{\text{λ}} }_{10}-{I}_{10}\uparrow -{\tau }_{10}\times\\ & (1-{\varepsilon }_{10})\times {I}_{10}\downarrow )/({\tau }_{10}\times {\varepsilon }_{10})\Biggr)+1\Biggr)\Biggr), \end{split}$$ | (5) |
where C1 is 14 387.7 μm·K, C2 is 1.191 04×108 W·μm4/(m2 ·sr).
HY-1C CZI image was obtained from the National Satellite Ocean Application Service in China (
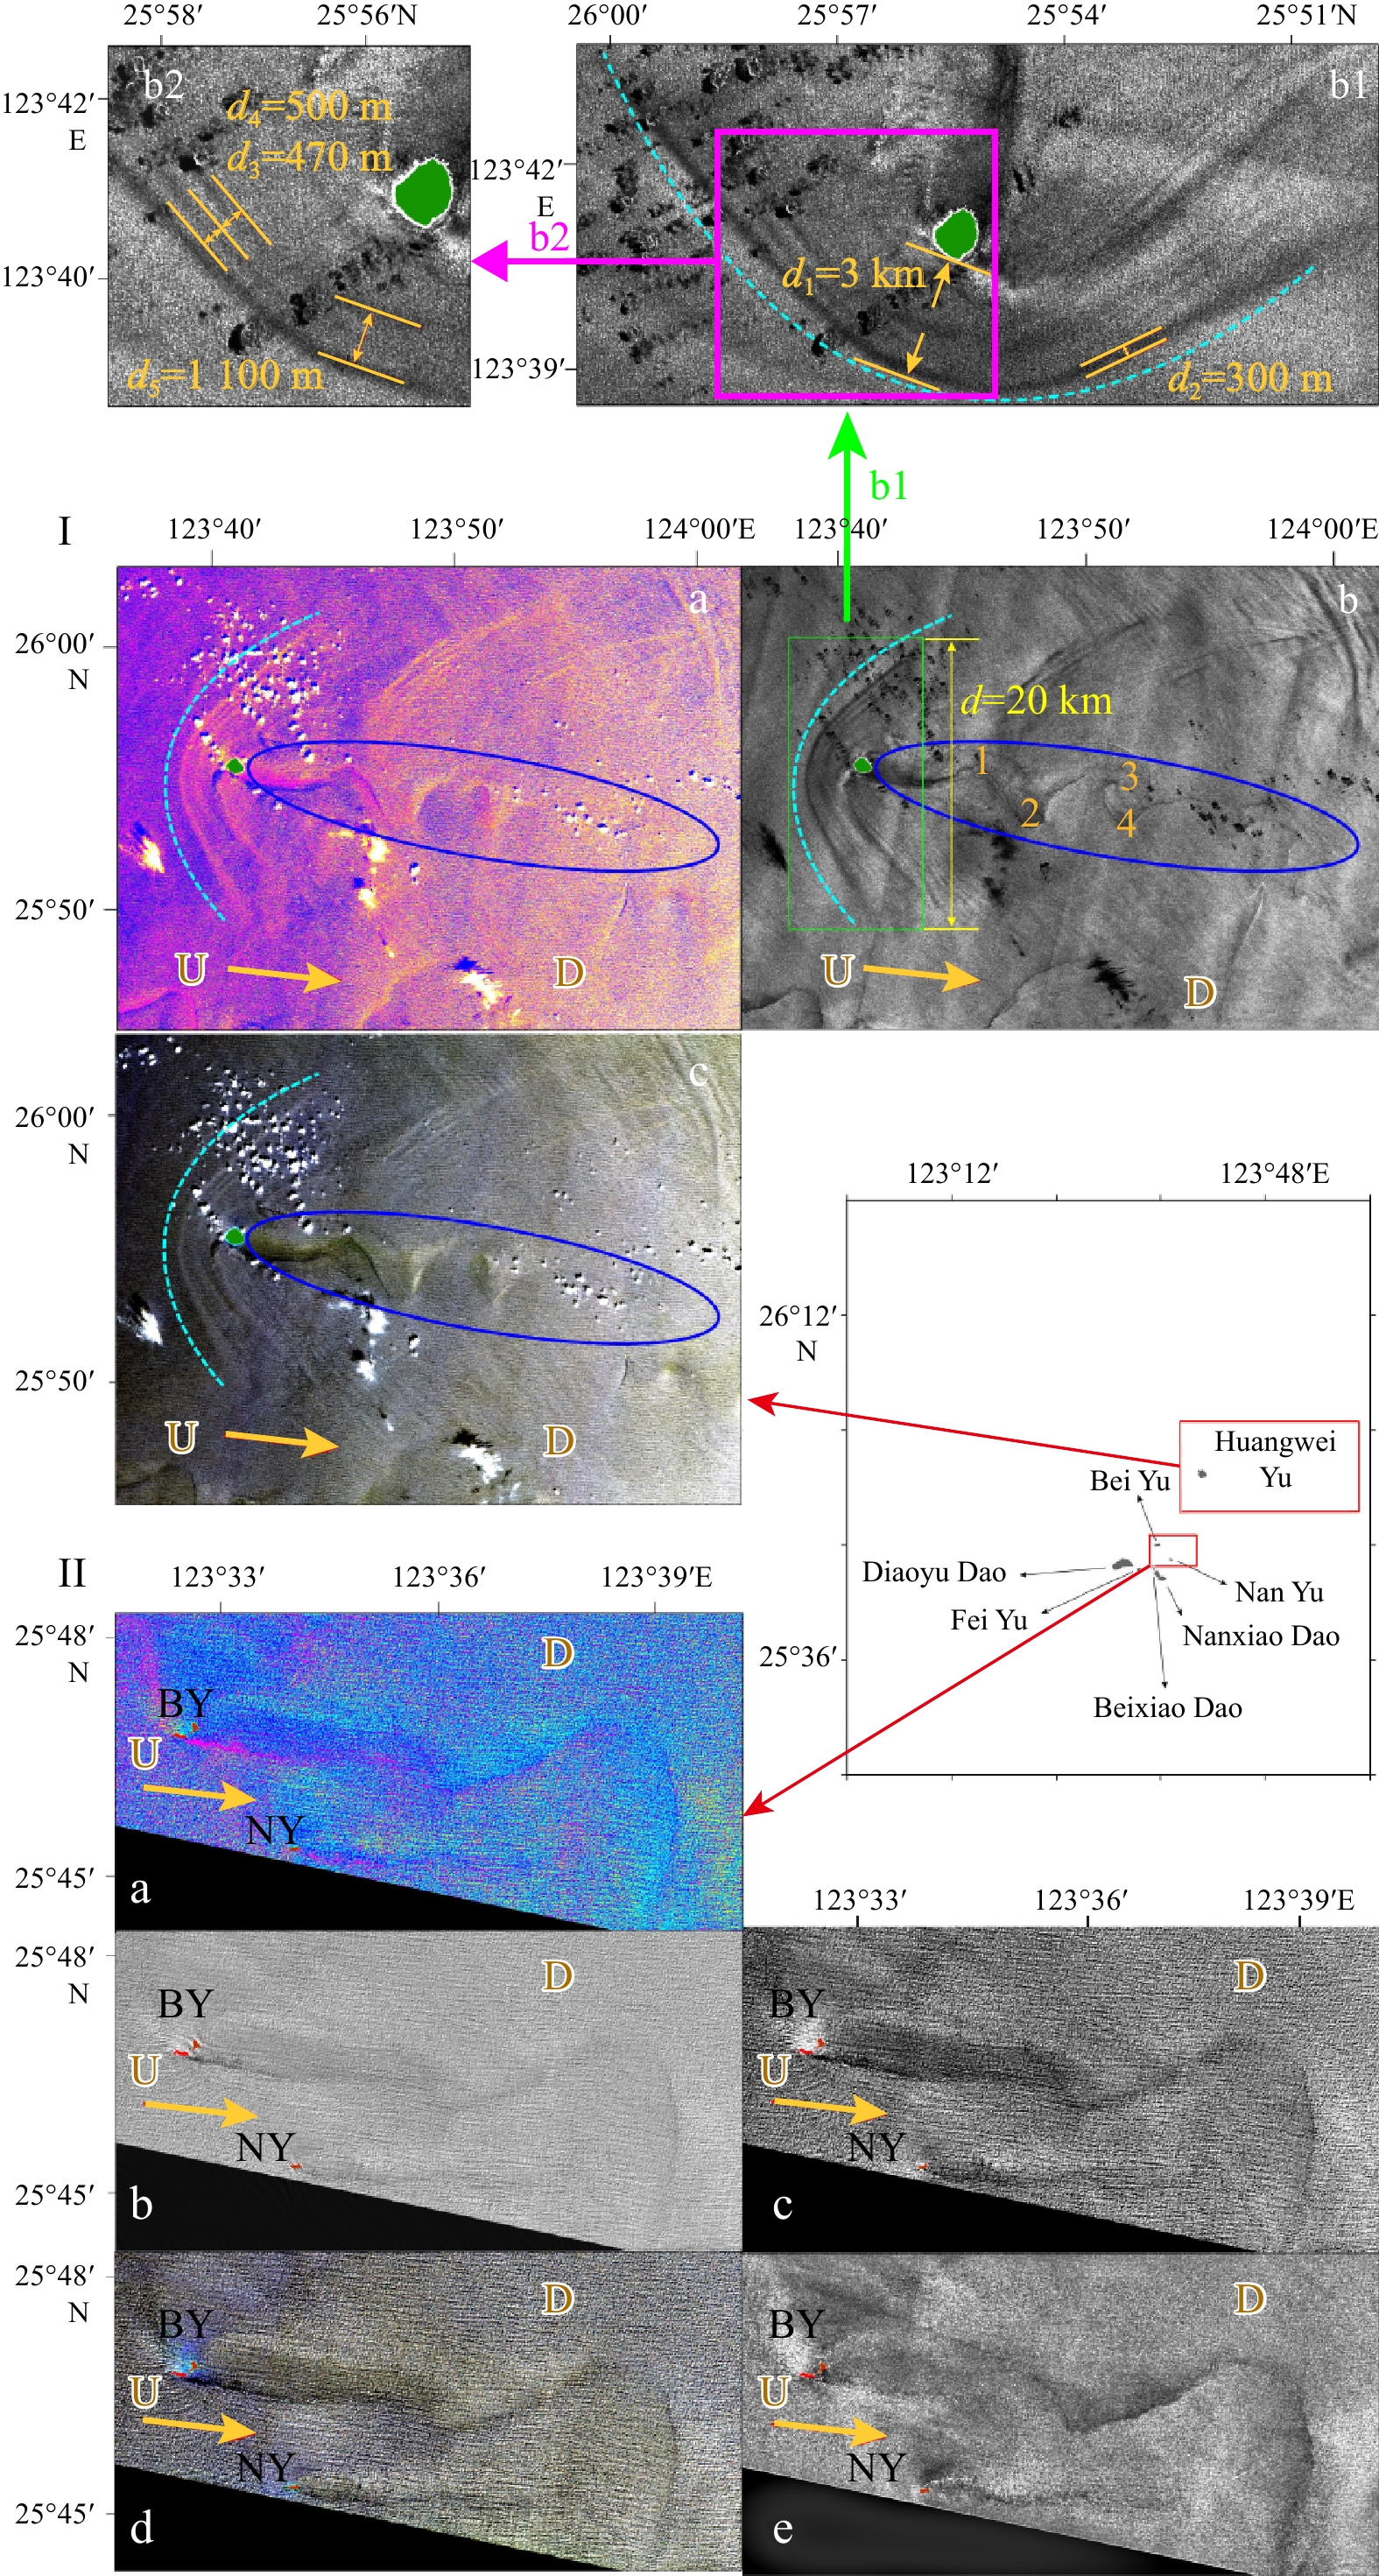
The SG information, extracted using SAV1, changes significantly upstream and downstream of the Diaoyu Dao and its affiliated islands (Fig. 2). These changes are clearly shown in the texture and tone of the sea surface, with different shapes, sizes and distribution characteristics (Fig. 2).
SAV1 performs well in extracting the details of sea surface folds from SG (Figs 2IId and IIId), especially the shield effect on west side of the islands, showing the clear and obvious arc-shaped texture. The westward shield extracted using SAV1 is more obvious compared with that extracted by many other methods such as classification, co-occurrence and median filter. The shields upstream of the Beixiao Dao and Nanxiao Dao as well as Diaoyu Dao induce the change of SSR and texture, reflecting in the shape, width, tone, and texture interval (Figs 2II and III ellipse).
There exists a significant shield wave upstream of Diaoyu Dao, with a radius of the wave about 2.3 km and an arc length of about 70° (Fig. 2III). The horizontal scale of the wave is about 2.6 km. Upstream Beixiao Dao and Nanxiao Dao, there are both two waves of island shield that have similar shield arc length (Figs 2II and III ellipse). The outer wavelength radius is about 4.5 km and the arc is 46°, while the inner radius of the wavelength is almost 3.3 km, and the arc is 50° (Fig. 2II). Meanwhile, the horizontal scales of the waves are about 2.4−3 km and the spacing of them is 220−380 m (Fig. 2II). In Fig. 2III, the outer wavelength radius is about 4.7 km, the arc is 94° with the horizontal scale of 4 km, while the inner radius of the wavelength was nearly 3.2 km and the arc is 60° with a 3 km horizontal distance. The obvious wave texture interval is between 500 m and 900 m (Fig. 2III ellipse).
With vortex wakes appearing downstream, the water flow patterns downstream of Diaoyu Dao and its affiliated islands are quite different from the flow patterns upstream (Fig. 2I). Downstream of Diaoyu Dao, influenced by the Beixiao Dao and Nanxiao Dao, the formed vortex in ellipse with a radius of 1 400 m to 1 700 m (Fig. 2I square) covers an area for nearly twice of the Diaoyu Dao. And a wake downstream Beixiao Dao and Nanxiao Dao is formed with a length of about 22 km and a width of 3.2 km (Fig. 2I).
The upstream and downstream characteristics of Huangwei Yu were quite different in detail comparing with Diaoyu Dao, and the result extracted from SAV2 achieved the best recognition effect (Figs 3Ia−c). Upstream of Huangwei Yu, the umbrella shaped westward shield extracted by Shield-and-Velocity 2 (SAV2) had a symmetrical streamline, with clear wave boundaries and more specific intermediate waves (Figs 3Ib and 3Ib1). The outer shield wave upstream of Huangwei Yu had a radius of about 8 km, and an arc of 155°, while the inner wave extending from the island was in a radius of about 5.5 km, and the radian of 210°. The thickness of the front waves of the shield was in a range of 300−400 m (Fig. 3Ib1 d2), while the total thickness of the west shield reached to 3 km (Fig. 3I b1 d1). Furthermore, the light and dark stripes of internal texture of the shield were distinguished to measure the intervals of the internal waves at different positions (Fig. 3Ib2). The upstream shield contained 2−4 solitons at different directions with extraordinary different spacing scales of waves from about 470 m to thousands (Figs 3Ib2 d3−d5). Compared with the width of upstream shield, the downstream wake of Huangwei Yu was mainly characterized by its length (Fig. 3I ellipse). The downstream IOVT equipped with two complete vortex pairs was about 17 km long from west to east, and the intervals of each vortex from west to east are 7.2 km (interval from island to the first vortex), 3.4 km, 5.5 km, 0.6 km, respectively. And the spiral structure of Karman vortex began to decay after the fourth vortex (Fig. 3Ib ellipse).
The upstream shield extended 3 km to the west of Huangwei Yu, with horizontal scale of about 20 km, and the downstream wake was 31 km in length until it vanished (Fig. 3I ellipse). The central axis of the shield coincided with the direction of the vortex street, the ratio of the upstream shield width and the length of the downstream wake is about 2:3, showing that the overall phenomenon upstream and downstream of Huangwei Yu is like a mushroom (Fig. 3I).
Bei Yu and Nan Yu (Fig. 3II) are located within 10 km northeast of Diaoyu Dao. Downstream the Bei Yu, the mainstream wake is about 16 km in length, while the downstream wake of Nan Yu is nearly 6.5 km in length and the information extracted using SAV2 shows more significant and obvious details (Fig. 3IIe). It seems that a more independent obstruction located in fixed water layer was inclined to arouse a longer and more complete wake.
SST changes obviously around Diaoyu Dao and its affiliated islands (Fig. 4) that decreasing significantly downstream of the islands no matter in winter or in summer. The downstream wakes saturated with low SST caused by Diaoyu Dao as well as Huangwei Yu were similar in shape showing winding ribbons (Figs 4A, B, b and d), whose length was in the range of 7−12 km, width was between 0.8−2 km, and area covers 15−22 km2. However, in front of the low SST water zone, there was generally an area in the length of 1.4−6.5 km downstream adjacent to the islands where the change of SST was not obvious (red square in Fig. 4). Excepting the striped wakes, the current downstream also appears in the form of eddies. In Fig. 4a, the low SST eddy downstream of the island was 5.5 km from east to west, 4.5 km from north to south, forming a cooling zone with an area about 16 km2. In winter, in the area downstream of the islands, the temperature decreases and the amplitude is smaller than that in summer (Figs 4C and c).

Generally, Diaoyu Dao and its affiliated islands caused SST variation downstream of the islands on the eastward. The wakes of Huangwei Yu had an SST drop of 1.2−2.5℃ and Diaoyu Dao has a drop of 1.2−2℃, the variation amplitude of SST in winter (Figs 4C and c) was smaller than that in summer. In addition, the SST drop is not obvious in the distance adjacent to the islands (Figs 4A, B, a, b and d square), especially in summer.
The Diaoyu Dao and its affiliated islands also induce changes in Chl a concentration in the surrounding area, with the large differences in concentration and in impact range between the upstream and downstream.
Low Chl a concentration (within 0.4 μg/L) appears in the area downstream immediately adjacent to the islands (white square in Fig. 5), with Chl a concentration similar to upstream (Fig. 5 magenta ellipse) showing no obvious change, and the influence lengths are 300−700 m upstream and 700−1 200 m downstream. The area of low Chl a concentration (within 0.4 μg/L) upstream of Beixiao Dao and Nanxiao Dao, Diaoyu Dao and Huangwei Yu is about 3.2 km2, 4.2 km2 and 7.6 km2, respectively (Fig. 5 magenta ellipse). The area of low Chl a concentration downstream Beixiao Dao and Nanxiao Dao, Diaoyu Dao reaches 4.6 km2 and 3.5 km2, respectively (white square in Fig. 5). In addition, the areas of low Chl a concentration around Diaoyu Dao, Beixiao Dao and Nanxiao Dao were in good coincidence with the shield and shelter area in Fig. 2. These downstream shelter regions extended in accordance with the direction of the topographic slope, which corresponds to shallow terrains.

As it got further downstream the island, the high Chl a concentration (more than 0.55 μg/L) caused by wake turbulence increased from 0.48−0.6 μg/L that got a 0.12 μg/L increase extending eastward or northeastward with the length of 17−25 km (Fig. 5 black ellipse).
SG is the specular reflection of sunlight by suitably tilted facets of the water surface into the sensor. Optical sensors are sensitive to SG, and thus to the oceanic phenomena that modify the surface facets. The more facets with the suitable slope values, the stronger the SG radiance received by the sensor (Melsheimer and Keong, 2022). The proportion of SG in GF-1 and GF-6 image is obvious, as no measures were taken for GF-1 and GF-6 to avoid SG (Kay et al., 2009). In most cases, influenced by the characteristics of a wavy interface, the fields of the radiance leaving the ocean are anisotropic (Morel and Gentili, 1993; Rascle et al., 2017). The specular reflection of the solar on the non-flat sea surface results in the intensity of an image with a specular component that is much stronger than the diffuse component (Wang et al., 2018a), that the proportion of reflected light received by the satellite sensor can weigh from 1%−2% reaching to 6%−16% (Bréon and Deschamps, 1993; Sturm, 1980). As the data preprocess could not eliminate SG (Yao et al., 2020), it is possible to utilize SG for analyzing the sea surface characteristics.
Fine-scale slope or vorticity with abnormal roughness at the ocean surface can be observed by SSR (Rascle et al., 2016, 2017), obtained from SG radiance. Retrieving SSR from GF-1 and GF-6 SG based on SAV method, sea surface texture change details upstream and downstream of Diaoyu Dao series islands were effectively revealed (Figs 2 and 3). Meanwhile, using SG, this paper further exploited the application potential and advantages of GF data.
The current mainly dominated by Kuroshio (Liu et al., 2021) with the eastward direction in study area (Figs 6a, d square), no matter in El Niño year or in normal year. Since it has been observed that 2014−2016 as well as 2018−2019 were all El Niño years (Hu and Fedorov, 2019; Levine and McPhaden, 2016; Bao et al., 2019), the current in 2012−2015 was taken as an example.

The direction of the current in Diaoyu Dao and its affiliated islands area flows mostly eastward or northeastward (Figs 6a, d) and changes slightly with the season. In summer (Fig. 6a-1), the current flows northeastwardly, and in winter (Fig. 6a-3) it flows eastwardly. Meanwhile, the average velocity of Kuroshio Current changes seasonally (Liu et al., 2021). In autumn (Fig. 6a-2) and winter (Fig. 6a-3), the current velocity weakened and dispersed with a velocity under 0.6 m/s, and the upper ocean (150 m) subsequently replaced by the northwestward current (Tang et al., 2000; Qiu and Imasato, 1990; Qiu and Lukas, 1996). The main stream of Kuroshio not only moves westward and approaches to the mainland, but also intrudes into the continental shelf of the East China Sea to 26°−27°N in autumn and winter (Chao, 1990). In summer, with the southeastern wind (Fig. 6c-1), the intensity of Kuroshio Current owes the highest velocity of more than 0.8 m/s (Fig. 6a-1) with mainstream eastwardly flowing (Chuang et al., 1993; Tang et al., 1999). Furthermore, average monthly SST was fit in the route of Kuroshio (Fig. 6b).
Beyond the seasonal variation, the year-to-year variation is also prominent in Kuroshio, which is mainly related to the cycles of ENSO and occasionally overwhelms the seasonal signal (Hwang and Kao, 2002; Qiu and Joyce, 1992; Zhou et al., 2018; Wu, 2013). The flow direction of Kuroshio in Diaoyu Dao and its affiliated islands area is eastward (including northeastward and southeastward) (Fig. 6d), no matter in El Niño year or in normal year. The mean velocity of the Kuroshio source is negatively correlated with ENSO index that induces low velocity in the area of Diaoyu Dao and its affiliated islands in El Niño years (Hu et al., 2015; Li et al., 2020) (Fig. 6d-4). For nearly a year prior to ENSO event, the intensity of the Kuroshio front all along the western boundary region, the heat content front the Kuroshio as well as poleward surface speeds are all strengthened (He and White, 1988) (Fig. 6d-2). Meanwhile, the correlation between the variation of Kuroshio and the ENSO is in time lags of a month to a year (Hwang and Kao, 2002; Huang et al., 2015) (Figs 6d-3 and d-4). Therefore, unprecedented high speed currents appear in the area around Diaoyu Dao and its affiliated islands during the summer of El Niño years with the currents direction of eastward or northeastward (Liu et al., 1992; Chen et al., 1995) (Fig. 6d).
Furthermore, the northern shelf of Taiwan Island is an extremely dynamic oceanic region (Chern and Wang, 1989), and the current there is mainly dominated by eastward Kuroshio that made the upstream shield waves always occur at the west side of Diaoyu Dao and its affiliated islands. The Kuroshio migrates both seasonally and intra-seasonally, with the former being more pronounced (Tang et al., 2000) and the current direction mainly eastwardly.
Stratified flow passing islands on the rotating earth is important for both in meteorology and oceanography. The characteristics of the flow depend upon the shape and height of the island, the velocity and stratification of the incoming current (Eliassen, 1980).
Previous studies have revealed that most of the phenomena in atmosphere like solitary wave packets (Zheng et al., 1998), mountain waves (Eckermann and Preusse, 1999) and upstream wave packets (Zheng et al., 2004), are generated by airflow over a topographic (or dynamical) obstacle and constituted a single wave packet. However, forcing the upstream generation and evolution of solitons must occur within a suitable range of Froude numbers and forcing strength, resulting in the environmental settings (winds, atmospheric stratification, etc.) that favor the generation of upstream propagating solitons to be rare (Li et al., 2004). Baines (1977) and Li et al. (2004) found that topographically generated upstream waves are very strong when the flow is near resonant conditions (the wind speed reaches the speed of long gravity waves), generating and propagating against the airflow in the upstream direction.
Similarly for water, Akylas et al. (1984) and Patoine and Warn (1982) described those upstream waves in water can be generated by moving pressure perturbation derived by resonant forcing of Rossby waves over the bottom topography where the water depth is less than 300 m near the Diaoyu Dao and its affiliated islands. However, the response of such a fluid-mechanical system to a steadily moving disturbance can be unsteady when the system is in resonance (Wu, 1987). The upstream local wave will grow as the energy acquired by the moving disturbance keeps accumulating. When the local wave reaches a certain threshold magnitude, due to the nonlinear effects, the increase in phase speed with increasing amplitude is sufficient to make the wave break away from the disturbance, thus periodically freely generating a new solitary wave that surges forward at a phase velocity (Wu, 1987; Shen, 1993).
Interacting with eastward flow upstream of island in study area, the central line of the flow reaches a stagnation point, which results in strong extensional components in both the axis of the island and the cross-stream direction (Qin et al., 2019). Shield wave with excellent symmetry plays a major role in drag reduction that the storied disturbance energy manifested itself by propagating towards upstream in the form of the shield waves (Qin et al., 2019; Şahin and Atalık, 2019). Therefore, the separation point moves towards front of the island upstream, arriving to an increase of the vortex formation length downstream (Oliveira, 2001), as well as forming a contour of curved flow function and the Reynolds shear stress (Nematollahi and Tachie, 2018). The shield shaped solitary wave packet which always characterized by very large amplitude and high phase speed, can be attributed to hydraulic jumps or fronts (Zheng, 2017). In upstream Huangwei Yu (Fig. 7a cyan arc), the thick boundary of shield wave leads to the suppression of small eddy currents and the forward shift of the separation point (Şahin and Atalık, 2019). This pre-island sea surface phenomenon is defined as “Shield Effect” in this study (Fig. 7a cyan arc).

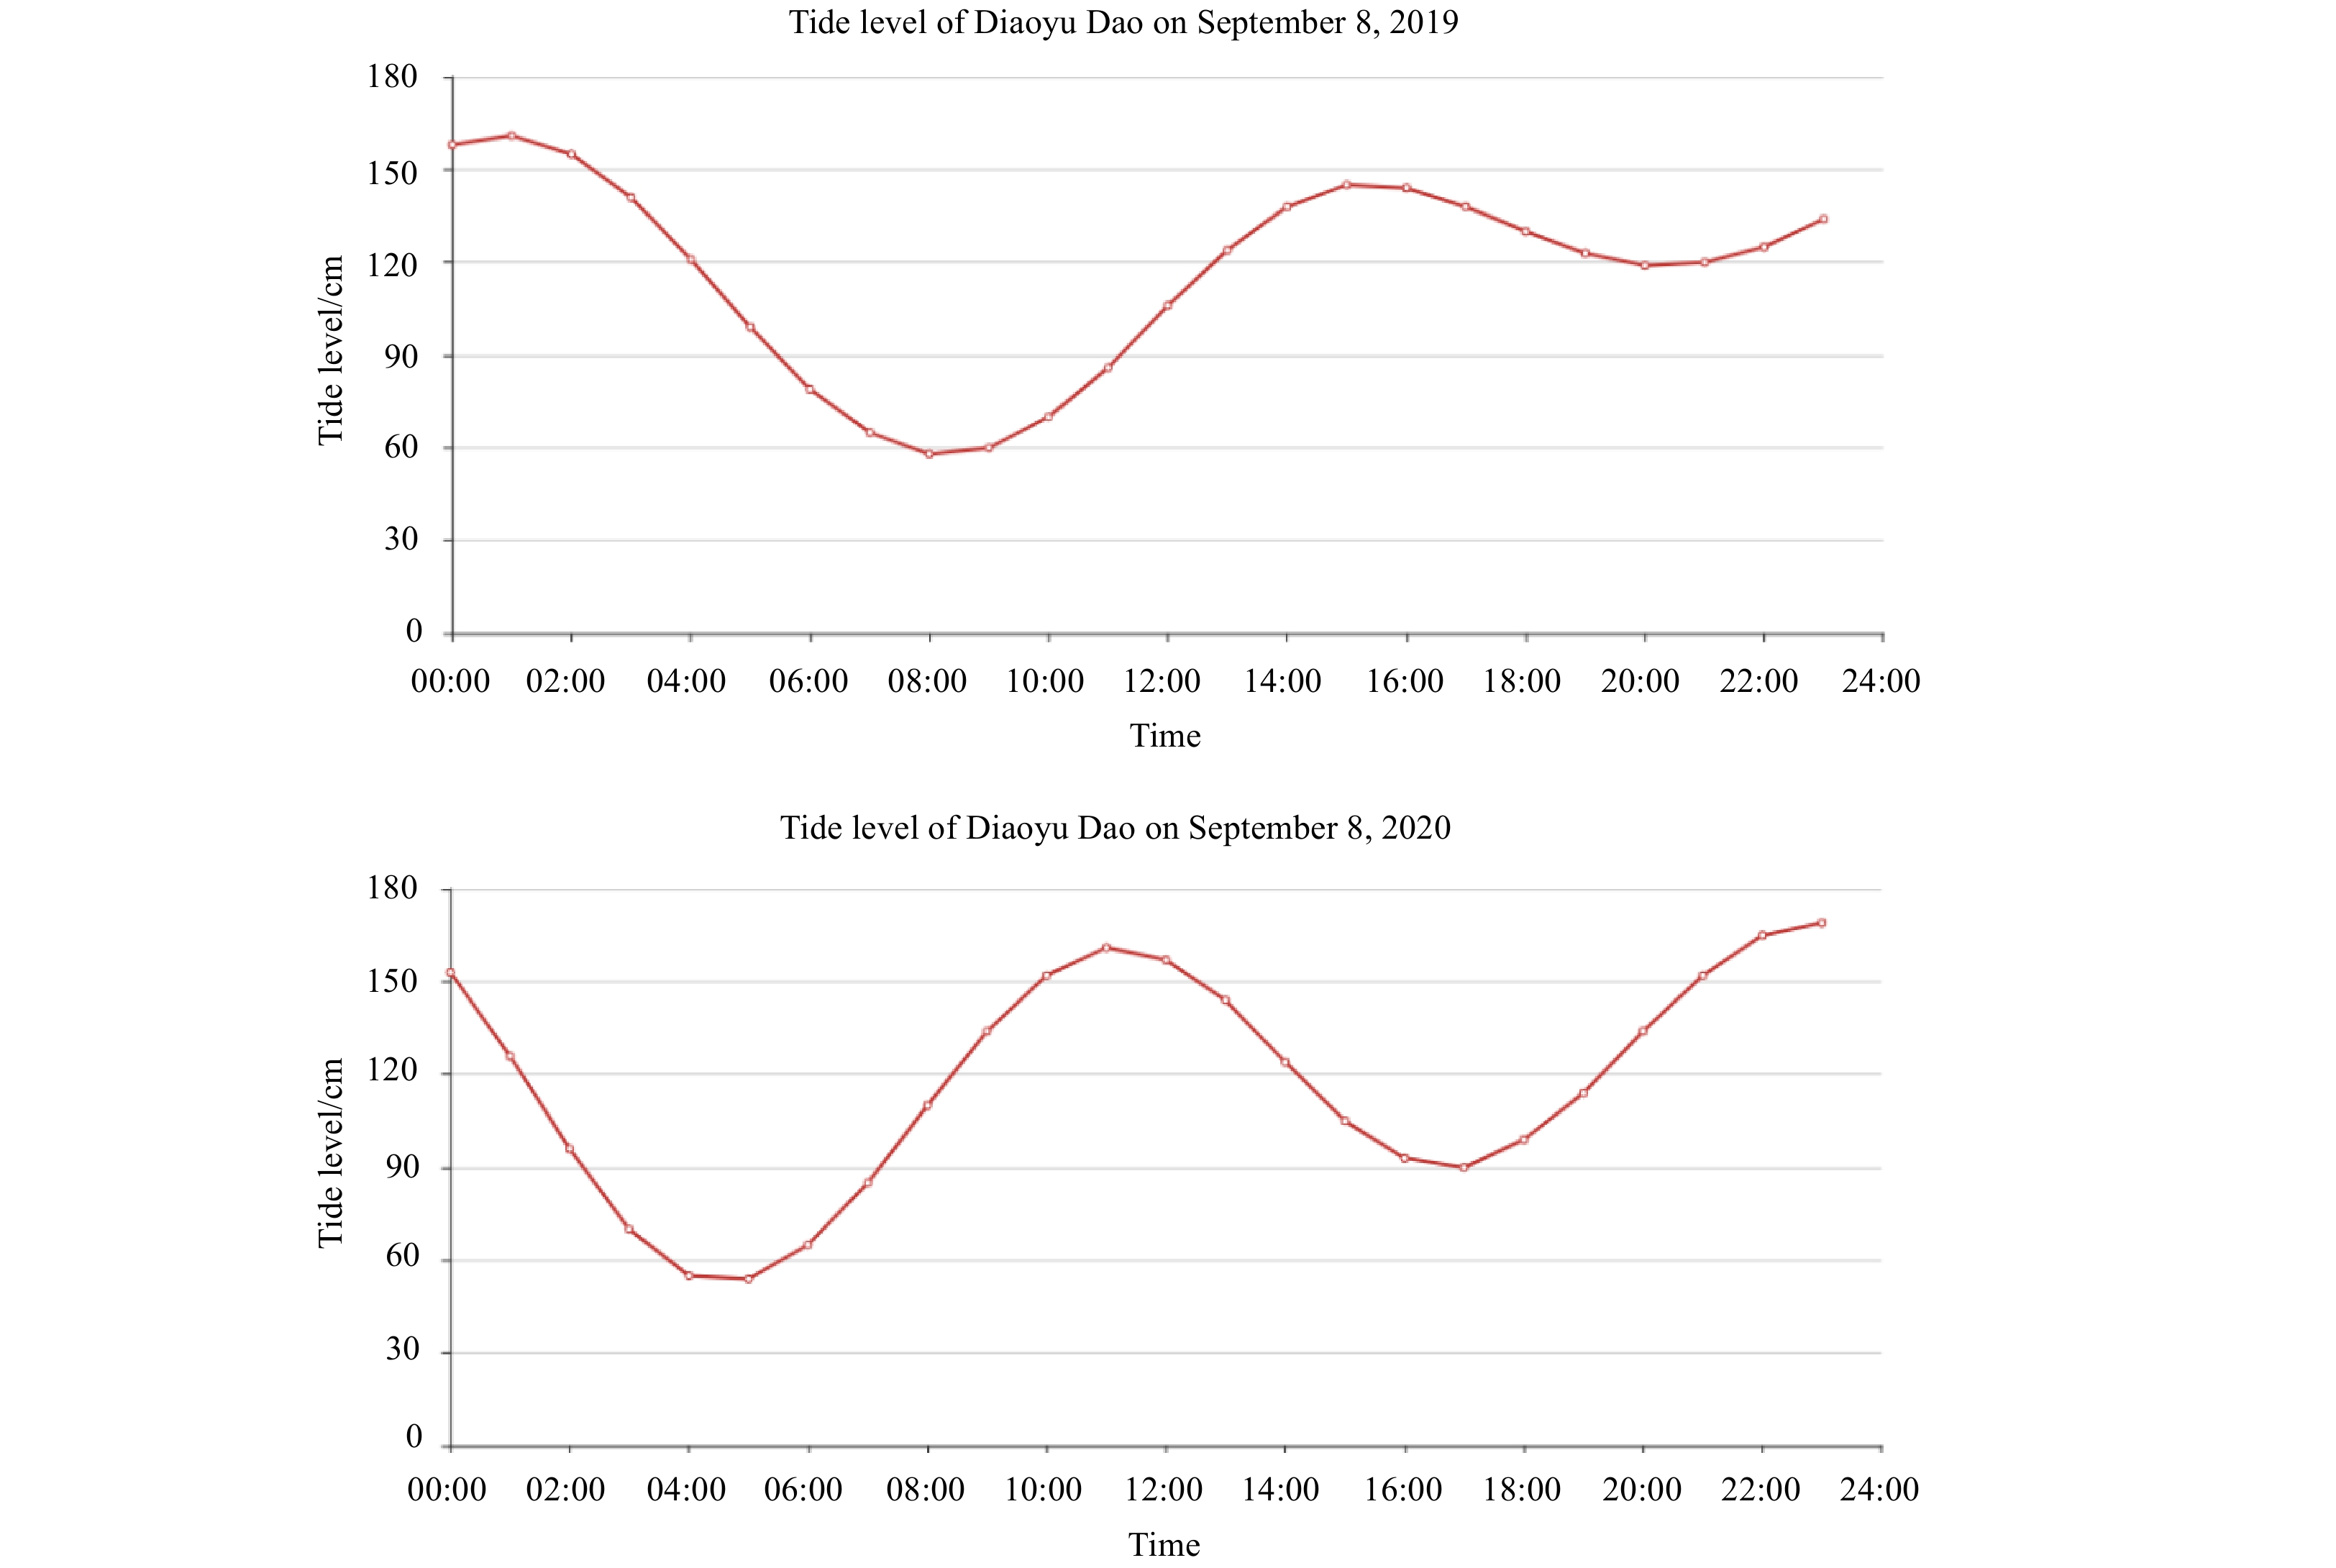
The tidal type along the northeast coast of Taiwan Island belongs to the irregular semidiurnal tide (Wu et al., 2008b) (Fig. 8), with M2 as the main component, and the amplitude around Diaoyu Dao and its affiliated islands is between 50−80 cm (Guo and Yanagi, 1998; Larsen et al., 1985). Compared with most area of the East China Sea, its tidal amplitude is small. At the same time, the wind energy in the waters of the Diaoyu Dao and its affiliated islands is large but the wave energy is small (Zheng et al., 2012), which may mean that the existence of wind driven current may be suppressed by the Kuroshio surge and the increase in water depth. From the direction of the movement of the clouds over the islands in Fig. 7, it can be inferred that the wind direction is not consistent with the direction of the current (eastward), and the angle between the direction of the current and the wind is obtuse angle, therefore, the shield wave upstream of the island is not generated by the wind. Huangwei Yu is like a cylinder in shape and lies in a more independent position (Fig. 1). In the upstream of the islet (Fig. 7a cyan arc), the negative Reynolds shear stress near the leading edge of the step occurs, due to the anti-gradient diffusion phenomenon that results in a negative contribution to the kinetic energy of turbulence (Nematollahi and Tachie, 2018). The surface of its upstream shield may either coincide with the lowest isentropic surface, or its summit which may protrude into potentially warmer (less dense) fluid, and these two contingencies are known as “isentropic obstacle” and “warm obstacle” (Eliassen, 1980). In addition, Nusselt number attains the highest value on the surface upstream of the islet, and the lowest value on the surface downstream (Han et al., 2018).

For downstream of the island, when an upper surface current encounters an isolated island, the curvature of the island provides a perturbation to the fluid streamlines (Pakdel and McKinley, 1996). Boundary shear flow forms along the solid boundary and generates vertical vorticity (Chang et al., 2019). The detachment of the boundary layer leads to the free shear layers, and the roll-up of the shear layer forms vortices (Teinturier et al., 2010). At the same time, an inverse pressure slope may develop at the downstream edge of the boundary layer, where eddies are generated by wake instability (Gerrard, 1966; Koumoutsakos and Leonard, 1995). Thus, facing the current direction, a series of clockwise vortex on the left boundary and counterclockwise vortices on the right boundary are formed (Zheng, 2017) (Fig. 7a ellipse). For isolated island like Huangwei Yu (Fig. 7a ellipse), the flow regime which is mainly depending on the Reynold number can be distinguished (Gao et al., 2018; Sheremet, 2010; van Dyke and Widnall, 1983). The vortex street, which supplied by the secondary steady flow to the turbulent generation zone (Zametaev et al., 2019), can either be transferred from the vorticity to another through oscillation, or it can grow from the instability of the velocity profile (Tritton, 1959).
However, when multiple barriers appear in the tandem arrangement stream, the wake interference characteristics are completely different (Assi et al., 2006; Zdravkovich, 1977, 1987). Barriers in the tandem arrangement stream can suppress vortex shedding and mainly perform in two flow patterns: vortex shed from the downstream island which produce low pressure regions in the vicinity of the body (Fig. 2II) and vortex lock-in in the gap (Fig. 2I) (Carmo et al., 2011; Strykowski and Sreenivasan, 1990). The latter pattern forms an area of low pressure in the southwest of Beixiao Dao and Nanxiao Dao, alleviating the formation of upstream shield (Carmo et al., 2011) (Fig. 2I). The critical Reynold number and the corresponding manifold vary with speed and spacing ratio, that the Reynold number of the former pattern (Fig. 2II) is smaller than that of the latter (Fig. 2I) in the above two cases (Han et al., 2018).
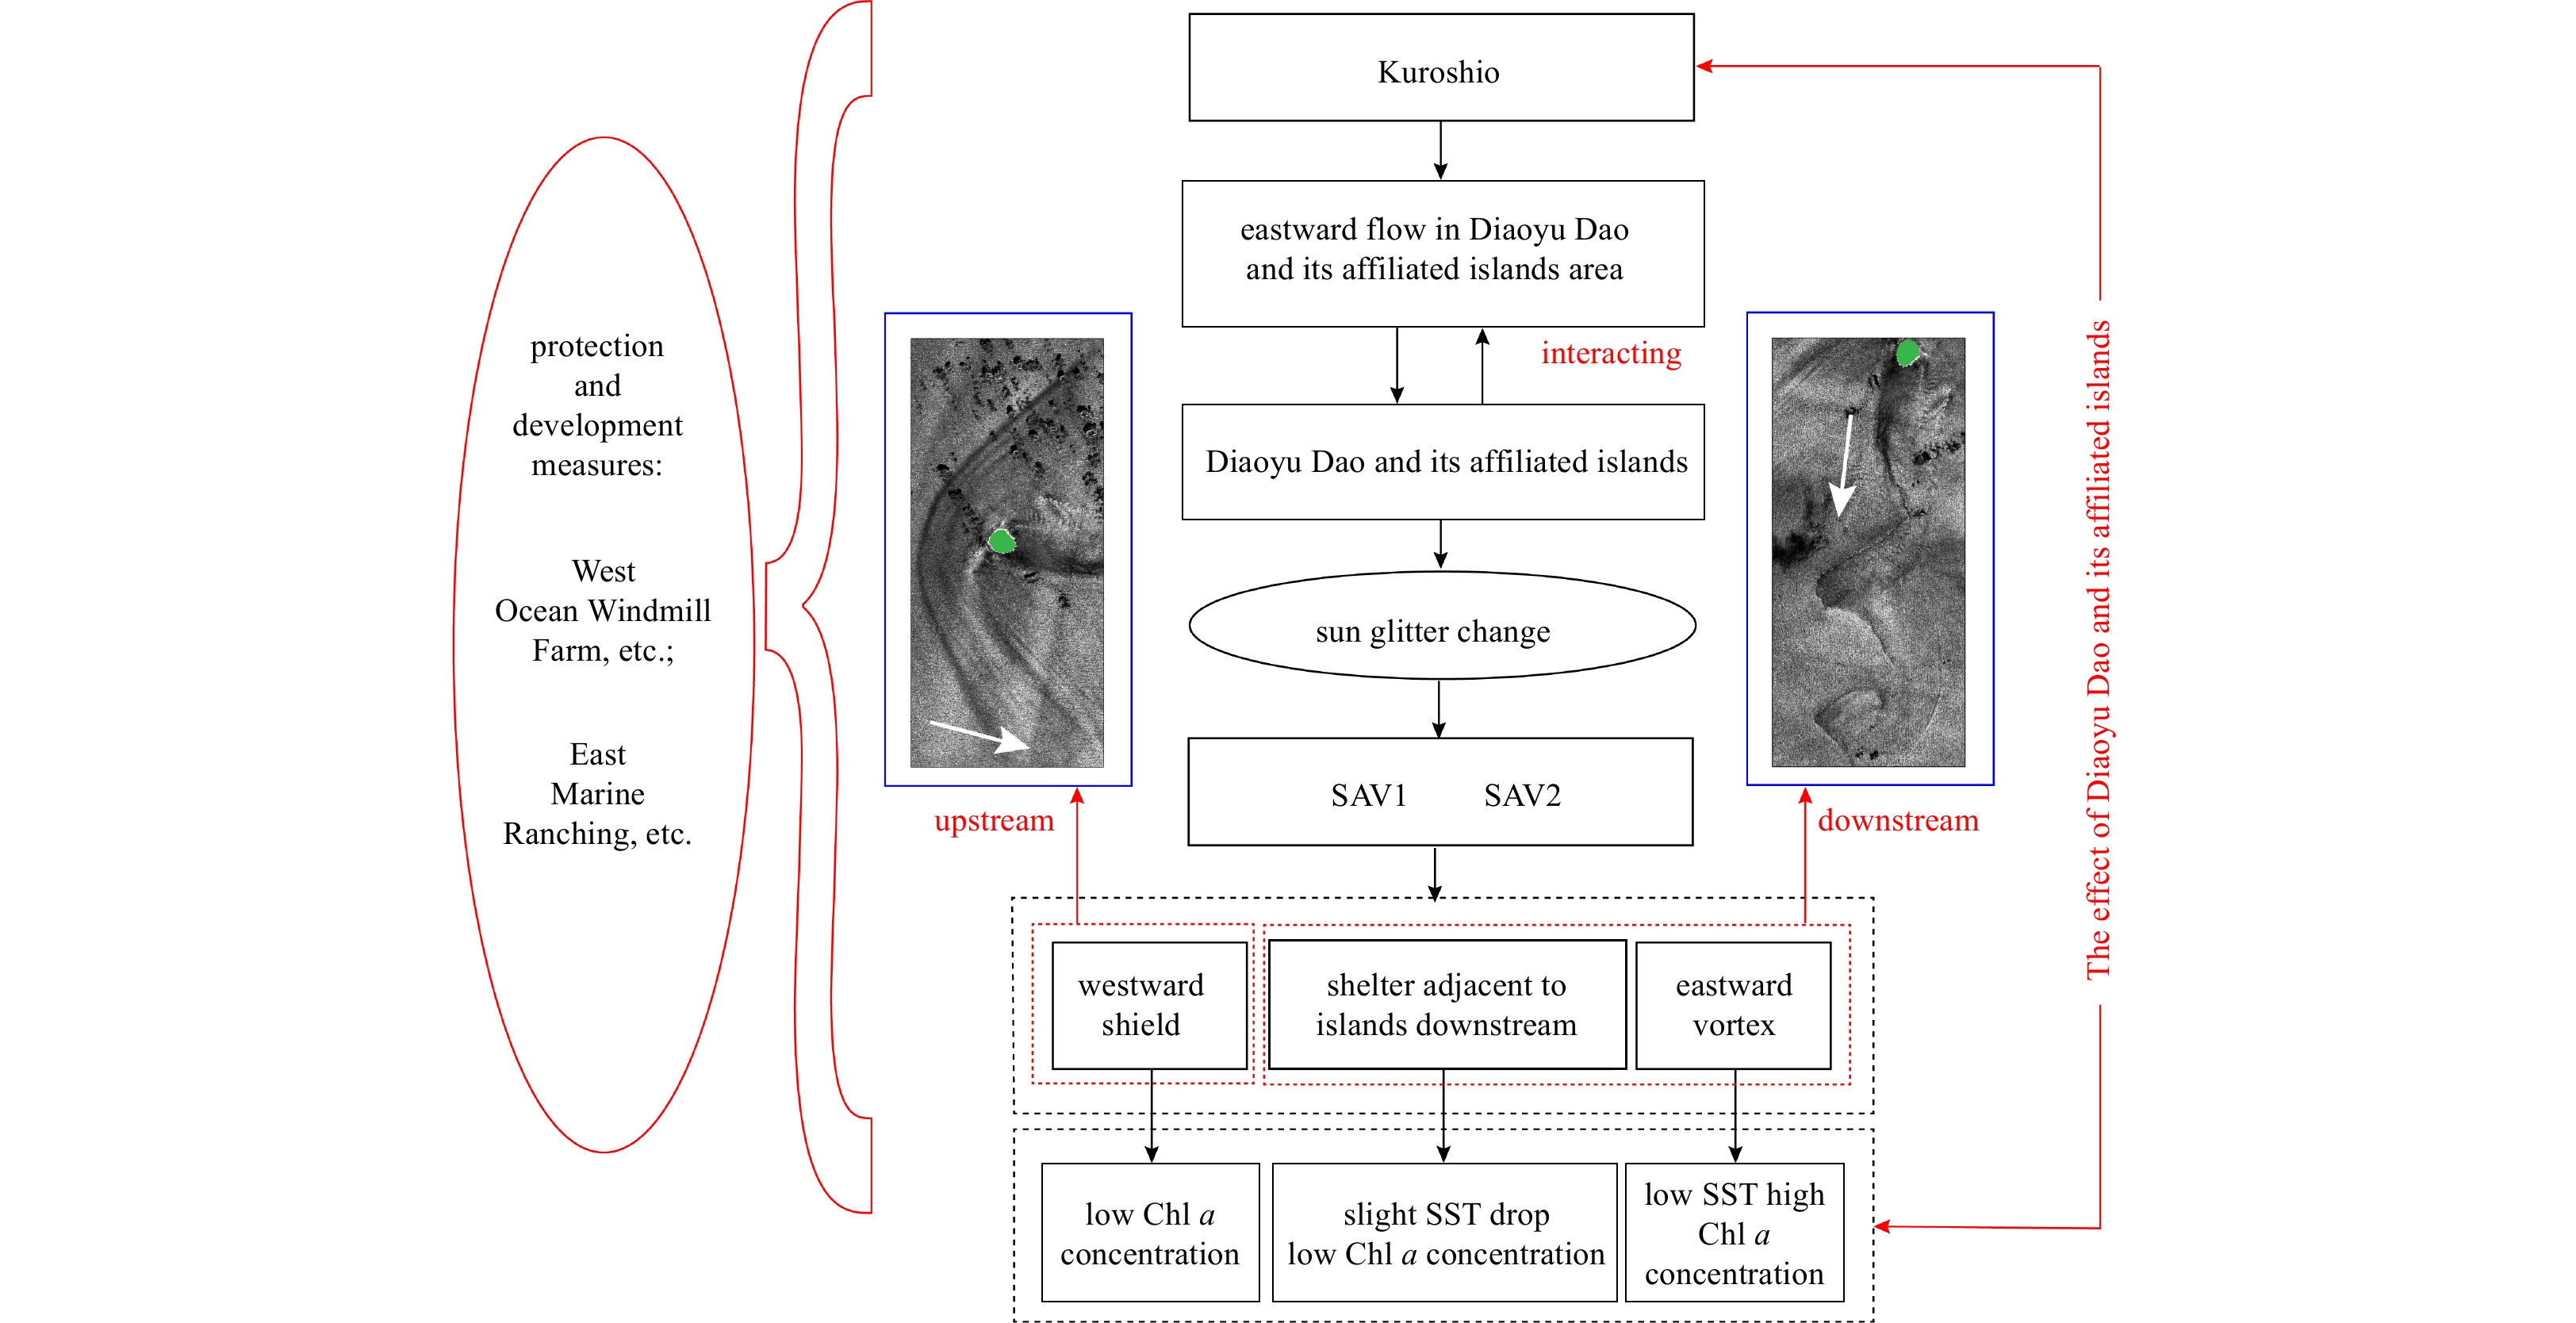
Diaoyu Dao and its affiliated islands induce the change of Chl a and SST upstream and downstream. Because of the stable eastward flow, upstream of Diaoyu Dao and its affiliated islands area mainly located in westward of these islands and downstream of Diaoyu Dao and its affiliated islands area distributed in eastward, which are consistent with the results of westward Shield Effect and eastward wakes revealed by SG and further proved that the results of solar flare monitoring are correct.
The accumulation and pressurization of water upstream of the reef resulted in upstream retention and low Chl a concentration (Figs 4 and 5). However, in the area downstream that immediately adjacent to the island, a shelter with low and uniform Chl a concentration as well as a little SST drop was formed (Figs 4 and 5). Furthermore, shelter area has also been observed on Synthetic Aperture Radar (SAR) images in bright shading in prior studies (Zheng and Zheng, 2014). Downstream of the island, next to the shelter area, is the zone of vortex streets which propagate downstream (Shen, 1993). The increase of Chl a concentration occurred since 0.7−1.2 km away from the island downstream (Fig. 5), while the obvious decrease of SST was found 1.4−6.5 km away from the island downstream (Fig. 4).
The interaction of current with island generates a wake that can extend several island diameters in length downstream (Cardoso et al., 2020). The Kuroshio subsurface water enters the East China Sea shelf as upwelling water from the northeast of Taiwan Island (Wu et al., 2008a), with its characteristics of high temperature, high salinity, and a deep thermocline (up to 250 m) (Oka and Kawabe, 1998). The SST of IOVT primarily influences by vertical turbulence mixing, which entrains cold water to the surface layer (Hsu et al., 2019). This kind of mix trends induce a near linear relationship between consistent SST decrease and Chl a increase (Babin et al., 2004). In addition, upwelling to compensate for surface divergence in the wake can also bring cold water to the surface layer (Hsu et al., 2019). Various physical processes such as filaments or three-dimensional instabilities enhance the horizontal transport and the vertical mixing of nutrient rich deep water when an upper surface current encounter oceanic islands or an archipelago (Teinturier et al., 2010). These kinds of mixing took a few hundred or thousand metres downstream for fully mix to get the SST of 1.2−2.5℃ decreasing (Fig. 4) and the Chl a concentration rising from 0.48 μg/L to 0.60 μg/L in a gap of 0.12 μg/L (Fig. 5). For downstream of the islands, vortex streets and vortex shedding are also accompanied by higher bio-productivity (Hsu et al., 2019). In prior studies, it also has been observed that the Chl a concentration upstream and downstream of Green Island was 0.1−0.15 μg/L gap in summer (Hsu et al., 2017).
Combining with high-resolution SST and Chl a concentration, the directional changes of water color elements are mutually supported and proved with the stable shield (wave packet) effect in the west and vortex street effect in the east. The stable directional hydrodynamic layout in the waters of Diaoyu Dao and its affiliated islands area has been revealed.
The stable eastward flow (Figs 6a, d) interacts with Diaoyu Dao and its affiliated islands inducing westward Shield Effect and Karman vortex streets as shown in the information extracted from satellite data such as SG (Figs 2 and 3), SST (Fig. 4) and Chl a concentration (Fig. 5). More than 50 frames of satellite images obtained during April 17, 2014 to October 10, 2021 were analyzed and got the same conclusion, that is, there exists stable shield on the west side (including northwest and southwest) of Diaoyu Dao and its affiliated islands; and stable vortex street on the east side (including northeast and southeast) of the islands.
Based on the analysis above, it suggests to build some kind of buffer for the current, such as ocean windmill farm in the west part (including northwest and southwest) of Diaoyu Dao and its affiliated islands area in the range of 6−8 km (Cai et al., 2016) away from the islands upstream. These facilities can protect the island by reducing the current erosion. The turbines of windmill can act as artificial reefs which assures an effective reduction of the wave heights and the wave energy (Petersen and Malm, 2006; Punt et al., 2009; Onea and Rusu, 2015).
Meanwhile, it is better to develop marine ranching in the east area of these islands (including northeast and southeast), considering that marine ranching locations are generally located in the inner parts of islands that are rich in nutrients and sheltered from the waves (Oh et al., 2010; Choi and Kim, 2008). Islands can change the surrounding hydrodynamic environment in two ways: one is local scour, the other is the wake vortices around the barriers (Unger and Hager, 2007). When the scouring in front of the island stops, the upstream current of the island carries sediment/nutrients and bottom cold water to downstream, resulting in lower SST downstream (Huang et al., 2020). The wake vortices will gather sediment together with nutrients and bottom cold water to the downstream surface, reducing the downstream SST and increasing the downstream nutrients. When seawater flows through the island, the concentration of Chl a increases downstream because of rich nutrients (Li et al., 1998). Therefore, the construction of marine pastures within the range of 2−8 km downstream can make full use of the downstream water environment and have advantages in serving the construction of fishing pastures.
High spatial resolution optical satellite GF-1/6 PMS data, with the spatial resolution of 2 m, makes it possible to observe the variations of SG nearby Diaoyu Dao and its affiliated islands. Sea surface texture information nearby Diaoyu Dao and its affiliated islands was extracted through SG using GF-1 and GF-6 PMS images. New methods of SAV1-2 for texture information extraction based on SG were established and the surface texture change details induced by Diaoyu Dao and its affiliated islands were revealed.
The upstream shield effect appears on the west side of Diaoyu Dao and its affiliated islands where performances ripples with intervals of hundreds to thousands of metres extending wider than the island itself (Fig. 7). The westward shield area has characteristics of relatively low concentration of Chl a. The dorsal belly downstream of the island forms a sheltering area, where the SST decreases slowly and the Chl a concentration is as low as the upstream. As it gets further downstream from the island, turbulent flow like vortex streets is dominant and accompanied by high Chl a concentration and low SST (Figs 4 and 5).
The eastward Kuroshio interacts with Diaoyu Dao and its affiliated islands, and the current accumulates on the west side of the island and extends towards both north and south sides of the island, forming a pre-island effect similar to a shield in shape. Due to the westward shield effect upstream the island in Diaoyu Dao and its affiliated islands area, the vertical exchange of water flow in the adjacent downstream of the island is not sufficient that forms a refuge area behind the island. After that, in the vortex streets area, the exchange of water flow gradually enhances with significant water environmental parameters variations (such as SST and Chl a concentration) (Figs 4, 5 and 9).
The SAV methods of extracting sea surface texture using SG have global applicability and can be widely used in different sea areas with different water quality. This paper can provide reference for the protection and development of Diaoyu Dao and its affiliated islands and its surrounding waters. It is suggested that marine wind farm is beneficial to be laid out in the western waters of Diaoyu Dao and its affiliated islands to protect the islands, while marine pasture is beneficial to be arranged in the downstream of the eastern waters of Diaoyu Dao and its affiliated islands.

|
Aghav A S, Narkhede N S. 2017. Application-oriented approach to texture feature extraction using Grey Level Co-occurrence Matrix (GLCM). International Research Journal of Engineering and Technology, 4(5): 3498–3503
|
|
Aiazzi B, Baronti S, Lotti F, et al. 2009. A comparison between global and context-adaptive pansharpening of multispectral images. IEEE Geoscience and Remote Sensing Letters, 6(2): 302–306. doi: 10.1109/LGRS.2008.2012003
|
|
Akylas T R. 1984. On the excitation of long nonlinear water waves by a moving pressure distribution. Journal of Fluid Mechanics, 141: 455–466. doi: 10.1017/S0022112084000926
|
|
Alpers W. 1985. Theory of radar imaging of internal waves. Nature, 314(6008): 245–247. doi: 10.1038/314245a0
|
|
Anderson G P, Pukall B, Allred C L, et al. 1999. FLAASH and MODTRAN4: state-of-the-art atmospheric correction for hyperspectral data. In: Proceedings of 1999 IEEE Aerospace Conference. Snowmass: IEEE, 177–181
|
|
Arístegui J, Sangrá P, Hernández-León S, et al. 1994. Island-induced eddies in the Canary islands. Deep-Sea Research Part I: Oceanographic Research Papers, 41(10): 1509–1525. doi: 10.1016/0967-0637(94)90058-2
|
|
Assi G R S, Meneghini J R, Aranha J A P, et al. 2006. Experimental investigation of flow-induced vibration interference between two circular cylinders. Journal of Fluids and Structures, 22(6–7): 819–827
|
|
Babin S M, Carton J A, Dickey T D, et al. 2004. Satellite evidence of hurricane-induced phytoplankton blooms in an oceanic desert. Journal of Geophysical Research, 109(C3): C03043
|
|
Baines P G. 1977. Upstream influence and Long’s model in stratified flows. Journal of Fluid Mechanics, 82(1): 147–159. doi: 10.1017/S0022112077000573
|
|
Bao Qing, Wu Xiaofei, Li Jinxiao, et al. 2019. Outlook for El Niño and the Indian Ocean Dipole in autumn-winter 2018−2019. Chinese Science Bulletin, 64(1): 73–78. doi: 10.1360/N972018-00913
|
|
Bernardo N, Alcântara E, Watanabe F, et al. 2018. Glint removal assessment to estimate the remote sensing reflectance in inland waters with widely differing optical properties. Remote Sensing, 10(10): 1655. doi: 10.3390/rs10101655
|
|
Bréon F M, Deschamps P Y. 1993. Optical and physical parameter retrieval from POLDER measurements over the ocean using an analytical model. Remote Sensing of Environment, 43(2): 193–207. doi: 10.1016/0034-4257(93)90008-L
|
|
Cai Lina, Tang Danling, Levy G, et al. 2016. Remote sensing of the impacts of construction in coastal waters on suspended particulate matter concentration—the case of the Yangtze River delta, China. International Journal of Remote Sensing, 37(9): 2132–2147. doi: 10.1080/01431161.2015.1121302
|
|
Cai Lina, Zhou Minrui, Liu Jianqiang, et al. 2020. HY-1C observations of the impacts of islands on suspended sediment distribution in Zhoushan Coastal Waters, China. Remote Sensing, 12(11): 1766. doi: 10.3390/rs12111766
|
|
Caldeira R M A, Groom S, Miller P, et al. 2002. Sea-surface signatures of the island mass effect phenomena around Madeira Island, Northeast Atlantic. Remote Sensing of Environment, 80(2): 336–360. doi: 10.1016/S0034-4257(01)00316-9
|
|
Caldeira R M A, Marchesiello P, Nezlin N P, et al. 2005. Island wakes in the Southern California bight. Journal of Geophysical Research, 110(C11): C11012. doi: 10.1029/2004JC002675
|
|
Cardoso C, Caldeira R M A, Relvas P, et al. 2020. Islands as eddy transformation and generation hotspots: Cabo Verde case study. Progress in Oceanography, 184: 102271. doi: 10.1016/j.pocean.2020.102271
|
|
Carmo B S, Sherwin S J, Bearman P W, et al. 2011. Flow-induced vibration of a circular cylinder subjected to wake interference at low Reynolds number. Journal of Fluids and Structures, 27(4): 503–522. doi: 10.1016/j.jfluidstructs.2011.04.003
|
|
Carr J R, de Miranda F P. 1998. The semivariogram in comparison to the co-occurrence matrix for classification of image texture. IEEE Transactions on Geoscience and Remote Sensing, 36(6): 1945–1952. doi: 10.1109/36.729366
|
|
Chang Ming-Huei, Jan Sen, Liu Chih-Lun, et al. 2019. Observations of island wakes at high rossby numbers: evolution of submesoscale vortices and free shear layers. Journal of Physical Oceanography, 49(11): 2997–3016. doi: 10.1175/JPO-D-19-0035.1
|
|
Chao S Y. 1990. Circulation of the East China Sea, a numerical study. Journal of Oceanography, 46(6): 273–295. doi: 10.1007/BF02123503
|
|
Chen Chen-Tung Arthur, Ruo R, Paid S C, et al. 1995. Exchange of water masses between the East China Sea and the Kuroshio off northeastern Taiwan. Continental Shelf Research, 15(1): 19–39. doi: 10.1016/0278-4343(93)E0001-O
|
|
Chen Shengbo, Useya J, Mugiyo H. 2020. Decision-level fusion of Sentinel-1 SAR and Landsat 8 OLI texture features for crop discrimination and classification: case of Masvingo, Zimbabwe. Heliyon, 6(11): e05358. doi: 10.1016/j.heliyon.2020.e05358
|
|
Chen Qi, Yu Ruihong, Hao Yanling, et al. 2018. A new method for mapping aquatic vegetation especially underwater vegetation in lake ulansuhai using GF-1 satellite data. Remote Sensing, 10(8): 1279. doi: 10.3390/rs10081279
|
|
Chern Ching-Sheng, Wang Joe. 1989. On the water masses at northern offshore area of Taiwan. Acta Oceanographical Taiwanica, 22: 14–32
|
|
Choi Y C, Kim J S. 2008. Distribution of rhysico-chemical characteristics on the development of marine ranching program in the Chagwi-Do Coastal Waters, Jeju Island. Journal of the Korean Society for Marine Environment & Energy, 11(2): 105–112
|
|
Chu Ruijian, Richard N, Fernandez-Maloigne C, et al. 2019. Relative spectral difference occurrence matrix: a metrological spectral-spatial feature for hyperspectral texture analysis. Color and Imaging Conference, 27: art00069
|
|
Chuang Wen-Ssn, Li Hsien-Wen, Tang T Y, et al. 1993. Observations of the countercurrent on the inshore side of the Kuroshio northeast of Taiwan. Journal of Oceanography, 49(5): 581–592. doi: 10.1007/BF02237464
|
|
Coutis P F, Middleton J H. 2002. The physical and biological impact of a small island wake in the deep ocean. Deep-Sea Research Part I: Oceanographic Research Papers, 49(8): 1341–1361. doi: 10.1016/S0967-0637(02)00029-8
|
|
Cox C, Munk W. 1954. Measurement of the roughness of the sea surface from photographs of the sun’s glitter. Journal of the Optical Society of America, 44(11): 838–850. doi: 10.1364/JOSA.44.000838
|
|
Dong Changming, McWilliams J C. 2007. A numerical study of island wakes in the Southern California Bight. Continental Shelf Research, 27(6): 1233–1248
|
|
Eckermann S D, Preusse P. 1999. Global measurements of stratospheric mountain waves from space. Science, 286(5444): 1534–1537. doi: 10.1126/science.286.5444.1534
|
|
Ehlers M. 2008. Multi-image fusion in remote sensing: spatial enhancement vs. spectral characteristics preservation. In: Proceedings of the 4th International Symposium on Visual Computing. Las Vegas: Springer, 75–84
|
|
Eliassen A. 1980. Balanced motion of a stratified, rotating fluid induced by bottom topography. Tellus, 32(6): 537–547. doi: 10.3402/tellusa.v32i6.10607
|
|
Fu Lee-Lueng, Holt B. 1983. Some examples of detection of oceanic mesoscale eddies by the SEASAT synthetic-aperture radar. Journal of Geophysical Research, 88(C3): 1844–1852. doi: 10.1029/JC088iC03p01844
|
|
Gao Wenjun, Nelias D, Liu Zhenxia, et al. 2018. Numerical investigation of flow around one finite circular cylinder with two free ends. Ocean Engineering, 156: 373–380. doi: 10.1016/j.oceaneng.2018.03.020
|
|
Gerrard J H. 1966. The mechanics of the formation region of vortices behind bluff bodies. Journal of Fluid Mechanics, 25(2): 401–413. doi: 10.1017/S0022112066001721
|
|
Gonzalez R C, Woods R E. 1981. Digital image processing. IEEE Transactions on Pattern Analysis and Machine Intelligence, 3(2): 242–243
|
|
Gordon H R. 1997. Atmospheric correction of ocean color imagery in the Earth Observing System era. Journal of Geophysical Research, 102(D14): 17081–17106. doi: 10.1029/96JD02443
|
|
Gordon H R, Wang Menghua. 1992. Surface-roughness considerations for atmospheric correction of ocean color sensors. 1: the Rayleigh-scattering component. Applied Optics, 31(21): 4247–4260. doi: 10.1364/AO.31.004247
|
|
Guo Xinyu, Yanagi T. 1998. Three-dimensional structure of tidal current in the East China Sea and the Yellow Sea. Journal of Oceanography, 54(6): 651–668. doi: 10.1007/BF02823285
|
|
Hamner W M, Hauri I R. 1981. Effects of island mass: water flow and plankton pattern around a reef in the Great Barrier Reef Lagoon, Australia. Limnology and Oceanography, 26(6): 1084–1102. doi: 10.4319/lo.1981.26.6.1084
|
|
Han Zhaolong, Zhou Dai, Malla A, et al. 2018. Wake-induced vibration interference between a fixed square cylinder and a 2-DOF downstream square cylinder at low Reynolds numbers. Ocean Engineering, 164: 698–711. doi: 10.1016/j.oceaneng.2018.07.007
|
|
Haralick R M. 1979. Statistical and structural approaches to texture. Proceedings of the IEEE, 67(5): 786–804. doi: 10.1109/PROC.1979.11328
|
|
Haralick R M, Shanmugam K, Dinstein I. 1973. Textural features for image classification. IEEE Transactions on Systems, Man, and Cybernetics, SMC-3(6): 610–621
|
|
He Youhai, White W B. 1988. Interannual variability in the structure of the Kuroshio front along the western boundary of the North Pacific Ocean associated with the 1982 ENSO event. GeoJournal, 16(1): 53–63. doi: 10.1007/BF02626372
|
|
Hochberg E J, Andrefouet S, Tyler M R. 2003. Sea surface correction of high spatial resolution Ikonos images to improve bottom mapping in near-shore environments. IEEE Transactions on Geoscience and Remote Sensing, 41(7): 1724–1729. doi: 10.1109/TGRS.2003.815408
|
|
Hsu Po-Chun, Chang Ming-Huei, Lin Chen-Chih, et al. 2017. Investigation of the island-induced ocean vortex train of the Kuroshio Current using satellite imagery. Remote Sensing of Environment, 193: 54–64. doi: 10.1016/j.rse.2017.02.025
|
|
Hsu Po-Chun, Cheng Kai-Ho, Jan Sen, et al. 2019. Vertical structure and surface patterns of Green Island wakes induced by the Kuroshio. Deep-Sea Research Part I: Oceanographic Research Papers, 143: 1–16. doi: 10.1016/j.dsr.2018.11.002
|
|
Hu Shineng, Fedorov A V. 2019. The extreme El Niño of 2015−2016: the role of westerly and easterly wind bursts, and preconditioning by the failed 2014 event. Climate Dynamics, 52(12): 7339–7357. doi: 10.1007/s00382-017-3531-2
|
|
Hu Dunxin, Wu Lixin, Cai Wenju, et al. 2015. Pacific western boundary currents and their roles in climate. Nature, 522(7556): 299–308. doi: 10.1038/nature14504
|
|
Huang Ting-Hsuan, Chen Chen-Tung Arthur, Zhang Wenzhou, et al. 2015. Varying intensity of Kuroshio intrusion into Southeast Taiwan Strait during ENSO events. Continental Shelf Research, 103: 79–87. doi: 10.1016/j.csr.2015.04.021
|
|
Huang Shuyi, Liu Jianqiang, Cai Lina, et al. 2020. Satellites HY-1C and landsat 8 combined to observe the influence of bridge on sea surface temperature and suspended sediment concentration in Hangzhou Bay, China. Water, 12(9): 2595. doi: 10.3390/w12092595
|
|
Hwang Cheinway, Kao Ricky. 2002. TOPEX/POSEIDON-derived space-time variations of the Kuroshio Current: applications of a gravimetric geoid and wavelet analysis. Geophysical Journal International, 151(3): 835–847. doi: 10.1046/j.1365-246X.2002.01811.x
|
|
Jackson C R, Alpers W. 2010. The role of the critical angle in brightness reversals on sunglint images of the sea surface. Journal of Geophysical Research, 115(C9): C09019
|
|
Jebali H, Richard N, Chatoux H, et al. 2018. Relocated colour contrast occurrence matrix and adapted similarity measure for colour texture retrieval. In: Proceedings of the 19th International Conference on Advanced Concepts for Intelligent Vision Systems. Poitiers: Springer, 609–619
|
|
Jia Kun, Liang Shunlin, Gu Xingfa, et al. 2016. Fractional vegetation cover estimation algorithm for Chinese GF-1 wide field view data. Remote Sensing of Environment, 177: 184–191. doi: 10.1016/j.rse.2016.02.019
|
|
Kay S, Hedley J D, Lavender S. 2009. Sun glint correction of high and low spatial resolution images of aquatic scenes: a review of methods for visible and near-infrared wavelengths. Remote Sensing, 1(4): 697–730. doi: 10.3390/rs1040697
|
|
Kay S, Hedley J, Lavender S. 2013. Sun glint estimation in marine satellite images: a comparison of results from calculation and radiative transfer modeling. Applied Optics, 52(23): 5631–5639. doi: 10.1364/AO.52.005631
|
|
Kondo M. 1985. Oceanographic investigations of fishing grounds in the East China Sea and the Yellow Sea. I. Characteristics of the mean temperature and salinity distributions measured at 50 m and near the bottom. Bulletin of Seikai National Fisheries Research Institute, 62: 19–66
|
|
Koumoutsakos P, Leonard A. 1995. High-resolution simulations of the flow around an impulsively started cylinder using vortex methods. Journal of Fluid Mechanics, 296: 1–38. doi: 10.1017/S0022112095002059
|
|
Kutser T, Vahtmäe E, Praks J. 2009. A sun glint correction method for hyperspectral imagery containing areas with non-negligible water leaving NIR signal. Remote Sensing of Environment, 113(10): 2267–2274. doi: 10.1016/j.rse.2009.06.016
|
|
Lamura A, Gompper G. 2002. Numerical study of the flow around a cylinder using multi-particle collision dynamics. The European Physical Journal E, 9(5): 477–485
|
|
Larock B E. 1996. Topographic effects in stratified flows. Eos, Transactions American Geophysical Union, 77(16): 151
|
|
Larsen L H, Cannon G A, Choi B H. 1985. East China Sea tide currents. Continental Shelf Research, 4(1–2): 77–103
|
|
Levine A F Z, McPhaden M J. 2016. How the July 2014 easterly wind burst gave the 2015–2016 El Niño a head start. Geophysical Research Letters, 43(12): 6503–6510. doi: 10.1002/2016GL069204
|
|
Li Xiaofeng, Dong Changming, Clemente-Colón P, et al. 2004. Synthetic aperture radar observation of the sea surface imprints of upstream atmospheric solitons generated by flow impeded by an island. Journal of Geophysical Research, 109(C2): C02016
|
|
Li Qian, Li Guangxue, Chen Minte, et al. 2020. New insights into Kuroshio current evolution since the last deglaciation based on paired organic paleothermometers from the middle Okinawa Trough. Paleoceanography and Paleoclimatology, 35(12): e2020PA004140
|
|
Li Guangxue, Wei Helong, Yue Shuhong, et al. 1998. Sedimentation in the Yellow River delta, part II: suspended sediment dispersal and deposition on the subaqueous delta. Marine Geology, 149(1–4): 113–131
|
|
Liu Zhiqiang, Gan Jianping, Hu Jianyu, et al. 2021. Progress on circulation dynamics in the East China Sea and southern Yellow Sea: origination, pathways, and destinations of shelf currents. Progress in Oceanography, 193: 102553. doi: 10.1016/j.pocean.2021.102553
|
|
Liu Kon-Kee, Gong Gwo-Ching, Lin Saulwood, et al. 1992. The year-round upwelling at the shelf break near the northern tip of Taiwan as evidenced by chemical hydrography. Terrestrial, Atmospheric and Oceanic Sciences, 3(3): 243–276
|
|
Liu Guo, Wang Yizhe, Guo Li, et al. 2020. Research on fusion of GF-6 imagery and quality evaluation. E3S Web of Conferences, 165: 03016. doi: 10.1051/e3sconf/202016503016
|
|
Lu Yingcheng, Sun Shaojie, Zhang Minwei, et al. 2016. Refinement of the critical angle calculation for the contrast reversal of oil slicks under sunglint. Journal of Geophysical Research, 121(1): 148–161. doi: 10.1002/2015JC011001
|
|
Lyzenga D R, Malinas N P, Tanis F J. 2006. Multispectral bathymetry using a simple physically based algorithm. IEEE Transactions on Geoscience and Remote Sensing, 44(8): 2251–2259. doi: 10.1109/TGRS.2006.872909
|
|
Mao Kebiao, Qin Zhihao, Shi Jiancheng, et al. 2005. A practical split-window algorithm for retrieving land-surface temperature from MODIS data. International Journal of Remote Sensing, 26(15): 3181–3204. doi: 10.1080/01431160500044713
|
|
Marceau D J, Howarth P J, Dubois J M, et al. 1990. Evaluation of the grey-level co-occurrence matrix method for land-cover classification using SPOT imagery. IEEE Transactions on Geoscience and Remote Sensing, 28(4): 513–519. doi: 10.1109/TGRS.1990.572937
|
|
Materka A, Strzelecki M. 1998. Texture analysis methods—a review. Brussels: Technical University of Lodz, Institute of Electronics
|
|
Matthews J. 2005. Stereo observation of lakes and coastal zones using ASTER imagery. Remote Sensing of Environment, 99(1–2): 16–30
|
|
Melsheimer C, Keong K L. 2022. Sun glitter in spot images and the visibility of oceanic phenomena. In: Proceedings of the 22nd Asian Conference on Remote Sensing. Singapore: Center for Remote Imaging, Sensing and Processing, National University of Singapore
|
|
Morel A, Gentili B. 1993. Diffuse reflectance of oceanic waters. II. Bidirectional aspects. Applied Optics, 32(33): 6864–6879. doi: 10.1364/AO.32.006864
|
|
Morel A, Gentili B. 1996. Diffuse reflectance of oceanic waters. III. Implication of bidirectionality for the remote-sensing problem. Applied Optics, 35(24): 4850–4862. doi: 10.1364/AO.35.004850
|
|
Nematollahi A, Tachie M F. 2018. Time-resolved PIV measurement of influence of upstream roughness on separated and reattached turbulent flows over a forward-facing step. AIP Advances, 8(10): 105110. doi: 10.1063/1.5063455
|
|
Nikam B R, Ibragimov F, Chouksey A, et al. 2016. Retrieval of land surface temperature from Landsat 8 TIRS for the command area of Mula irrigation project. Environmental Earth Sciences, 75(16): 1169. doi: 10.1007/s12665-016-5952-3
|
|
Oh T Y, Cha H K, Chang D S, et al. 2010. Seasonal variation and species composition of fishes communities in artificial reef unit at marine ranching area in the coastal waters off Jeju Island, Korea. Journal of the Korean Society of Fisheries and Ocean Technology, 46(2): 139–147. doi: 10.3796/KSFT.2010.46.2.139
|
|
Oka E, Kawabe M. 1998. Characteristics of variations of water properties and density structure around the Kuroshio in the East China Sea. Journal of Oceanography, 54(6): 605–617. doi: 10.1007/BF02823281
|
|
Oliveira P J. 2001. Method for time-dependent simulations of viscoelastic flows: vortex shedding behind cylinder. Journal of Non-Newtonian Fluid Mechanics, 101(1–3): 113–137
|
|
Onea F, Rusu L. 2015. Coastal impact of a hybrid marine farm operating close to the Sardinia Island. In: Proceedings of OCEANS 2015. Genova: IEEE, 1–7
|
|
Pacifici F, Longbotham N, Emery W J. 2014. The importance of physical quantities for the analysis of multitemporal and multiangular optical very high spatial resolution images. IEEE Transactions on Geoscience and Remote Sensing, 52(10): 6241–6256. doi: 10.1109/TGRS.2013.2295819
|
|
Pakdel P, McKinley G H. 1996. Elastic instability and curved streamlines. Physical Review Letters, 77(12): 2459–2462. doi: 10.1103/PhysRevLett.77.2459
|
|
Patoine A, Warn T. 1982. The interaction of long, quasi-stationary baroclinic waves with topography. Journal of the Atmospheric Sciences, 39(5): 1018–1025. doi: 10.1175/1520-0469(1982)039<1018:TIOLQS>2.0.CO;2
|
|
Pattiaratchi C, James A, Collins M. 1987. Island wakes and headland eddies: a comparison between remotely sensed data and laboratory experiments. Journal of Geophysical Research, 92(C1): 783–794. doi: 10.1029/JC092iC01p00783
|
|
Peng Jida, Zhang Chungui. 2019. Remote sensing monitoring of vegetation coverage by GF-1 satellite: a case study in Xiamen City. Remote Sensing for Land & Resources (in Chinese), 31(4): 137–142
|
|
Petersen J K, Malm T. 2006. Offshore windmill farms: threats to or possibilities for the marine environment. Ambio: A Journal of the Human Environment, 35(2): 75–80. doi: 10.1579/0044-7447(2006)35[75:OWFTTO]2.0.CO;2
|
|
Puissant A, Hirsch J, Weber C. 2005. The utility of texture analysis to improve per-pixel classification for high to very high spatial resolution imagery. International Journal of Remote Sensing, 26(4): 733–745. doi: 10.1080/01431160512331316838
|
|
Punt M J, Groeneveld R A, van Ierland E C, et al. 2009. Spatial planning of offshore wind farms: a windfall to marine environmental protection?. Ecological Economics, 69(1): 93–103. doi: 10.1016/j.ecolecon.2009.07.013
|
|
Qin Boyang, Salipante P F, Hudson S D, et al. 2019. Upstream vortex and elastic wave in the viscoelastic flow around a confined cylinder. Journal of Fluid Mechanics, 864: R2. doi: 10.1017/jfm.2019.73
|
|
Qiu Bo, Imasato N. 1990. A numerical study on the formation of the Kuroshio Counter Current and the Kuroshio Branch Current in the East China Sea. Continental Shelf Research, 10(2): 165–184. doi: 10.1016/0278-4343(90)90028-K
|
|
Qiu Bo, Joyce T M. 1992. Interannual variability in the mid- and low-latitude western North Pacific. Journal of Physical Oceanography, 22(9): 1062–1079. doi: 10.1175/1520-0485(1992)022<1062:IVITMA>2.0.CO;2
|
|
Qiu Bo, Lukas R. 1996. Seasonal and interannual variability of the North Equatorial Current, the Mindanao Current, and the Kuroshio along the Pacific western boundary. Journal of Geophysical Research, 101(C5): 12315–12330. doi: 10.1029/95JC03204
|
|
Rascle N, Molemaker J, Marié L, et al. 2017. Intense deformation field at oceanic front inferred from directional sea surface roughness observations. Geophysical Research Letters, 44(11): 5599–5608. doi: 10.1002/2017GL073473
|
|
Rascle N, Nouguier F, Chapron B, et al. 2016. Surface roughness changes by finescale current gradients: properties at multiple azimuth view angles. Journal of Physical Oceanography, 46(12): 3681–3694. doi: 10.1175/JPO-D-15-0141.1
|
|
Ren Baiyang, Wen Qiang, Zhou Huizhen, et al. 2018. Extraction and analysis of major autumn crops in JINGXIAN county based on multi-temporal GF-1 remote sensing image and object-oriented. International Archives of the Photogrammetry, Remote Sensing and Spatial Information Sciences, XLII-3: 1473–1480
|
|
Roy S K, Chanda B, Chaudhuri B B, et al. 2018. Local directional ZigZag pattern: a rotation invariant descriptor for texture classification. Pattern Recognition Letters, 108: 23–30. doi: 10.1016/j.patrec.2018.02.027
|
|
Şahin Ç, Atalık K. 2019. Comparison of inelastic and elastic non-Newtonian effects on the flow around a circular cylinder in periodic vortex shedding. Journal of Non-Newtonian Fluid Mechanics, 263: 1–14. doi: 10.1016/j.jnnfm.2018.11.004
|
|
Schott J, Gerace A, Brown S, et al. 2012. Simulation of image performance characteristics of the landsat data continuity mission (LDCM) thermal infrared sensor (TIRS). Remote Sensing, 4(8): 2477–2491. doi: 10.3390/rs4082477
|
|
Shabat A M, Tapamo J R. 2017. A comparative study of the use of local directional pattern for texture-based informal settlement classification. Journal of Applied Research and Technology, 15(3): 250–258. doi: 10.1016/j.jart.2016.12.009
|
|
Shen S S. 1993. A Course on Nonlinear Waves. Dordrecht: Kluwer Academic
|
|
Sheremet V A. 2010. Hysteresis of a western boundary current leaping across a gap. Journal of Physical Oceanography, 31(5): 1247–1259
|
|
Strykowski P J, Sreenivasan K R. 1990. On the formation and suppression of vortex ‘shedding’ at low Reynolds numbers. Journal of Fluid Mechanics, 218: 71–107. doi: 10.1017/S0022112090000933
|
|
Sturm B. 1980. The atmospheric correction of remotely sensed data and the quantitative determination of suspended matter in marine water surface layers. In: Cracknell A P, ed. Remote Sensing in Oceanography and Hydrology. Chichester: Ellis Horwood
|
|
Sun Xiangping, Wang Jin, Chen Ronghua, et al. 2011. Directional gaussian filter-based LBP descriptor for textural image classification. Procedia Engineering, 15: 1771–1779. doi: 10.1016/j.proeng.2011.08.330
|
|
Tang T Y, Hsueh Y, Yang Y J, et al. 1999. Continental slope flow northeast of Taiwan. Journal of Physical Oceanography, 29(6): 1353–1362. doi: 10.1175/1520-0485(1999)029<1353:CSFNOT>2.0.CO;2
|
|
Tang T Y, Tai J H, Yang Y J. 2000. The flow pattern north of Taiwan and the migration of the Kuroshio. Continental Shelf Research, 20(4–5): 349–371
|
|
Teinturier S, Stegner A, Didelle H, et al. 2010. Small-scale instabilities of an island wake flow in a rotating shallow-water layer. Dynamics of Atmospheres and Oceans, 49(1): 1–24. doi: 10.1016/j.dynatmoce.2008.10.006
|
|
Tritton D J. 1959. Experiments on the flow past a circular cylinder at low reynolds numbers. Journal of Fluid Mechanics, 6(4): 547–567. doi: 10.1017/S0022112059000829
|
|
Unger J, Hager W H. 2007. Down-flow and horseshoe vortex characteristics of sediment embedded bridge piers. Experiments in Fluids, 42(1): 1–19
|
|
van Dyke M, Widnall S. 1983. An album of fluid motion. Journal of Applied Mechanics, 50(2): 475
|
|
Vassiliou A A, Boulianne M, Blais J A R. 1988. On the application of averaging median filters in remote sensing. IEEE Transactions on Geoscience and Remote Sensing, 26(6): 832–838. doi: 10.1109/36.7714
|
|
Verma V, Muttoo S K, Singh V B. 2020. Multiclass malware classification via first- and second-order texture statistics. Computers & Securitya, 97: 101895
|
|
Vermote E F, El Saleous N, Justice C O, et al. 1997. Atmospheric correction of visible to middle-infrared EOS-MODIS data over land surfaces: background, operational algorithm and validation. Journal of Geophysical Research, 102(D14): 17131–17141. doi: 10.1029/97JD00201
|
|
Wang Menghua, Bailey S W. 2001. Correction of sun glint contamination on the SeaWiFS ocean and atmosphere products. Applied Optics, 40(27): 4790–4798. doi: 10.1364/AO.40.004790
|
|
Wang Menghua, Isaacman A, Franz B A, et al. 2002. Ocean-color optical property data derived from the Japanese Ocean Color and Temperature Scanner and the French Polarization and Directionality of the Earth’s Reflectances: a comparison study. Applied Optics, 41(6): 974–990. doi: 10.1364/AO.41.000974
|
|
Wang Lei, Lu Yao, Yao Yunlong. 2019a. Comparison of three algorithms for the retrieval of land surface temperature from landsat 8 images. Sensors, 19(22): 5049. doi: 10.3390/s19225049
|
|
Wang Fei, Qin Zhihao, Song Caiying, et al. 2015. An improved mono-window algorithm for land surface temperature retrieval from landsat 8 thermal infrared sensor data. Remote Sensing, 7(4): 4268–4289. doi: 10.3390/rs70404268
|
|
Wang Shengke, Yu Changyin, Sun Yujuan, et al. 2018a. Specular reflection removal of ocean surface remote sensing images from UAVs. Multimedia Tools and Applications, 77(9): 11363–11379. doi: 10.1007/s11042-017-5551-7
|
|
Wang Dazhuang, Zhao Liaoying, Zhang Huaguo, et al. 2019b. On optimal imaging angles in multi-angle ocean sun glitter remote-sensing platforms to observe sea surface roughness. Sensors, 19(10): 2268. doi: 10.3390/s19102268
|
|
Wang Xiaofeng, Zhou Chaowei, Feng Xiaoming, et al. 2018b. Testing the efficiency of using high-resolution data from GF-1 in land cover classifications. IEEE Journal of Selected Topics in Applied Earth Observations and Remote Sensing, 11(9): 3051–3061. doi: 10.1109/JSTARS.2018.2850888
|
|
Wolanski E, Hamner W M. 1988. Topographically controlled fronts in the ocean and their biological influence. Science, 241(4862): 177–181. doi: 10.1126/science.241.4862.177
|
|
Wolanski E, Imberger J, Heron M L. 1984. Island wakes in shallow coastal waters. Journal of Geophysical Research, 89(C6): 10553–10569. doi: 10.1029/JC089iC06p10553
|
|
Wu T Y T. 1987. Generation of upstream advancing solitons by moving disturbances. Journal of Fluid Mechanics, 184: 75–99. doi: 10.1017/S0022112087002817
|
|
Wu Chau-Ron. 2013. Interannual modulation of the Pacific Decadal Oscillation (PDO) on the low-latitude western North Pacific. Progress in Oceanography, 110: 49–58. doi: 10.1016/j.pocean.2012.12.001
|
|
Wu Chau-Ron, Lu Hung-Fu, Chao Shenn-Yu. 2008a. A numerical study on the formation of upwelling off northeast Taiwan. Journal of Geophysical Research, 113(C8): C08025
|
|
Wu Peihao, Ma Haoran. 2020. Study on landcover classification in Baodi District Tianjin City based on Gaofen-1 satellite image. Tianjin Agricultural Sciences (in Chinese), 26(2): 29–33
|
|
Wu Junyan, Xiao Jingguo, Cheng Jun, et al. 2008b. Analysis of tide types distributing in China coastal areas. In: Chinese Society for Geodesy Photogrammetry and Cartography (in Chinese). Guilin: China Society of Surveying and Mapping
|
|
Yang Kang, Zhang Huaguo, Fu Bin, et al. 2015. Observation of submarine sand waves using ASTER stereo sun glitter imagery. International Journal of Remote Sensing, 36(22): 5576–5592. doi: 10.1080/01431161.2015.1101652
|
|
Yao Ru, Cai Lina, Liu Jianqiang, et al. 2020. GF-1 satellite observations of suspended sediment injection of Yellow River Estuary, China. Remote Sensing, 12(19): 3126. doi: 10.3390/rs12193126
|
|
Yoder J A, Ackleson S G, Barber R T, et al. 1994. A line in the sea. Nature, 371(6499): 689–692. doi: 10.1038/371689a0
|
|
Yu Xiaolei, Guo Xulin, Wu Zhaocong. 2014. Land surface temperature retrieval from landsat 8 TIRS—comparison between radiative transfer equation-based method, split window algorithm and single channel method. Remote Sensing, 6(10): 9829–9852. doi: 10.3390/rs6109829
|
|
Yu Lianfu, Li Jiansheng, Ling Lanying, et al. 2004. Preliminary studies on the distribution characteristics of juvenile fish in the southern part of East China Sea in spring and its relationship with environment. Journal of Fisheries of China (in Chinese), 28(4): 401–406
|
|
Zametaev V B, Gorbushin A R, Lipatov I I. 2019. Steady secondary flow in a turbulent mixing layer. International Journal of Heat and Mass Transfer, 132: 655–661. doi: 10.1016/j.ijheatmasstransfer.2018.12.012
|
|
Zdravkovich M M. 1977. Review of flow interference between two circular cylinders in various arrangements. Journal of Fluids Engineering, 99(4): 618–633. doi: 10.1115/1.3448871
|
|
Zdravkovich M M. 1987. The effects of interference between circular cylinders in cross flow. Journal of Fluids and Structures, 1(2): 239–261. doi: 10.1016/S0889-9746(87)90355-0
|
|
Zhang Hao, Wang Menghua. 2010. Evaluation of sun glint models using MODIS measurements. Journal of Quantitative Spectroscopy and Radiative Transfer, 111(3): 492–506. doi: 10.1016/j.jqsrt.2009.10.001
|
|
Zheng Quanan. 2017. Satellite SAR Detection of Sub-Mesoscale Ocean Dynamic Processes. New Jersey: World Scientific
|
|
Zheng Quanan, Shen S, Yuan Yeli, et al. 2004. Technical note: evidence of the coexistence of upstream and downstream solitary wavetrains in the real atmosphere. International Journal of Remote Sensing, 25(21): 4433–4440. doi: 10.1080/01431160310001609716
|
|
Zheng Quanan, Yan Xiaohai, Liu W T, et al. 1998. A solitary wave packet in the atmosphere observed from space. Geophysical Research Letters, 25(19): 3559–3562. doi: 10.1029/98GL02319
|
|
Zheng Chongwei, You Xiaobo, Pan Jing, et al. 2014. Feasibility analysis on the wind energy and wave energy resources exploitation in Fishing Islands and Scarborough Shoal. Marine Forecasts (in Chinese), 31(1): 49–57
|
|
Zheng Zhewen, Zheng Quanan. 2014. Variability of island-induced ocean vortex trains, in the Kuroshio region southeast of Taiwan Island. Continental Shelf Research, 81: 1–6. doi: 10.1016/j.csr.2014.02.010
|
|
Zheng Chongwei, Zhuang Hui, Li Xin, et al. 2012. Wind energy and wave energy resources assessment in the East China Sea and South China Sea. Science China: Technological Sciences, 55(1): 163–173. doi: 10.1007/s11431-011-4646-z
|
|
Zhou Peng, Song Xiuxian, Yuan Yongquan, et al. 2018. Water mass analysis of the East China Sea and interannual variation of Kuroshio subsurface water intrusion through an optimum multiparameter method. Journal of Geophysical Research, 123(5): 3723–3738. doi: 10.1029/2018JC013882
|
|
Zhou Qingbo, Yu Qiangyi, Liu Jia, et al. 2017. Perspective of Chinese GF-1 high-resolution satellite data in agricultural remote sensing monitoring. Journal of Integrative Agriculture, 16(2): 242–251. doi: 10.1016/S2095-3119(16)61479-X
|
Figures(9) / Tables(2)

Supported by:
Beijing Renhe Information Technology Co. Ltd

Lina Cai, Xiaoqi Jiang, Xiaojun Yan, Yan Bai, Jianqiang Liu, Menghan Yu, Rong Tang, Jingjing Jiang. Study of coexisting upstream solitary wave packet and downstream wakes induced by Diaoyu Dao and its affiliated islands detected by satellite sun glitter[J]. Acta Oceanologica Sinica, 2023, 42(4): 1-15. doi: 10.1007/s13131-022-2099-9

| Sensor | Band | Wavelength/μm | Resolution/m | Date |
| GF-6PMS | Band1 (blue) | 0.45−0.52 | 8 | Sept. 8, 2019 |
| Band2 (green) | 0.52−0.60 | 8 | Sept. 8, 2019 | |
| Band3 (red) | 0.63−0.69 | 8 | Sept. 8, 2019 | |
| Band4 (NIR) | 0.76−0.90 | 8 | Sept. 8, 2019 | |
| PAN | 0.45−0.90 | 2 | Sept. 8, 2019 | |
| GF-1PMS1/PMS2 | Band1 (blue) | 0.45−0.52 | 8 | Aug. 25, 2016 |
| Band2 (green) | 0.52−0.59 | 8 | Aug. 25, 2016 | |
| Band3 (red) | 0.63−0.69 | 8 | Aug. 25, 2016 | |
| Band4 (NIR) | 0.77−0.89 | 2 | Jul. 31, 2019 | |
| PAN | 0.45−0.90 | 2 | Jul. 31, 2019 | |
| Landsat-8 TIRS | 100 | Jul. 17, 2014 | ||
| Band10 (TIR) | 10.60−11.19 | 100 | Aug. 10, 2017 | |
| 10.60−11.19 | 100 | Jun. 26, 2018 | ||
| Band11 (TIR) | 11.50−12.51 | 100 | Jul. 28, 2018 | |
| 11.50−12.51 | 100 | Dec. 3, 2018 | ||
| HY-1CCZI | Band1 | 0.421−0.500 | 50 | Oct. 3, 2020 |
| Band2 | 0.517−0.598 | 50 | Oct. 3, 2020 | |
| Band3 | 0.608−0.690 | 50 | Oct. 3, 2020 | |
| Band4 | 0.761−0.891 | 50 | Oct. 3, 2020 | |
| Note: PMS, Panchromatic and Multispectral Sensors; TIRS, Thermal Infrared Sensor; CZI, Coastal Zone Imager; NIR, near-infrared; PAN, panchromatic band. | ||||
DownLoad:
CSV
| Data introduction | Data acquisition time |
| Seasonal variation | summer: Jul. 2014; autumn: Oct. 2014; winter: Jan. 2015; spring: Apr. 2015 |
| Inter-annual variation | Aug. 2012; Aug. 2013; Aug. 2014; Aug. 2015 |
DownLoad:
CSV
| Sensor | Band | Wavelength/μm | Resolution/m | Date |
| GF-6PMS | Band1 (blue) | 0.45−0.52 | 8 | Sept. 8, 2019 |
| Band2 (green) | 0.52−0.60 | 8 | Sept. 8, 2019 | |
| Band3 (red) | 0.63−0.69 | 8 | Sept. 8, 2019 | |
| Band4 (NIR) | 0.76−0.90 | 8 | Sept. 8, 2019 | |
| PAN | 0.45−0.90 | 2 | Sept. 8, 2019 | |
| GF-1PMS1/PMS2 | Band1 (blue) | 0.45−0.52 | 8 | Aug. 25, 2016 |
| Band2 (green) | 0.52−0.59 | 8 | Aug. 25, 2016 | |
| Band3 (red) | 0.63−0.69 | 8 | Aug. 25, 2016 | |
| Band4 (NIR) | 0.77−0.89 | 2 | Jul. 31, 2019 | |
| PAN | 0.45−0.90 | 2 | Jul. 31, 2019 | |
| Landsat-8 TIRS | 100 | Jul. 17, 2014 | ||
| Band10 (TIR) | 10.60−11.19 | 100 | Aug. 10, 2017 | |
| 10.60−11.19 | 100 | Jun. 26, 2018 | ||
| Band11 (TIR) | 11.50−12.51 | 100 | Jul. 28, 2018 | |
| 11.50−12.51 | 100 | Dec. 3, 2018 | ||
| HY-1CCZI | Band1 | 0.421−0.500 | 50 | Oct. 3, 2020 |
| Band2 | 0.517−0.598 | 50 | Oct. 3, 2020 | |
| Band3 | 0.608−0.690 | 50 | Oct. 3, 2020 | |
| Band4 | 0.761−0.891 | 50 | Oct. 3, 2020 | |
| Note: PMS, Panchromatic and Multispectral Sensors; TIRS, Thermal Infrared Sensor; CZI, Coastal Zone Imager; NIR, near-infrared; PAN, panchromatic band. | ||||
| Data introduction | Data acquisition time |
| Seasonal variation | summer: Jul. 2014; autumn: Oct. 2014; winter: Jan. 2015; spring: Apr. 2015 |
| Inter-annual variation | Aug. 2012; Aug. 2013; Aug. 2014; Aug. 2015 |
 DownLoad:


 DownLoad: