Hongbin Han, Ruobing Wen, Hui Wang, Sheng Zhao. Comparison of growth and nutrient uptake capacities of three dominant species of Qinhuangdao green tides[J]. Acta Oceanologica Sinica, 2023, 42(4): 114-123. doi: 10.1007/s13131-022-2100-7
Citation:
Hongbin Han, Ruobing Wen, Hui Wang, Sheng Zhao. Comparison of growth and nutrient uptake capacities of three dominant species of Qinhuangdao green tides[J]. Acta Oceanologica Sinica, 2023, 42(4): 114-123. doi: 10.1007/s13131-022-2100-7
Hongbin Han, Ruobing Wen, Hui Wang, Sheng Zhao. Comparison of growth and nutrient uptake capacities of three dominant species of Qinhuangdao green tides[J]. Acta Oceanologica Sinica, 2023, 42(4): 114-123. doi: 10.1007/s13131-022-2100-7
Citation:
Hongbin Han, Ruobing Wen, Hui Wang, Sheng Zhao. Comparison of growth and nutrient uptake capacities of three dominant species of Qinhuangdao green tides[J]. Acta Oceanologica Sinica, 2023, 42(4): 114-123. doi: 10.1007/s13131-022-2100-7
North China Sea Ecological Center of the Ministry of Natural Resources, Qingdao 266033, China
2.
Key Laboratory of Marine Eco-Environmental Science and Technology, First Institute of Oceanography, Ministry of Natural Resources, Qingdao 266061, China
3.
Key Laboratory of Ecological Prewarning, Protection and Restoration of Bohai Sea, Ministry of Natural Resources, Qingdao 266033, China
Funds:
The Fund of Key Laboratory of Ecological Prewarning, Protection and Restoration of Bohai Sea, Ministry of Natural Resources under contract No. 2022107; the Qingdao Postdoctoral Applied Research Project under contract No. QDBSH202001.
Since 2015, green tides have been blooming in offshore waters of Qinhuangdao, with serious impacts on the local ecological environment and tourism. Ulva australis, Bryopsis plumosa, and U. prolifera are the dominant species of Qinhuangdao green tides, following a sequential succession pattern. Ulva prolifera is the dominant species, with the highest biomass and the greatest influence on the local ecological environment. To study the reason of green tide dominant species succession and U. profilera became the dominant species with the largest biomass, we compared and analyzed the growth and nutrient uptake capacity of the three algae. The results showed that temperature significantly affects the growth of the three species. Within the temperature range of the experimental setup, the optimum temperature for the growth of U. australis, B. plumosa andU. profilera is 10℃, 15℃, and 20–25℃, respectively. Combined with the temperature variation trend during green tide bloom development, we believe that temperature is the key environmental factor for the succession of the dominant species. Ulva prolifera has a higher growth rate than U. australisand B. plumosa under the same nitrate, ammonium, and phosphate levels. Significant differences in the maximum absorption rate (Rmax) and Rmax/Ks (the relationship between uptake rate and substrate concentration) values indicated that U. prolifera had an apparent competitive advantage over U. australis and B. plumosa regarding nutrient uptake. Therefore, the strong growth and nutrient uptake capacities of U. prolifera might be the main reason for becoming the dominant species with the largest biomass in Qinhuangdao green tides.
Green macroalgae blooms, referred to as green tides, are formed primarily by the accumulation of unattached macroalgal biomass including Ulva, Chaetomorpha, Cladophora, and Ulvaria species (Fletcher, 1996; Nelson et al., 2003). During the past several decades, green tides have occurred regularly in coastal areas around the worldwide (Teichberg et al., 2010). International studies on the causes of green tide formation have shown that green tides usually occur in areas with relatively high eutrophication levels, and eutrophication is considered an important cause of green tides (Kamer et al., 2001; Charlier et al., 2007; Yabe et al., 2009; Teichberg et al., 2010). Compared with other algae, green tide algae, the species causing green tides, have stronger competitive advantages regarding nutrient uptake (Luo et al., 2012). In eutrophic waters, they can rapidly absorb large amounts of nutrients and maintain a high growth rate, resulting in the continuous increase in algae biomass and making it the dominant species (Luo et al., 2012; Wang et al., 2012). Green tide algae can also store excess nutrients to maintain a high growth rate under low-nutrient conditions (Pedersen and Borum, 1997).
Since 2015, a novel green tide has been blooming in Qinhuangdao City (Hebei Province, China) on the western coast of the Bohai Sea (Han et al., 2019; Song et al., 2019b). The dominant species of green tides in offshore waters of Qinhuangdao include Ulva australis, Bryopsis plumosa, and Ulva prolifera, with obvious morphological differences (Song et al., 2019a). In previous publications, Ulva pertusa has been reported to be one of dominant species for the green tide in Qinhuangdao (Song et al., 2019a, 2019b; Han et al., 2019, 2022a). Since this species has been identified as a synonym of U. australis recently (Hughey et al., 2021), we replaced U. pertusa with U. australis in this text. Of these, U. australis is a economic macroalgae widely distributed along the coastal areas of the western North Pacific (Tseng, 1983). It has a slightly yellow color, with wrinkles at the edge and irregular pores on the surface. The species Bryopsis plumosa is a green macroalgae distributed worldwide and a well-known nutrient pollution indicator (Lapointe et al., 2010). Bryopsis plumosa is dark green in color and has a main branch and several irregular branches. In addition,U. prolifera is also the causative species in the world’s largest green macroalgae blooms in the Yellow Sea, China (Liu et al., 2010; Wang et al., 2015). It is bright green in color and tubular, with more branches (Zhang et al., 2013; Song et al., 2019b). There is an obvious succession phenomenon during the occurrence of Qinhuangdao green tides (Han et al., 2019; Song et al., 2019a, 2019b). According to the different dominant species, the occurrence of green tides can be divided into three stages (Song et al., 2019a). The first stage lasts from late April to mid-May, during which the biomass levels are low and U. australis is the main species. In the second stage, biomass increases gradually from mid-May to mid-June, and the dominant species isB. plumosa. The third stage occurs from mid-June to late September, when green algal biomass is highest and the duration is longest. The species U. prolifera is the dominant species in this stage (Han et al., 2019; Song et al., 2019a). However, it is still unclear which environmental factors drive the succession of dominant species of green tides in Qinhuangdao and which physiological characteristics of U. prolifera are involved in the competition with the other two species, making it the dominant species with the largest biomass.
We speculated that the different adaptation strategies of U. australis,B. plumosa, and U. prolifera to environmental factors are responsible for dominant species succession. In this work, we investigated the effects of temperature, irradiance, and nutrients on the growth rates of U. australis, B. plumosa, and U. prolifera and compared their nutrient uptake capacities. By this investigation, it would be possible to answer the following two questions: (1) was the succession of dominant species of green tide in Qinhuangdao related to the dominance of growth of the three dominant species over a range of temperature and light? (2) was the growth and nutrient uptake capacity of U. prolifera higher than that of U. australis and B. plumosa?
2.
Materials and methods
2.1
Algal material
During green tides outbreak, vast numbers of suspended macroalgae accumulate primarily on the Jinmenghaiwan Bathing Beach of Qinhuangdao, which is the main area affected by green tides in Qinhuangdao. Macroalgae were sampled from the Jinmenghaiwan Bathing Beach (39°53′42.93″N, 119°32′34.49″E) in July 2019. Morphological characteristics and internal transcribed spacer (ITS) sequences and 5S ribosomal DNA (5S rDNA) spacer sequences were chosen for species identification.
These samples were cleaned thrice using sterilized seawater on site, dried with absorbent paper, stored in liquid nitrogen, then transported to the laboratory within 48 h. In order to minimize the effect of natural environmental conditions on algal physiological traits, each algal sample was cultured for 3–5 d using air stones before the experiment. The condition was kept at 16℃ at an irradiance of 100 μmol/(m2·s) in a 12 h light:12 h dark cycle.
2.2
Competitive growth of the three algae species under different temperature and light conditions
To test the effects of temperature and light on the growth of U. australis, B. plumosa, and U. prolifera, we selected the temperatures of 10℃, 15℃, 20℃, and 25℃, with the light intensities of 50 μmol/(m2·s), 100 μmol/(m2·s), 150 μmol/(m2·s), and 200 μmol/(m2·s). Nutrients were supplemented according to f/2 medium, and the experiment was carried out in a glass flask with 200 mL of f/2 medium, which was added every 5 d during the culture period with 12 h light: 12 h dark cycle. The initial biomass of each algae was 0.2 g. The experiment was divided into two groups, single culture and co-culture. In the single culture, U. australis, B. plumosa, and U. prolifera were cultured separately under different temperature and light conditions. According to the succession rule of dominant species, co-culture groups were defined as follows: (1) U. australis and B. plumosa at 10℃; (2) U. australis and B. plumosa at 20℃; (3) B. plumosa and U. prolifera at 20℃; and (4) B. plumosa and U. prolifera at 25℃. The light intensities for each group were 50 μmol/(m2·s), 100 μmol/(m2·s), 150 μmol/(m2·s), and 200 μmol/(m2·s). Each group consisted of three replicates. The algae were weighed after 10 d, and the relative growth rate (RGR) was calculated as follows: RGR = (lnw2−lnw1) /t, where w1 denotes the initial fresh mass and w2 the fresh mass after t d (Cui et al., 2015). We selected the RGR as the evaluation indicator of the effect.
2.3
Effects of
${{\boldsymbol {NO}}_3^-} $,
${{\boldsymbol {NH}}_4^+}$ and
${{\boldsymbol {PO}}_4^{3-}}$ on algal growth rates
The experimental period for investigating the effects of nitrogen and phosphorus on the growth of U. prolifera,U. pertulva, and B. plumosa was 10 d. Nitrogen available for macroalgal uptake in coastal waters can be in the form of nitrate and ammonium, we used two different nitrogen sources, namely nitrate (NaNO3) and ammonium (NH4Cl). To prevent phosphate restriction during the experiment, 30 μmol/L phosphate (KH2PO4) was added to all experiments. In the nitrogen source experiment, the concentrations of nitrogen (
${{\rm {NO}}_3^-} $ or
${{\rm {NH}}_4^+} $) were 5 μmol/L, 10 μmol/L, 20 μmol/L, 50 μmol/L, and 100 μmol/L. NaNO3, NH4Cl, and KH2PO4 were applied to adjust the nutrient concentrations. In the phosphate experiment, the concentrations of phosphate were 5 μmol/L, 10 μmol/L, 20 μmol/L, 30 μmol/L, and 40 μmol/L. To prevent nitrogen restriction, 50 μmol/L
${{\rm {NO}}_3^-} $ and 50 μmol/L
${{\rm {NH}}_4^+} $ were added to each group of experiments. Briefly, we placed 0.2 g of algae into a 1 L glass bottle which contained 500 mL of sterile artificial sea water and added the corresponding nutrients. We selected the RGR as the evaluation indicator of the effect. The experiment was carried out at 20℃ and 100 μmol/(m2·s) with a 12 h light: 12 h dark cycle. Each group consisted of three replicates. Previous studies have shown that the third stage with U. profilera as the dominant species, which has the largest biomass, tnolhe longest duration, and the greatest impact on the environment, begins in mid-June. According to our field survey, the average temperature and light intensity in the sea area in mid-June were about 20℃ and 100 μmol/(m2·s), therefore, in order to simulate the environmental conditions in the field to the greatest extent, above environmental conditions were designed to explore whether U. profilera may became the dominant species with the largest biomass.
2.4
Effects of
${{\boldsymbol {NO}}_3^-}$,
${{\boldsymbol {NH}}_4^+}$ and
${{\boldsymbol {PO}}_4^{3-}}$ on nutrient uptake
The nitrogen (
${{\rm {NO}}_3^-} $ and
${{\rm {NH}}_4^+} $) uptake experiment was carried out in 1-L sterile glass bottles, whereas for the phosphate uptake experiment, 1-L sterile plastic bottles were used. Prior to use, all bottles were cleaned with 10% hydrochloric acid. In the nitrogen uptake experiment, the concentrations of
${{\rm {NO}}_3^-} $ or
${{\rm {NH}}_4^+} $ were 5 μmol/L, 10 μmol/L, 20 μmol/L, 50 μmol/L, and 100 μmol/L. To avoid phosphorus restriction, 30 μmol/L
${{\rm {PO}}_4^{3-}} $ was added. In the phosphorus uptake experiment, the concentrations of
${{\rm {PO}}_4^{3-}} $ were 5 μmol/L, 10 μmol/L, 20 μmol/L, 30 μmol/L, and 40 μmol/L. To prevent nitrogen restriction, 50 μmol/L
${{\rm {NO}}_3^-} $ and 50 μmol/L
${{\rm {NH}}_4^+} $ were added. The initial biomass for this part of experiment is 0.2 g. Nitrogen starvation incubation was performed for about 3 d before the start of the experiment. In all experiments, 2 mL seawater samples were collected after 1 h, 2 h, 3 h, and 4 h, and the nutrient concentration was analyzed using an automatic nutrient analyzer (AA3, BRAN LUEBBE). The experiment was carried out at 20℃ and 100 μmol/(m2·s) with a 12 h light: 12 h dark cycle. The algal material was oven-dried at 60℃ for 72 h to determine the dry mass (DM). Uptake rates (V) were calculated from changes in substrate concentrations during each sampling interval using the equation:
$$ V = [(C_0\times V_0)-(C_t\times V_t)]/(t\times D_{\rm{M}}), $$
(1)
where C0 denotes the initial nutrient concentration, Ct is the concentration after t d, V0 denotes the initial amount of water, Vt is the amount of water after t d, t denotes the sampling interval time, and DM represents the dry weight of algal biomass.
The Michaelis-Menten equation is widely used to describe the growth and nutrient uptake of macroalgae. The competitive ability of macroalgae to obtain nutrients can be determined using the kinetic parameter Rmax (maximum absorption rate). The parameter Rmax is obtained from a hyperbolic plot of absorption rates at a series of concentrations and is used to measure the ability of macroalgae to absorb nutrients at different concentrations. The Rmax/Ks ratio describes the relationship between uptake rate and substrate concentration, with higher values suggesting competitive advantages and higher affinity.
2.5
Data analysis
Tests of homogeneity of variance were conducted, and separate two-way analysis of variance (ANOVA) was performed. Differences were considered significant at P<0.05. Data were analyzed using SPSS 16.0 (SPSS Inc., Chicago, IL, USA). The data of the uptake rate experiment were analyzed using multivariate variance. Tukey’s test was performed for all parameters.
3.
Results
3.1
Molecular identification of macroalgae
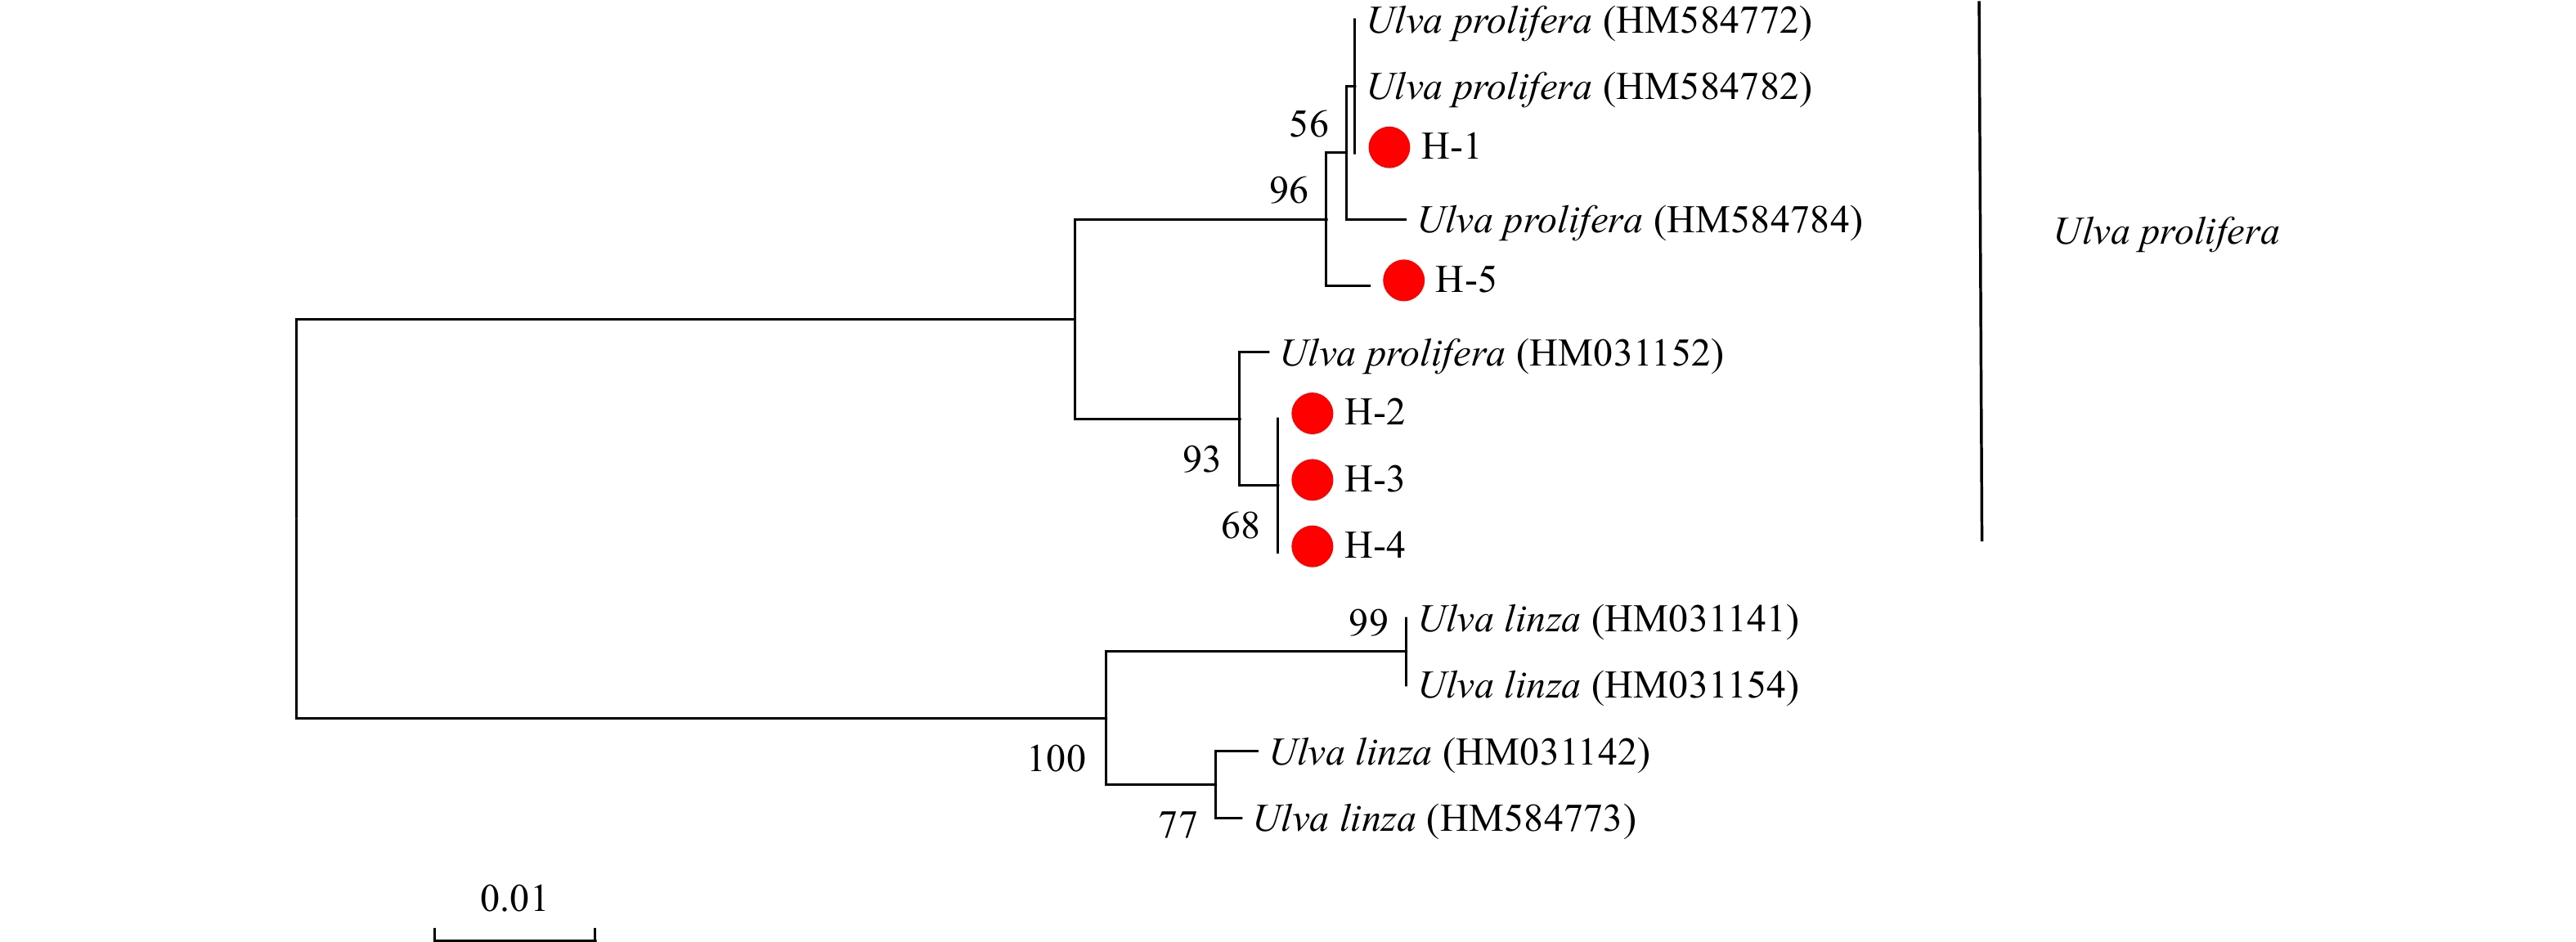
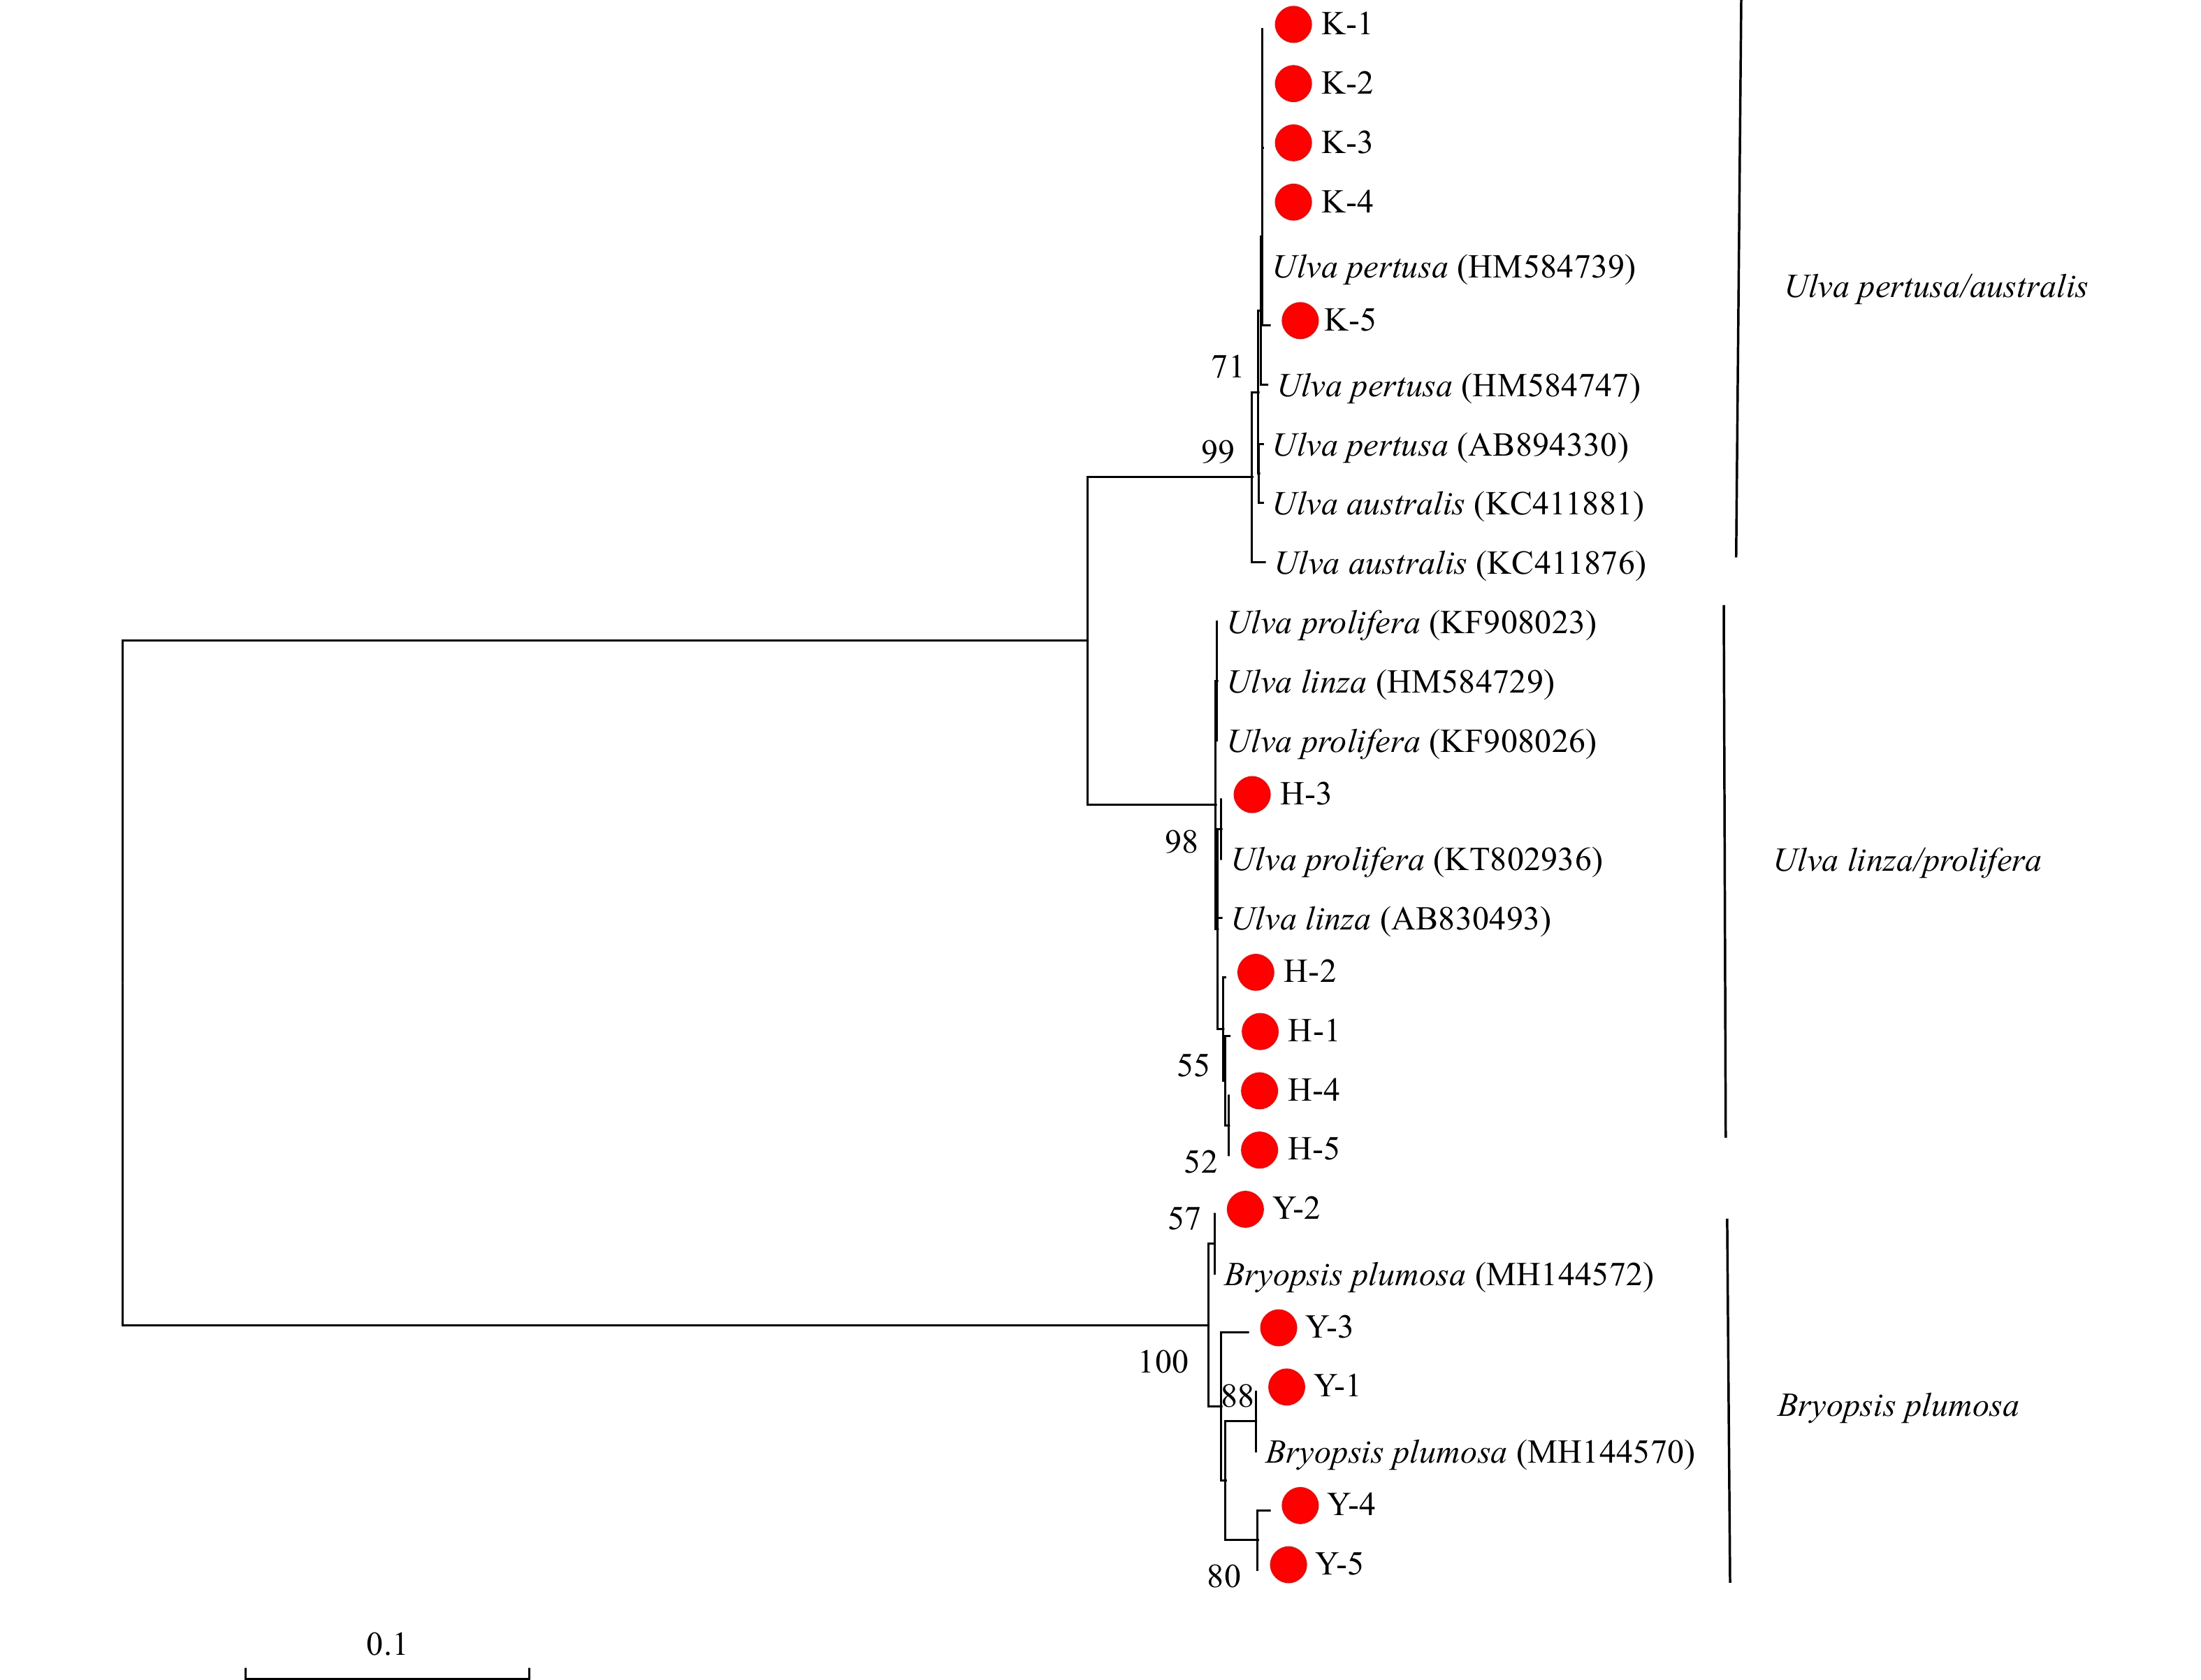
The Neighbor-Joining Tree based on the ITS gene showed that the 15 green macroalgal samples belonged to 3 clades (Fig. 1). All of the K samples grouped together in the U. pertusa/australis clade. All of the Y samples grouped together in the B. plumosa clade. All of the H samples showed the highest affiliation with the U. prolifera/linza clade. However, according to the phylogeny of the 5S spacer region, the U. prolifera/linza clade in the phylogenetic tree based on 5S sequence was divided clearly into two groups (U. prolifera and U. linza, Fig. 2). All of the H samples grouped in the U. prolifera clade. The sequences of 15 samples have been submitted to NCBI, and the sequence numbers are shown in Table 1.
Figure
1.
Phylogenetic tree determined by analysis of internal transcribed spacer sequences of macroalgae. Numbers at the nodes were bootstrapping support values larger than 50% after 1000 replicates in Neighbor-Joining analyses.
Figure
2.
Phylogenetic tree determined by analysis of 5S sequences of macroalgae. Numbers at the nodes were bootstrapping support values larger than 50% after 1000 replicates in Neighbor-Joining analyses.
3.2
Effects of temperature and light on the growth of dominant green tide species
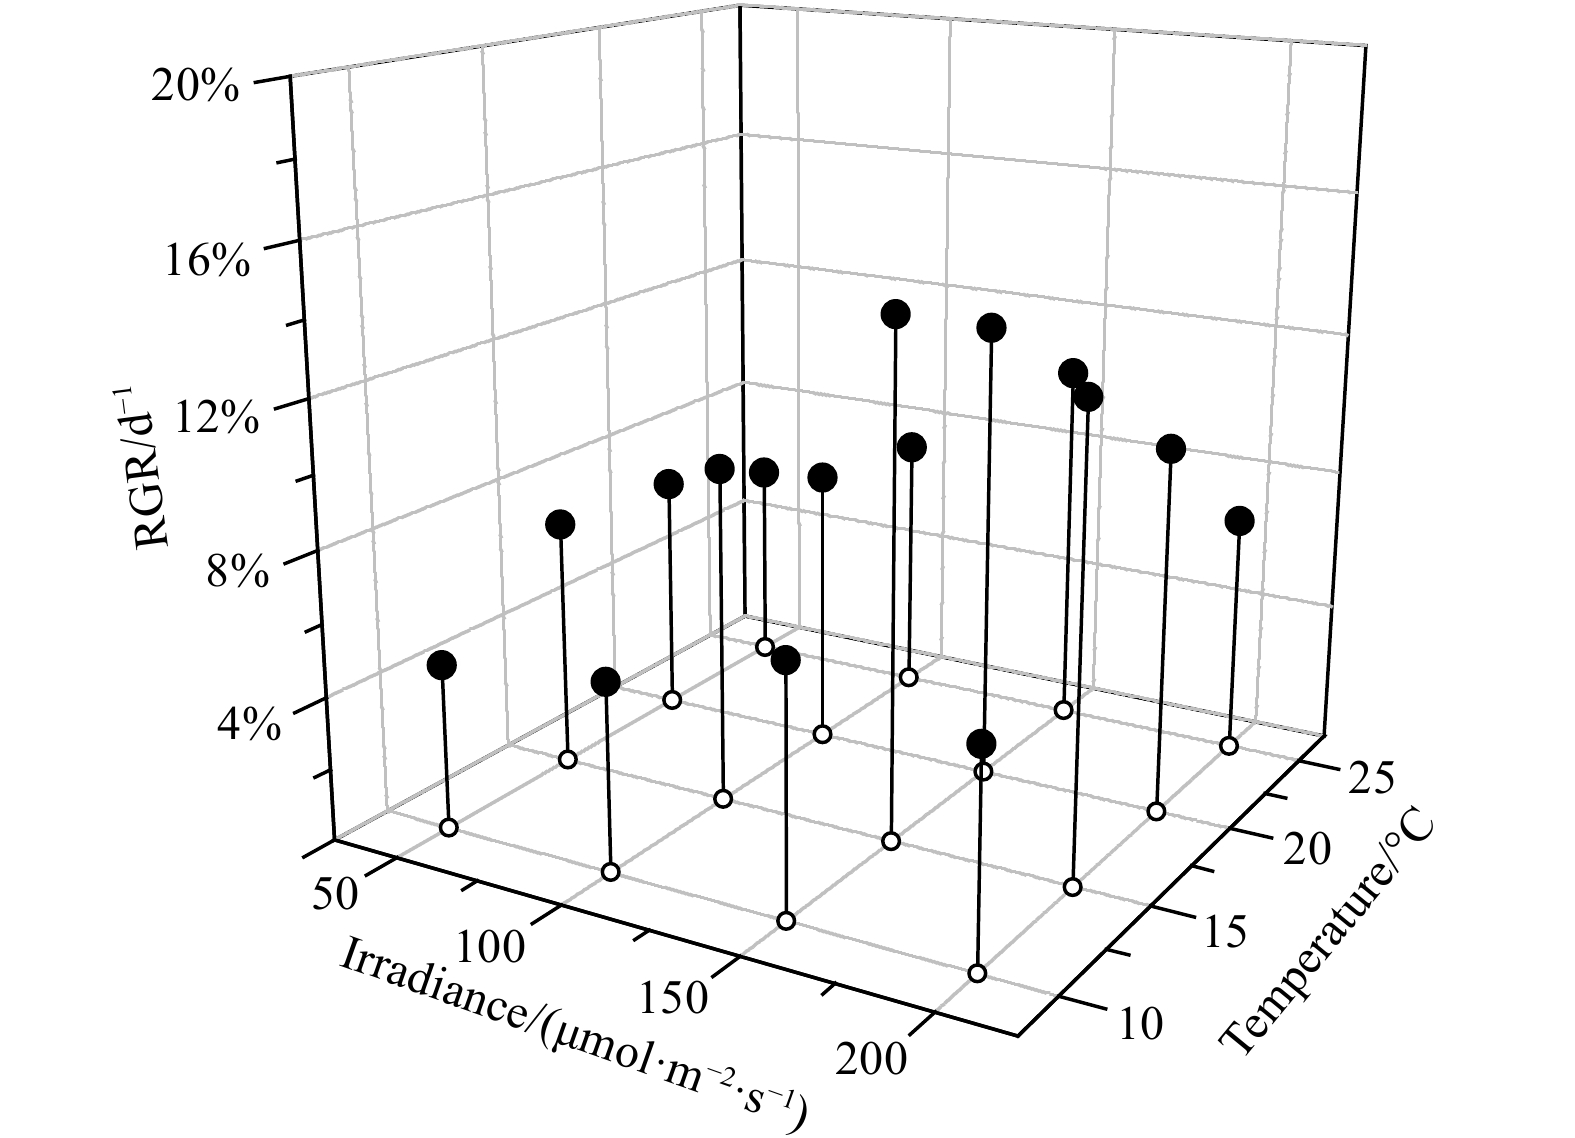
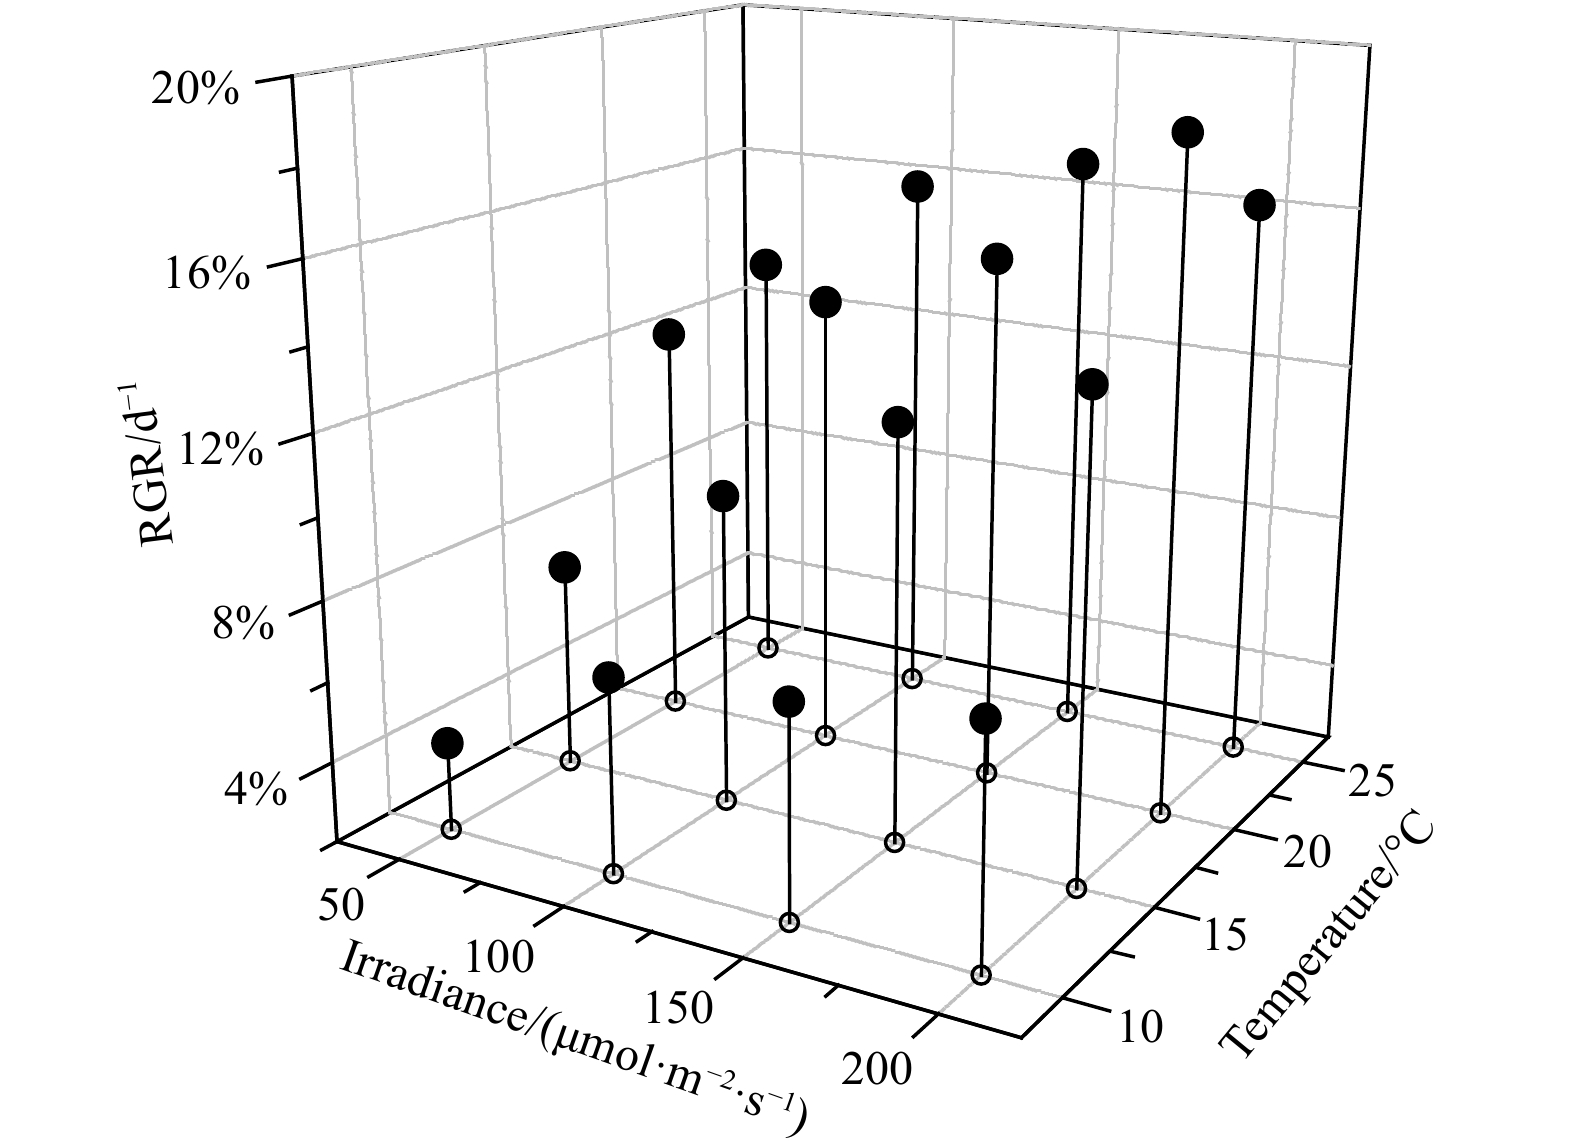
Within the temperature and light ranges of the experimental setup, the optimum combination of temperature and light for U. australis was 10℃ and 150 μmol/(m2·s), resulting in a growth rate of about 12% per day (Fig. 3). The RGR of U. australis decreased with increasing temperature in the range of 15–25℃. The optimum temperature and light conditions for the growth of B. plumosa were 15℃ and 150 μmol/(m2·s), obtaining RGR of 10.2% per day (Fig. 4). The temperature range of 20–25℃ was most suitable for the growth of U. prolifera. The optimum temperature and light conditions forU. prolifera were 20℃ and 200 μmol/(m2·s), resulting in RGR of 18.6% per day (Fig. 5).
Figure
3.
Effects of temperature and light on the growth of Ulva australis. RGR: relative growth rate.
ANOVA was performed to test the significant effects of light and temperature on the growth of U. prolifera,U. australis, and B. plumosa. The results showed that temperature had a significant effect on the growth of the three algaes (P<0.01), while light had no significant effect on the growth of the three seaweeds relative to temperature (P>0.05). So, temperature exerted a stronger influence on the RGR of all the three species. For example, at a light condition of 150 μmol/(m2·s), the RGR of U. prolifera varied from 4.2% to 16.8% at a temperature of 10−25℃. In comparison, the variation of RGR at different light levels was relatively small at a certain temperature. RGR ofU. australis, B. plumosa, andU. prolifera were generally highest at 15℃, 20℃, and 25℃, respectively, and decreased towards both lower and higher temperatures.
All co-culture experiments were conducted under a light range of 50−200 μmol/(m2·s). At the temperature of 10℃, the growth rate of U. australis was significantly higher than that of B. plumosa (P<0.05). The growth rate ofB. plumosa was significantly higher than that ofU. australis at the temperature of 15℃ (P<0.05). At 20℃ and 25℃, the growth rate ofU. prolifera was significantly higher than that of B. plumosa (P<0.05) (Fig. 6).
Figure
4.
Effects of temperature and light on the growth of Bryopsis plumose. RGR: relative growth rate.
3.3
Effect of nutrients on the RGR of dominant green tide species
At the same concentrations of
${{\rm {NO}}_3^-} $,
${{\rm {NH}}_4^+} $, or
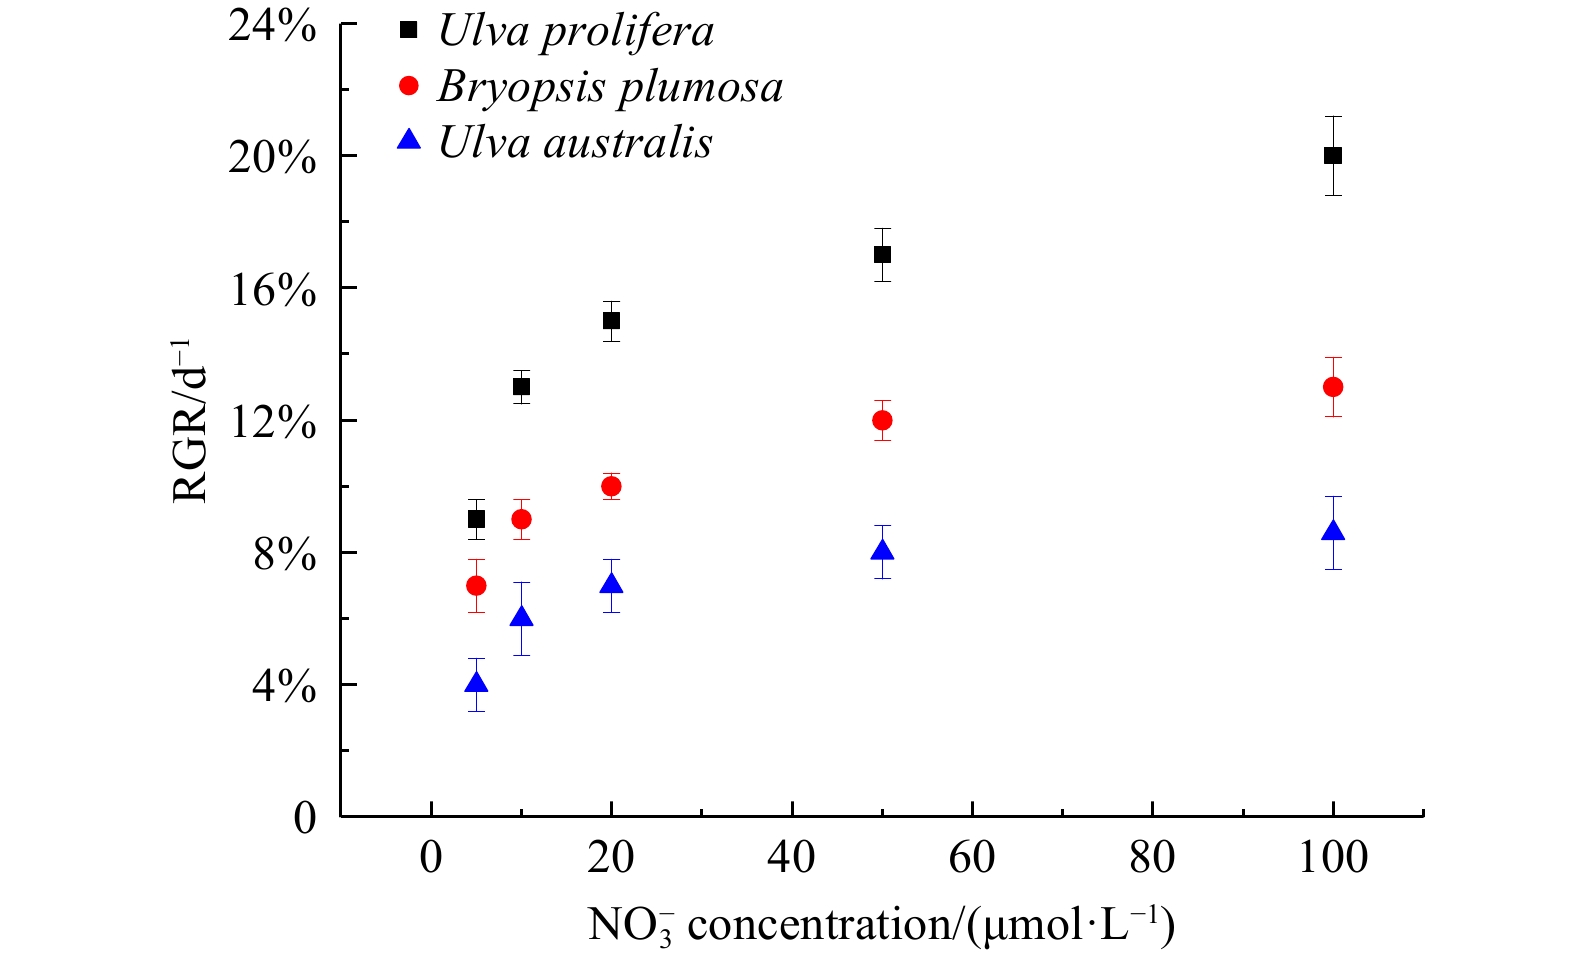
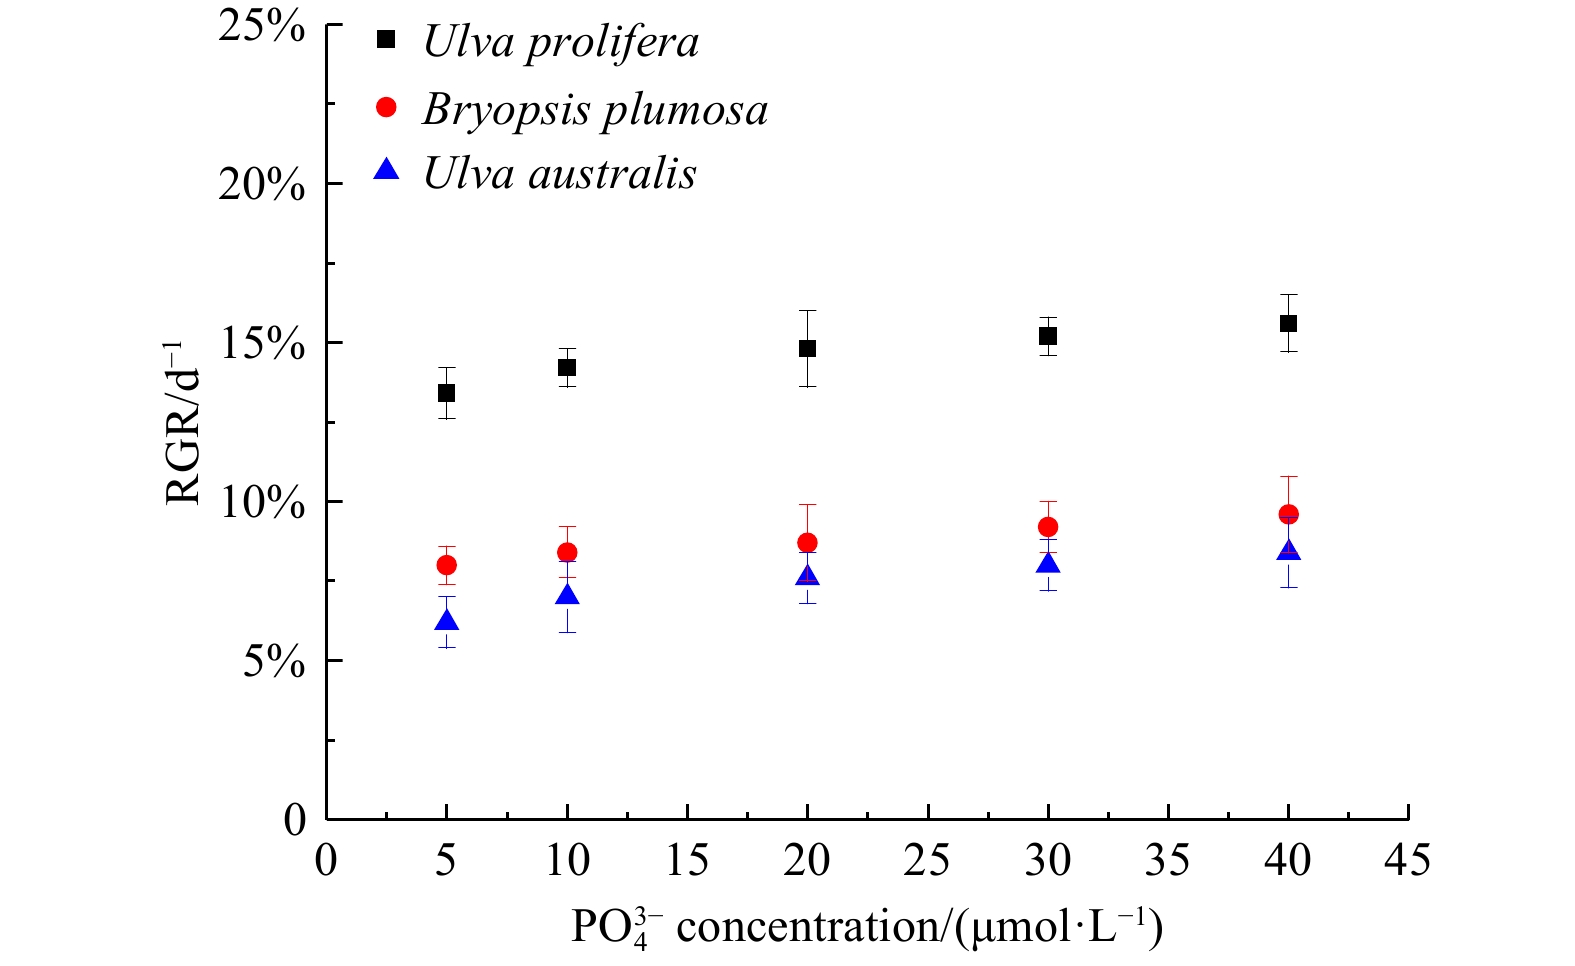
${{\rm {PO}}_4^{3-}} $, the growth rate of U. prolifera was significantly higher than those of B. plumosa and U. australis (P<0.05). Compared with
${{\rm {NO}}_3^-} $ and
${{\rm {NH}}_4^+} $, changes in
${{\rm {PO}}_4^{3-}} $ concentration had no significant effect on the growth rates of all three species (P>0.05) (Figs 7−9).
Figure
7.
The relative growth rate (RGR) of three species of green tide algae at different nitrate concentrations.
3.4
Nutrient uptake by dominant green tide species
The uptake rates of
${{\rm {NO}}_3^-} $,
${{\rm {NH}}_4^+} $, and
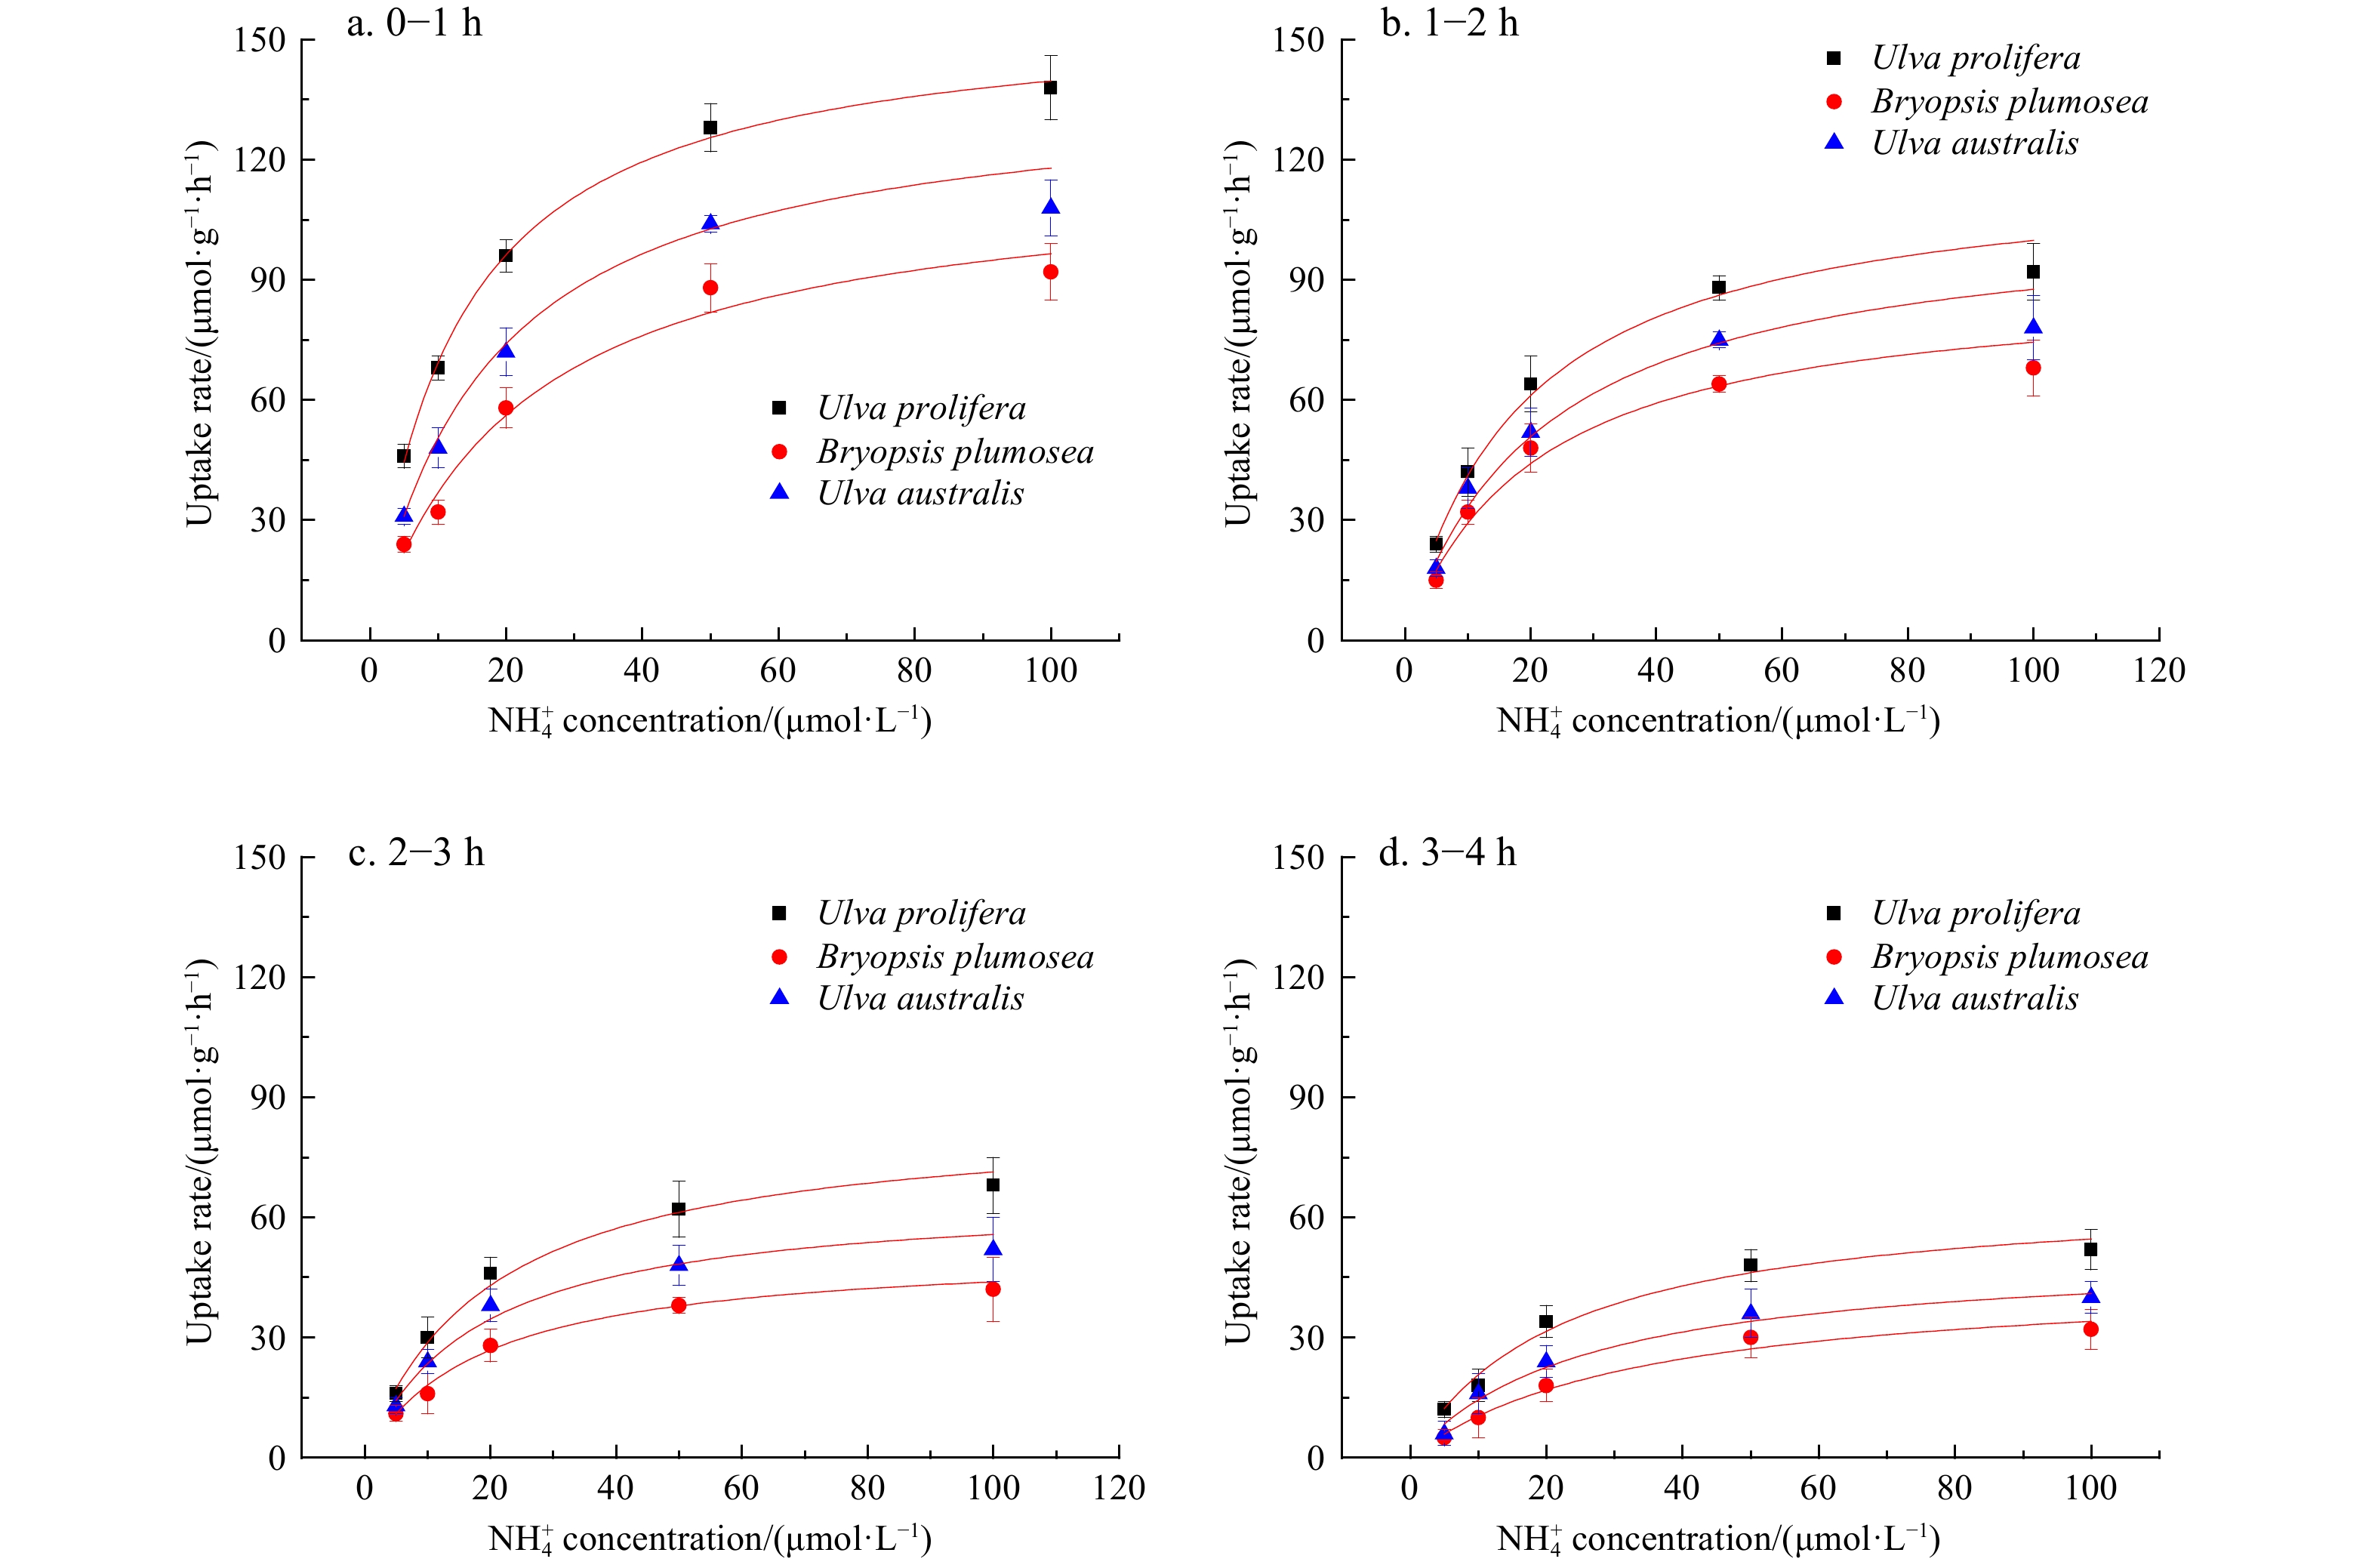
${{\rm {PO}}_4^{3-}} $ were accelerated with increasing nutrient levels. In the 4-h experiment, the nutrient uptake rates of the three species decreased gradually over time. In the same period, U. prolifera had stronger uptake rates of
${{\rm {NO}}_3^-} $,
${{\rm {NH}}_4^+} $, and
${{\rm {PO}}_4^{3-}} $ than B. plumosa and U. australis (P<0.05) (P>0.05) (Figs 10−12).
Figure
10.
Comparison of the nitrate uptake capacity of Ulva australis, Bryopsis plumosa, and Ulva prolifera.
Bryopsis plumosa,U. australis, and U. prolifera showed saturated
${{\rm {NO}}_3^-} $,
${{\rm {NH}}_4^+} $, and
${{\rm {PO}}_4^{3-}} $ uptake kinetics. In the 4-h experiment, The Rmax and Rmax/Ks values of U. prolifera were higher compared with those of U. australis and B. plumosa. Compared with the uptake of
${{\rm {NO}}_3^-} $, the uptake of
${{\rm {NH}}_4^+} $ resulted in higher Rmax values for all species. Compared with phosphate uptake, the three species showed higher Rmax values for nitrogen uptake (
${{\rm {NO}}_3^-} $ and
${{\rm {NH}}_4^+} $) (Tables 2-4).
Table
2.
Kinetic parameters of nutrient uptake at different concentrations forUlva prolifera
4.1
Temperature as a key environmental factor for the succession of dominant species of Qinhuangdao green tides
Eutrophication, especially the increase in inorganic nitrogen, largely drives macroalgae blooms (Fong et al., 1996). Studies have shown that river pollution in Qinhuangdao is becoming more and more serious, and the eutrophication of coastal areas in Qinhuangdao has shown an increasing trend in recent years (Wang et al., 2013). Fong et al. (1996) assume that other factors (temperature and light) also play an important role in the growth of macroalgae when the nutrient supply is sufficient. Fan et al. (2015) showed that temperature is a key environmental factor for the succession of dominant species of raft-fouling green macroalgae. In addition, the phenomenon of species succession during macroalgae blooms in other coastal waters was also controlled by temperature. Yoshida et al. (2015) showed that in the Hiroshima Bay green tide, Japan, Ulva spp. is the dominant species in summer and autumn, whereas in winter, U. australis, a cold-water species, becomes the dominant species.
The strain of Ulva prolifera in the Bohai Sea green tides is not the same as that in the Yellow Sea green tides. The green tide in Qinhuangdao is not correlated with the green tide Yellow Sea and has a different origin and development mode (Han et al., 2022a). In previous study, the relationship between green tides in Qinhuangdao and the Yellow Sea (Rudong and Qingdao) was evaluated by genetic analyses of U. prolifera based on SNP markers. In total, 12945 SNP markers were obtained for all samples. The U. prolifera populations in Rudong and Qingdao were closely clustered, while samples from Qinhuangdao clustered separately. These results showed genetic differentiation was lower among floating U. prolifera populations in Rudong and Qingdao than in Qinhuangdao. Physiological experiments showed that the net buoyancy of floating U. prolifera were higher in Qingdao and Rudong compare to Qinhuangdao under the same light conditions (Han et al., 2022a). Previous studies have shown that the attached macroalgae on seaweed beds in the coastal waters of Jinmenghaiwan Bathing Beach are the major original source of the green tide blooms in the Bohai Sea (Song et al., 2019).
We found that U. australis, B. plumosa, and U. prolifera could tolerate a wide range of temperature and light levels and maintained growth rate of 3.4%–12.2% per day, 4.6%–14.2% per day, and 3.2%–18.6% per day, respectively, at the tested temperature and light ranges. The high RGR indicated the great ecological advance for this species under the favored environmental conditions (Xiao et al., 2016). Compared to the relatively smaller variation as a result of the light conditions, the growth rates of these three algae were more significantly influenced by temperature. According to the results, within the temperature and light range of the experimental setup, the optimum growth temperatures of U. australis, B. plumosa, and U. prolifera were 10℃, 15℃, and 20–25℃, respectively. According to the data released by the Department of Natural Resources of Hebei Province on the seawater temperature of Jinmenghaiwan Bathing Beach from April to September 2018–2020 (Fig. 13), the sea water temperature is low in April (about 10℃), which is conducive to the growth of U. australis, making it the dominant species in the first stage. In May, the sea water temperature is about 15℃, which is conducive to the growth of B. plumosa. In the co-culture experiment with B. plumosa and U. australis, B. plumosa gained competitive advantages due to its high growth rate and became the dominant species in the second stage. The indoor experiment showed that the growth rate ofU. prolifera was highest at 20–25℃. After June, the sea water temperature exceeds 20℃, which is suitable for the growth of U. prolifera. This species also showed obvious growth advantages in the co-culture withB. plumosa and became the dominant species in the third stage. Therefore, we believe that the sea water temperature is the key environmental factor for the succession of dominant species of green tides in the Qinhuangdao coastal area.
Figure
13.
Seawater temperature of Jinmenghaiwan Bathing Beach from April to September 2018–2020 (
http://zrzy.hebei.gov.cn/heb/gongk/gkml/yjgl/hyzh/).
4.2
Growth and nutrient uptake capacity of the three green tide algae
According to the previous study, the content of NO3-N in the water column of Bohai Bay accounted for more than half of the total nitrogen, 53.08%, while the content of NH4-N also accounted for 23.57%, and these two forms of nitrogen accounted for 76.65% of the total nitrogen, indicating that the nitrogen nutrients in the water column mainly existed in the form of inorganic nitrogen. Both PO4-P are the main forms of phosphorus, with PO4-P content in the water column accounting for 76.46% of the total phosphorus (Song et al., 2019). This region is phosphate limited with nitrogen to phosphorus ratio above 20 (Zhang et al., 2018). The main occurrence area of green tide in Qinhuangdao is the sea area adjacent to Jinmenghaiwan Bathing Beach (Han et al., 2022b), which is adjacent to Tang River Estuary and rich in nutrient. According to the preliminary field survey, the approximate ranges of nitrate, ammonium and phosphate in the green tide occurrence area from April to September were 4.08–9.20, 2.15–4.47 and 0.12–0.47, respectively (unpublished data).
In this study, compared with U. australis and B. plumosa, U. prolifera had higher growth and nutrient uptake capacities. The growth rate is mainly determined by the ability of nutrient uptake from adjacent waters (Taylor and Rees, 1999; Ale et al., 2011), indicating that U. prolifera can use and store nutrients more effectively for rapid growth. At high nitrogen concentrations, species with higher nutrient uptake rates have an advantage over species with lower rates (Pedersen and Borum, 1997). The Jinmenghaiwan Bathing Beach is the main area affected by Qinhuangdao green tides, which is adjacent to the mouth of the Tang River and rich in nutrient salts (Wu et al., 2015). For nitrate, ammonium, and phosphate uptake, U. prolifera had higher Rmax values than U. australis and B. plumosa, indicating that this species has a higher uptake rate at the same nutrient concentration. The Rmax/Ks ratio describes the relationship between uptake rate and substrate concentration, with higher values indicating competitive advantages and higher affinity. The significant difference in the Rmax/Ks values of the three dominant species of Qinhuangdao green tides indicates that U. prolifera had obvious competitive advantages in taking up and storing nitrogen and phosphate from neighboring waters compared with U. australis and B. plumosa. A high nutrient absorption ability greatly contributes to the rapid growth rate and ecological competitive advantage of this species over the other co-occurring species, especially in eutrophic waters (Luo et al., 2012; Wang et al., 2012). This study also explains why the biomass of the third stage of the green tide, with U. prolifera as the dominant species, was the highest, with the greatest impact on the local ecological environment.
The maximum absorption rate of the three algae for
${{\rm {NH}}_4^+} $ was higher than that to
${{\rm {NO}}_3^-} $. For example, in the interval of 0–1 h, the Rmax values of U. prolifera,U. australis, and B. plumosa of
${{\rm {NO}}_3^-} $ were 104.31 μmol/(g·h), 83.42 μmol/(g·h), and 79.43 μmol/(g·h), respectively, whereas those of
${{\rm {NH}}_4^+} $ were 157.35 μmol/(g·h), 138.38 μmol/(g·h), and 117.59 μmol/(g·h), respectively. This is because the algae absorb ammonia nitrogen and convert it directly into glutamate, which is used for algal growth. After the uptake of nitrate salts, they must be reduced to ammonia nitrogen or low-valence ammonium salt before being absorbed and used by the algae. Since
${{\rm {NO}}_3^-} $ is reduced to
${{\rm {NH}}_4^+} $ by nitrate enzyme before assimilation (Hurd et al., 1995; Abreu et al., 2011), the higher affinity to
${{\rm {NH}}_4^+} $ might be related to the less energy required for the assimilation of this nutrient.
In conclusion, U. australis, B. plumosa, and U. prolifera, the three dominant species of the green tide in Qinhuangdao, showed significant interspecific differences in physiological characteristics such as growth and nutrient uptake capacities. Temperature has a significant effect on the growth of the three species and is the key environmental factor for the dominant species succession of green tides in Qinhuangdao. Ulva prolifera has a higher growth rate than U. australis and B. plumosa at the same nitrate, ammonium, and phosphate concentrations, with obvious competitive advantages in nutrient uptake capacity. Therefore, the strong growth and nutrient uptake capacities of U. prolifera might be the main reason why U. prolifera becomes the dominant species, with the highest biomass and the greatest influence on the local ecological environment.
Abreu M H, Pereira R, Buschmann A H, et al. 2011. Nitrogen uptake responses of Gracilaria vermiculophylla (Ohmi) Papenfuss under combined and single addition of nitrate and ammonium. Journal of Experimental Marine Biology and Ecology, 407(2): 190–199. doi: 10.1016/j.jembe.2011.06.034
Ale M T, Mikkelsen J D, Meyer A S. 2011. Differential growth response of Ulva lactuca to ammonium and nitrate assimilation. Journal of Applied Phycology, 23(3): 345–351. doi: 10.1007/s10811-010-9546-2
Charlier R H, Morand P, Finkl C W, et al. 2007. Green tides on the Brittany coasts. Environmental Research, Engineering and Management, 3(41): 52–59
Cui Jianjun, Zhang Jianheng, Huo Yuanzi, et al. 2015. Adaptability of free-floating green tide algae in the Yellow Sea to variable temperature and light intensity. Marine Pollution Bulletin, 101(2): 660–666
Fan Shiliang, Fu Mingzhu, Wang Zongling, et al. 2015. Temporal variation of green macroalgal assemblage on Porphyra aquaculture rafts in the Subei Shoal, China. Estuarine, Coastal and Shelf Science, 163: 23–28
Fletcher R L. 1996. The occurrence of “green tides” a review. In: Schramm W, Nienhuis P H, eds. Marine Benthic Vegetation: Recent Changes and the Effects of Eutrophication. Berlin: Springer, 7–43
Fong P, Boyer K E, Desmond J S, et al. 1996. Salinity stress, nitrogen competition, and facilitation: what controls seasonal succession of two opportunistic green macroalgae?. Journal of Experimental Marine Biology and Ecology, 206(1–2): 203–221
Han Hongbin, Li Yan, Ma Xiaojun, et al. 2022a. Population differentiation in the dominant species (Ulva prolifera) of green tide in coastal waters of China. Acta Oceanologica Sinica,
Han Hongbin, Li Yan, Ma Xiaojun, et al. 2022b. Factors influencing the spatial and temporal distributions of green algae micro-propagules in the coastal waters of Jinmenghaiwan, Qinhuangdao, China. Marine Pollution Bulletin, 175: 113328. doi: 10.1016/j.marpolbul.2022.113328
Han Hongbin, Song Wei, Wang Zongling, et al. 2019. Distribution of green algae micro-propagules and their function in the formation of the green tides in the coast of Qinhuangdao, the Bohai Sea, China. Acta Oceanologica Sinica, 38(8): 72–77. doi: 10.1007/s13131-018-1278-1
Hughey J R, Gabrielson P W, Maggs C A, et al. 2021. Taxonomic revisions based on genetic analysis of type specimens of Ulva conglobata, U. laetevirens, U. pertusa and U. spathulata (Ulvales, Chlorophyta). Phycological Research, 69(2): 148–153. doi: 10.1111/pre.12450
Hurd C L, Berges J A, Osborne J, et al. 1995. An in vitro nitrate reductase assay for marine macroalgae: optimization and characterization of the enzyme for Fucus gardneri (Phaeophyta). Journal of Phycology, 31(5): 835–843. doi: 10.1111/j.0022-3646.1995.00835.x
Kamer K, Boyle K A, Fong P, et al. 2001. Macroalgal bloom dynamics in a highly California estuary eutrophic southern. Estuaries, 24: 623–635
Lapointe B E, Langton R, Bedford B J, et al. 2010. Land-based nutrient enrichment of the Buccoo Reef Complex and fringing coral reefs of Tobago, West Indies. Marine Pollution Bulletin, 60(3): 334–343
Liu Dongyan, Keesing J K, Dong Zhijun, et al. 2010. Recurrence of the world’s largest green-tide in 2009 in Yellow Sea, China: Porphyra yezoensis aquaculture rafts confirmed as nursery for macroalgal blooms. Marine Pollution Bulletin, 60(9): 1423–1432. doi: 10.1016/j.marpolbul.2010.05.015
Luo Minbo, Liu Feng, Xu Zhaoli. 2012. Growth and nutrient uptake capacity of two co-occurring species, Ulva prolifera and Ulva linza. Aquatic Botany, 100: 18–24. doi: 10.1016/j.aquabot.2012.03.006
Nelson T A, Nelson A V, Tjoelker M. 2003. Seasonal patterns in ulvoid algal biomass, productivity, and key environmental factors in the Northeast Pacific. Botanica Marina, 46: 263–275
Pedersen M F, Borum J. 1997. Nutrient control of estuarine macroalgae: growth strategy and the balance between nitrogen requirements and uptake. Marine Ecology Progress Series, 161: 155–163. doi: 10.3354/meps161155
Song Wei, Han Hongbin, Wang Zongling, et al. 2019a. Molecular identification of the macroalgae that cause green tides in the Bohai Sea, China. Aquatic Botany, 156: 38–46. doi: 10.1016/j.aquabot.2019.04.004
Song Wei, Wang Zongling, Li Yan, et al. 2019b. Tracking the original source of the green tides in the Bohai Sea, China. Estuarine, Coastal and Shelf Science, 219: 354–362
Taylor M W, Rees T A V. 1999. Kinetics of ammonium assimilation in two seaweeds, Enteromorpha sp. (Chlorophyceae) and Osmundaria colensoi (Rhodophyceae). Journal of Phycology, 35(4): 740–746. doi: 10.1046/j.1529-8817.1999.3540740.x
Teichberg M, Fox S E, Olsen Y S, et al. 2010. Eutrophication and macroalgal blooms in temperate and tropical coastal waters: nutrient enrichment experiments with Ulva spp. Global Change Biology, 16(9): 2624–2637. doi: 10.1111/j.1365-2486.2009.02108.x
Tseng C K. 1983. Common Seaweeds of China. Beijing: Science Press, 160
Wang Liping, Liu Lusan, Zheng Binghui. 2013. Eutrophication development and its key regulating factors in a water-supply reservoir in North China. Journal of Environmental Sciences, 25(5): 962–970. doi: 10.1016/S1001-0742(12)60120-X
Wang Ying, Wang You, Zhu Lin, et al. 2012. Comparative studies on the ecophysiological differences of two green tide macroalgae under controlled laboratory conditions. PLoS ONE, 7(8): e38245. doi: 10.1371/journal.pone.0038245
Wang Zongling, Xiao Jie, Fan Shiliang, et al. 2015. Who made the world’s largest green tide in China?—an integrated study on the initiation and early development of the green tide in Yellow Sea. Limnology and Oceanography, 60(4): 1105–1117. doi: 10.1002/lno.10083
Wu Tong, Chen Yanlong, Huang Fengrong, et al. 2015. Variation trends of nutrient in Qinhuangdao coastal area based on statistical method. Marine Environmental Science (in Chinese), 34(4): 499–503, 523
Xiao Jie, Zhang Xiaohong, Gao Chunlei, et al. 2016. Effect of temperature, salinity and irradiance on growth and photosynthesis of Ulva prolifera. Acta Oceanologica Sinica, 35(10): 114–121. doi: 10.1007/s13131-016-0891-0
Yabe T, Ishii Y, Amano Y, et al. 2009. Green tide formed by free-floating Ulva spp. at Yatsu tidal flat, Japan. Limnology, 10(3): 239–245. doi: 10.1007/s10201-009-0278-4
Yoshida G, Uchimura M, Hiraoka M. 2015. Persistent occurrence of floating Ulva green tide in Hiroshima Bay, Japan: seasonal succession and growth patterns of Ulva pertusa and Ulva spp. (Chlorophyta, Ulvales). Hydrobiologia, 758: 223–233
Zhang Jianheng, Huo Yuanzi, Zhang Zhenglong, et al. 2013. Variations of morphology and photosynthetic performances of Ulva prolifera during the whole green tide blooming process in the Yellow Sea. Marine Environmental Research, 92: 35–42. doi: 10.1016/j.marenvres.2013.08.009
Zhang Haibo, Pei Shaofei, Zhu Yaxuan, et al. 2018. Nutrient structure and nutrient limitation for phytoplankton growth in Bohai Bay in the early summer. China Environmental Science (in Chinese), 38(9): 3524–3530
Hongbin Han, Ruobing Wen, Hui Wang, Sheng Zhao. Comparison of growth and nutrient uptake capacities of three dominant species of Qinhuangdao green tides[J]. Acta Oceanologica Sinica, 2023, 42(4): 114-123. doi: 10.1007/s13131-022-2100-7
Hongbin Han, Ruobing Wen, Hui Wang, Sheng Zhao. Comparison of growth and nutrient uptake capacities of three dominant species of Qinhuangdao green tides[J]. Acta Oceanologica Sinica, 2023, 42(4): 114-123. doi: 10.1007/s13131-022-2100-7
Figure 1. Phylogenetic tree determined by analysis of internal transcribed spacer sequences of macroalgae. Numbers at the nodes were bootstrapping support values larger than 50% after 1000 replicates in Neighbor-Joining analyses.
Figure 2. Phylogenetic tree determined by analysis of 5S sequences of macroalgae. Numbers at the nodes were bootstrapping support values larger than 50% after 1000 replicates in Neighbor-Joining analyses.
Figure 3. Effects of temperature and light on the growth of Ulva australis. RGR: relative growth rate.
Figure 4. Effects of temperature and light on the growth of Bryopsis plumose. RGR: relative growth rate.
Figure 5. Effects of temperature and light on the growth of Ulva prolifera. RGR: relative growth rate.
Figure 6. The relative growth rate (RGR) of co-culture two algae under different temperature and light conditions.
Figure 7. The relative growth rate (RGR) of three species of green tide algae at different nitrate concentrations.
Figure 8. The relative growth rate (RGR) of three species of green tide algae at different ammonium salt concentrations.
Figure 9. The relative growth rate (RGR) of three species of green tide algae at different phosphate concentrations.
Figure 10. Comparison of the nitrate uptake capacity of Ulva australis, Bryopsis plumosa, and Ulva prolifera.
Figure 11. Comparison of the ammonium uptake capacity of Ulva australis, Bryopsis plumosa, and Ulva prolifera.
Figure 12. Comparison of the phosphate uptake capacity of Ulva australis, Bryopsis plumosa, and Ulva prolifera.
Figure 13. Seawater temperature of Jinmenghaiwan Bathing Beach from April to September 2018–2020 (
http://zrzy.hebei.gov.cn/heb/gongk/gkml/yjgl/hyzh/).


 DownLoad:

 DownLoad:


 DownLoad: