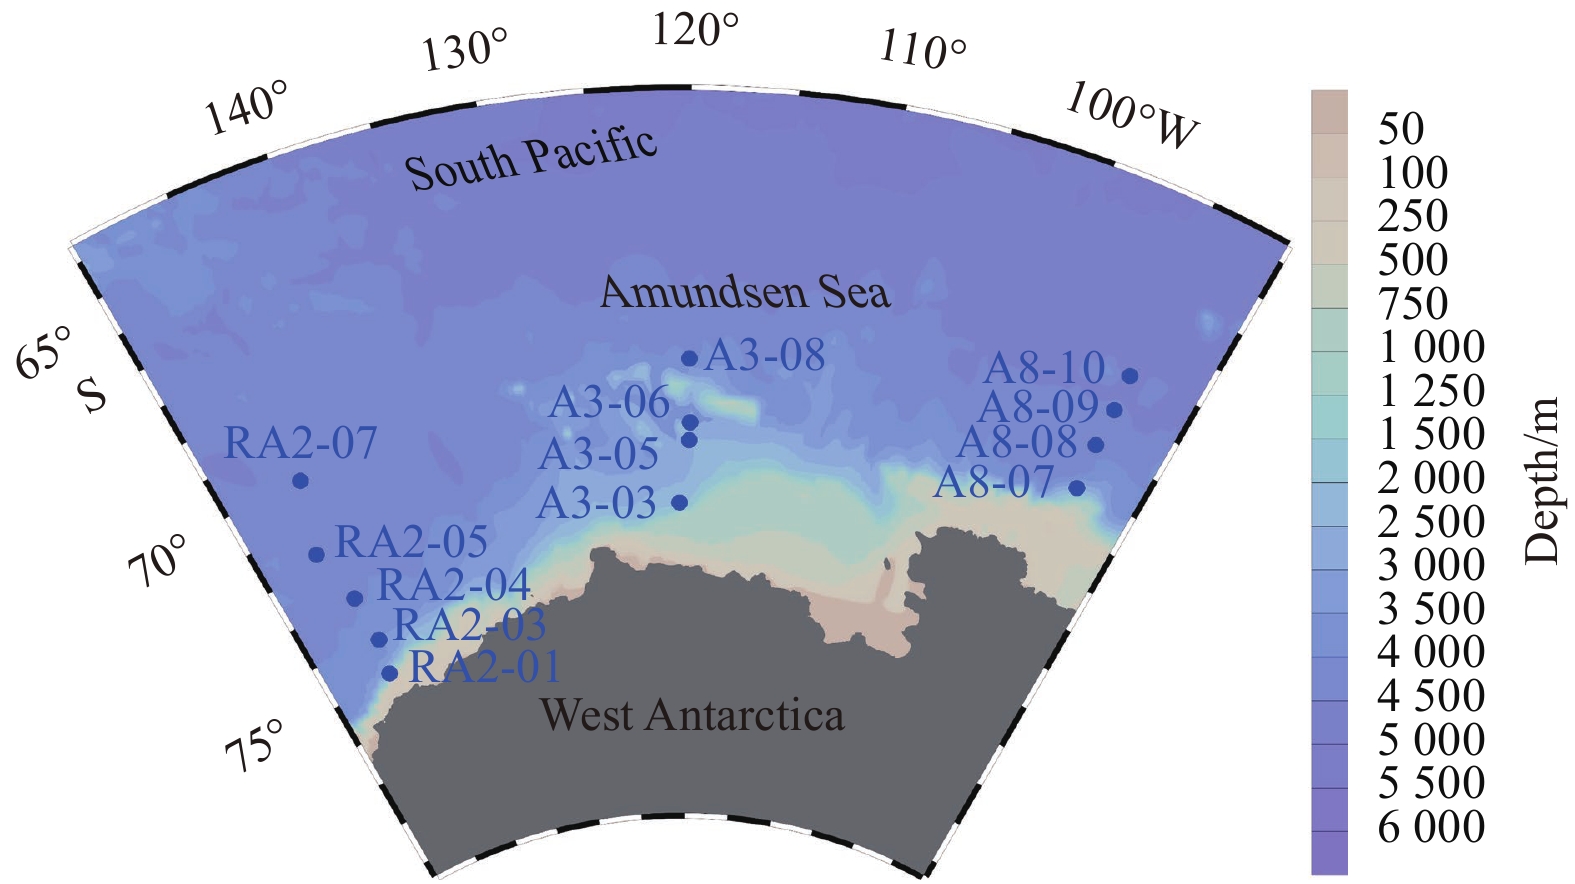
Yangjun Chen, Jinxu Chen, Yi Wang, You Jiang, Minfang Zheng, Yusheng Qiu, Min Chen. Sources and transformations of nitrite in the Amundsen Sea in summer 2019 and 2020 as revealed by nitrogen and oxygen isotopes[J]. Acta Oceanologica Sinica, 2023, 42(4): 16-24. doi: 10.1007/s13131-022-2111-4
Citation: Yangjun Chen, Jinxu Chen, Yi Wang, You Jiang, Minfang Zheng, Yusheng Qiu, Min Chen. Sources and transformations of nitrite in the Amundsen Sea in summer 2019 and 2020 as revealed by nitrogen and oxygen isotopes[J]. Acta Oceanologica Sinica, 2023, 42(4): 16-24. doi: 10.1007/s13131-022-2111-4

Sources and transformations of nitrite in the Amundsen Sea in summer 2019 and 2020 as revealed by nitrogen and oxygen isotopes

doi: 10.1007/s13131-022-2111-4
Funds:  The Impact and Response of Antarctic Seas to Climate Change under contract Nos IRASCC 02-01-01 and IRASCC 01-01-02C; the National Natural Science Foundation of China under contract No. 41721005.
More Information
  • Corresponding author: E-mail: mchen@xmu.edu.cn
  • Received Date: 2022-06-29
  • Accepted Date: 2022-09-28
  • Available Online: 2023-02-02
  • Publish Date: 2023-04-25
  • In this study, the nitrogen and oxygen isotope compositions of nitrite in the upper 150 m water column of the Amundsen Sea in the summer of 2019 and 2020 were measured to reveal the distribution and transformation of nitrite in the euphotic zone of the Southern Ocean. We found that primary nitrite maxima (PNMs) are widely present in the Amundsen Sea, where the depth of occurrence deepens from east to west and nitrite concentrations increases. Evidence from dual isotopes suggests that the formation of PNMs in all regions of the Amundsen Sea is dominated by ammonia oxidation. More importantly, the nitrogen and oxygen isotope compositions of nitrite in the Amundsen Sea mixed layer are abnormal, and their depth profiles are mirror symmetrical. Isotopic anomalies exhibit spatial variations, with central surface water having the lowest nitrogen isotope composition (−89.9‰±0.2‰) and western surface water having the highest oxygen isotope composition (63.3‰±0.3‰). Isotopic exchange reaction between nitrate and nitrite is responsible for these isotope anomalies, as both nitrogen and oxygen isotopes have large isotopic fractionation and opposite enrichment effects. This proves that isotopic exchange reaction operates extensively in different regions of the Amundsen Sea. Our study highlights the unique role of dual isotopes of nitrite in deepening the understanding of nitrogen cycle. Further studies on ammonia oxidation and isotopic exchange between nitrate and nitrite are warranted in the future to understand their roles in the nitrogen cycle in the Southern Ocean.
  • Nitrogen (N) is an essential nutrient needed for marine organisms to grow. Nitrate (${{\rm {NO}}_3^-} $), nitrite (${{\rm {NO}}_2^-} $) and ammonium/ammonia (${{\rm {NH}}_4^+} $/NH3) are fixed N species available to organisms in the marine ecosystem, which greatly limit primary productivity in large parts of the ocean (Moore et al., 2013). Microbial-mediated biogeochemical processes involve multiple forms of N species and constitute a complex N cycle (Casciotti, 2016b; Hutchins and Capone, 2022).

    ${{\rm {NO}}_2^-} $ is involved in almost all N biogeochemical processes, because it is not only a substrate for microbial metabolism in redox reactions, but also has abiotic activity that allows exchange of oxygen (O) atom with H2O molecule (Buchwald et al., 2012; Buchwald and Casciotti, 2013; Casciotti et al., 2002, 2007). Despite its low concentration in seawater, the active biological and chemical activity of ${{\rm {NO}}_2^-} $ promotes its important role in N cycling. Stable accumulations of ${{\rm {NO}}_2^-} $ tend to occur at two depths in the ocean, one at or near the bottom of the euphotic zone, known as the primary ${{\rm {NO}}_2^-} $ maximum (PNM; Dore and Karl, 1996; Kiefer et al., 1976; Lomas and Lipschultz, 2006), and the other in the oxygen-deficient zone, known as the secondary ${{\rm {NO}}_2^-} $ maximum (Brandhorst, 1959; Codispoti et al., 1986). The accumulation of ${{\rm {NO}}_2^-} $ at these depths indicates a change in the microbially mediated N transformation process, resulting in production rates exceeding consumption rates with little effect from physical processes (Mackey et al., 2011). The biogeochemical processes affecting ${{\rm {NO}}_2^-} $ accumulation mainly include nitrification and assimilatory ${{\rm {NO}}_3^-} $ reduction in oxygenated water, and denitrification, anammox and ${{\rm {NO}}_2^-} $ oxidation in anoxic water. In oxygenated seawater, nitrification is both a source and a consumption of ${{\rm {NO}}_2^-} $, thus playing a key role in the ${{\rm {NO}}_2^-} $ cycle. The nitrification process is mainly completed in two steps. The first step is to oxidize the organic remineralization product ${{\rm {NH}}_4^+} $/NH3 to ${{\rm {NO}}_2^-} $, and the second step is to oxidize ${{\rm {NO}}_2^-} $ to ${{\rm {NO}}_3^-} $. The product (${{\rm {NO}}_3^-} $) of the nitrification process is ultimately lost from the ocean as nitrous oxide (N2O) and N2 through denitrification and anammox (Casciotti, 2016b; Hutchins and Capone, 2022). Therefore, nitrification is an important link between sources and sinks of fixed N in the ocean. Since nitrification occurs in an aerobic environment, whereas denitrification and anammox occur in an anaerobic environment (Casciotti, 2016b; Hutchins and Capone, 2022), the link between them is generally considered to be indirect and with spatial and temporal variability. The two steps of nitrification are catalyzed by different microbes (Ward, 2008). The oxidation of NH3 as the first step of nitrification is performed by NH3-oxidizing bacteria (AOB) or archaea (AOA), which is the rate-limiting step of nitrification (Kowalchuk and Stephen, 2001). The oxidation of ${{\rm {NO}}_2^-} $ is catalyzed by ${{\rm {NO}}_2^-} $-oxidizing bacteria (NOB).

    The Southern Ocean plays a pivotal role in oceanic nutrient cycling and climate change. For example, global cooling during the Late Pleistocene Ice Age was thought to have resulted from enhanced carbon storage in the Southern Ocean, thereby reducing atmospheric carbon dioxide (Chalk et al., 2017; Jaccard et al., 2013; Martínez-Garcia et al., 2011). One of the typical features in the Southern Ocean is that major nutrients such as ${{\rm {NO}}_3^-} $ and ${\rm{PO}}_4^- $ in surface waters are not completely exhausted by phytoplankton, which has been attributed to light or iron limitations (Martin et al., 1990; Mitchell et al., 1991). Several studies have been carried out on the N cycle in the upper layer of the Southern Ocean using stable isotopes, such as the reconstruction of the paleonutrients in the Southern Ocean (Altabet and Francois, 2001; DiFiore et al., 2006; Fripiat et al., 2019; Sigman et al., 1999), nitrification (DiFiore et al., 2009; Fripiat et al., 2014, 2015a, 2015b; Smart et al., 2015), new productivity (Froneman et al., 2001; Jochem et al., 1995; Mdutyana et al., 2020), and N isotope exchange between ${{\rm {NO}}_3^-} $ and ${{\rm {NO}}_2^-} $ in the Southern Ocean (Fripiat et al., 2019; Kemeny et al., 2016). In the Amundsen Sea, wind changes are driving more deep warm water to the shallower continental shelf (Naughten et al., 2022), leading to thinning of its ice shelves and rapid loss of the West Antarctic ice sheet (Shepherd et al., 2018; Bett et al., 2020; Naughten et al., 2022). These features make the Amundsen Sea an important area of the Southern Ocean closely related to global change. Revealing the biogeochemical characteristics of nitrogen in the Amundsen Sea is of great significance for a better understanding of the nitrogen cycle in the Southern Ocean.

    Current research on the N cycle in the Southern Ocean has focused more on ${{\rm {NO}}_3^-} $, and the understanding of the ${{\rm {NO}}_2^-} $ cycle is still very limited. The isotopic compositions of N and O in ${{\rm {NO}}_2^-} $ (represent as ${\text{δ}}^{15} {\rm{N}}_{{\rm{NO}}_2^-} ({\text ‰})= [({}^{15}{\rm{N}}/{}^{14}{\rm{N}})_{{\rm{NO}}_2^-}/({}^{15}{\rm{N}}/{}^{14}{\rm{N}})_{{\rm{N}}_2} - 1] $ and ${\text{δ}}^{18} {\rm{O}}_{{\rm{NO}}_2^-}({\text ‰}) = [({}^{18}{\rm{O}}/ {}^{16}{\rm{O}})_{{\rm{NO}}_2^-}/({}^{18}{\rm{O}}/{}^{16}{\rm{O}})_{{\rm{VSMOW}}} - 1] $, respectively; VSMOW: Vienna Standard Mean Ocean Water) document processes related to production and consumption, thus providing the possibility to constrain biogeochemical cycles of ${{\rm {NO}}_2^-} $ (Buchwald and Casciotti, 2013; Casciotti, 2016b; Chen et al., 2021, 2022; Chen and Chen, 2022). In this study, the ${\text{δ}}^{15}\rm N_{{\rm{NO}}_2^-} $ and ${\text{δ}}^{18}\rm O_{{\rm{NO}}_2^-} $ in the upper waters of the Amundsen Sea in summer were measured to reveal the spatial distribution of dual isotopes in ${{\rm {NO}}_2^-} $ and PNMs, and their regulatory processes in different regions of the Amundsen Sea. Our study extends the dataset of ${{\rm {NO}}_2^-} $ dual isotopes in the Southern Ocean to contribute to a deeper understanding of the N cycle in the Southern Ocean.

    Seawater samples were collected through China’s 35th and 36th Antarctic Research Expeditions (CHINARE). During the 35th CHINARE conducted by R/V Xuelong, samples were collected from four sites at the Section A8 from January 16 to 19, 2019. During the 36th CHINARE conducted by R/V Xuelong, samples were collected from nine sites at the Sections A3 and RA2 from January 12 to February 5, 2020. Sections RA2, A3 and A8 are located in the western, central and eastern parts of the Amundsen Sea, respectively (Fig.1). Samples were collected from a 12 L Niskin bottle mounted on a Conductivity-Temperature-Depth (CTD) rosette. Only water samples above 150 m were collected for N and O isotopes analysis because the ${{\rm {NO}}_2^-} $ content in these samples was sufficient for isotopic measurement. Immediately after sample collection, 6 mol/L NaOH solution was added for preservation (Bourbonnais et al., 2015; Casciotti et al., 2007; Chen et al., 2021, 2022; Chen and Chen, 2022; Hu et al., 2016; Kobayashi et al., 2021). The fixed samples were stored at room temperature and brought to the onshore laboratory for subsequent analysis.

    Figure  1.  Sampling locations in the Amundsen Sea in summer.

    Temperature and salinity were measured in situ by CTD probes on board (SBE 911plus, Sea Bird). The measurement accuracy of temperature and conductivity is 0.001℃ and 0.0003 S/m, respectively. Chl a concentration was measured and calibrated directly from the probe equipped on the CTD.

    The concentrations of ${{\rm {NO}}_2^-} $ and ${{\rm {NH}}_4^+} $ were determined by the diazo-azo method and the sodium hypobromite oxidation method, and the detection limits were 0.02 μmol/L and 0.03 μmol/L, respectively.

    An optimized azide reduction method was used to simultaneously measure the N and O isotopic compositions in ${{\rm {NO}}_2^-} $ (Bourbonnais et al., 2015; Hu et al., 2016; McIlvin and Altabet, 2005). Considering the detection limit of the method, only samples with ${{\rm {NO}}_2^-} $ concentrations higher than 0.24 μmol/L were measured in this study. The procedure is detailed in Chen et al. (2021). Briefly, the maximum sample volume to transfer into a 20 mL headspace vial was determined from the ${{\rm {NO}}_2^-} $ concentration to yield the maximum N2O production. The reagents and samples used were pre-purged with high-purity helium to remove possible N2O gas. Sodium azide solution (2 mol/L) and acetic acid solution (7.8 mol/L) were prepared on the day of sample measurement and added to the sample in a 1:1 ratio (v/v) and mixed well. Buffer solution (0.9 mL) was added to the samples for the reaction. After about 1 h, 10 mol/L sodium hydroxide was added to terminate the reaction. The resulting N2O gas was purified, enriched, and injected into an isotope ratio mass spectrometer (DELTAplus XP, Thermo Fisher Scientific) for isotopic analysis. Standards for ${{\rm {NO}}_2^-} $ isotopes (RSIL-N23, RSIL-N7373, and RSIL-N10219; Casciotti et al., 2007) are measured by the same procedure as the sample to obtain the isotopic composition of the sample. The reaction volume for each sample and standard solution was kept consistent to minimize possible pH dependence in the azide reaction (Granger et al., 2020; Kobayashi et al., 2021). The nitrogen content of the standard was matched to that of the sample to minimize the effect of sample size on ${{\rm {NO}}_2^-} $ isotope analysis. During the isotope measurement, every six samples were inserted into a set of standard solutions for simultaneous determination. The analytical precision for δ15N and δ18O in ${{\rm {NO}}_2^-} $ is better than 0.3‰ and 0.4‰ for samples and standards, respectively.

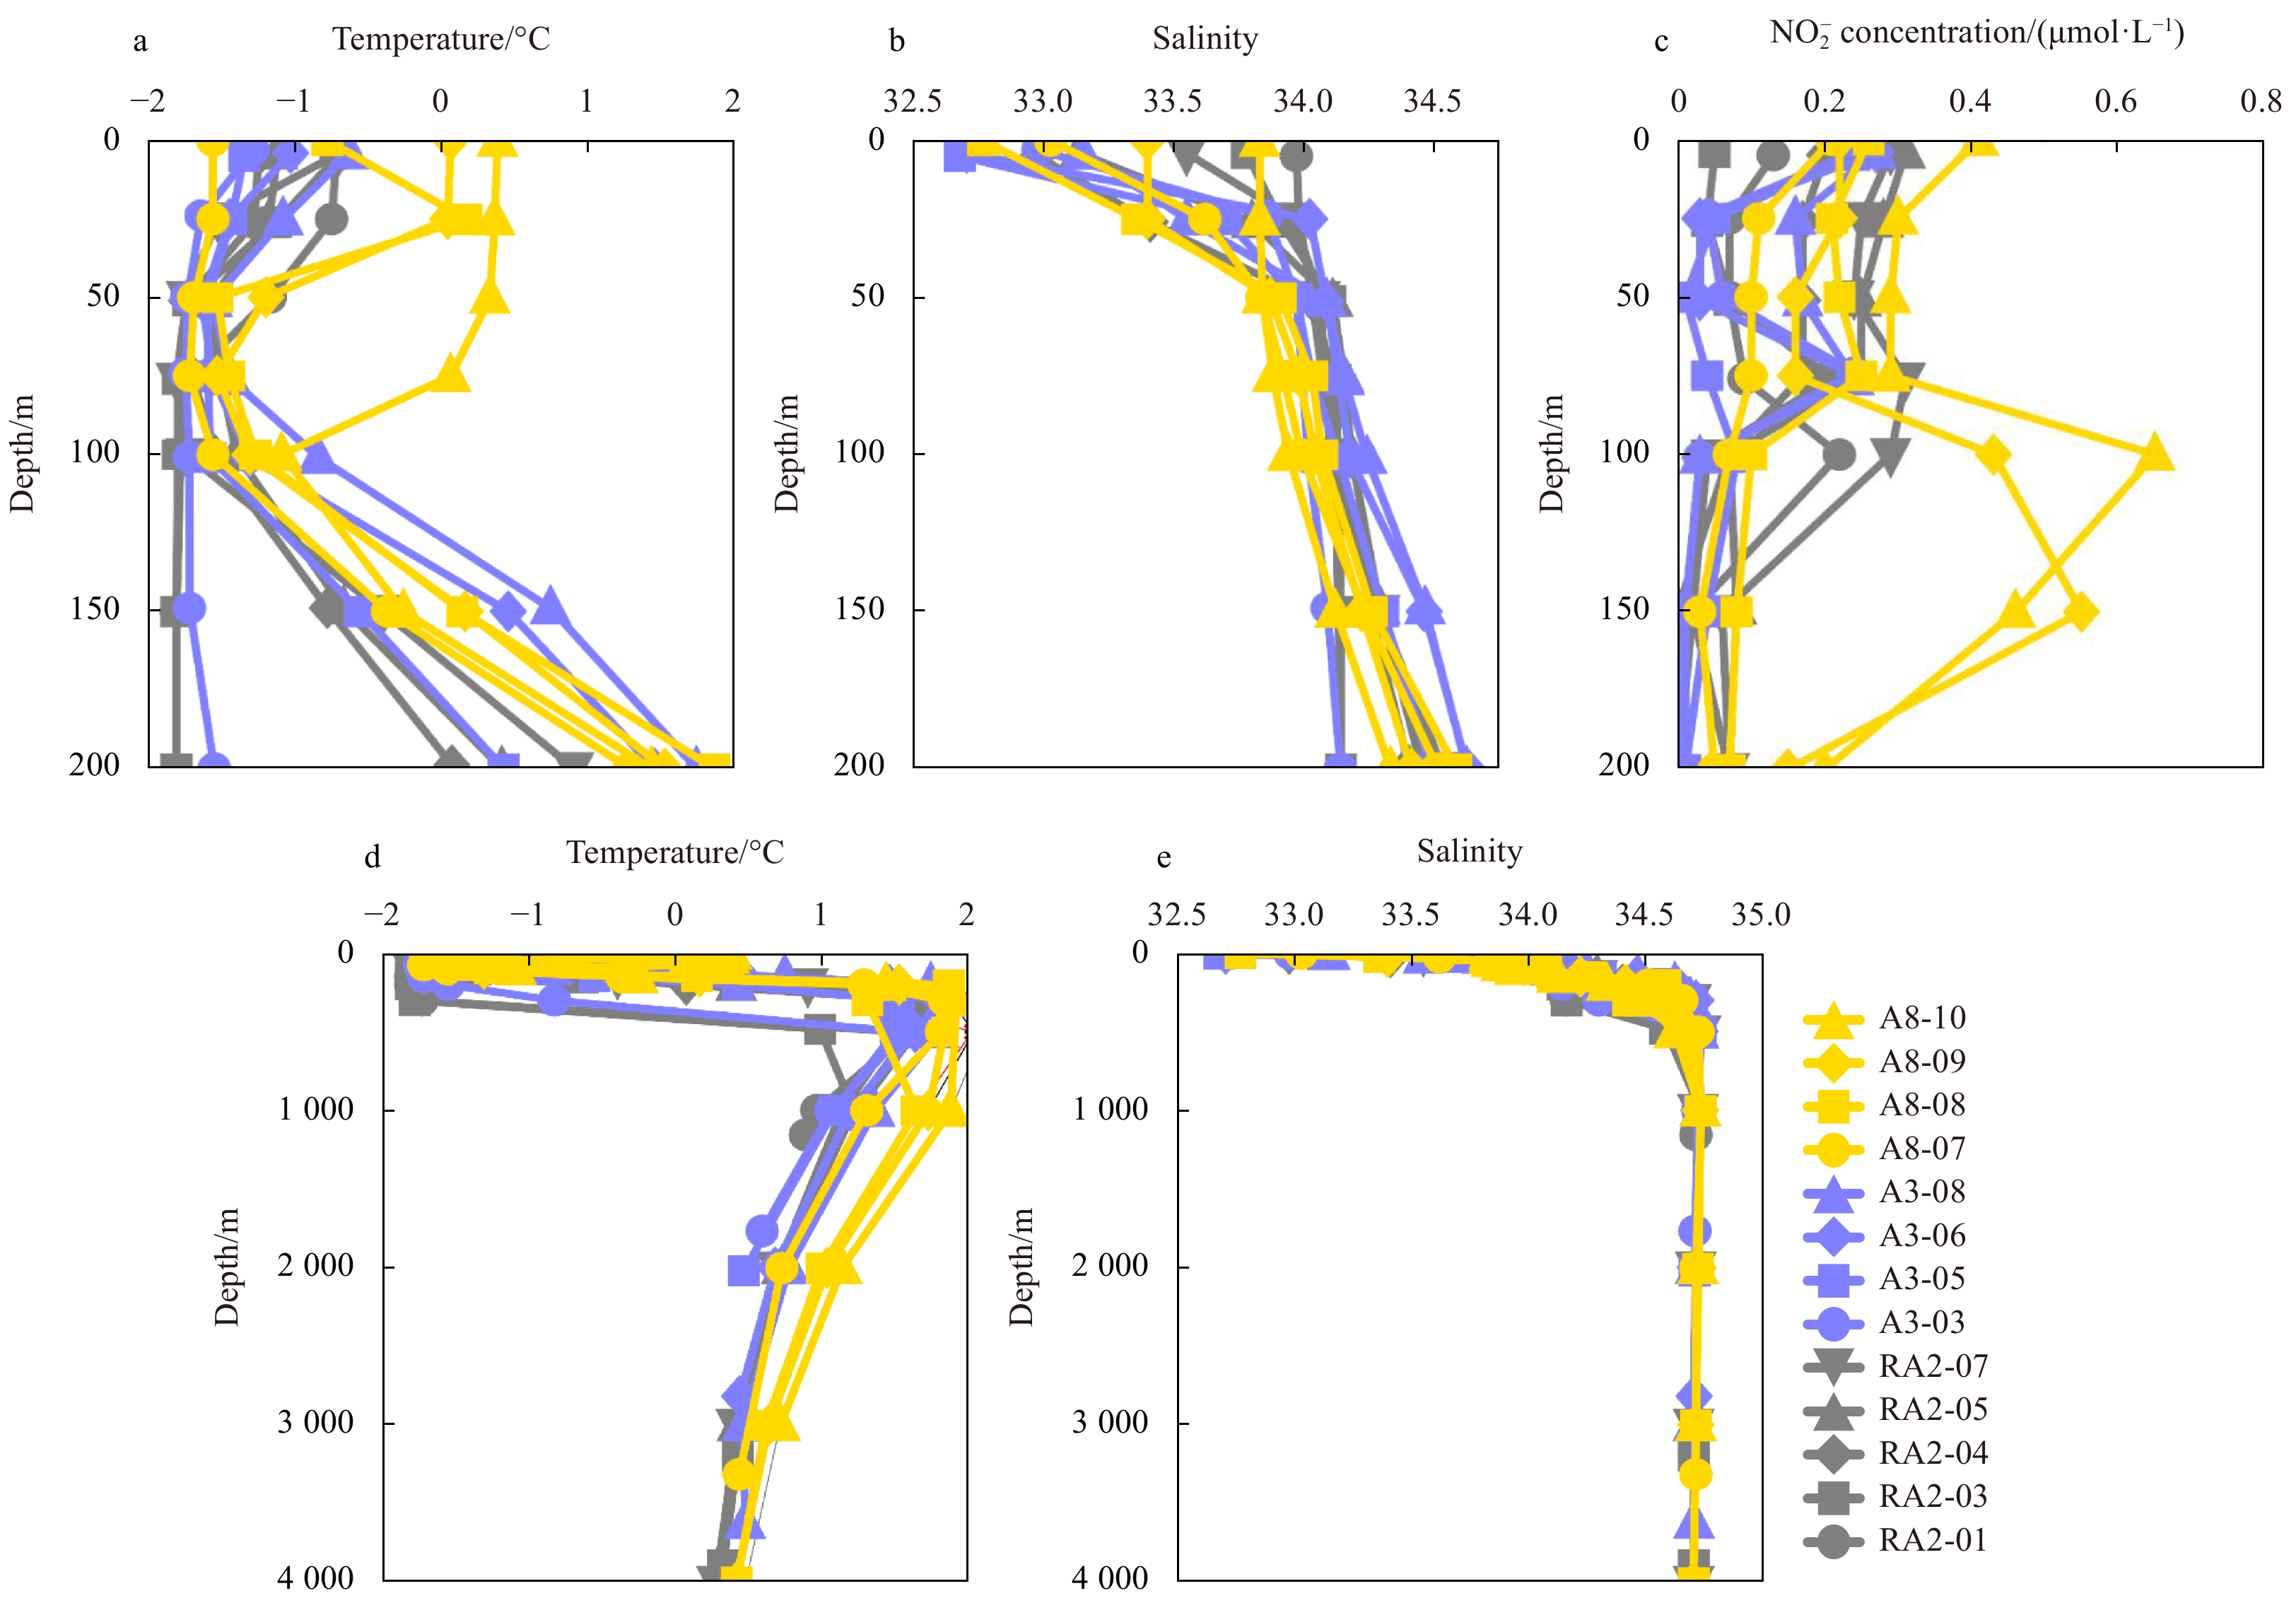
    The sea surface temperature (SST) in the Amundsen Sea ranged from −1.56℃ to 0.38℃, with the largest variation in the Section A8 in the east (Fig. 2a). The temperature minimum (Tmin) and temperature maximum (Tmax) appeared at different depths in sequence, with Tmin at 50−200 m depth and Tmax at 300−500 m depth (except RA2-03 at 1000 m). Below Tmax, the temperature gradually decreased and gradually became stable (Fig. 2d, gray line). Tmin and Tmax are ubiquitous features in the Southern Ocean (Altabet and Francois, 2001; Bindoff et al., 2000; DiFiore et al., 2009, 2010; Kemeny et al., 2016; Fripiat et al., 2019; Smart et al., 2015). The Tmin reflects the characteristics of winter residual water retained in summer (Altabet and Francois, 2001; DiFiore et al., 2010), and the Tmax reflects the influence of Circumpolar Deep Water (Bindoff et al., 2000; DiFiore et al., 2009; Fripiat et al., 2019).

    Figure  2.  Profiles of temperature, salinity and ${{\rm {NO}}_2^-} $ concentration at the Sections RA2 (gray line), A3 (blue line) and A8 (yellow line) in the Amundsen Sea. a and d are the temperature distributions in the water column above 200 m and in the entire water column, respectively; b and e are the salinity distributions in the water column above 200 m and in the entire water column, respectively; c is the distribution of ${{\rm {NO}}_2^-} $ concentration in the water column above 200 m.

    The sea surface salinity in the Amundsen Sea varied between 32.68 and 33.97. Unlike the distribution of SST, the surface salinity in the three regions was relatively uniform. The salinity gradually increased with the increase of depth and stabilized below 500 m (Fig. 2e).

    The ${{\rm {NO}}_2^-} $ concentration in the surface water of the Section RA2 was between 0.05 μmol/L and 0.31 μmol/L, with an average of 0.2 μmol/L (Fig. 2c, gray line). At the depth of 76 m at Station RA2-07 (which is also the depth of Tmin), a subsurface peak of ${{\rm {NO}}_2^-} $ appeared with a concentration of 0.31 μmol/L (Fig. 2c, gray inverted triangle). At a depth of 200 m at all stations, ${{\rm {NO}}_2^-} $ was almost depleted (Fig. 2c). The ${{\rm {NO}}_2^-} $ concentration in water above 200 m in Section A3 was relatively uniform, ranging from 0.24 μmol/L to 0.27 μmol/L. The PNM appeared in the subsurface at Stations A3-03, A3-06 and A3-08 at a concentration of 0.24 μmol/L and at a depth of 74−76 m (Fig. 2c, blue line). Note that the ${{\rm {NO}}_2^-} $ concentration in the PNM of Section A3 was lower than that in Section RA2, but both occurred at similar depths (Fig. 2c). The ${{\rm {NO}}_2^-} $ concentration in the surface water of Section A8 was higher than that in the western and central surface water, and the highest is 0.41 μmol/L. PNM was also evident in Section A8, where the ${{\rm {NO}}_2^-} $ concentration was between 0.55 μmol/L and 0.65 μmol/L, and the occurrence depth was between 100 m and 150 m (Fig. 2c, yellow line). Compared with western and central PNMs, ${{\rm {NO}}_2^-} $ concentrations were higher in eastern PNMs, but the depth of occurrence was consistent. Similar to Sections RA2 and A3, the ${{\rm {NO}}_2^-} $ concentration in Section A8 decreased gradually below PNM (Fig. 2c).

    The distribution of ${{\rm {NH}}_4^+} $ and Chl a in the water column above 200 m in the three stations of Section A8 was shown in Fig. 3. The ${{\rm {NH}}_4^+} $ concentration in the surface water ranged from 0.46 μmol/L to 0.92 μmol/L, with an average of 0.65 μmol/L. Notably, ${{\rm {NH}}_4^+} $ exhibited a subsurface maxima (AM) at a depth of 75 m, with concentrations ranging from 0.85 μmol/L to 1.89 μmol/L (Fig. 3, green line). In addition, deep chlorophyll maxima (DCM) appeared at depths of 25−50 m at the three sites (Fig. 3, gray line). Apparently, DCM, AM, and PNM appeared sequentially with increasing depth in Section A8 in the eastern Amundsen Sea, which is consistent with some previous reports in the oceanic euphotic zone (Mackey et al., 2011; Santoro et al., 2013). The occurrence of PNM along with DCM and AM in our study areas implies that the accumulation of ${{\rm {NO}}_2^-} $ may be related to the biogeochemical processes driven by the remineralization of organic nitrogen.

    Figure  3.  Profiles of ${{\rm {NO}}_2^-} $, ${{\rm {NH}}_4^+} $, and Chl a in the upper 200 m water column at Section A8.

    In the Section RA2 in the western Amundsen Sea, due to the limitation of ${{\rm {NO}}_2^-} $ concentration, profiles of isotopic compositions at two sites, RA2-05 and RA2-07, were obtained. The δ15${\rm{N}}_{{\rm{NO}}_2^-} $ in the surface water was extremely low, with a minimum of −68.5‰±0.2‰, which was 30.5‰ lower than the reported minimum value in the other oceanic euphotic zone (−38‰; Buchwald et al., 2015). In the water column above 100 m, δ15${\rm{N}}_{{\rm{NO}}_2^-} $ increased with depth, and the highest reached −0.8‰±0.3‰ (Fig. 4a, gray line). The extremely low δ15${\rm{N}}_{{\rm{NO}}_2^-} $ we observed is consistent with previously reported values in the Southern Ocean (Chen et al., 2022; Fripiat et al., 2019; Kemeny et al., 2016).

    Figure  4.  Profiles of δ15${\rm{N}}_{{\rm{NO}}_2^-} $ and δ18${\rm{O}}_{{\rm{NO}}_2^-} $ in the Amundsen Sea. VSMOW: Vienna Standard Mean Ocean Water.

    δ18$ {\rm{O}}_{{\rm{NO}}_2^-} $ in the surface water was abnormally high at 57.2‰±0.3‰ (Fig. 4b, gray line), which is 33.3‰ higher than that reported in other oceanic regions (23.9‰; Liu et al., 2020). The profile of δ18$ {\rm{O}}_{{\rm{NO}}_2^-} $ showed a gradual decrease to 9.1‰±0.3‰ with increasing depth in the water column above 100 m, mirroring the variation of δ15$ {\rm{N}}_{{\rm{NO}}_2^-} $ (Fig. 4). These features are consistent with previous results in the Amundsen Sea (Chen et al., 2022).

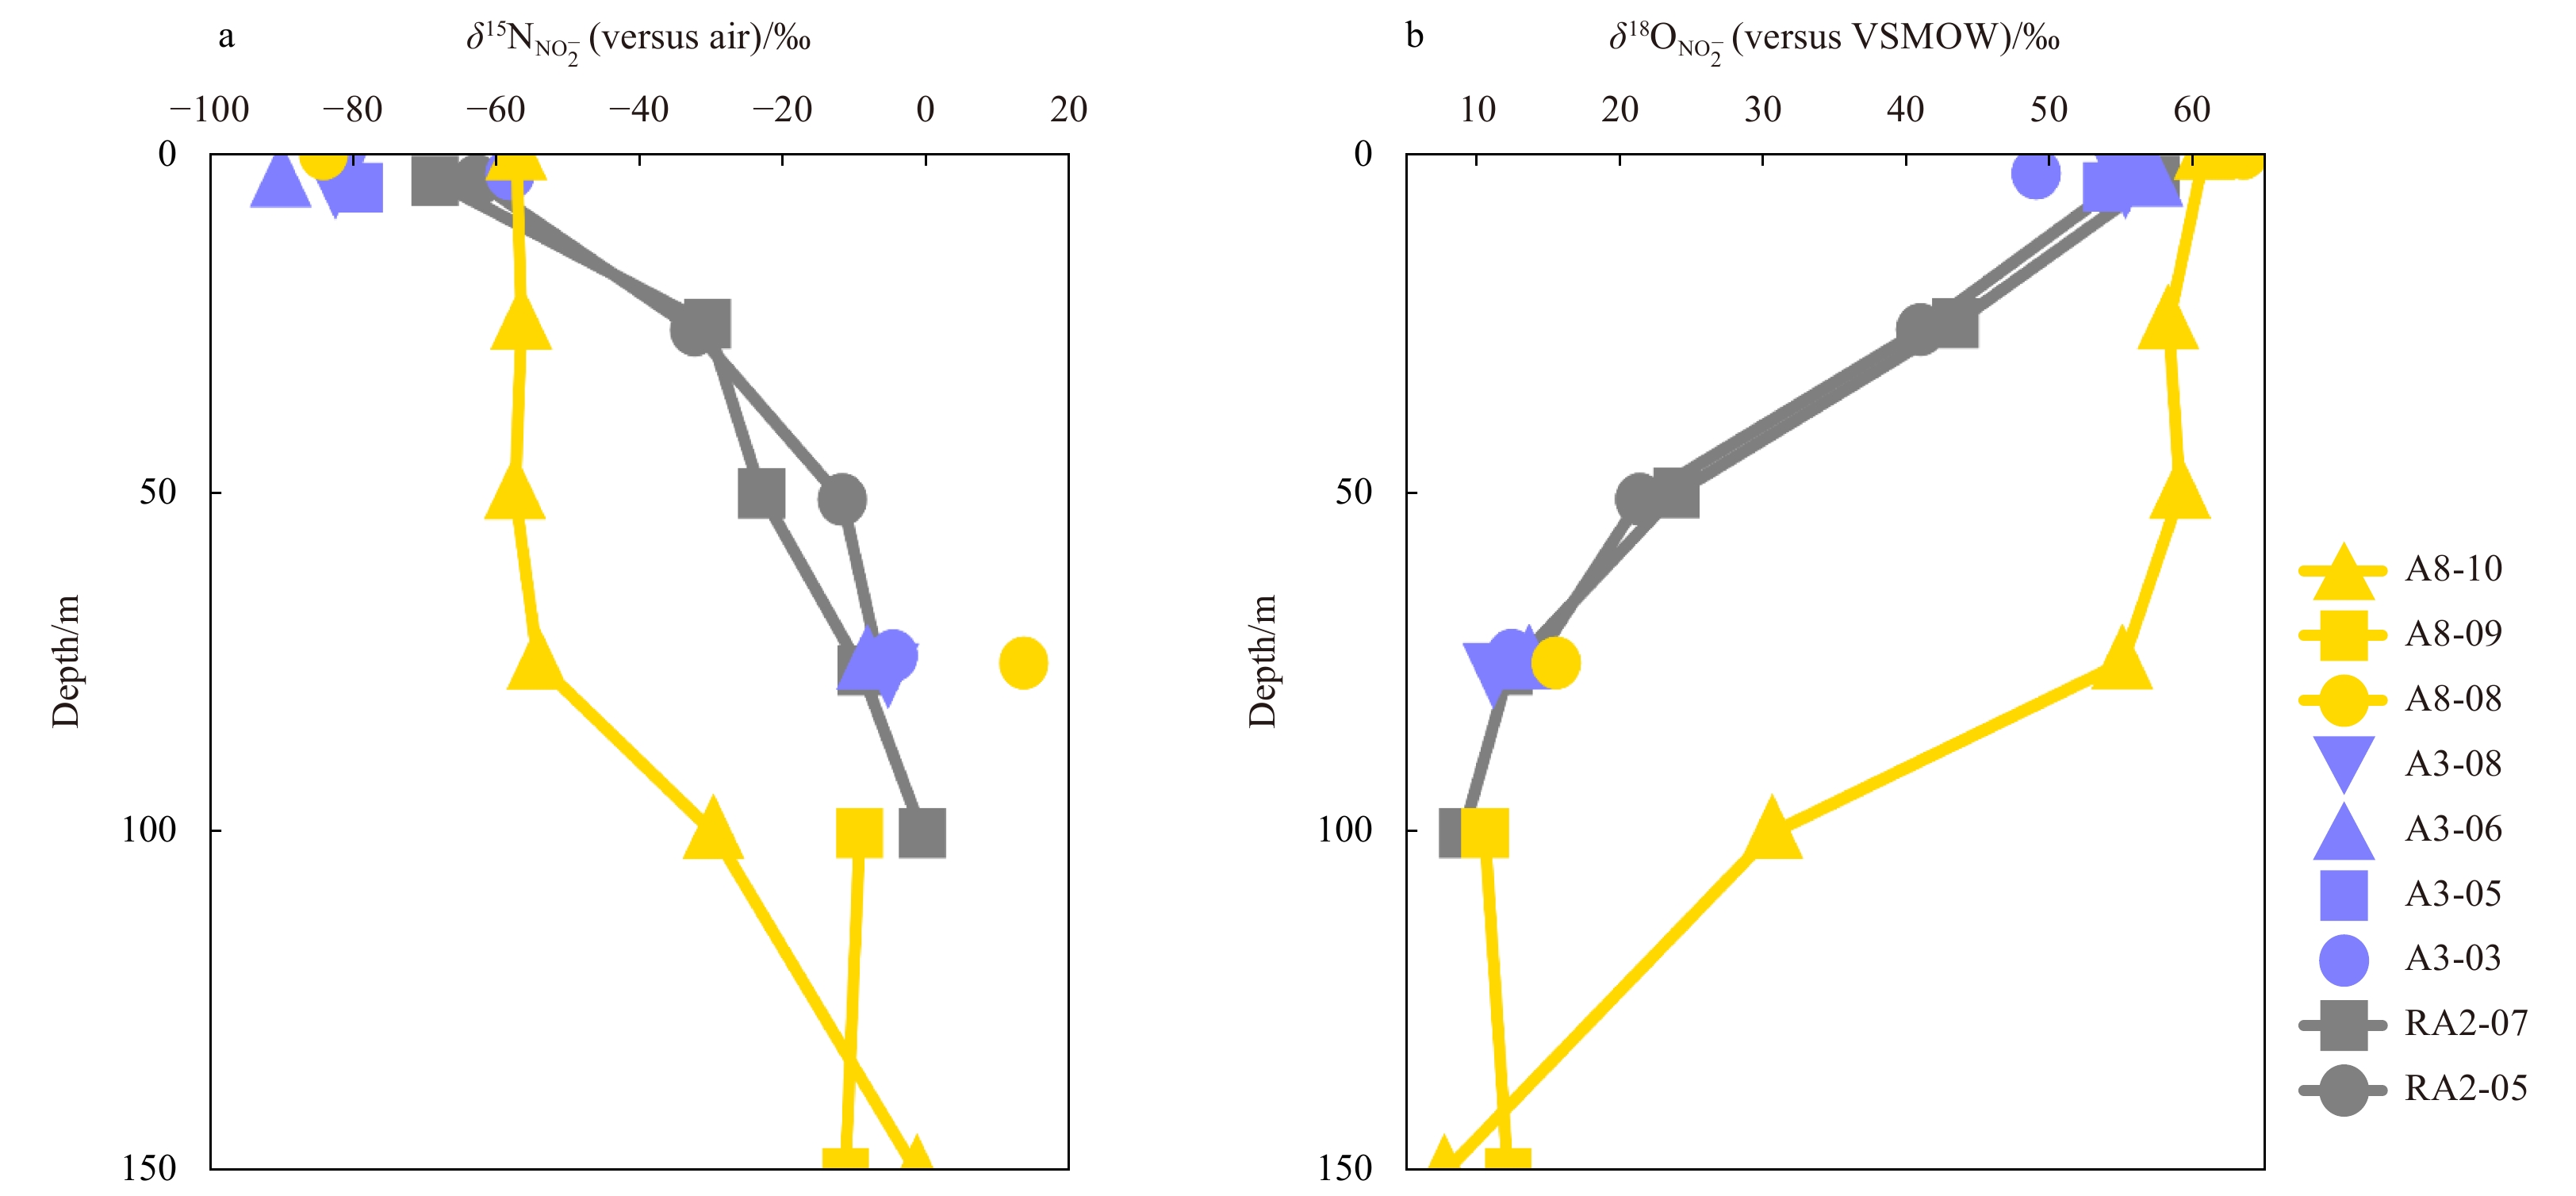
    In the Section A3 of the central Amundsen Sea, the δ15${\rm{N}}_{{\rm{NO}}_2^-}$ in the surface water is also very low, with the lowest value of −89.9‰±0.2‰, which is 13.0% lower than that of Section RA2. Although a complete profile was not obtained due to the limitation of low ${{\rm {NO}}_2^-} $ concentrations, a trend of increasing δ15${\rm{N}}_{{\rm{NO}}_2^-} $ with depth was found (Fig. 4a, expressed in blue). The maximum δ15${\rm{N}}_{{\rm{NO}}_2^-} $ (13.7‰±0.6‰) in Section A3 appeared at a depth of 75 m at Station A3-06, which was significantly higher than the maximum value in Section RA2 (−0.8‰±0.3‰).

    The highest value of δ18${\rm{O}}_{{\rm{NO}}_2^-} $ in the surface water in Section A3 is 57.0‰±0.2‰, which appeared at Station A3-06 with the lowest δ15${\rm{N}}_{{\rm{NO}}_2^-} $ (Fig. 4b, blue triangle), and was also close to the highest value of δ18${\rm{O}}_{{\rm{NO}}_2^-} $ in Section RA2. The δ18${\rm{O}}_{{\rm{NO}}_2^-} $ in Section A3 roughly decreased with increasing depth, and the lowest value is 11.2‰±0.4‰ (Fig. 4b).

    The variation ranges of δ15${\rm{N}}_{{\rm{NO}}_2^-} $ and δ18${\rm{O}}_{{\rm{NO}}_2^-} $ in Section A8 in the Amundsen Sea are −84.0‰±0.2‰ to 13.3‰±0.2‰ and 7.8‰±0.5‰ to 63.3‰±0.3‰, respectively. Similar to the other two sections, δ15${\rm{N}}_{{\rm{NO}}_2^-} $ in Section A8 increased with depth, while δ18${\rm{O}}_{{\rm{NO}}_2^-} $ decreased with depth (Fig. 4, expressed in yellow).

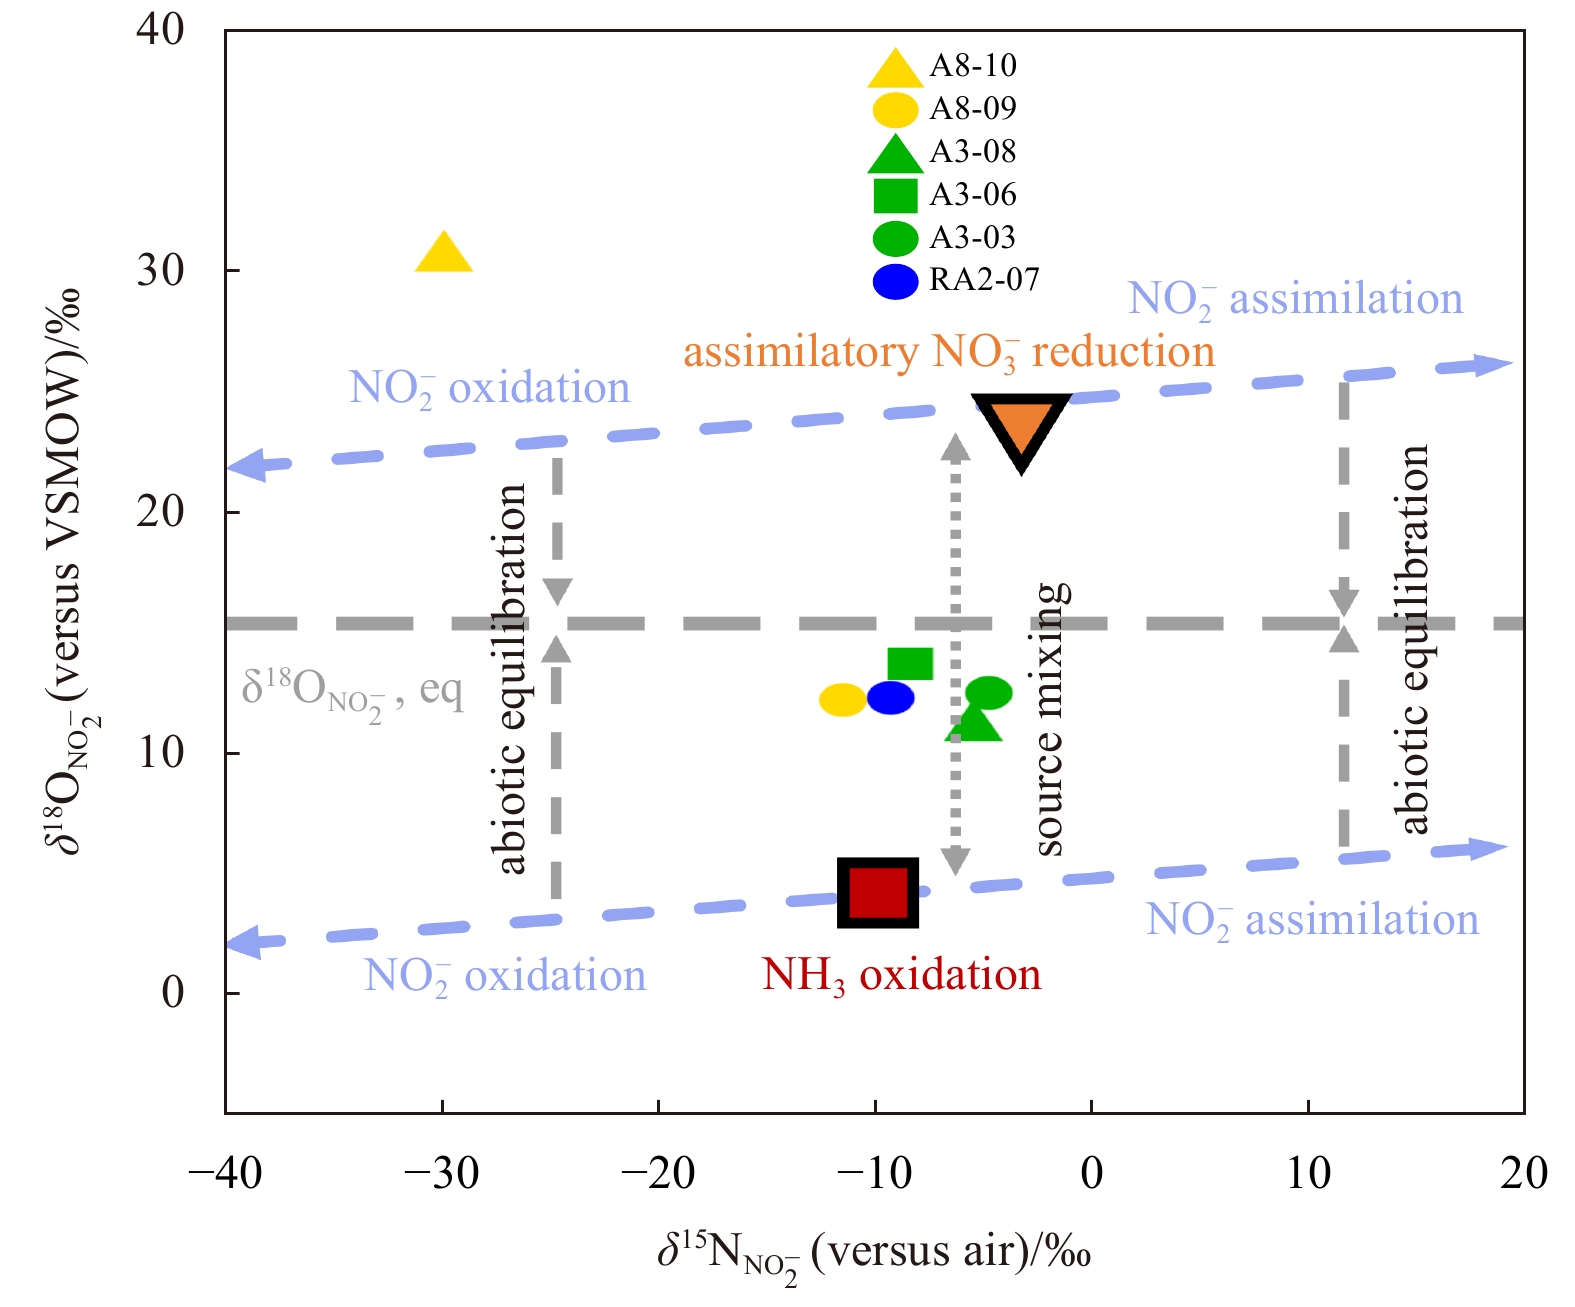
    In this study, the δ15${\rm{N}}_{{\rm{NO}}_2^-} $ and δ18${\rm{O}}_{{\rm{NO}}_2^-} $ in the upper 150 m water column of the Amundsen Sea in summer varied from −89.9‰ to 13.7‰ and from 7.8‰ to 63.3‰, respectively. These values are more anomalous than previous measurements of the Amundsen Sea (Chen et al., 2022). Compared with other oceanic reported values (Buchwald et al., 2015; Casciotti et al., 2013), the Amundsen Sea showed abnormally low δ15${\rm{N}}_{{\rm{NO}}_2^-} $ and abnormally high δ18${\rm{O}}_{{\rm{NO}}_2^-} $ values, reflecting that in addition to the traditional N cycle processes, other process may affect the isotopic composition of ${{\rm {NO}}_2^-} $ (Chen et al., 2022). In the traditional perspective of the N cycle, the N and O isotopic compositions of ${{\rm {NO}}_2^-} $ in the upper water are simultaneously affected by the generation and consumption processes of ${{\rm {NO}}_2^-} $. The two generation processes of ${{\rm {NO}}_2^-} $ are NH3 oxidation and assimilatory ${{\rm {NO}}_3^-} $ reduction, and the two consumption processes are ${{\rm {NO}}_2^-} $ oxidation and ${{\rm {NO}}_2^-} $ assimilation (Casciotti, 2016b; Hutchins and Capone, 2022). Here, we will estimate the range of possible variability of δ15${\rm{N}}_{{\rm{NO}}_2^-} $ and δ18${\rm{O}}_{{\rm{NO}}_2^-} $ in the Amundsen Sea under conventional N cycle regulation based on the isotope fractionation of these source and consumption processes, and then compare with our measurements to reveal other influencing process.

    The theoretical range of δ15${\rm{N}}_{{\rm{NO}}_2^-} $ from assimilatory ${{\rm {NO}}_3^-} $ reduction or NH3 oxidation is assessed below. In the case where the ${{\rm {NO}}_2^-} $ is entirely derived from the assimilated ${{\rm {NO}}_3^-} $ reduction, the possible range of δ15${\rm{N}}_{{\rm{NO}}_2^-} $ depended on the δ15N in the ${{\rm {NO}}_3^-} $ and the replenished during the ${{\rm {NO}}_3^-} $ reduction. In the upper waters of the Southern Ocean, the δ15N value in ${{\rm {NO}}_3^-} $ is 7.4‰ (Fripiat et al., 2019; Kemeny et al., 2016), and the N isotope effect in assimilatory ${{\rm {NO}}_3^-} $ reduction is 5‰ (Granger et al., 2004; Karsh et al., 2012). By assuming that ${{\rm {NO}}_3^-} $ has constant replenishment, consistent initial concentration and isotopic composition, and constant kinetic N isotope effects, it is estimated that the δ15${\rm{N}}_{{\rm{NO}}_2^-} $ produced by assimilatory ${{\rm {NO}}_3^-} $ reduction was 2.4‰. This δ15${\rm{N}}_{{\rm{NO}}_2^-} $ value can be altered by the process of ${{\rm {NO}}_2^-} $ consumption. Since the kinetic effect of N isotopes in phytoplankton assimilation of ${{\rm {NO}}_2^-} $ is about 0‰ (Waser et al., 1998), the δ15N value in residual ${{\rm {NO}}_2^-} $ will remain at 2.4‰ if it is mostly consumed by phytoplankton assimilation. Differently, in the case where ${{\rm {NO}}_2^-} $ is mainly consumed by ${{\rm {NO}}_2^-} $ oxidation, the 15N value of residual ${{\rm {NO}}_2^-} $ is estimated to be between −17.6‰ and −6.6‰, due to the reverse kinetic effect of N isotopes in ${{\rm {NO}}_2^-} $ oxidation ranging from −20‰ to −9‰ (Buchwald and Casciotti, 2010; Casciotti, 2009). Therefore, taking the above estimates together, the range of δ15${\rm{N}}_{{\rm{NO}}_2^-} $ via assimilatory ${{\rm {NO}}_3^-} $ reduction is from −17.6‰ to 2.4‰. Similarly, potential changes in δ15${\rm{N}}_{{\rm{NO}}_2^-} $ from NH3 oxidation were estimated by kinetic fractionation effects of N isotopes during remineralization and NH3 oxidation processes. Since δ15N of ${{\rm {NH}}_4^+} $ was not measured in this study, it is estimated by the δ15N value of particulate organic nitrogen and the isotope effect of organic remineralization. The average δ15N value of particulate organic nitrogen in the euphotic zone of the Southern Ocean is −2‰ (Lourey et al., 2003). We assumed that the δ15N of ${{\rm {NH}}_4^+} $ in the euphotic zone was 3‰ lower than that of particulate organic matter (Buchwald and Casciotti, 2013; Checkley and Miller, 1989; Lehmann et al., 2002; Macko et al., 1986; Peng et al., 2018), and thus estimated the δ15N value of ${{\rm {NH}}_4^+} $ to be −5‰. The fate of ${{\rm {NH}}_4^+} $ in seawater has two main pathways, one is assimilation by phytoplankton, and the other is oxidation of NH3. The fractionation effect of N isotopes in NH3 oxidation is fully manifested in the case that most of the ${{\rm {NH}}_4^+} $ is assimilated by phytoplankton and only a small part is oxidized to ${{\rm {NO}}_2^-} $ (Chen and Chen, 2022; Kemeny et al., 2016). Under this scenario, the δ15${\rm{N}}_{{\rm{NO}}_2^-} $ value estimated from the kinetic N isotope effect (14‰−22‰; Casciotti et al., 2003) in NH3 oxidation varies from −27‰ to −19‰. Another scenario is that ${{\rm {NH}}_4^+} $ is mainly oxidized to ${{\rm {NO}}_2^-} $. In this case, the δ15${\rm{N}}_{{\rm{NO}}_2^-} $ estimated from the kinetic effect of N isotopes in the ${{\rm {NH}}_4^+} $ assimilation by phytoplankton (about 0‰; Hoch et al., 1992; Vo et al., 2013) is close to the value of δ15${\rm{N}}_{{\rm{NH}}_4^+} $ (i.e., −5‰). Meanwhile, δ15${\rm{N}}_{{\rm{NO}}_2^-} $ produced by NH3 oxidation is simultaneously affected by two ${{\rm {NO}}_2^-} $ consumption processes. In the case where ${{\rm {NO}}_2^-} $ is mainly assimilated by phytoplankton, the δ15N value of residual ${{\rm {NO}}_2^-} $ remains unchanged, namely −5‰ or between −27‰ and −19‰. However, in the case where ${{\rm {NO}}_2^-} $ is mainly oxidized to ${{\rm {NO}}_3^-} $, the δ15N value of residual ${{\rm {NO}}_2^-} $ will be between −14‰ and −25‰ or between −47‰ and −28‰.

    Combining the influences of the above conventional N cycle processes, the potential variation range of δ15${\rm{N}}_{{\rm{NO}}_2^-} $ in the euphotic water in the Southern Ocean can be as low as −47‰ and as high as 2.4‰ (Fig. 5a, green shading).

    Figure  5.  δ15${\rm{N}}_{{\rm{NO}}_2^-} $ and δ18${\rm{O}}_{{\rm{NO}}_2^-} $ in water above 150 m in the Amundsen Sea and their influencing factors. Green shading indicates the potential variation range given by the conventional N cycle, blue dashed line indicates the value at which the O isotope exchange between $ {\rm{NO}}_3^- $ and H2O reaches equilibrium. VSMOW: Vienna Standard Mean Ocean Water.

    As one of the sources of ${{\rm {NO}}_2^-} $, ${{\rm {NO}}_2^-} $ produced by assimilatory ${{\rm {NO}}_3^-} $ reduction generally has a higher δ18O value, because the branching oxygen isotope effect between ${{\rm {NO}}_3^-} $ and ${{\rm {NO}}_2^-} $ leads to the enrichment of 18O in ${{\rm {NO}}_2^-} $ (Casciotti et al., 2007). According to the reported δ18O value of ${{\rm {NO}}_3^-} $ in the euphotic zone of the Southern Ocean (3.7‰; Fripiat et al., 2019), kinetic effect of oxygen isotopes (5‰; Granger et al., 2004; Karsh et al., 2012), and branching isotope effect (20‰−30‰; Casciotti et al., 2007), the δ18${\rm{O}}_{{\rm{NO}}_2^-} $ produced by assimilatory ${{\rm {NO}}_3^-} $ reduction is estimated to fall between 18.7‰ and 28.7‰, with an average of 23.7‰. ${{\rm {NO}}_2^-} $ oxidation and assimilation of ${{\rm {NO}}_2^-} $ by phytoplankton may have an effect on δ18${\rm{O}}_{{\rm{NO}}_2^-} $ values. When ${{\rm {NO}}_2^-} $ is mainly consumed by ${{\rm {NO}}_2^-} $ oxidation, it is estimated that the δ18O value of residual ${{\rm {NO}}_2^-} $ may be reduced to between 10.7‰ and 27.7‰ based on the kinetic effect of O isotopes in the oxidation process (from −8‰ to −1‰; Buchwald and Casciotti, 2010). However, when ${{\rm {NO}}_2^-} $ is mainly consumed by phytoplankton assimilation, the δ18O value of residual ${{\rm {NO}}_2^-} $ may be maintained between 18.7‰ and 28.7‰ due to the kinetic effect of O isotope close to 0‰ (Waser et al., 1998). Unlike δ15${\rm{N}}_{{\rm{NO}}_2^-} $, δ18${\rm{O}}_{{\rm{NO}}_2^-} $ is not only affected by biological processes but also by O isotope exchange between ${{\rm {NO}}_2^-} $ and H2O (Buchwald and Casciotti, 2013; Casciotti et al., 2007). Based on the equation for the equilibrium effect of the exchange of O isotopes between ${{\rm {NO}}_2^-} $ and H2O (Buchwald and Casciotti, 2013), the average equilibrium value of δ18${\rm{O}}_{{\rm{NO}}_2^-} $ in water above 200 m in our study areas is estimated to be 15.6‰±0.1‰ from the in situ temperature. This means that if the biological turnover of ${{\rm {NO}}_2^-} $ is faster than the exchange of O isotopes between ${{\rm {NO}}_2^-} $ and H2O, δ18${\rm{O}}_{{\rm{NO}}_2^-} $ will be close to the biogenic characteristic (i.e., falling between 10.7‰ and 28.7‰), otherwise it will be close to the equilibrium value (15.6‰±0.1‰). The time scale for O isotope exchange equilibrium between ${{\rm {NO}}_2^-} $ and H2O is typically weeks to months (Buchwald and Casciotti, 2013; Chen et al., 2021; Chen and Chen, 2022; Newell et al., 2011; Olson, 1981; Santoro et al., 2013; Ward et al., 1984). As the O isotope exchange proceeds, δ18${\rm{O}}_{{\rm{NO}}_2^-} $ will eventually approach 15.6‰±0.1‰ (Fig. 5b, blue dotted line).

    Estimating the potential range of δ18${\rm{O}}_{{\rm{NO}}_2^-} $ produced by NH3 oxidation is more complicated because ${{\rm {NO}}_2^-} $ incorporates O atoms from both H2O and O2 in the process (Buchwald et al., 2012; Casciotti et al., 2010), and O isotope exchange also occurs between ${{\rm {NO}}_2^-} $ and H2O (Buchwald and Casciotti, 2013; Casciotti et al., 2007). According to the equation reported by Buchwald and Casciotti (2013), δ18${\rm{O}}_{{\rm{NO}}_2^-} $ produced from NH3 oxidation is estimated to be 2.9‰ under the assumption that the δ18O value of seawater is −0.5‰ (Chen et al., 2022), the δ18O value of dissolved oxygen is 24.2‰ (Buchwald and Casciotti, 2013), and the O atom exchange fraction between ${{\rm {NO}}_2^-} $ and H2O is 0.08 (Buchwald et al., 2012). After further considering the influence of the two consumption processes of ${{\rm {NO}}_2^-} $, the potential variation range of δ18${\rm{O}}_{{\rm{NO}}_2^-} $ produced by NH3 oxidation may be 2.9‰ or between −5.1‰ and 1.9‰.

    Combining the influences of the above conventional N cycle processes, the potential variation range of δ18${\rm{O}}_{{\rm{NO}}_2^-} $ in the euphotic zone of the Amundsen Sea may vary from −5.1‰ to 28.7‰ (Fig. 5b, green shading). In addition, no matter which biological process produces ${{\rm {NO}}_2^-} $, when the O isotope exchange between ${{\rm {NO}}_2^-} $ and H2O reaches equilibrium, δ18${\rm{O}}_{{\rm{NO}}_2^-} $ will approach the equilibrium value (15.6‰±0.1‰, blue dotted line in Fig. 5b).

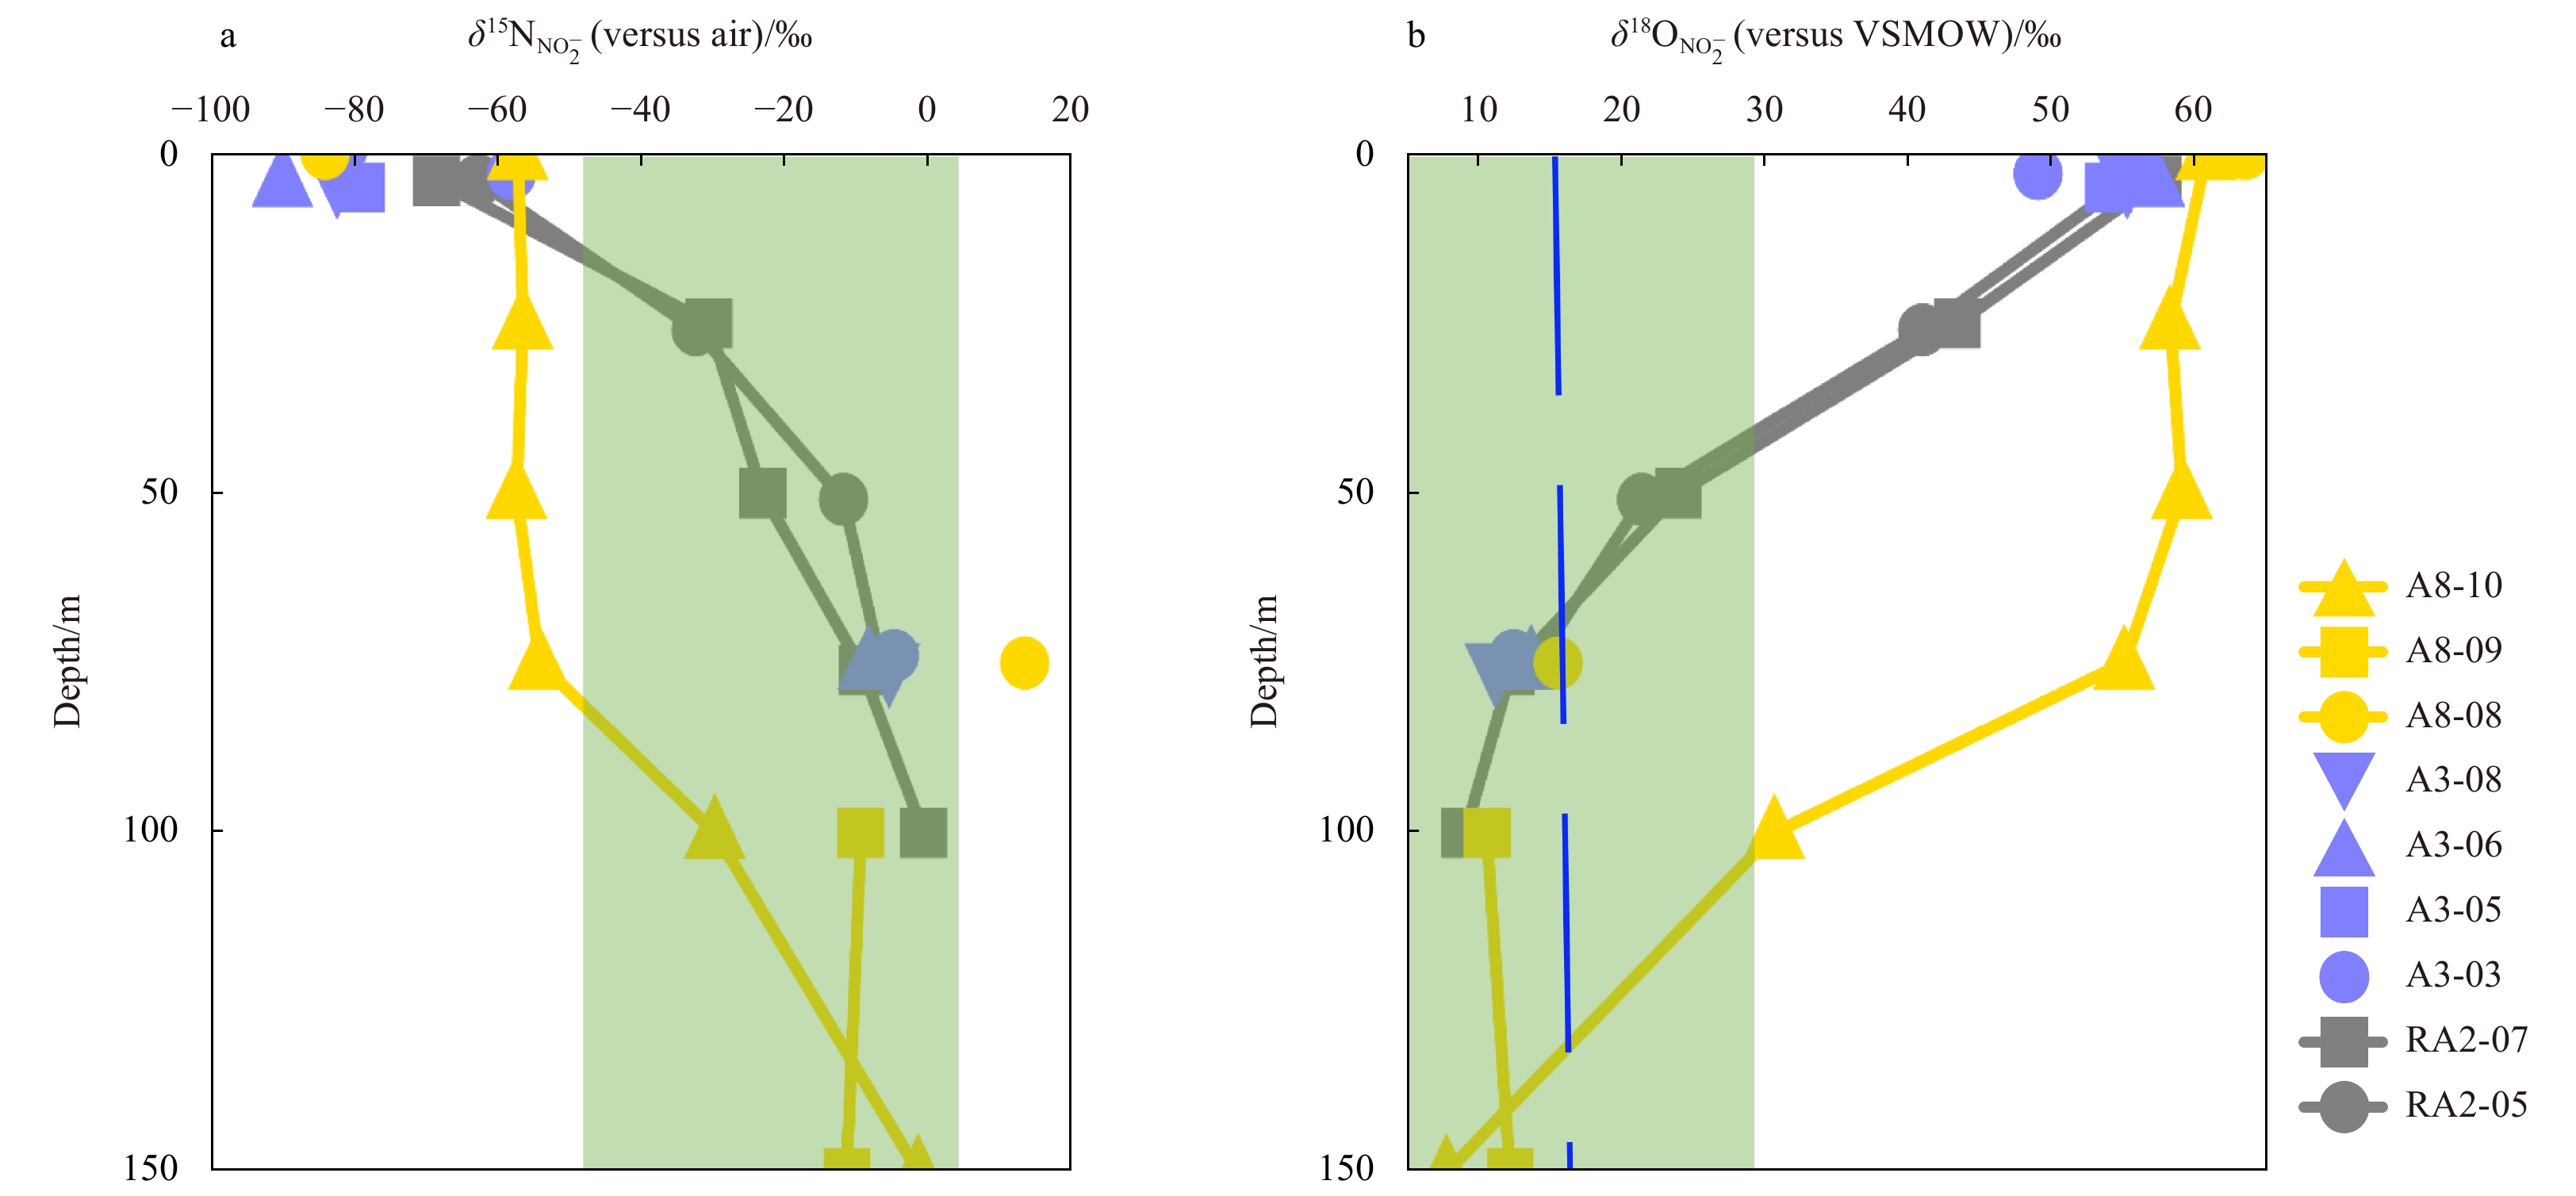
    According to the above isotopic fractionation of the traditional N cycle processes, in the upper water of the Southern Ocean, the variation range of δ15${\rm{N}}_{{\rm{NO}}_2^-} $ is most likely between −47‰ and 2.4‰, and the highest δ18${\rm{O}}_{{\rm{NO}}_2^-} $ is 28.7‰. However, the measured values of δ15${\rm{N}}_{{\rm{NO}}_2^-} $ and δ18${\rm{O}}_{{\rm{NO}}_2^-} $ in water above 150 m in the Amundsen Sea ranged from −89.9‰ to 13.7‰ and from 7.8‰ to 63.3‰, respectively. This means that the observed extremely low δ15${\rm{N}}_{{\rm{NO}}_2^-} $ and extremely high δ18${\rm{O}}_{{\rm{NO}}_2^-} $ cannot be fully explained by conventional biogeochemical processes of the N cycle (Chen et al., 2022). The samples deviating from the range of δ15${\rm{N}}_{{\rm{NO}}_2^-} $ and δ18${\rm{O}}_{{\rm{NO}}_2^-} $ expected by the conventional N cycle mainly occurred in the surface water and the water above 75 m at the three stations of Section A8, where the maximum gap of δ15${\rm{N}}_{{\rm{NO}}_2^-} $ and δ18${\rm{O}}_{{\rm{NO}}_2^-} $ reached −42.9‰ and 34.6‰, respectively (Fig. 5). This large difference implies that there may be an unknown process that alters δ15${\rm{N}}_{{\rm{NO}}_2^-} $ and δ18${\rm{O}}_{{\rm{NO}}_2^-} $, which may be presented throughout the upper water column, but only in these waters that are well expressed. Previous studies have speculated that there may be N isotope exchange between ${{\rm {NO}}_3^-} $ and ${{\rm {NO}}_2^-} $ in the Southern Ocean driven by NOB’s nitrite oxidoreductase (Chen et al., 2022; Fripiat et al., 2019; Kemeny et al., 2016). Kemeny et al. (2016) estimated the equilibrium effect of N isotopes in this exchange reaction to be between −69.2‰ and −59.9‰ based on the mass and isotopic balances of ${{\rm {NO}}_3^-} $ and ${{\rm {NO}}_3^-} $+${{\rm {NO}}_2^-} $. Chen et al. (2022) calculated the equilibrium N isotope effect from δ15${\rm{N}}_{{\rm{NO}}_2^-} $ measurements of −53.9‰±6.4‰. Clearly, the large isotopic fractionation in the N isotope exchange between ${{\rm {NO}}_3^-} $ and ${{\rm {NO}}_2^-} $ could well explain the extremely low δ15${\rm{N}}_{{\rm{NO}}_2^-} $ values observed in this study. Similarly, the observed anomalously high δ18${\rm{O}}_{{\rm{NO}}_2^-} $ can also be explained by isotope exchange reaction stemming from the large equilibrium O isotope effect in this process (37.6‰±3.5‰; Chen et al., 2022).

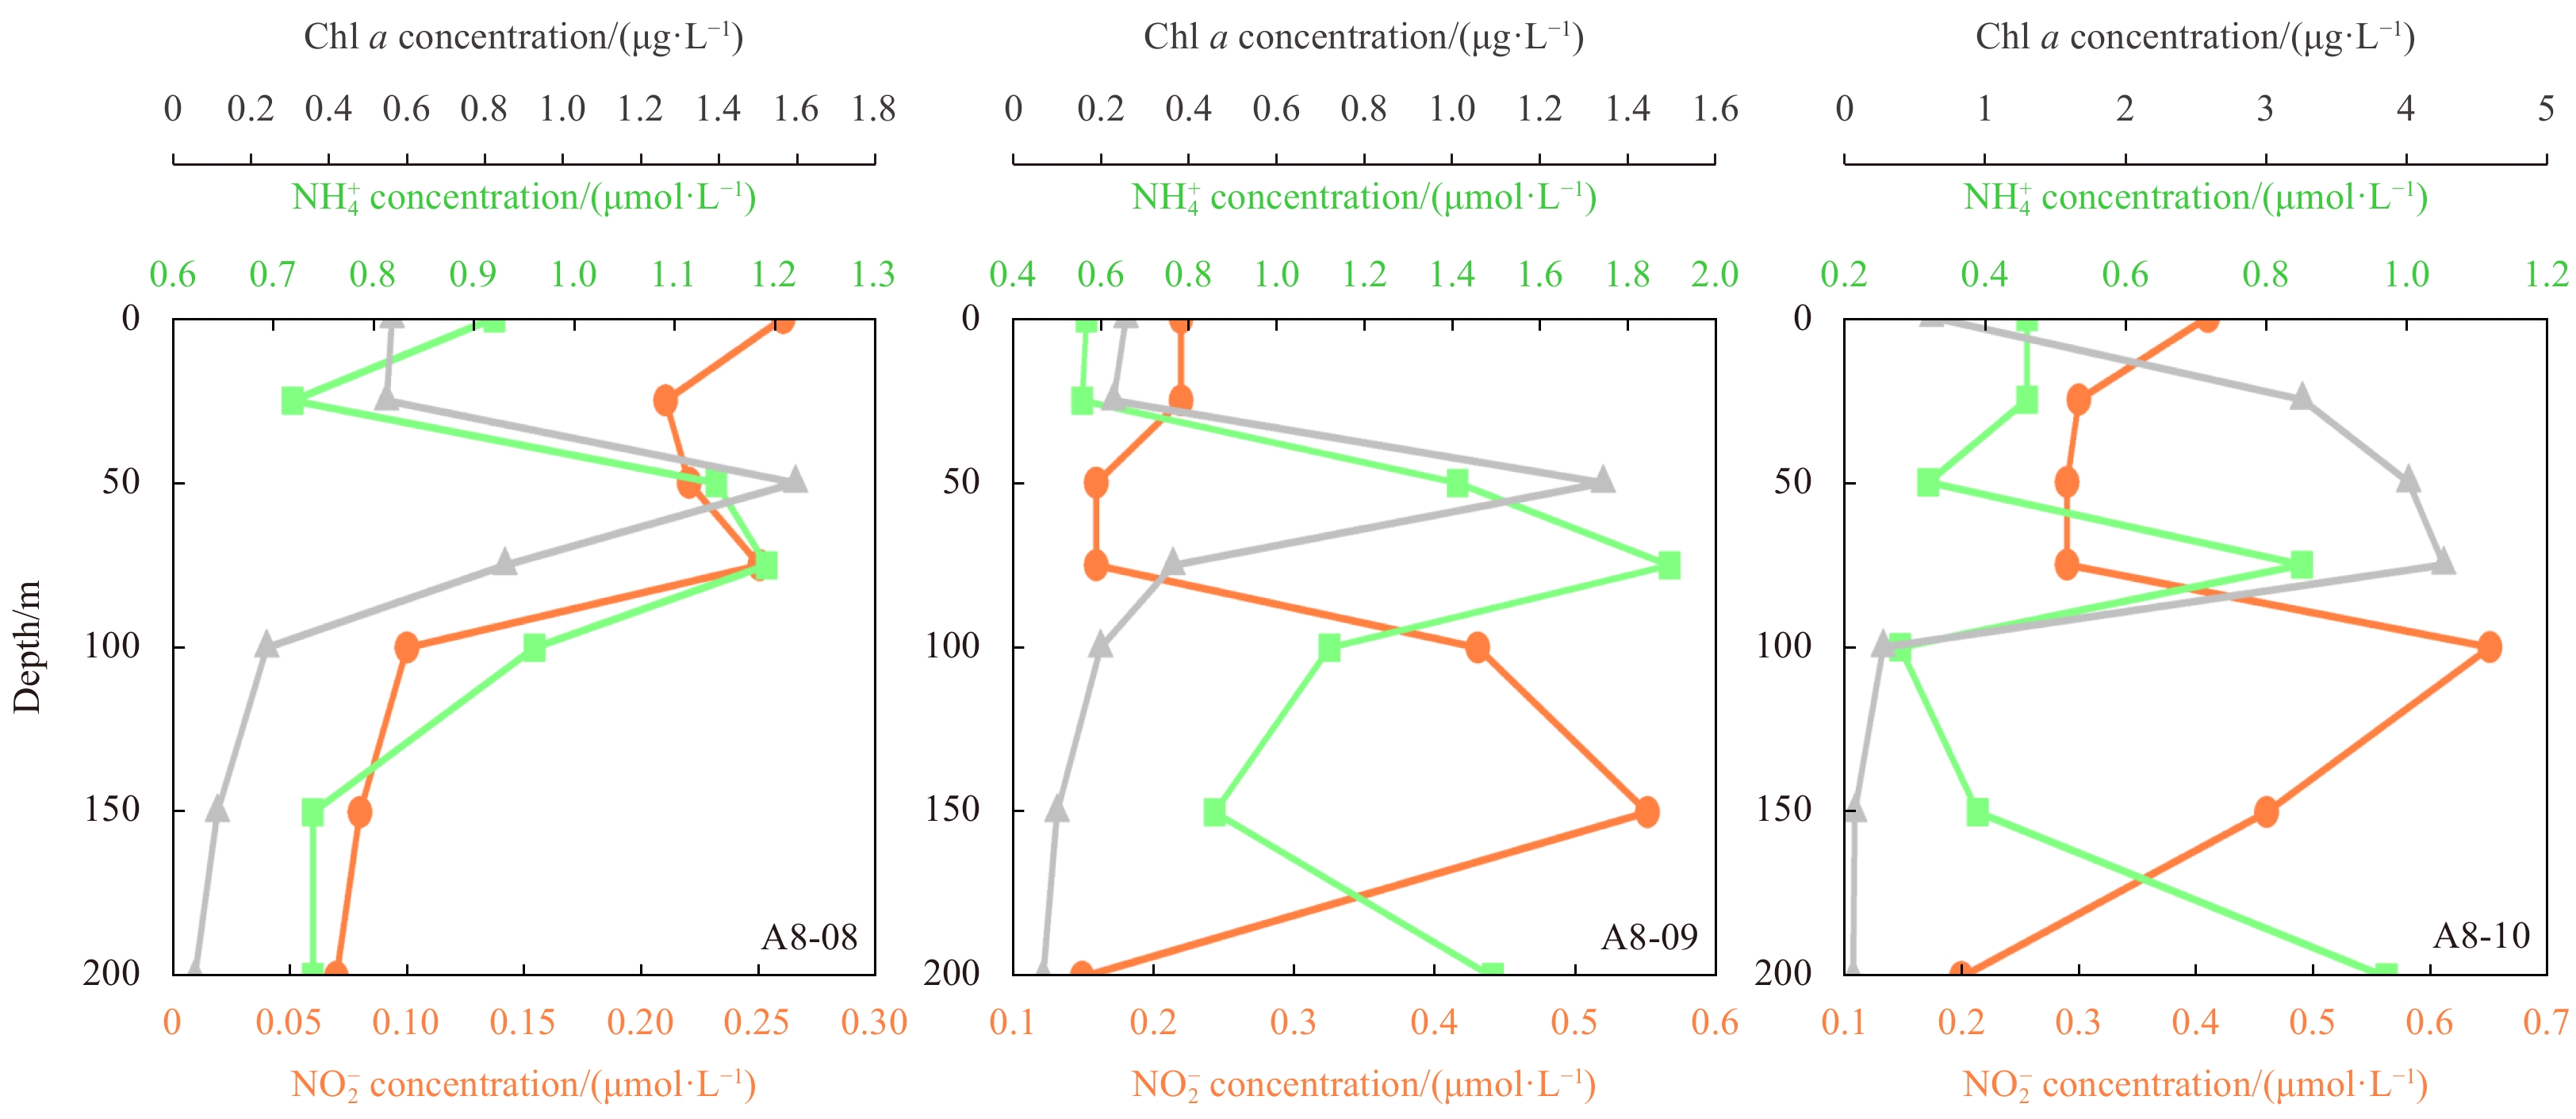
    The existence of PNM has been observed in the three sections of the Amundsen Sea (Fig. 2c). Here, we analyze the source of ${{\rm {NO}}_2^-} $ in these PNMs by using the N and O isotopic composition of ${{\rm {NO}}_2^-} $ to understand the formation mechanism of PNM in the Amundsen Sea.

    The formation of PNM requires that the source of ${{\rm {NO}}_2^-} $ exceeds its consumption on a certain time scale. There are two possible sources of ${{\rm {NO}}_2^-} $ in PNMs of the Amundsen Sea, NH3 oxidation and assimilatory ${{\rm {NO}}_3^-} $ reduction. As discussed above, the endmember values of δ15${\rm{N}}_{{\rm{NO}}_2^-} $ and δ18${\rm{O}}_{{\rm{NO}}_2^-} $ produced by assimilatory ${{\rm {NO}}_3^-} $ reduction are 2.4‰ and 23.7‰, respectively (Fig. 6, orange inverted triangle), while those produced by NH3 oxidation are −5‰ and 2.9‰, respectively (Fig. 6, red square). Whichever source produces the ${{\rm {NO}}_2^-} $, its exchange with water will cause the δ18${\rm{O}}_{{\rm{NO}}_2^-} $ to approach the equilibrium value of 15.6‰±0.1‰ (Fig. 6, thick horizontal dashed line). Therefore, in the case where ${{\rm {NO}}_2^-} $ is mainly provided by NH3 oxidation, δ15${\rm{N}}_{{\rm{NO}}_2^-} $ and δ18${\rm{O}}_{{\rm{NO}}_2^-} $ will fall within the lower region surrounded by the NH3 endmember line and the O isotope exchange equilibrium line (15.6‰±0.1‰). Conversely, in the case where ${{\rm {NO}}_2^-} $ is primarily provided by assimilatory ${{\rm {NO}}_3^-} $ reduction, δ15${\rm{N}}_{{\rm{NO}}_2^-} $ and δ18${\rm{O}}_{{\rm{NO}}_2^-} $ will fall within the upper region surrounded by the assimilatory ${{\rm {NO}}_3^-} $ reduction endmember line and the O isotope exchange equilibrium line (15.6‰±0.1‰) (Fig. 6).

    Figure  6.  The relationship between δ15${\rm{N}}_{{\rm{NO}}_2^-} $ and δ18${\rm{O}}_{{\rm{NO}}_2^-} $ in the PNM of the Amundsen Sea and associated biogeochemical processes (orange inverted triangle and red square represent endmember features produced by NH3 oxidation and assimilatory ${{\rm {NO}}_3^-} $ reduction, respectively, and other color points represent our observed values. ${{\rm {NO}}_2^-} $ oxidation reduces δ15${\rm{N}}_{{\rm{NO}}_2^-} $ and δ18${\rm{O}}_{{\rm{NO}}_2^-} $ (Buchwald and Casciotti, 2010; Casciotti, 2009), while ${{\rm {NO}}_2^-} $ assimilation increases δ15${\rm{N}}_{{\rm{NO}}_2^-} $ and δ18${\rm{O}}_{{\rm{NO}}_2^-} $(Casciotti, 2016a), which is shown as a blue dashed line in the figure). VSMOW: Vienna Standard Mean Ocean Water.

    Our results show that the vast majority of δ15${\rm{N}}_{{\rm{NO}}_2^-} $ and δ18${\rm{O}}_{{\rm{NO}}_2^-} $ data in PNMs in the Amundsen Sea fall in the lower region surrounded by the NH3 endmember line and the O isotope exchange equilibrium line (Fig. 6), which proves that the source of ${{\rm {NO}}_2^-} $ is mainly from NH3 oxidation. In addition, judging from the values of δ15${\rm{N}}_{{\rm{NO}}_2^-} $ in PNMs in the Amundsen Sea may be mainly consumed by assimilation of phytoplankton. Otherwise, if ${{\rm {NO}}_2^-} $ oxidation dominates consumption, the large N isotope effect in the ${{\rm {NO}}_2^-} $ oxidation process will cause the δ15${\rm{N}}_{{\rm{NO}}_2^-} $ value to be far away from the source signal (Fig. 6, red square). An exception is the δ15${\rm{N}}_{{\rm{NO}}_2^-} $ and δ18${\rm{O}}_{{\rm{NO}}_2^-} $ data in the PNM at Station A8-10, which is above the assimilatory ${{\rm {NO}}_3^-} $ reduction endmember line (Fig. 6, yellow triangle). Two possible reasons might explain this phenomenon. One explanation is that the δ18${\rm{O}}_{{\rm{NO}}_2^-} $ value at this station was significantly higher than the equilibrium value (15.6‰±0.1‰), implying that assimilatory ${{\rm {NO}}_3^-} $ reduction may be the main source of ${{\rm {NO}}_2^-} $. Meanwhile, the δ15${\rm{N}}_{{\rm{NO}}_2^-} $ significantly deviates from the endmember value of ${{\rm {NO}}_2^-} $ assimilation by phytoplankton, indicating that ${{\rm {NO}}_2^-} $ may be mainly consumed by ${{\rm {NO}}_2^-} $ oxidation. Another explanation is that δ15${\rm{N}}_{{\rm{NO}}_2^-} $ and δ18${\rm{O}}_{{\rm{NO}}_2^-} $ in the PNM at this station are partially influenced by the ${{\rm {NO}}_3^-} $-${{\rm {NO}}_2^-} $ isotope exchange described above, resulting in a lower δ15${\rm{N}}_{{\rm{NO}}_2^-} $ value and a higher δ18${\rm{O}}_{{\rm{NO}}_2^-} $ value. However, further research is required to reveal the possible reasons.

    The N and O isotopic compositions of ${{\rm {NO}}_2^-} $ suggest that NH3 oxidation plays an important role in the formation of PNM in the Amundsen Sea, which further supports previous conclusions (Chen et al., 2022). Thus, the formation of PNMs in different regions of Amundsen Sea has a common source mechanism, which is consistent with the findings in the Ross Sea (Olson, 1981) and similar to the situation in other sea areas, such as the East Tropical North Pacific (Peng et al., 2015), the Arctic and subarctic oceans (Chen and Chen, 2022), the Arabian Sea (Buchwald and Casciotti, 2013; Newell et al., 2011), the South China Sea (Chen et al., 2021), the East China Sea (Liu et al., 2020), the central California Current (Santoro et al., 2013), the Sargasso Sea (Newell et al., 2013) and the Red Sea (Mackey et al., 2011). Although nitrification may be inhibited by light, it has been reported that AOA remains active under strong light (Smith et al., 2014). Therefore, NH3 oxidation may play a key role in the formation of PNM in the global ocean (Chen and Chen, 2022).

    Measurements of N and O isotopic compositions of ${{\rm {NO}}_2^-} $ in the upper 150 m water column in the Amundsen Sea in the summers of 2019 and 2020 showed that δ15${\rm{N}}_{{\rm{NO}}_2^-} $ has abnormally low values and δ18${\rm{O}}_{{\rm{NO}}_2^-} $ has abnormally high values, especially in surface water. The lowest value of δ15${\rm{N}}_{{\rm{NO}}_2^-} $ and the highest value of δ18${\rm{O}}_{{\rm{NO}}_2^-} $ reached −89.9‰ and 63.3‰, respectively. Spatially, the δ15${\rm{N}}_{{\rm{NO}}_2^-} $ value in the central region of the Amundsen Sea is lower, while the δ18${\rm{O}}_{{\rm{NO}}_2^-} $ value in three regions is relatively uniform. These outliers are beyond what can be explained by isotopic effects of traditional N conversion processes. Isotope exchanges between ${{\rm {NO}}_3^-} $ and ${{\rm {NO}}_2^-} $ with large isotopic effects and inverse changes in N and O isotopes have been proposed to be responsible for these anomalous values. The mirror changes in the δ15${\rm{N}}_{{\rm{NO}}_2^-} $ and δ18${\rm{O}}_{{\rm{NO}}_2^-} $ profiles support the possibility of this isotope exchange reaction. Regardless of the effect of the isotopic exchange between ${{\rm {NO}}_3^-} $ and ${{\rm {NO}}_2^-} $, the relationship between δ15${\rm{N}}_{{\rm{NO}}_2^-} $ and δ18${\rm{O}}_{{\rm{NO}}_2^-} $ shows that the data in PNMs are mostly close to the endmember characteristics of NH3 oxidation and deviate from assimilatory ${{\rm {NO}}_3^-} $ reduction, indicating that NH3 oxidation plays an important role in the formation of PNM in the Amundsen Sea. Future research needs to reveal whether the isotope exchange between ${{\rm {NO}}_3^-} $ and ${{\rm {NO}}_2^-} $ is widespread in the Southern Ocean. Further applying of the dual isotopes of ${{\rm {NO}}_2^-} $ is necessary to deepen our understanding of N cycle in the Southern Ocean.

    Acknowledgements: We would like to thank Libao Gao’s group at First Institute of Oceanography, Ministry of Natural Resources for providing data on T, S and Chl a concentration, and Jianming Pan’s group at Second Institute of Oceanography, Ministry of Natural Resources for providing data on \begin{document}${\rm{NO}}_2^- $\end{document} and \begin{document}${{\rm {NH}}_4^+} $\end{document}. Thanks to R/V Xuelong and R/V Xuelong 2 for their assistance in sample collection.
  • Altabet M A, Francois R. 2001. Nitrogen isotope biogeochemistry of the Antarctic Polar Frontal Zone at 170°W. Deep-Sea Research Part II: Topical Studies in Oceanography, 48(19–20): 4247–4273
    Bett D T, Holland P R, Garabato A C N, et al. 2020. The impact of the Amundsen Sea freshwater balance on ocean melting of the west Antarctic ice sheet. Journal of Geophysical Research: Oceans, 125(9): e2020JC016305
    Bindoff N L, Rosenberg M A, Warner M J. 2000. On the circulation and water masses over the Antarctic continental slope and rise between 80 and 150°E. Deep-Sea Research Part II: Topical Studies in Oceanography, 47(12–13): 2299–2326
    Bourbonnais A, Altabet M A, Charoenpong C N, et al. 2015. N-loss isotope effects in the Peru oxygen minimum zone studied using a mesoscale eddy as a natural tracer experiment. Global Biogeochemical Cycles, 29(6): 793–811. doi: 10.1002/2014GB005001
    Brandhorst W. 1959. Nitrification and denitrification in the eastern tropical North Pacific. ICES Journal of Marine Science, 25(1): 3–20. doi: 10.1093/icesjms/25.1.3
    Buchwald C, Casciotti K L. 2010. Oxygen isotopic fractionation and exchange during bacterial nitrite oxidation. Limnology and Oceanography, 55(3): 1064–1074. doi: 10.4319/lo.2010.55.3.1064
    Buchwald C, Casciotti K L. 2013. Isotopic ratios of nitrite as tracers of the sources and age of oceanic nitrite. Nature Geoscience, 6(4): 308–313. doi: 10.1038/ngeo1745
    Buchwald C, Santoro A E, McIlvin M R, et al. 2012. Oxygen isotopic composition of nitrate and nitrite produced by nitrifying cocultures and natural marine assemblages. Limnology and Oceanography, 57(5): 1361–1375. doi: 10.4319/lo.2012.57.5.1361
    Buchwald C, Santoro A E, Stanley R H R, et al. 2015. Nitrogen cycling in the secondary nitrite maximum of the eastern tropical North Pacific off Costa Rica. Global Biogeochemical Cycles, 29(12): 2061–2081. doi: 10.1002/2015GB005187
    Casciotti K L. 2009. Inverse kinetic isotope fractionation during bacterial nitrite oxidation. Geochimica et Cosmochimica Acta, 73(7): 2061–2076. doi: 10.1016/j.gca.2008.12.022
    Casciotti K L. 2016a. Nitrite isotopes as tracers of marine N cycle processes. Philosophical Transactions of the Royal Society A Mathematical, Physical and Engineering Sciences, 374(2081): 20150295
    Casciotti K L. 2016b. Nitrogen and oxygen isotopic studies of the marine nitrogen cycle. Annual Review of Marine Science, 8: 379–407. doi: 10.1146/annurev-marine-010213-135052
    Casciotti K L, Böhlke J K, McIlvin M R, et al. 2007. Oxygen isotopes in nitrite: analysis, calibration, and equilibration. Analytical Chemistry, 79(6): 2427–2436. doi: 10.1021/ac061598h
    Casciotti K L, Buchwald C, McIlvin M. 2013. Implications of nitrate and nitrite isotopic measurements for the mechanisms of nitrogen cycling in the Peru oxygen deficient zone. Deep-Sea Research Part I: Oceanographic Research Papers, 80: 78–93. doi: 10.1016/j.dsr.2013.05.017
    Casciotti K L, McIlvin M, Buchwald C. 2010. Oxygen isotopic exchange and fractionation during bacterial ammonia oxidation. Limnology and Oceanography, 55(2): 753–762. doi: 10.4319/lo.2010.55.2.0753
    Casciotti K L, Sigman D M, Hastings M G, et al. 2002. Measurement of the oxygen isotopic composition of nitrate in seawater and freshwater using the denitrifier method. Analytical Chemistry, 74(19): 4905–4912. doi: 10.1021/ac020113w
    Casciotti K L, Sigman D M, Ward B B. 2003. Linking diversity and stable isotope fractionation in ammonia-oxidizing bacteria. Geomicrobiology Journal, 20(4): 335–353. doi: 10.1080/01490450303895
    Chalk T B, Hain M P, Foster G L, et al. 2017. Causes of ice age intensification across the mid-pleistocene transition. Proceedings of the National Academy of Sciences of the United States of America, 114(50): 13114–13119. doi: 10.1073/pnas.1702143114
    Checkley Jr D M, Miller C A. 1989. Nitrogen isotope fractionation by oceanic zooplankton. Deep-Sea Research Part A: Oceanographic Research Papers, 36(10): 1449–1456
    Chen Yangjun, Bardhan P, Zhao Xiufeng, et al. 2021. Nitrite cycle indicated by dual isotopes in the northern South China Sea. Journal of Geophysical Research: Biogeosciences, 126(7): e2020JG006129
    Chen Yangjun, Chen Min. 2022. Nitrite cycling in warming Arctic and subarctic waters. Geophysical Research Letters, 49(12): e2021-GL096947
    Chen Yangjun, Chen Min, Chen Jinxu, et al. 2022. Dual isotopes of nitrite in the Amundsen Sea in summer. Science of the Total Environment, 843: 157055. doi: 10.1016/j.scitotenv.2022.157055
    Codispoti L A, Friederich G E, Packard T T, et al. 1986. High nitrite levels off northern Peru: a signal of instability in the marine denitrification rate. Science, 233(4769): 1200–1202. doi: 10.1126/science.233.4769.1200
    DiFiore P J, Sigman D M, Dunbar R B. 2009. Upper ocean nitrogen fluxes in the Polar Antarctic Zone: constraints from the nitrogen and oxygen isotopes of nitrate. Geochemistry, Geophysics, Geosystems, 10(11): Q11016
    DiFiore P J, Sigman D M, Karsh K L, et al. 2010. Poleward decrease in the isotope effect of nitrate assimilation across the Southern Ocean. Geophysical Research Letters, 37(17): L17601
    DiFiore P J, Sigman D M, Trull T W, et al. 2006. Nitrogen isotope constraints on subantarctic biogeochemistry. Journal of Geophysical Research: Oceans, 111(C8): C08016
    Dore J E, Karl D M. 1996. Nitrification in the euphotic zone as a source for nitrite, nitrate, and nitrous oxide at station ALOHA. Limnology and Oceanography, 41(8): 1619–1628. doi: 10.4319/lo.1996.41.8.1619
    Fripiat F, Elskens M, Trull T W, et al. 2015a. Significant mixed layer nitrification in a natural iron-fertilized bloom of the Southern Ocean. Global Biogeochemical Cycles, 29(11): 1929–1943. doi: 10.1002/2014GB005051
    Fripiat F, Martínez-García A, Fawcett S E, et al. 2019. The isotope effect of nitrate assimilation in the Antarctic Zone: Improved estimates and paleoceanographic implications. Geochimica et Cosmochimica Acta, 247: 261–279. doi: 10.1016/j.gca.2018.12.003
    Fripiat F, Sigman D M, Fawcett S E, et al. 2014. New insights into sea ice nitrogen biogeochemical dynamics from the nitrogen isotopes. Global Biogeochemical Cycles, 28(2): 115–130. doi: 10.1002/2013GB004729
    Fripiat F, Sigman D M, Massé G, et al. 2015b. High turnover rates indicated by changes in the fixed N forms and their stable isotopes in Antarctic landfast sea ice. Journal of Geophysical Research: Oceans, 120(4): 3079–3097. doi: 10.1002/2014JC010583
    Froneman P W, Laubscher R K, Mcquaid C D. 2001. Size-fractionated primary production in the South Atlantic and Atlantic sectors of the Southern Ocean. Journal of Plankton Research, 23(6): 611–622. doi: 10.1093/plankt/23.6.611
    Granger J, Boshers D S, Böhlke J K, et al. 2020. The influence of sample matrix on the accuracy of nitrite N and O isotope ratio analyses with the azide method. Rapid Communications in Mass Spectrometry, 34(1): e8569
    Granger J, Sigman D M, Needoba J A, et al. 2004. Coupled nitrogen and oxygen isotope fractionation of nitrate during assimilation by cultures of marine phytoplankton. Limnology and Oceanography, 49(5): 1763–1773. doi: 10.4319/lo.2004.49.5.1763
    Hoch M P, Fogel M L, Kirchman D L. 1992. Isotope fractionation associated with ammonium uptake by a marine bacterium. Limnology and Oceanography, 37(7): 1447–1459. doi: 10.4319/lo.1992.37.7.1447
    Hu H, Bourbonnais A, Larkum J, et al. 2016. Nitrogen cycling in shallow low-oxygen coastal waters off Peru from nitrite and nitrate nitrogen and oxygen isotopes. Biogeosciences, 13(5): 1453–1468. doi: 10.5194/bg-13-1453-2016
    Hutchins D A, Capone D G. 2022. The marine nitrogen cycle: new developments and global change. Nature Reviews Microbiology, 20(7): 401–414. doi: 10.1038/s41579-022-00687-z
    Jaccard S L, Hayes C T, Martínez-García A, et al. 2013. Two modes of change in Southern Ocean productivity over the past million years. Science, 339(6126): 1419–1423. doi: 10.1126/science.1227545
    Jochem F J, Mathot S, Quéguiner B. 1995. Size-fractionated primary production in the open Southern Ocean in austral spring. Polar Biology, 15(6): 381–392
    Karsh K L, Granger J, Kritee K, et al. 2012. Eukaryotic assimilatory nitrate reductase fractionates N and O isotopes with a ratio near unity. Environmental Science & Technology, 46(11): 5727–5735
    Kemeny P C, Weigand M A, Zhang R, et al. 2016. Enzyme-level interconversion of nitrate and nitrite in the fall mixed layer of the Antarctic Ocean. Global Biogeochemical Cycles, 30(7): 1069–1085. doi: 10.1002/2015GB005350
    Kiefer D A, Olson R J, Holm-Hansen O. 1976. Another look at the nitrite and chlorophyll maxima in the central North Pacific. Deep-Sea Research and Oceanographic Abstracts, 23(12): 1199–1208. doi: 10.1016/0011-7471(76)90895-0
    Kobayashi K, Fukushima K, Onishi Y, et al. 2021. Influence of δ18O of water on measurements of δ18O of nitrite and nitrate. Rapid Communications in Mass Spectrometry, 35(2): e8979
    Kowalchuk G A, Stephen J R. 2001. Ammonia-oxidizing bacteria: a model for molecular microbial ecology. Annual Review of Microbiology, 55: 485–529. doi: 10.1146/annurev.micro.55.1.485
    Lehmann M F, Bernasconi S M, Barbieri A, et al. 2002. Preservation of organic matter and alteration of its carbon and nitrogen isotope composition during simulated and in situ early sedimentary diagenesis. Geochimica et Cosmochimica Acta, 66(20): 3573–3584. doi: 10.1016/S0016-7037(02)00968-7
    Liu Sumei, Ning Xiaoyan, Dong Shuhang, et al. 2020. Source versus recycling influences on the isotopic composition of nitrate and nitrite in the East China Sea. Journal of Geophysical Research: Oceans, 125(8): e2020JC016061
    Lomas M W, Lipschultz F. 2006. Forming the primary nitrite maximum: nitrifiers or phytoplankton?. Limnology and Oceanography, 51(5): 2453–2467. doi: 10.4319/lo.2006.51.5.2453
    Lourey M J, Trull T W, Sigman D M. 2003. Sensitivity of δ15N of nitrate, surface suspended and deep sinking particulate nitrogen to seasonal nitrate depletion in the Southern Ocean. Global Biogeochemical Cycles, 17(3): 1081
    Mackey K R M, Bristow L, Parks D R, et al. 2011. The influence of light on nitrogen cycling and the primary nitrite maximum in a seasonally stratified sea. Progress in Oceanography, 91(4): 545–560. doi: 10.1016/j.pocean.2011.09.001
    Macko S A, Estep M L F, Engel M H, et al. 1986. Kinetic fractionation of stable nitrogen isotopes during amino acid transamination. Geochimica et Cosmochimica Acta, 50(10): 2143–2146. doi: 10.1016/0016-7037(86)90068-2
    Martin J H, Gordon R M, Fitzwater S E. 1990. Iron in Antarctic waters. Nature, 345(6271): 156–158. doi: 10.1038/345156a0
    Martínez-Garcia A, Rosell-Melé A, Jaccard S L, et al. 2011. Southern Ocean dust-climate coupling over the past four million years. Nature, 476(7360): 312–315. doi: 10.1038/nature10310
    McIlvin M R, Altabet M A. 2005. Chemical conversion of nitrate and nitrite to nitrous oxide for nitrogen and oxygen isotopic analysis in freshwater and seawater. Analytical Chemistry, 77(17): 5589–5595. doi: 10.1021/ac050528s
    Mdutyana M, Thomalla S J, Philibert R, et al. 2020. The seasonal cycle of nitrogen uptake and nitrification in the Atlantic sector of the Southern Ocean. Global Biogeochemical Cycles, 34(7): e2019GB006363
    Mitchell B G, Brody E A, Holm-Hansen O, et al. 1991. Light limitation of phytoplankton biomass and macronutrient utilization in the Southern Ocean. Limnology and Oceanography, 36(8): 1662–1677. doi: 10.4319/lo.1991.36.8.1662
    Moore C M, Mills M M, Arrigo K R, et al. 2013. Processes and patterns of oceanic nutrient limitation. Nature Geoscience, 6(9): 701–710. doi: 10.1038/ngeo1765
    Naughten K A, Holland P R, Dutrieux P, et al. 2022. Simulated twentieth-century ocean warming in the Amundsen Sea, west Antarctica. Geophysical Research Letters, 49(5): e2021GL094566
    Newell S E, Babbin A R, Jayakumar A, et al. 2011. Ammonia oxidation rates and nitrification in the Arabian Sea. Global Biogeochemical Cycles, 25(4): GB4016
    Newell S E, Fawcett S E, Ward B B. 2013. Depth distribution of ammonia oxidation rates and ammonia-oxidizer community composition in the Sargasso Sea. Limnology and Oceanography, 58(4): 1491–1500. doi: 10.4319/lo.2013.58.4.1491
    Olson R J. 1981. 15N tracer studies of the primary nitrite maximum. Journal of Marine Research, 39(2): 203–226
    Peng Xuefeng, Fawcett S E, Van Oostende N, et al. 2018. Nitrogen uptake and nitrification in the subarctic North Atlantic Ocean. Limnology and Oceanography, 63(4): 1462–1487. doi: 10.1002/lno.10784
    Peng Xuefeng, Fuchsman C A, Jayakumar A, et al. 2015. Ammonia and nitrite oxidation in the Eastern Tropical North Pacific. Global Biogeochemical Cycles, 29(12): 2034–2049. doi: 10.1002/2015GB005278
    Santoro A E, Sakamoto C M, Smith J M, et al. 2013. Measurements of nitrite production in and around the primary nitrite maximum in the central California Current. Biogeosciences, 10(11): 7395–7410. doi: 10.5194/bg-10-7395-2013
    Shepherd A, Ivins E, Rignot E, et al. 2018. Mass balance of the Antarctic Ice Sheet from 1992 to 2017. Nature, 558(7709): 219–222. doi: 10.1038/s41586-018-0179-y
    Sigman D M, Altabet M A, McCorkle D C, et al. 1999. The δ15N of nitrate in the Southern Ocean: consumption of nitrate in surface waters. Global Biogeochemical Cycles, 13(4): 1149–1166. doi: 10.1029/1999GB900038
    Smart S M, Fawcett S E, Thomalla S J, et al. 2015. Isotopic evidence for nitrification in the Antarctic winter mixed layer. Global Biogeochemical Cycles, 29(4): 427–445. doi: 10.1002/2014GB005013
    Smith J M, Chavez F P, Francis C A. 2014. Ammonium uptake by phytoplankton regulates nitrification in the sunlit ocean. PLoS ONE, 9(9): e108173. doi: 10.1371/journal.pone.0108173
    Vo J, Inwood W, Hayes J M, et al. 2013. Mechanism for nitrogen isotope fractionation during ammonium assimilation by Escherichia coli K12. Proceedings of the National Academy of Sciences of the United States of America, 110(21): 8696–8701. doi: 10.1073/pnas.1216683110
    Ward B B. 2008. Nitrification in marine systems. In: Capone D G, Bronk D A, Mulholland M R, et al., eds. Nitrogen in the Marine Environment. 2nd ed. San Diego: Academic Press, 199–261
    Ward B B, Talbot M C, Perry M J. 1984. Contributions of phytoplankton and nitrifying bacteria to ammonium and nitrite dynamics in coastal waters. Continental Shelf Research, 3(4): 383–398. doi: 10.1016/0278-4343(84)90018-9
    Waser N A D, Harrison P J, Nielsen B, et al. 1998. Nitrogen isotope fractionation during the uptake and assimilation of nitrate, nitrite, ammonium, and urea by a marine diatom. Limnology and Oceanography, 43(2): 215–224. doi: 10.4319/lo.1998.43.2.0215
  • Relative Articles

  • 加载中

Catalog

    通讯作者: 陈斌, bchen63@163.com
    • 1. 

      沈阳化工大学材料科学与工程学院 沈阳 110142

    1. 本站搜索
    2. 百度学术搜索
    3. 万方数据库搜索
    4. CNKI搜索

    Figures(6)

    Article Metrics

    Article views (715) PDF downloads(54) Cited by()
    Proportional views
    Related

    /

    DownLoad:  Full-Size Img  PowerPoint
    Return
    Return