Key Laboratory of Tropical Marine Bio-resources and Ecology, Chinese Academy of Sciences, Guangzhou 510301, China
2.
Guangdong Provincial Key Laboratory of Applied Marine Biology, South China Sea Institute of Oceanology, Chinese Academy of Sciences, Guangzhou 510301, China
3.
CAS-HKUST Sanya Joint Laboratory of Marine Science Research/Key Laboratory of Tropical Marine Biotechnology of Hainan Province, Sanya Institute of Ocean Eco-Environmental Engineering, South China Sea Institute of Oceanology, Sanya 572000, China
4.
Sanya National Marine Ecosystem Research Station, Tropical Marine Biological Research Station in Hainan, Chinese Academy of Sciences, Sanya 572000, China
Funds:
The National Natural Science Foundation of China under contract Nos 41806188 and 42176118; the Science and Technology Planning Project of Guangdong Province, China under contract No. 2020B1212060058; the Key Special Project for Introduced Talents Team of Southern Marine Science and Engineering Guangdong Laboratory (Guangzhou) under contract No. GML2019ZD0404.
Quantitative evaluation of the copepod feeding process is critical for understanding the functioning of marine food webs, as this provides a major link between primary producers and higher trophic levels. In this study, a molecular protocol based on quantitative polymerase chain reaction (qPCR) targeting 18S rDNA was developed and used to investigate the feeding and digestion rates of the copepod Acartia erythraea in a laboratory experiment using microalgae Thalassiosira weissflogii, Prorocentrum shikokuense, and Alexandrium catenella as prey. Although offered an equal encounter rate based on biovolume, prey uptake varied substantially among the three algal species, with the ingestion rate (IR) and digestion rate (DR) of A. erythraea differing significantly (P< 0.001) based on both cell counting and qPCR detection.Acartia erythraea showed the highest IR (2.79 × 10⁴ cells/(ind.·h)) and DR (2.43 × 10⁴ cells/(ind.·h)) on T. weissflogii, and the lowest amounts of ingested P. shikokuense were detected. The highest assimilation rate (~90.64%, IR/DR) was observed in copepods fed with P. shikokuense. The qPCR method used here can help determine the digestion rate and assimilation rate of copepods by detecting cells remaining in the gut hence providing the possibility to examine trophic links involving key species in the marine ecosystem. Our results indicate that A. erythraea has diet-specific feeding performance in different processes, and a quantitative assessment of copepod feeding is needed to accurately determine its functional role in the energy and matter uptake from marine food webs.
Copepods are the most abundant metazoans in the ocean and occupy a pivotal position in pelagic food webs (Verity and Smetacek, 1996). They can utilize a wide range of diets, including phytoplankton, microzooplankton, and detritus (Kleppel, 1993; Hu et al., 2015). Additionally, they exhibit different feeding behaviors from ingestion to digestion and defecation, through which particulate matter is transformed physically and biochemically, with the outcomes having significant ramifications for energy and material fluxes in the ocean (Vargas et al., 2007). Quantitative calculation of the transfer efficiency of each step that regulates copepod predation is crucial for understanding their production and the functioning of the pelagic food web (Durbin et al., 2012).
As the main primary producers and consumers, trophic interactions between phytoplankton and copepods have a significant effect on the size and efficiency of primary production transformation (Huskin et al., 2001; Slaughter et al., 2006). Copepods can consume approximately 10%–20% of the phytoplankton standing stock and is a potential controller of phytoplankton biomass, especially in the later stages of harmful algal blooms (Chen et al., 2013). Copepod feeding rates on phytoplankton vary considerably across different phytoplankton species according to their characteristics such as size, mobility, and biochemical composition (Calbet et al., 2007). For example, though provided with food at the same carbon concentration, Acartia erythraea had an ingestion rate of 0.11 μg/(ind.·h) (in terms of C) on Isochrysis galbana but 1.33 μg/(ind.·h) (in terms of C) on Prorocentrum minium, because P. minium was larger than I.galbana and the dinoflagellates had higher nitrogen and docosahexaenoic acid (DHA) contents (Liu et al., 2010). Moreover, some ambush-feeding copepods are preferred by microzooplankton (e.g., ciliates and flagellates) and would exert different feeding pressures on phytoplankton structure through trophic cascading (Garzke et al., 2015). These previous studies indicated that selective feeding of copepods could control phytoplankton structure and determine the primary production transfer efficiency along the marine planktonic food chain (Chen et al., 2013). Therefore, quantitative estimation of feeding rates for key zooplankton species is vital for understanding the functioning of the marine food web (Nejstgaard et al., 2008).
Gut content analysis is the most traditional and direct method for exploring copepod feeding rates by calculating the pigments or phytoplankton cell that remains in their guts; however, detection is limited to phytoplankton food (Mackas and Bohrer, 1976). Biomarker analyses, such as fatty acid and isotope signatures, can help trace sources of carbon or nitrogen and can provide information on diet categories or trophic levels, but cannot provide exact feeding rates for different food species (Chikaraishi et al., 2009; Gonçalves et al., 2012). The incubation method using bottles containing zooplankton and providing food for feeding experiments can directly determine the feeding rates and can be conducted in the laboratory, boats, or mesocosms (Frost, 1972; Hansen et al., 1993). Usually, the ingestion rate/grazing rate is calculated by the reduction of algal biomass in the form of cell number or carbon content in the incubation experiment (De Souza Santos and Castel, 2013) or by quantifying the dietary energy density and digestible protein with stable isotopes during the experiment (Hebert et al., 2009; Ekmann et al., 2013). As these quantification methods are either time-consuming or professional skills-dependent, an accurate, easy, and fast method to determine the feeding and digestion rates of zooplankton is of great interest. Detection of prey DNA in predator guts and/or scats is a growing method for understanding the trophic interactions of marine organisms and has been widely used in recent years because of the development of next-generation sequencing technology (Symondson, 2002; Vestheim et al., 2005; Durbin et al., 2012; Ho et al., 2017). Several studies have developed and applied real-time quantitative polymerase chain reaction (RT-qPCR) assays to measure zooplankton grazing on phytoplankton, including cyanobacteria (Nejstgaard et al., 2003, 2008; Durbin et al., 2012; Conroy et al., 2017).
Acartia is a neritic small marine copepod that usually dominates the zooplankton community in temperate and subtropical coastal ecosystems (Isari et al., 2013). Acartia species are more sensitive to environmental fluctuations because they lack most storage elements and are easily and rapidly affected by changing food availability (Shin et al., 2003). Therefore, quantification of Acartia feeding process is of great importance for understanding elemental cycling and energy flow in coastal pelagic food webs. In this study, the RT-qPCR method targeting 18S rDNA was used to analyze the feeding rate of A. erythraea on three different algal species: Alexandrium catenella, Prorocentrum shikokuense, and Thalassiosira weissflogii. Acartia erythraea is a small coastal copepod widely distributed in the South China Sea (Liu et al., 2010). Very few studies have been conducted on the feeding behavior of A. erythraea by experimental incubation and counting of algal cells (Liu et al., 2006, 2010; Chen et al., 2012; Hu et al., 2018). Here, we quantified the feeding rate and digestion rates of A. erythraea by calculating 18S rDNA copies per algal cell. The 18S rRNA gene has allowed, to great detail, the investigation of the composition of natural plankton communities (Santoferrara, 2019 and references therein) and has been used as the target gene to investigate the trophic relationship of marine zooplankton (Nejstgaard et al., 2008; Passmore et al., 2006; Hu et al., 2015).
2.
Materials and methods
2.1
Algal culture
Experimental algae were grown in f/2 media with or without Si (pH 8.0, salinity 31) at 25℃ on a 12 h:12 h light: dark cycle at ~100 µmol photons/(m2·s). Thalassiosira weissflogii [CCMP1048, (10–15) μm × (10–15) μm],P. shikokuense [(19–22) μm × (10–14) μm], and A. catenella [(20–25) μm × (18–32) μm] were used as prey in the feeding experiment. These algal strains were collected during the exponential growth phase by gentle filtration (<50 mm Hg) onto 3-μm polycarbonate membranes for primer specificity testing, estimation of 18S rDNA gene copies per cell, and the next feeding experiment.
2.2
Copepod collection
The copepods were collected using a zooplankton net (505 μm mesh) towed horizontally at 0.5 m under the surface of the coastal waters of Daya Bay (22°36.3′N, 114°34.0′E ) on July 28, 2015. Live copepods were kept in filtered seawater and directly transported to the laboratory. Adult female individuals of A. erythraea were sorted under a stereomicroscope, transferred to fresh filtered seawater every 3 h, and kept for >24 h for gut evacuation.
2.3
Feeding experiment
Before the experiment, 5 mL of each algal species were fixed in Utermöhl’s solution for cell density counting. Different volumes of the three algae, based on their cell density, were harvested by gentle filtration (<50 mm Hg) onto a 3-µm polycarbonate membrane and rinsed into 100 mL feeding beakers with filtered seawater. The starved copepods were placed in feeding beakers at a density of 0.2–0.4 ind./mL (30 individuals). In parallel, equal volumes and densities of the three algae were collected for 18S rDNA gene copy analyses. The beaker was then observed under an inverted microscope with gentle shaking every minute, and Utermöhl’s solution was added to each beaker when the guts ofA. erythraea were filled with algae but were yet to be excreted. The fixed copepods were sorted using a 200 μm sieve for DNA extraction and real-time PCR (RT-PCR) analyses, and seawater with three algae was also collected for cell counting and estimation of 18S rDNA gene copies.
2.4
DNA extraction
The fixed A. erythraea individuals (30ind for each sample) were serially rinsed thoroughly three times in autoclaved 0.45 µm-filtered seawater and examined under an inverted microscope to ensure no attachment of other visible organisms on the surface. The samples were then homogenized in a microfuge tube using a disposable micro-pestle. The homogenates were resuspended in 500 µL of DNA buffer (1% Sodium dodecyl sulfate (SDS), 100 mmol/L Ethylene Diamine Tetraacetic Acid (EDTA) and 200 µg/mL proteinase K) and incubated for two days at 55℃ for thorough cell lysis and DNA extraction (Zhang and Lin, 2005). DNA was extracted following the Cetyltriethylammnonium Bromide (CTAB) protocol and eluted in 30 μL Tris·Cl (10 mmol/L, pH 8.0). The fixed algae were centrifuged and subjected to DNA extraction as described above. DNA concentration was measured under a spectrophotometer NanoDrop2000 (Thermo, Waltham, MA, USA), and DNA quality was analyzed for integrity by agarose gel electrophoresis.
2.5
Primer development
PCR was performed on the extracted DNA of sorted A. erythraea or fixed algae using the reported universal 18S rDNA primer set Non-copepod 18SF2 (5′-AGCAGGCGCGHAAATTRCCCAATCY-3′) and Non-copepod 18SR2 (5′-CCGTGTTGAGTCAAATTAAGCCG-3′) under the PCR conditions described previously (Guo et al., 2012). The PCR products were cloned and sequenced. Based on the obtained sequences of T. weissflogii, P. shikokuense, and A. catenella, species-specific primers (Table 1) were designed for quantitative real-time PCR analysis and tested with cultured target and non-target species (Dunaliella sp.). The 18S rDNA fragments of target algae amplified using species-specific primers were cloned into pMD-18T vectors and transformed into competent Escherichia coli following the protocol of the TA cloning system (Takara, Osaka, Japan). Plasmids were extracted using a Qiagen Plasmid Purification Kit, according to the manufacturer’s protocol (Qiagen, Dusseldorf, Germany). Linear plasmids were obtained and purified after digestion with BamHI (Takara, Osaka, Japan), according to the manufacturer’s protocol. Reaction conditions for real-time PCR assays were optimized for the three primer sets using both linear plasmids and extracted DNA as the template.
Table
1.
Species-specific primers used in this study
2.6
Preparation of plasmid standards and real-time PCR analysis
The concentration of genomic DNA from the linear plasmids was measured fluorometrically with SYBR Green I (Molecular Probes) using λ phage DNA as a standard, according to the manufacturer’s instructions. For each feeding sample, three separate plasmid standards and real-time PCR assays were performed to quantify the number of 18S rDNA copies in cultured cells and to estimate the feeding and digestibility rates of copepods. The number of copies in the standards was calculated using the formula: molecules/volume = a/(plasmid length × 660) × 6.022 ×1023 (Zhu et al., 2005), where “a” is the plasmid DNA concentration (g/μL) and plasmid length including the vector (2 692 bp) and inserted PCR fragment (Table 1, amplicon size). To quantify the number of plasmid-rDNA fragment equivalents in the DNA extracts from sorted A. erythraea or fixed algae, the linear plasmids were serially diluted in five 10-fold dilutions (from 5×100 to 5×10⁻⁴). The extracted DNA of fixed algae and copepods was diluted 10 and 5 times, respectively, in the RT-PCR reaction. Plasmid standards were used to calculate the number of 18S rDNA copies in the DNA extracts.
RT-PCR was performed on the LightCycler 480 Real-timer® PCR system (Roche, Basel, Switzerland) using 2 × SYBR Green Real-time PCR Mix (TOYOBO, Osaka, Japan) at a final volume of 10 μL according to the manufacturer’s instructions. Thermo-cycle conditions were as follows: 94℃ for 5 min, followed by 45 cycles of 5 s at 94℃, 10 s at 54℃ (T. weissflogii and P. shikokuense) /50℃ (A. catenella), and 15 s at 72℃. Then, melt curve analyses were performed to confirm the specificity of the primers and that no primer dimer formation occurred. Data from the RT-PCR assays were analyzed using the LightCycler480 software 1.5.
2.7
Calculations and statistical analysis
To explore the number of 18S rDNA gene copies per cell, the plasmid standard with known gene copies per microliter was plotted against the Ct value. The 18S rDNA copies per microliter of algal DNA extract were obtained based on the Ct value and thereafter divided by the cell density representing 1 μL of DNA extract. Thus, the regression slope provided an estimate of 18S rDNA copies for each algal strain. The 18S rDNA gene copies per cell were subsequently analyzed against that of the sorted A. erythraea to establish the undigested algal cell numbers in the gut contents of copepod A. erythraea. The feeding and digestion rates of copepods with respect to a single algal species were calculated based on the algal cell numbers before and after feeding and the gut content of A. erythraea.
ingestion rate = total cells feeding/total cells before feeding ×100%. (1)
digestion rate = (total cells feeding − total cells in the gut)/ total cells before feeding ×100%. (2)
Here, the “total cells before feeding” refer to the algal cells of each prey species added into the feeding beaker before the experiment. The “total cells feeding” refer to the number of algal cells reduced after the experiment, which can be considered as the cells fed/ingested by copepod.
Statistical analyses were performed using Student’s t-test. One-way ANOVA was performed using SPSS 16.0. P< 0.05 andP< 0.001 were classified as statistically significant or highly significant, respectively.
3.
Results
3.1
Primer design and validation
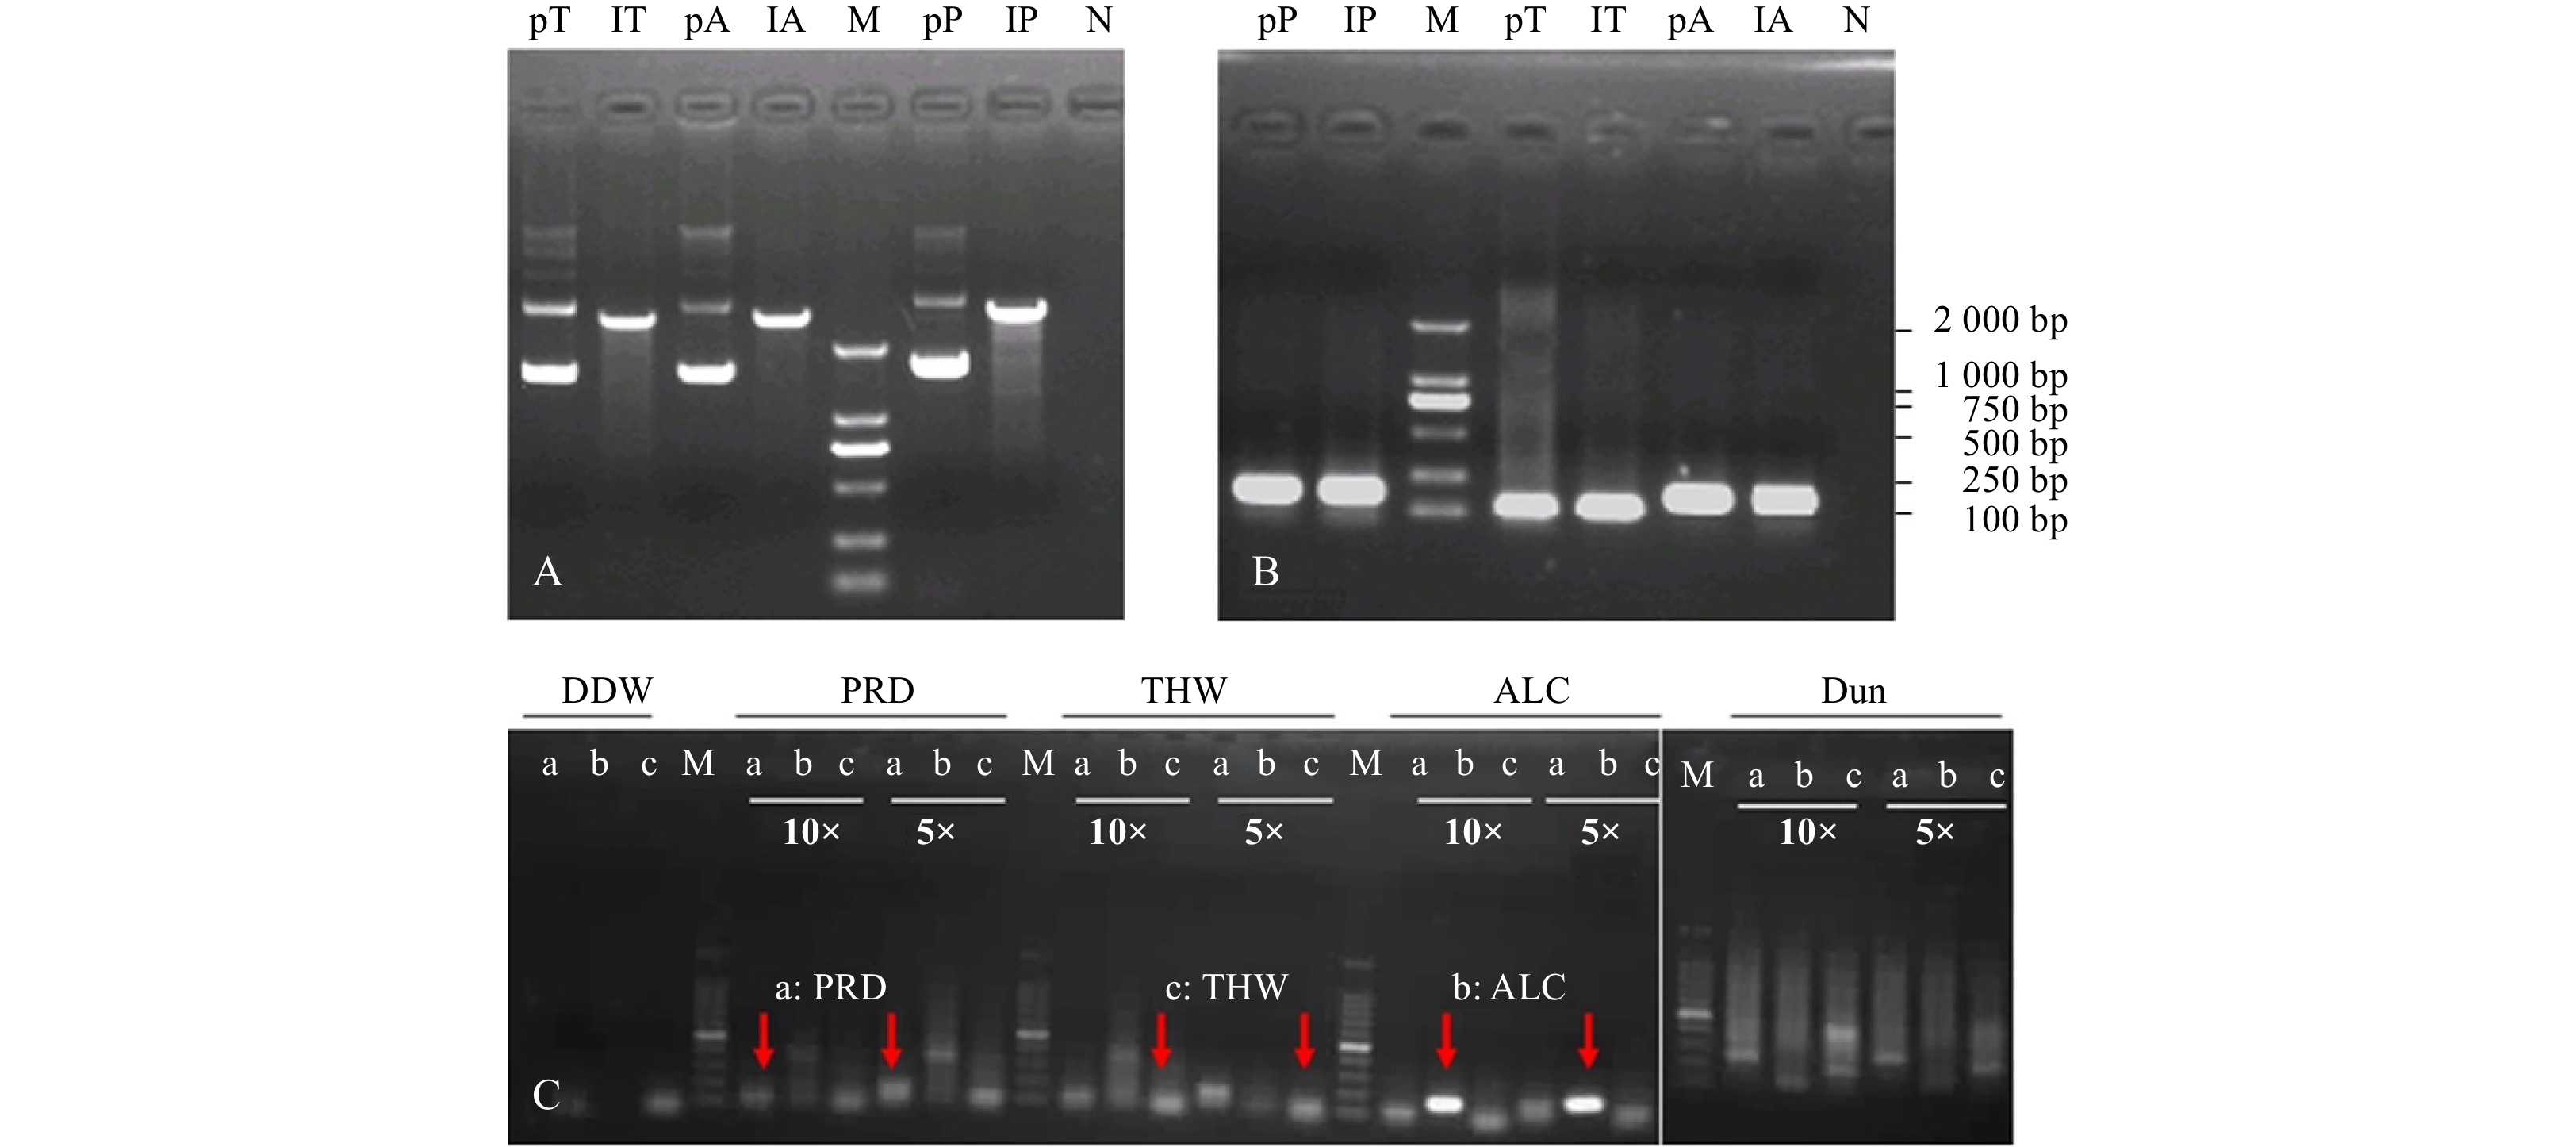
For all targeted algal strains, we used the same primer on the 5′ side and species-specific primers at the 3′ end. After testing by the conventional PCR method, three primer sets (Table 1) were highly specific to their target groups, without cross-reaction with any of the tested groups. The 18S rDNA fragments of the target algae were produced from the genomic DNA of the mono-cultured target algae and successfully cloned into the pMD-18T vector (Figs 1A, B). Each algal-specific primer set was further quantitatively evaluated in a real-time qPCR assay using plasmids containing the target fragments and DNA extracts from fixed copepods (Figs 1B, C). We chose 5 times dilution for DNA extraction from 30 fixed copepods in the RT-PCR reaction (Fig. 1C).
Figure
1.
Extraction and linearization of plasmids inserted target 18S rDNA fragment (A), validation of the specificy primers in RT-PCR assay with plasmids above (B) and extracted DNA from fixed copepod (C) as template. pT, lT, pA, lA, pP, lP in A and B represent the templates from plasmid, linear plasmid inserted with 18S rDNA fragment of Thalassiosira weissflogii, Alexandrium catenella, and Prorocentrum shikokuense, respectively. 10× and 5× indicate the dilution time of template. a, b, and c in C display the PCR product amplified with species-specific primers of PRD, ALC, and THW, respectively. M: DNA marker 2000. N: negative. DDW: double distilled water; PRD: P. shikokuense; THW: T. weissflogii; ALC: A. catenella; Dun: Dunaliella sp. (as the control group); pT, lT: plasmid and linearization of 18S rDNA of T. weissflogii; pA, lA: plasmid and linearization of 18S rDNA of A. catenella. pP, lP: plasmid and linearization of 18S rDNA of P. shikokuense.
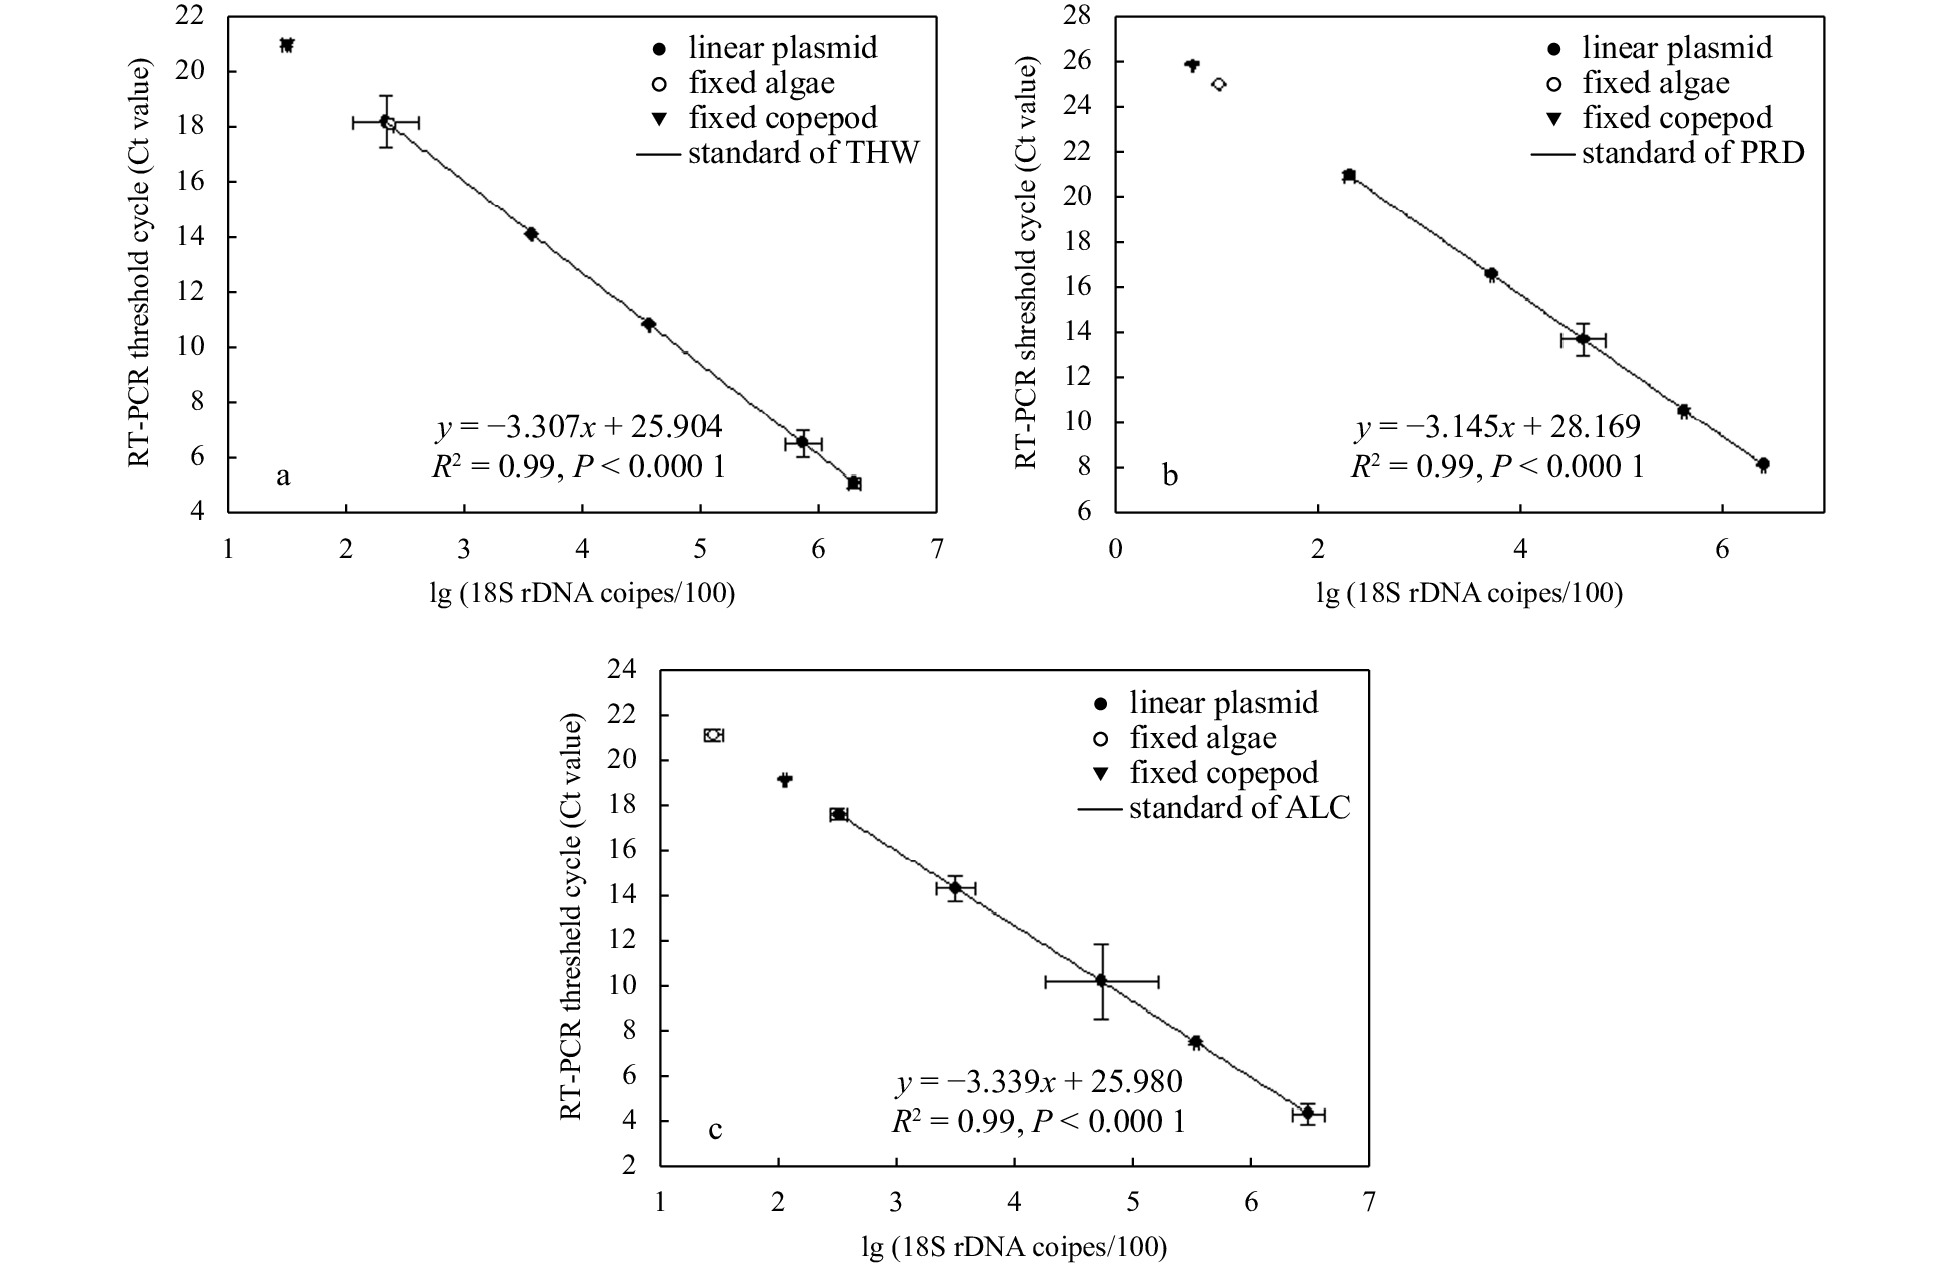
Highly significant linear relationships between gene copies and the qPCR threshold cycle (Ct) were achieved with each primer set (R2= 0.99, P< 0.001) using the linear plasmids as a template (Fig. 2).
Figure
2.
Quantification of microalgae 18S rDNA gene copies in fixed algae (algal cells left after feeding) and copepods based on the standards of three microalgae: Thalassiosira weissflogii (THW) (a), Prorocentrum shikokuense (PRD) (b), and Alexandrium catenella (ALC) (c). Linear plasmids inserted with target 18S rDNA fragment are used as templates to make quantitative standards for estimating cells remaining after the feeding experiment and in the copepod.
After counting the fixed algal cell density, we obtained the cell numbers of the fixed monotarget algae. Based on the DNA concentration of the plasmids and extracts from the fixed algae, we quantified the 18S rDNA gene copies per cell for the target algae. Copies per algae cell of the 18S rDNA were 5.40 × 10² for T. weissflogii, 1.08 × 10³ for P. shikokuense, and 1.33 × 10³ for A. catenella.
3.3
Quantification of the ingestion and digestion rate for copepod A. erythraea
The ingestion rate of A. erythraea was calculated based on the cell counting data. The highest ingestion rate, 4.31(±1.61) ×103 cells/(ind.·h), appeared in copepods fed with T. weissflogii, and the ingestion rates of copepods fed with two species of dinoflagellates were slightly lower than those in copepods fed with diatoms (Table 2). Overall, the ingestion rates among the three groups were similar and significantly different (P < 0.05) and were only found between copepods preying on T. weissflogii and A. catenella after ANOVA analyses.
Table
2.
Ingestion rate of Acartia erythraea based on cell counting
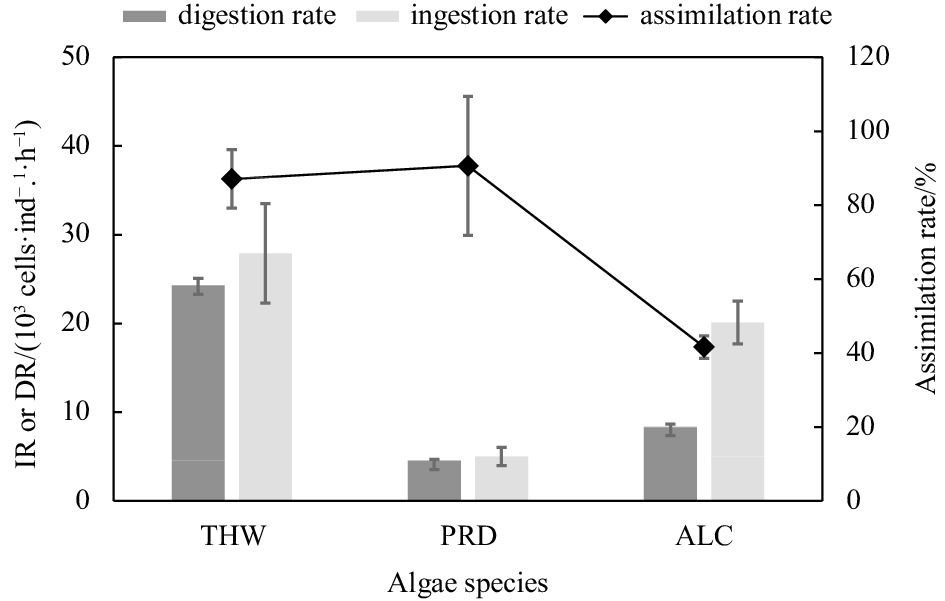
After the 18S rDNA copies per cell for each algal species were obtained, the ingestion and digestion rates were calculated based on the cells in the seawater before and after the feeding experiments, as well as the cells that remained in the gut of the copepods. The ingestion rate obtained based on the 18S rDNA copy numbers was 2–13 times higher than that based on cell counting (Table 2, Fig. 3). The highest ingestion rate and digestion rate were observed in copepods that fed on T. weissflogii and the lowest in copepods that fed on P. shikokuense, while the copepod feeding on P. shikokuense showed the highest rate of assimilation (~90%, DR/IR) (Fig. 3).
Figure
3.
Ingestion rate (IR), digestion rate (DR), and assimilation of Acartia erythraea on different algal species based on qPCR results. THW: Thalassiosira weissflogii; PRD: Prorocentrum shikokuense; ALC: Alexandrium catenella.
Quantifying feeding rates and selectivity of key zooplankton is vital for understanding the processes that structure marine ecosystems. In recent years, qPCR has been applied to assess the diet range and feeding selectivity of marine copepods, in both laboratory experiments and in situ detections (Nejstgaard et al., 2003, 2008; Troedsson et al., 2009; Durbin et al., 2012; Conroy et al., 2017; Ismar et al., 2018). In this study, a similar qPCR assay was developed to investigate the feeding and digestion rates of copepods (A. erythraea) on three different algal prey species. We obtained 18S rDNA gene copies of algal species based on the template of fixed cells from monospecific cultures by RT-PCR, and the digestion rate was determined based on the copies that remained in the gut content. Acartia erythraea preferred the larger dinoflagellate P. shikokuense and showed the highest rate of assimilation on P. shikokuense. Our results demonstrate that it is possible to quantitatively examine specific prey in the guts of copepods in the field by detecting the amount of prey DNA using appropriate primers (Conroy et al., 2017). This is of special significance for the understanding of primary producers –lower-level consumer links in the marine food web because these organisms are sensitive to environmental changes, and quantitative assessments of their trophic interactions will widen our knowledge of their functional roles in the transfer process, especially regarding abnormal ecological processes such as blooms (Ray et al., 2016).
Copepods feeding on laboratory-reared algae could be used to estimate important parameters in physiological processes (e.g., feeding selectivity, egg production), trophic transfer rates, and to parameterize models of food web structure (Fields et al., 2011). According to the ingestion and digestion rates, A. erythraea preferred to feed on the diatom T. weissflogii, although the encounter rate was similar based on the calculation of their biovolume (Sun and Liu, 2003). The size of T. weissflogii was approximately 10–15 μm and this was considered a suitable food size for A. erythraea. The gut retention time of A. erythraea for the diatom prey T. weissflogii was higher than that of the other dinoflagellate prey, which is consistent with previous studies on A. tonsa (Ismar et al., 2018). While A. erythraea fed with P. shikokuense showed the highest rate of assimilation, this was consistent with a previous study that found the dinoflagellate P. minimum was a good food choice for A. erythraea (Liu et al., 2010). The feeding behavior of copepods is related to their prey traits such as size, nutritional status, and motility (Frost, 1972; DeMott and Watson, 1991; Fields et al., 2011; Chen et al., 2012). In general, dinoflagellates have higher nitrogen and DHA content than diatoms (Kleppel, 1993), and some copepod species (e.g., A. erythraea and A. tonsa) have the ability to distinguish food quality (Liu et al., 2010). This might explain why A. erythraea showed the highest assimilation rate of dinoflagellates.
Both rDNA gene multiplicity and genome size vary widely among eukaryotes (Prokopowich et al., 2003). Genome size is directly correlated with cell size, as previously documented for most eukaryotic cell lines (LaJeunesse et al., 2005; Godhe et al., 2008). In phytoplankton, the number of SSU rDNA molecules per cell ranges for different species and/or strains of diatoms and dinoflagellates (Zhu et al., 2005; Godhe et al., 2008). In our study, we found that the gene copies of 18S rDNA differed among the three microalgae. The 18S rDNA gene copy number showed a positive relationship with cell size. Ribosomal gene copy number varies depending on the physiological conditions of the algae (Nejstgaard et al., 2008). To exclude these factors, we obtained 18S rDNA gene copies using RT-PCR, based on the template of fixed algae collected before the feeding experiment. DNA extracts from monospecific cultures were used as negative controls. Using total cells before feeding as the denominator, we obtained the digestion rate, which effectively shielded the influence of the background. Therefore, the ingestion rate obtained by genetic quantification was higher than that from the microscopy estimate, which is inconsistent with earlier studies that used cloned genes as reference standards rather than prey organisms (Nejstgaard et al., 2008).
This study is an indication that a correctly calibrated qPCR approach could be used to examine in situ feeding of copepods on specific prey items, such as phytoplankton or microzooplankton, as well as other trophic interactions among other small marine organisms, such as larval fish or krill (Cleary et al., 2016). Conroy et al. (2017) firstly reported the consumption of unicellular cyanobacteria by calanoid copepods by combining the qPCR approach and the next generation sequencing analysis using specific probes, indicating the common use of the molecular method in quantifying zooplankton feeding. The qPCR approach could also be used to quantify the feeding rates of zooplankton among different processes (such as different growth stages) (Ismar et al., 2018). Crucially, this method may only be useful for detecting predators and their known prey (Boersma et al., 2014). However, the rapid development of sequencing technology will contribute significantly to the pre-identification of natural plankton communities and distinguish key species involved in trophic relationships (Smith et al., 2017).
5.
Conclusions
A. erythraea tends to feed on larger particles and shows different feeding and digestion rates related to prey traits. By combining the feeding rate with the digestion rate, we could effectively quantify the feeding behavior of the copepods. It could potentially be applied to the quantitative analyses of copepod-feeding behavior for environmental samples in the future. Intensifying climate change and anthropogenic disturbances (e.g., global warming, acidification, and eutrophication) exert a significant influence on coastal ecosystems, and material transfer along the food chain might be affected (Garzke et al., 2015). The copepod is an important low-level consumer in marine environments and plays a vital role in the upward transfer of primary production (Kleppel, 1993). The method used in this study can be applied for the assessment of trophic links involving key species, such as Acartia and their response to environmental stressors.
Boersma M, Wesche A, Hirche H J. 2014. Predation of calanoid copepods on their own and other copepods’ offspring. Marine Biology, 161(4): 733–743. doi: 10.1007/s00227-013-2373-7
Calbet A, Carlotti F, Gaudy R. 2007. The feeding ecology of the copepod Centropages typicus (Kröyer). Progress in Oceanography, 72(2−3): 137–150. doi: 10.1016/j.pocean.2007.01.003
Chen Mianrun, Liu Hongbin, Chen Bingzhang. 2012. Effects of dietary essential fatty acids on reproduction rates of a subtropical calanoid copepod, Acartia erythraea. Marine Ecology Progress Series, 455: 95–110. doi: 10.3354/meps09685
Chen Mianrun, Liu Hongbin, Li Hoitung. 2013. Effect of mesozooplankton feeding selectivity on the dynamics of algae in the presence of intermediate grazers—a laboratory simulation. Marine Ecology Progress Series, 486: 47–58. doi: 10.3354/meps10393
Chikaraishi Y, Ogawa N O, Kashiyama Y, et al. 2009. Determination of aquatic food-web structure based on compound-specific nitrogen isotopic composition of amino acids. Limnology and Oceanography, 7(11): 740–750. doi: 10.4319/lom.2009.7.740
Cleary A C, Durbin E G, Rynearson T A, et al. 2016. Feeding by Pseudocalanus copepods in the Bering Sea: trophic linkages and a potential mechanism of niche partitioning. Deep-Sea Research Part II: Topical Studies in Oceanography, 134: 181–189. doi: 10.1016/j.dsr2.2015.04.001
Conroy B J, Steinberg D K, Song B, et al. 2017. Mesozooplankton graze on cyanobacteria in the Amazon River Plume and Western Tropical North Atlantic. Frontiers in Microbiology, 8: 1436. doi: 10.3389/fmicb.2017.01436
DeMott W R, Watson M D. 1991. Remote detection of algae by copepods: responses to algal size, odors and motility. Journal of Plankton Research, 13(6): 1203–1222. doi: 10.1093/plankt/13.6.1203
De Souza Santos L P, Castel J. 2013. Comparison of four methods to estimate meiobenthic copepod Amonardia normani ingestion rates. Marine Biology, 160(9): 2395–2404. doi: 10.1007/s00227-013-2234-4
Durbin E G, Casas M C, Rynearson T A. 2012. Copepod feeding and digestion rates using prey DNA and qPCR. Journal of Plankton Research, 34(1): 72–82. doi: 10.1093/plankt/fbr082
Ekmann K S, Dalsgaard J, Holm J, et al. 2013. Effects of dietary energy density and digestible protein: energy ratio on de novo lipid synthesis from dietary protein in gilthead sea bream (Sparus aurata) quantified with stable isotopes. British Journal of Nutrition, 110(10): 1771–1781. doi: 10.1017/S0007114513001281
Fields D M, Durif C M F, Bjelland R M, et al. 2011. Grazing rates of Calanus finmarchicus on Thalassiosira weissflogii cultured under different levels of ultraviolet radiation. PLoS ONE, 6(10): e26333. doi: 10.1371/journal.pone.0026333
Frost B W. 1972. Effects of size and concentration of food particles on the feeding behavior of the marine planktonic copepod Calanus pacificus. Limnology and Oceanography, 17(6): 805–815. doi: 10.4319/lo.1972.17.6.0805
Garzke J, Ismar S M H, Sommer U. 2015. Climate change affects low trophic level marine consumers: warming decreases copepod size and abundance. Oecologia, 177(3): 849–860. doi: 10.1007/s00442-014-3130-4
Godhe A, Asplund M E, Härnström K, et al. 2008. Quantification of diatom and dinoflagellate biomasses in coastal marine seawater samples by Real-Time PCR. Applied and Environmental Microbiology, 74(23): 7174–7182. doi: 10.1128/AEM.01298-08
Gonçalves A M M, Azeiteiro U M, Pardal M A, et al. 2012. Fatty acid profiling reveals seasonal and spatial shifts in zooplankton diet in a temperate estuary. Estuarine, Coastal and Shelf Science, 109: 70–80,
Guo Zhiling, Liu Sheng, Hu Simin, et al. 2012. Prevalent ciliate symbiosis on copepods: high genetic diversity and wide distribution detected using small subunit ribosomal RNA gene. PLoS ONE, 7(9): e44847. doi: 10.1371/journal.pone.0044847
Hansen F C, Reckermann M, Klein Breteler W C M, et al. 1993. Phaeocystis blooming enhanced by copepod predation on protozoa: evidence from incubation experiments. Marine Ecology Progress Series, 102: 51–57. doi: 10.3354/meps102051
Hebert C E, Weseloh D V C, Gauthier L T, et al. 2009. Biochemical tracers reveal intra-specific differences in the food webs utilized by individual seabirds. Oecologia, 160(1): 15–23. doi: 10.1007/s00442-009-1285-1
Ho T W, Hwang J S, Cheung M K, et al. 2017. DNA-based study of the diet of the marine calanoid copepod Calanus sinicus. Journal of Experimental Marine Biology and Ecology, 494: 1–9. doi: 10.1016/j.jembe.2017.04.004
Hu Simin, Guo Zhiling, Li Tao, et al. 2015. Molecular analysis of in situ diets of coral reef copepods: evidence of terrestrial plant detritus as a food source in Sanya Bay, China. Journal of Plankton Research, 37(2): 363–371. doi: 10.1093/plankt/fbv014
Hu Simin, Liu Sheng, Wang Lingli, et al. 2018. Feeding response of the tropical copepod Acartia erythraea to short-term thermal stress: more animal-derived food was consumed. PeerJ, 6: e6129. doi: 10.7717/peerj.6129
Huskin I, Anadón R, Medina G, et al. 2001. Mesozooplankton distribution and copepod grazing in the subtropical Atlantic near the Azores: influence of mesoscale structures. Journal of Plankton Research, 23(7): 671–691. doi: 10.1093/plankt/23.7.671
Isari S, Antó M, Saiz E. 2013. Copepod foraging on the basis of food nutritional quality: can copepods really choose?. PLoS ONE, 8(12): e84742,
Ismar S M H, Kottmann J S, Sommer U. 2018. First genetic quantification of sex- and stage-specific feeding in the ubiquitous copepod Acartia tonsa. Marine Biology, 165(2): 25. doi: 10.1007/s00227-017-3281-z
Kleppel G S. 1993. On the diets of calanoid copepods. Marine Ecology Progress Series, 99: 183–195. doi: 10.3354/meps099183
LaJeunesse T C, Lambert G, Andersen R A, et al. 2005. Symbiodinium (Pyrrhophyta) genome sizes (DNA content) are smallest among dinoflagellates. Journal of Phycology, 41(4): 880–886. doi: 10.1111/j.0022-3646.2005.04231.x
Liu Sheng, Li Tao, Huang Hui, et al. 2010. Feeding efficiency of a marine copepod Acartia erythraea on eight different algal diets. Acta Ecologica Sinica, 30(1): 22–26. doi: 10.1016/j.chnaes.2009.12.004
Liu Sheng, Wang Wenxiong, Huang Liangmin. 2006. Phosphorus dietary assimilation and efflux in the marine copepod Acartia erythraea. Marine Ecology Progress Series, 321: 193–202. doi: 10.3354/meps321193
Mackas D, Bohrer R. 1976. Fluorescence analysis of zooplankton gut contents and an investigation of diel feeding patterns. Journal of Experimental Marine Biology and Ecology, 25(1): 77–85. doi: 10.1016/0022-0981(76)90077-0
Nejstgaard J C, Frischer M E, Raule C L, et al. 2003. Molecular detection of algal prey in copepod guts and fecal pellets. Limnology and Oceanography: Methods, 1(1): 29–38. doi: 10.4319/lom.2003.1.29
Nejstgaard J C, Frischer M E, Simonelli P, et al. 2008. Quantitative PCR to estimate copepod feeding. Marine Biology, 153(4): 565–577. doi: 10.1007/s00227-007-0830-x
Passmore A J, Jarman S N, Swadling K M, et al. 2006. DNA as a dietary biomarker in Antarctic Krill, Euphausia superba. Marine Biotechnology, 8(6): 686–696. doi: 10.1007/s10126-005-6088-8
Prokopowich C D, Gregory T R, Crease T J. 2003. The correlation between rDNA copy number and genome size in eukaryotes. Genome, 46: 48–50. doi: 10.1139/G02-103
Ray J L, Skaar K S, Simonelli P, et al. 2016. Molecular gut content analysis demonstrates that Calanus grazing on Phaeocystis pouchetii and Skeletonema marinoi is sensitive to bloom phase but not prey density. Marine Ecology Progress Series, 542: 63–77. doi: 10.3354/meps11560
Santoferrara L F. 2019. Current practice in plankton metabarcoding: optimization and error management. Journal of Plankton Research, 41(5): 571–582. doi: 10.1093/plankt/fbz041
Shin K, Jang M C, Jang P K, et al. 2003. Influence of food quality on egg production and viability of the marine planktonic copepod Acartia omorii. Progress in Oceanography, 57(3–4): 265–277. doi: 10.1016/s0079-6611(03)00101-0
Slaughter A M, Bollens S M, Bollens G R. 2006. Grazing impact of mesozooplankton in an upwelling region off northern California, 2000–2003. Deep-Sea Research Part II: Topical Studies in Oceanography, 53(25–26): 3099–3115. doi: 10.1016/j.dsr2.2006.07.005
Smith K F, Biessy L, Argyle P A, et al. 2017. Molecular identification of Gambierdiscus and Fukuyoa (Dinophyceae) from environmental samples. Marine Drugs, 15(8): 243. doi: 10.3390/md15080243
Sun Jun, Liu Dongyan. 2003. Geometric models for calculating cell biovolume and surface area for phytoplankton. Journal of Plankton Research, 25(11): 1331–1346. doi: 10.1093/plankt/fbg096
Symondson W O C. 2002. Molecular identification of prey in predator diets. Molecular Ecology, 11(4): 627–641. doi: 10.1046/j.1365-294X.2002.01471.x
Troedsson C, Simonelli P, Nägele V, et al. 2009. Quantification of copepod gut content by differential length amplification quantitative PCR (dla-qPCR). Marine Biology, 156(3): 253–259. doi: 10.1007/s00227-008-1079-8
Vargas C A, Martínez R A, Cuevas L A, et al. 2007. The relative importance of microbial and classical food webs in a highly productive coastal upwelling area. Limnology and Oceanography, 52(4): 1495–1510. doi: 10.4319/lo.2007.52.4.1495
Verity P G, Smetacek V. 1996. Organism life cycles, predation, and the structure of marine pelagic ecosystems. Marine Ecology Progress Series, 130(1−3): 277–293. doi: 10.3354/meps130277
Vestheim H, Edvardsen B, Kaartvedt S. 2005. Assessing feeding of a carnivorous copepod using species-specific PCR. Marine Biology, 147(2): 381–385. doi: 10.1007/s00227-005-1590-0
Zhang Huan, Lin Senjie. 2005. Development of a cob-18S rRNA Gene Real-Time PCR Assay for Quantifying Pfiesteria shumwayae in the Natural Environment. Applied and Environmental Microbiology, 71(11): 7053–7063. doi: 10.1128/aem.71.11.7053-7063.2005
Zhu F, Massana R, Not F, et al. 2005. Mapping of picoeucaryotes in marine ecosystems with quantitative PCR of the 18S rRNA gene. FEMS Microbiology Ecology, 52(1): 79–92. doi: 10.1016/j.femsec.2004.10.006
Figure 1. Extraction and linearization of plasmids inserted target 18S rDNA fragment (A), validation of the specificy primers in RT-PCR assay with plasmids above (B) and extracted DNA from fixed copepod (C) as template. pT, lT, pA, lA, pP, lP in A and B represent the templates from plasmid, linear plasmid inserted with 18S rDNA fragment of Thalassiosira weissflogii, Alexandrium catenella, and Prorocentrum shikokuense, respectively. 10× and 5× indicate the dilution time of template. a, b, and c in C display the PCR product amplified with species-specific primers of PRD, ALC, and THW, respectively. M: DNA marker 2000. N: negative. DDW: double distilled water; PRD: P. shikokuense; THW: T. weissflogii; ALC: A. catenella; Dun: Dunaliella sp. (as the control group); pT, lT: plasmid and linearization of 18S rDNA of T. weissflogii; pA, lA: plasmid and linearization of 18S rDNA of A. catenella. pP, lP: plasmid and linearization of 18S rDNA of P. shikokuense.
Figure 2. Quantification of microalgae 18S rDNA gene copies in fixed algae (algal cells left after feeding) and copepods based on the standards of three microalgae: Thalassiosira weissflogii (THW) (a), Prorocentrum shikokuense (PRD) (b), and Alexandrium catenella (ALC) (c). Linear plasmids inserted with target 18S rDNA fragment are used as templates to make quantitative standards for estimating cells remaining after the feeding experiment and in the copepod.
Figure 3. Ingestion rate (IR), digestion rate (DR), and assimilation of Acartia erythraea on different algal species based on qPCR results. THW: Thalassiosira weissflogii; PRD: Prorocentrum shikokuense; ALC: Alexandrium catenella.


 DownLoad:

 DownLoad:


 DownLoad: