
Figure
1.
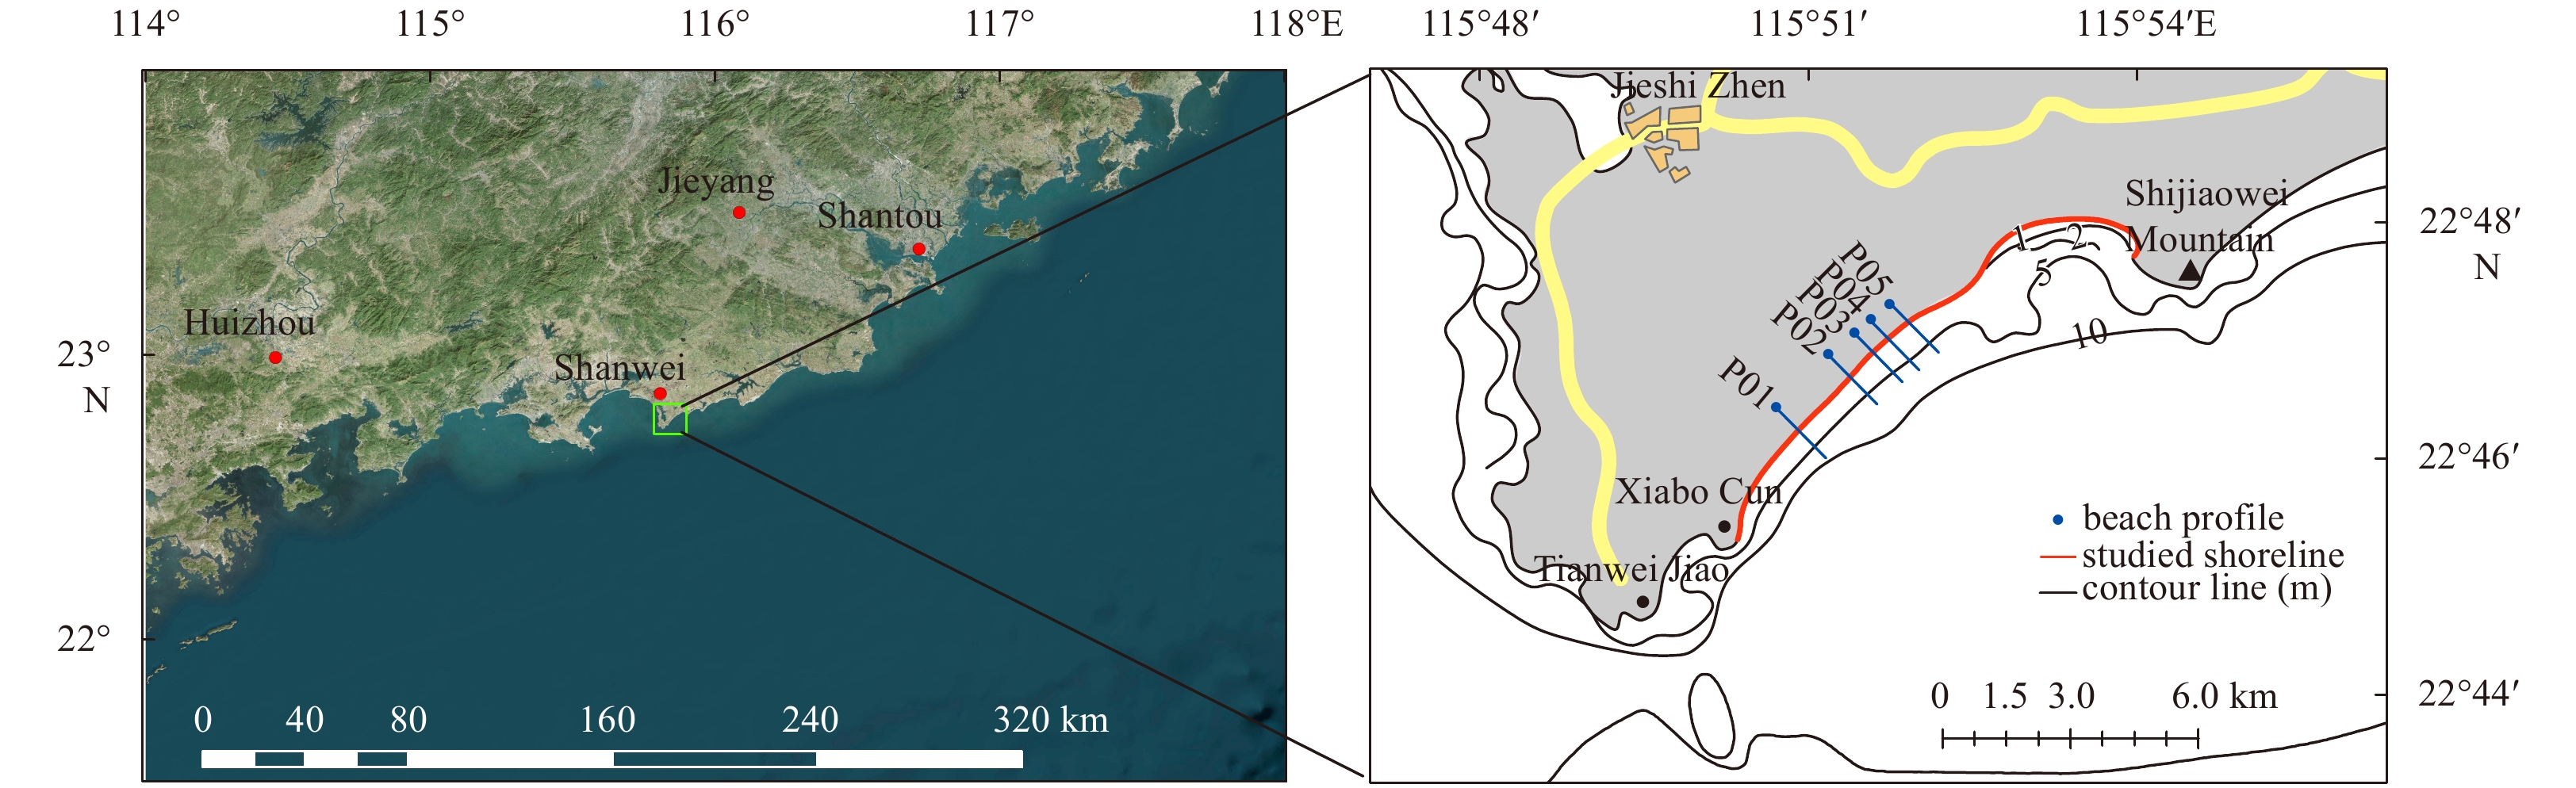
Location of the study area, beach profile deployment and its bathymetric contours. The yellow line is a highway.
| Citation: | Jitao Yu, Yuanting Ding, Lin Zhang, Pei Liu, Renfu Fan. Erosion hotspot identified along the sandy coast of Shanwei: characteristics and origin[J]. Acta Oceanologica Sinica, 2023, 42(7): 91-102. doi: 10.1007/s13131-022-2124-z

|
Shoreline movement is a complex phenomenon because the processes that lead to shoreline motion occur on a variety of time scales, ranging from seasonal profile changes and storm activity at short-term scales to long-term sea level rise, terrigenous sediment supply, and human intervention. Studies have shown that shoreline position datasets contain relevant information on oceanographic processes (Fenster and Dolan, 1994; Kish and Donoghue, 2013), climate change (Barnard et al., 2015; Carvalho et al., 2020), and the impact of human activities (Hakkou et al., 2018; Zhu et al., 2022).
The linear fitting technique based on the single-transect method (e.g., end point rate and least squares regression rate) is widely used to quantify the advance and retreat of specific coastal segments (Del Río et al., 2013; Xu and Gong, 2018; Zhang et al., 2021); for example, the Digital Shoreline Analysis System (DSAS) is commonly used to calculates shoreline changes in this manner (Thieler et al., 2009). However, relating the accretion or erosion of shorelines to specific driving processes is difficult because the shoreline change rate calculated by the linear method implies a linear summary of those processes that have affected shoreline behavior in the long term. In reality, shorelines can evolve in linear, non-linear, periodic or chaotic modes (Fenster et al., 1993). The non-linear behavior of shoreline change identified by the polynomial model has attracted more attention than other models because it is easily associated with driving processes (Fenster and Dolan, 1994; Frazer et al., 2009; Zhu et al., 2022). For example, quadratic polynomial models indicate that a significant change in the long-term trend has occurred, whereas cubic polynomial models show that two changes in the record of long-term shoreline movement have occurred. Along the 1055 km Atlantic coastline of the United States, Fenster and Dolan (1994) found that nearly two-thirds of the shoreline experienced at least one significant reversal from 1930 to 1960, strongly suggesting that large-scale processes controlled regional-scale shoreline dynamics. On this basis, they attributed these trend reversals to extratropical storm frequency and magnitude.
However, the characteristic of polynomial models is that increasing the order of the polynomial in time improves the accuracy but increases the complexity of the model, which involves the problem of data overfitting. To solve this problem, some researcher have proposed the application of modern information criteria to ensure that models follow the parsimony principle, such as the minimum description length criterion (Fenster et al., 1993), Akaike information criterion, and Schwarz information criterion (Frazer et al., 2009). Subsequently, Zhu et al. (2022) applied a simple method, the M-K trend test, to identify the non-linear behavior based on the shoreline change process constructed by a remote sensing image data source at Qiwang Bay from 1986 to 2019. They concluded that the identified reversal in the shoreline record was attributed to shore-normal engineering at the updrift headland. Their results also suggest that reconstructing the medium- to long-term shoreline evolution process (i.e., the time series of shoreline positions) is crucial for conducting shoreline process-response studies, especially at the embayment scale.
By contrast, most studies in China have focused on the basic characteristics of shoreline changes at the national, regional or provincial scale (Gao et al., 2013; Xu et al., 2013; Liu et al., 2015; Hou et al., 2016), such as shoreline length, morphological change and position change. Most studies have proposed that the shoreline in China is characterized by significant artificialization, mainly due to sea reclamation and coastal engineering (Hou et al., 2016). On the basis of the investigation results of the 908 Special Project on coastal erosion disasters in Guangdong Province, Sun et al. (2015) suggested that coastal erosion in Guangdong was caused by natural and human factors and human activities were the main reason for the enhanced erosion in modern times.
Therefore, this study investigated an erosion hotspot caused by human activity along the east coast of Guangdong, where coastal erosion hotspots are defined as coastal segments that have significantly higher rates of erosion than adjacent sections (Dean et al., 1999; Kraus and Galgano, 2001; List et al., 2006). First, we identified an erosion hotspot based on the measured shoreline data at Sanzhou Bay along the Shanwei coastline from 2015 to 2019. Next, the shoreline change processes from 1986 to 2019 were constructed using remote sensing image data, and the non-linear behavior of shoreline change was evaluated by introducing the M-K trend test. Finally, the timing of the onset of the erosion hotspot was determined, and evidence that the recent shoreline response associated with anthropogenic sand mining activities was provided. The results have important theoretical and practical significance for shoreline erosion risk management and engineering intervention and for the prediction of future shoreline evolution.
From 2015 to 2019, a field observation campaign covering 17 sandy beaches along the coastline of eastern Guangdong was conducted to capture changes in beach morphologies, intertidal gradients, sediment characteristics, and associated beach morphodynamic types by examining 123 beach profiles. Because of beach length, naturalness and accessibility, four to twelve shore-normal beach profiles were deployed on each beach, of which five profiles were deployed at Sanzhou Bay, located in the west and middle segments. However, the three beach profiles on the western beach showed an unusually significant retreat, manifested as a fixed benchmark on the backshore, continuously falling to the beach face or even underwater. This abnormal beach erosion problem was the motivation for this study and, according to a review of the literature, has not been studied.
Sanzhou Bay is located on the east coast of Shanwei City of eastern Guangdong Province (22°45′21.9″–22°47′40.4″N, 115°49′55.3″–115°53′43.7″E), characterized by an arc-shaped planform (Fig. 1). It is open to the southeast, and there is no river inflow in the study area. The waves in the study area are mainly caused by monsoons and tropical cyclones, with prevailing NE-direction waves in the winter half of the year and S-direction waves in the summer half of the year. Typhoons occasionally strike the study area from May to November, which has a significant impact on the evolution of beach morphology in a short period. The average annual wave height (H1/10) is approximately 1.3 m with an approximately 4 s average period, and the average tidal range is approximately 0.88 m (Wang and Yang, 1996). Thus, the study area was in a wave-dominated microtidal environment. The results of six field observations and surficial sediment measurements on the western beach of Sanzhou Bay from 2015 to 2019 showed that the average intertidal gradient was 5.8° and the average intertidal sediment size was Φ 1.41, indicating that the western beach was mainly composed of medium sand.
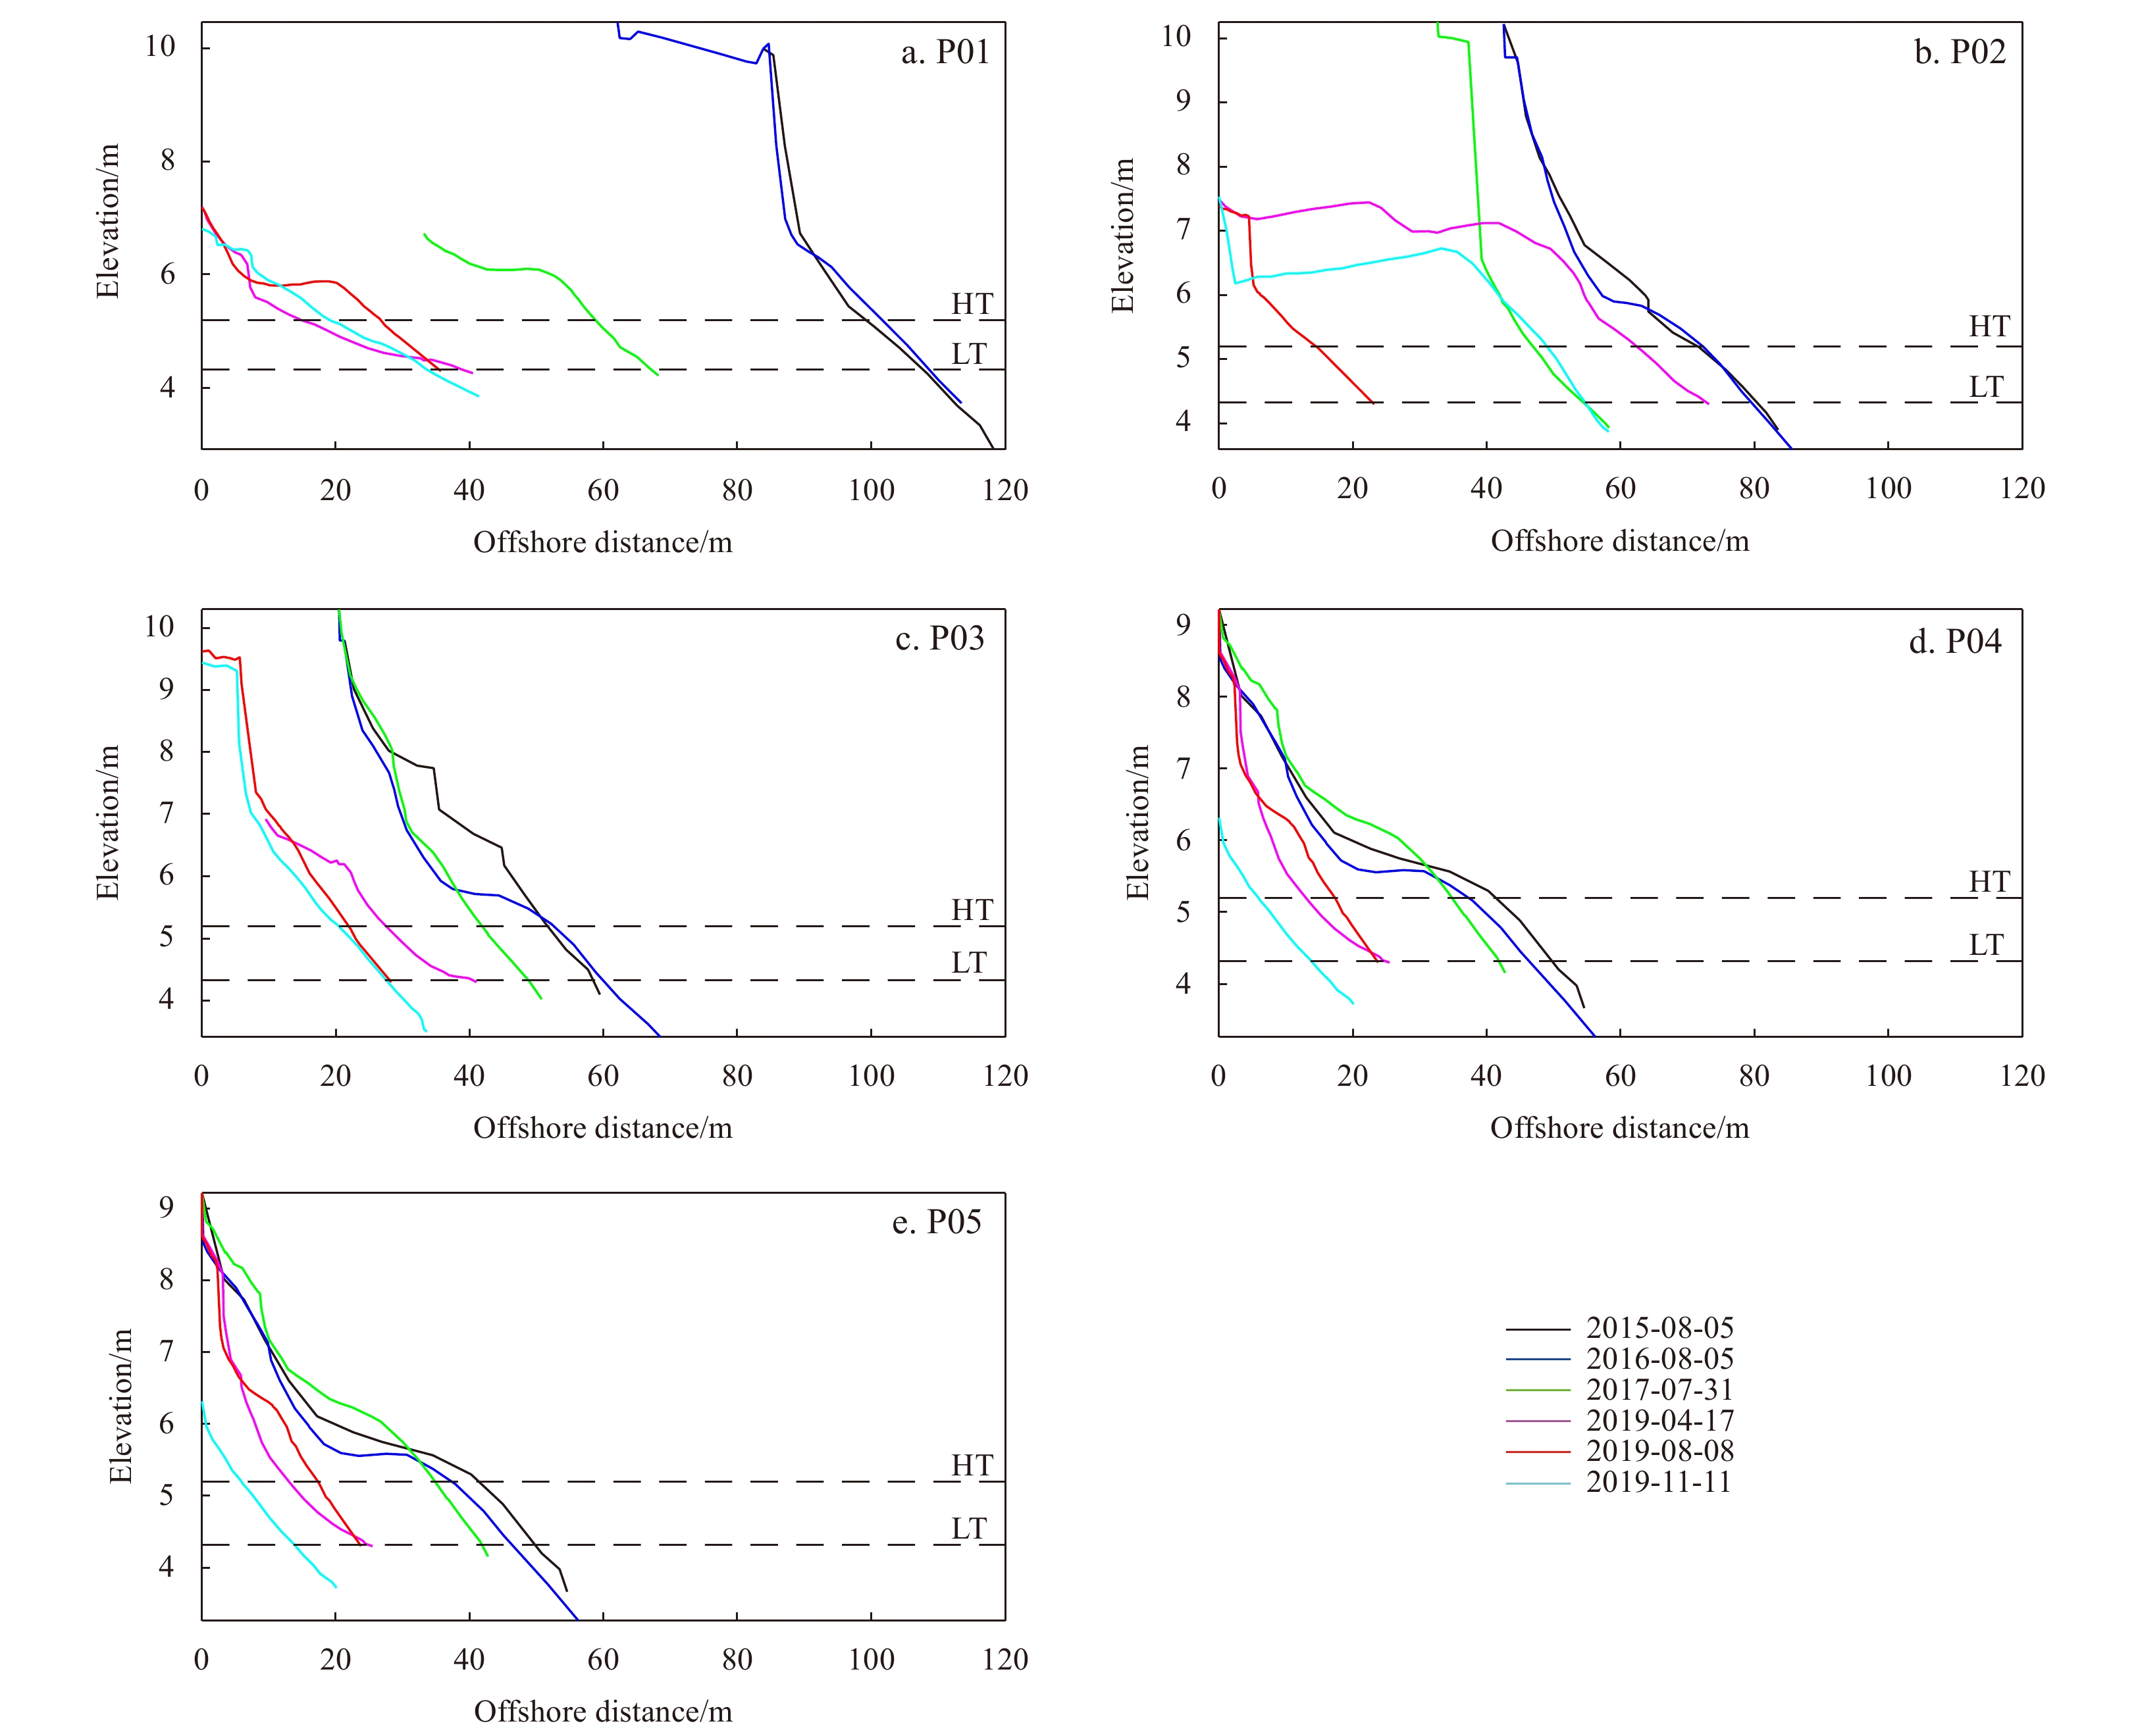
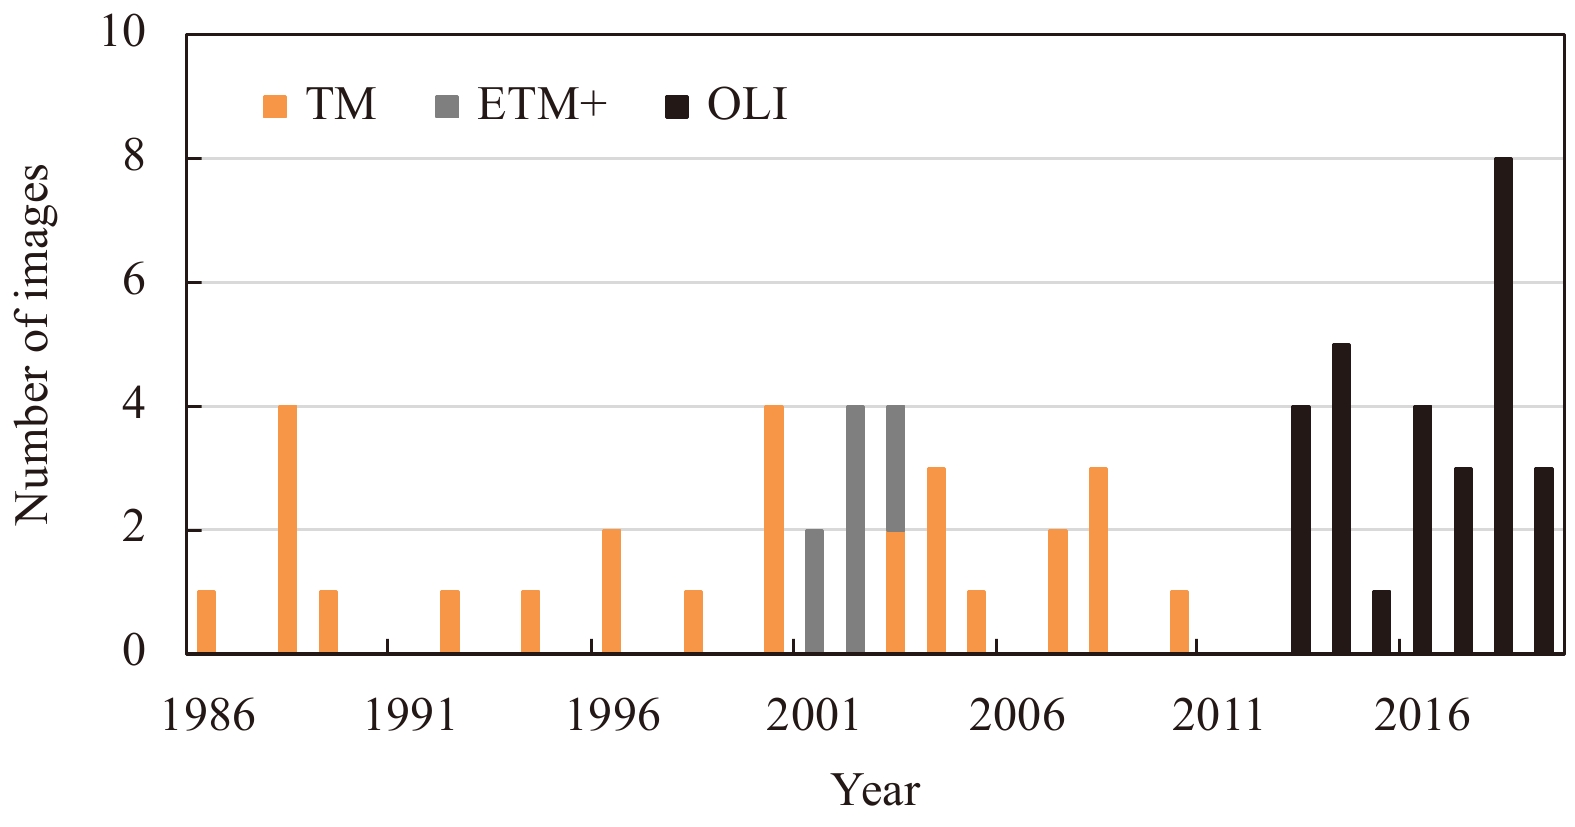
The dataset used in this study comprised six observations of five beach profiles from 2015 to 2019 (Figs 1 and 2) and 63 Landsat series remote sensing images from 1986 to 2019 (Fig. 3). Field observations were conducted on August 5, 2015; August 5, 2016; July 31, 2017; April 17, 2019; August 8, 2019; and November 11, 2019. A Total Station in 2015 and an RTK-GPS from 2016 to 2019 were used to investigate the morphological variation in beach profiles based on the China Geodetic Coordinate System 2000 (CGCS2000). The measured cross-shore range along each beach profile was between a fixed backshore benchmark and the deepest reachable location below the low-water line on the day of observation. However, the fixed backshore benchmarks of the profiles from P01 to P03 were moved landward and reset two or three times successively during the observation period due to substantial retreat of the backbeach soil cliff, and the elevation of the fixed backshore benchmark in the profile of P04 was reduced by 2.9 m due to the collapse of the backbeach soil cliff (Fig. 2). Landsat series satellite data were obtained from the Geospatial Data Cloud website (


Two accurate methods are primarily used for remote sensing shoreline extraction from sandy beaches. One method is to obtain the average spring tide high-tide line using the tide level correlation technique of the instantaneous water boundary line automatically extracted by computers (Maiti and Bhattacharya, 2009; Hu et al., 2016). The other method directly extracts the high water line by visual interpretation according to the difference in spectral reflectance between the dry beach and intertidal zone (Hapke et al., 2009; Del Río et al., 2013; Benkhattab et al., 2020). Zhu et al. (2022) studied the long-term shoreline evolution process and driving mechanism based on 113 scenes of Landsat image from 1986 to 2019 at Qiwang Bay in east Guangdong and showed that the tide levels at the time of acquisition for most images were lower than the average spring tide height. The accuracy evaluation for shoreline extraction and beach observation results demonstrated the reliability of the visual interpretation method. Therefore, this study adopted this method. In ENVI 5.3, remote sensing images were preprocessed by clipping, radiometric calibration, and atmospheric correction. Next, on the ArcGIS platform, the 5th, 4th and 3rd bands were defined as R (red), G (green) and B (blue), respectively, for the TM and ETM+ images. The high tide shoreline was extracted by false color synthesis, and the combination of the 4th, 5th, and 6th bands was used to extract the shoreline from the OLI images.
We selected available remote sensing shoreline data four times close to the measured shoreline data on August 5, 2016, July 31, 2017, August 8, 2019, and November 10, 2019, to evaluate the accuracy of the shoreline extraction. These four times were December 9, 2016, October 25, 2017, October 15, 2019, and November 16, 2019. According to the accuracy evaluation method proposed by Hou et al. (2014), the calculated root mean squares were 23.25 m, 27.12 m, 24.20 m, and 13.02 m, and the error levels were all within one pixel, that is, less than 30 m. The measured data in November 2019 were closest to the remote sensing image data (6 days apart), and the error level was within 0.5 pixel. Hou et al. (2014) proposed that the maximum allowable error for the extraction of line features from remote sensing images with a spatial resolution of 30 m was 28.28 m. Thus, the accuracy evaluation here demonstrates the reliability of the extraction of high-tide shorelines using the visual interpretation method.
The method based on a single transect is widely used to quantify the advance and retreat of shorelines and calculate their change rate of shorelines (Del Río et al., 2013; Zhang et al., 2021). Using ArcGIS, the DSAS creates transects separated by a distance specified by the user. At each transect, different statistical methods (e.g., end point rate and lease square regression rate) are used to calculate the change rate of the shoreline and its uncertainty. A total of 188 transects were generated from west to east at a distance of 50 m along the studied coastline. Because each transect contained the position data of 63 shorelines, the least square regression method was first adopted to roughly understand the spatial variation in the shorelines from 1986 to 2019 at Sanzhou Bay. Next, to further evaluate the linear or non-linear behavior of the shoreline changes, first- (i.e., linear), second-, and third-order polynomial fitting methods were used. Furthermore, to ensure that the data were not over-fitted, the M-K trend test was performed. By evaluating the significant erosion or accretion trend in shoreline changes at a single transect, the order of the higher-order polynomial model was determined to understand the non-linear process of shoreline evolution.
The M–K trend test is a rank-based non-parametric test (Mann, 1945; Kendall, 1975). It does not require time series data to be normal or linear and is less affected by outliers. Thus, this method has been widely applied in hydrology and meteorology. For the time series
| $$ {s}_{k}=\sum _{i=1}^{k}{r}_{i}\quad \left(2\leqslant k\leqslant n\right) , $$ | (1) |
where
| $$ {r}_{i}=\left\{\begin{split}&+ 1\quad\quad {\rm{if}}\;{x}_{i} > {x}_{j}\\ &0\quad\quad\quad {\rm{other\;else}}\end{split}\right. \quad(j =1, 2, \cdots ,i) . $$ | (2) |
The statistic index
| $$ {UF}_{k}=\frac{[{s}_{k}-E({s}_{k}\left)\right]}{\sqrt{{\rm{Var}}\left({s}_{k}\right)}}\quad (k =1, 2,\ldots , n) , $$ | (3) |
where
In reverse order of the time series
A positive UF or UB value indicates a positive trend, and a negative UF or UB value indicates a negative trend. For the two-sided test, the null hypothesis of no trend was rejected at a significance level of p. This study used p=0.01 to evaluate the significance of the tested shoreline trend.
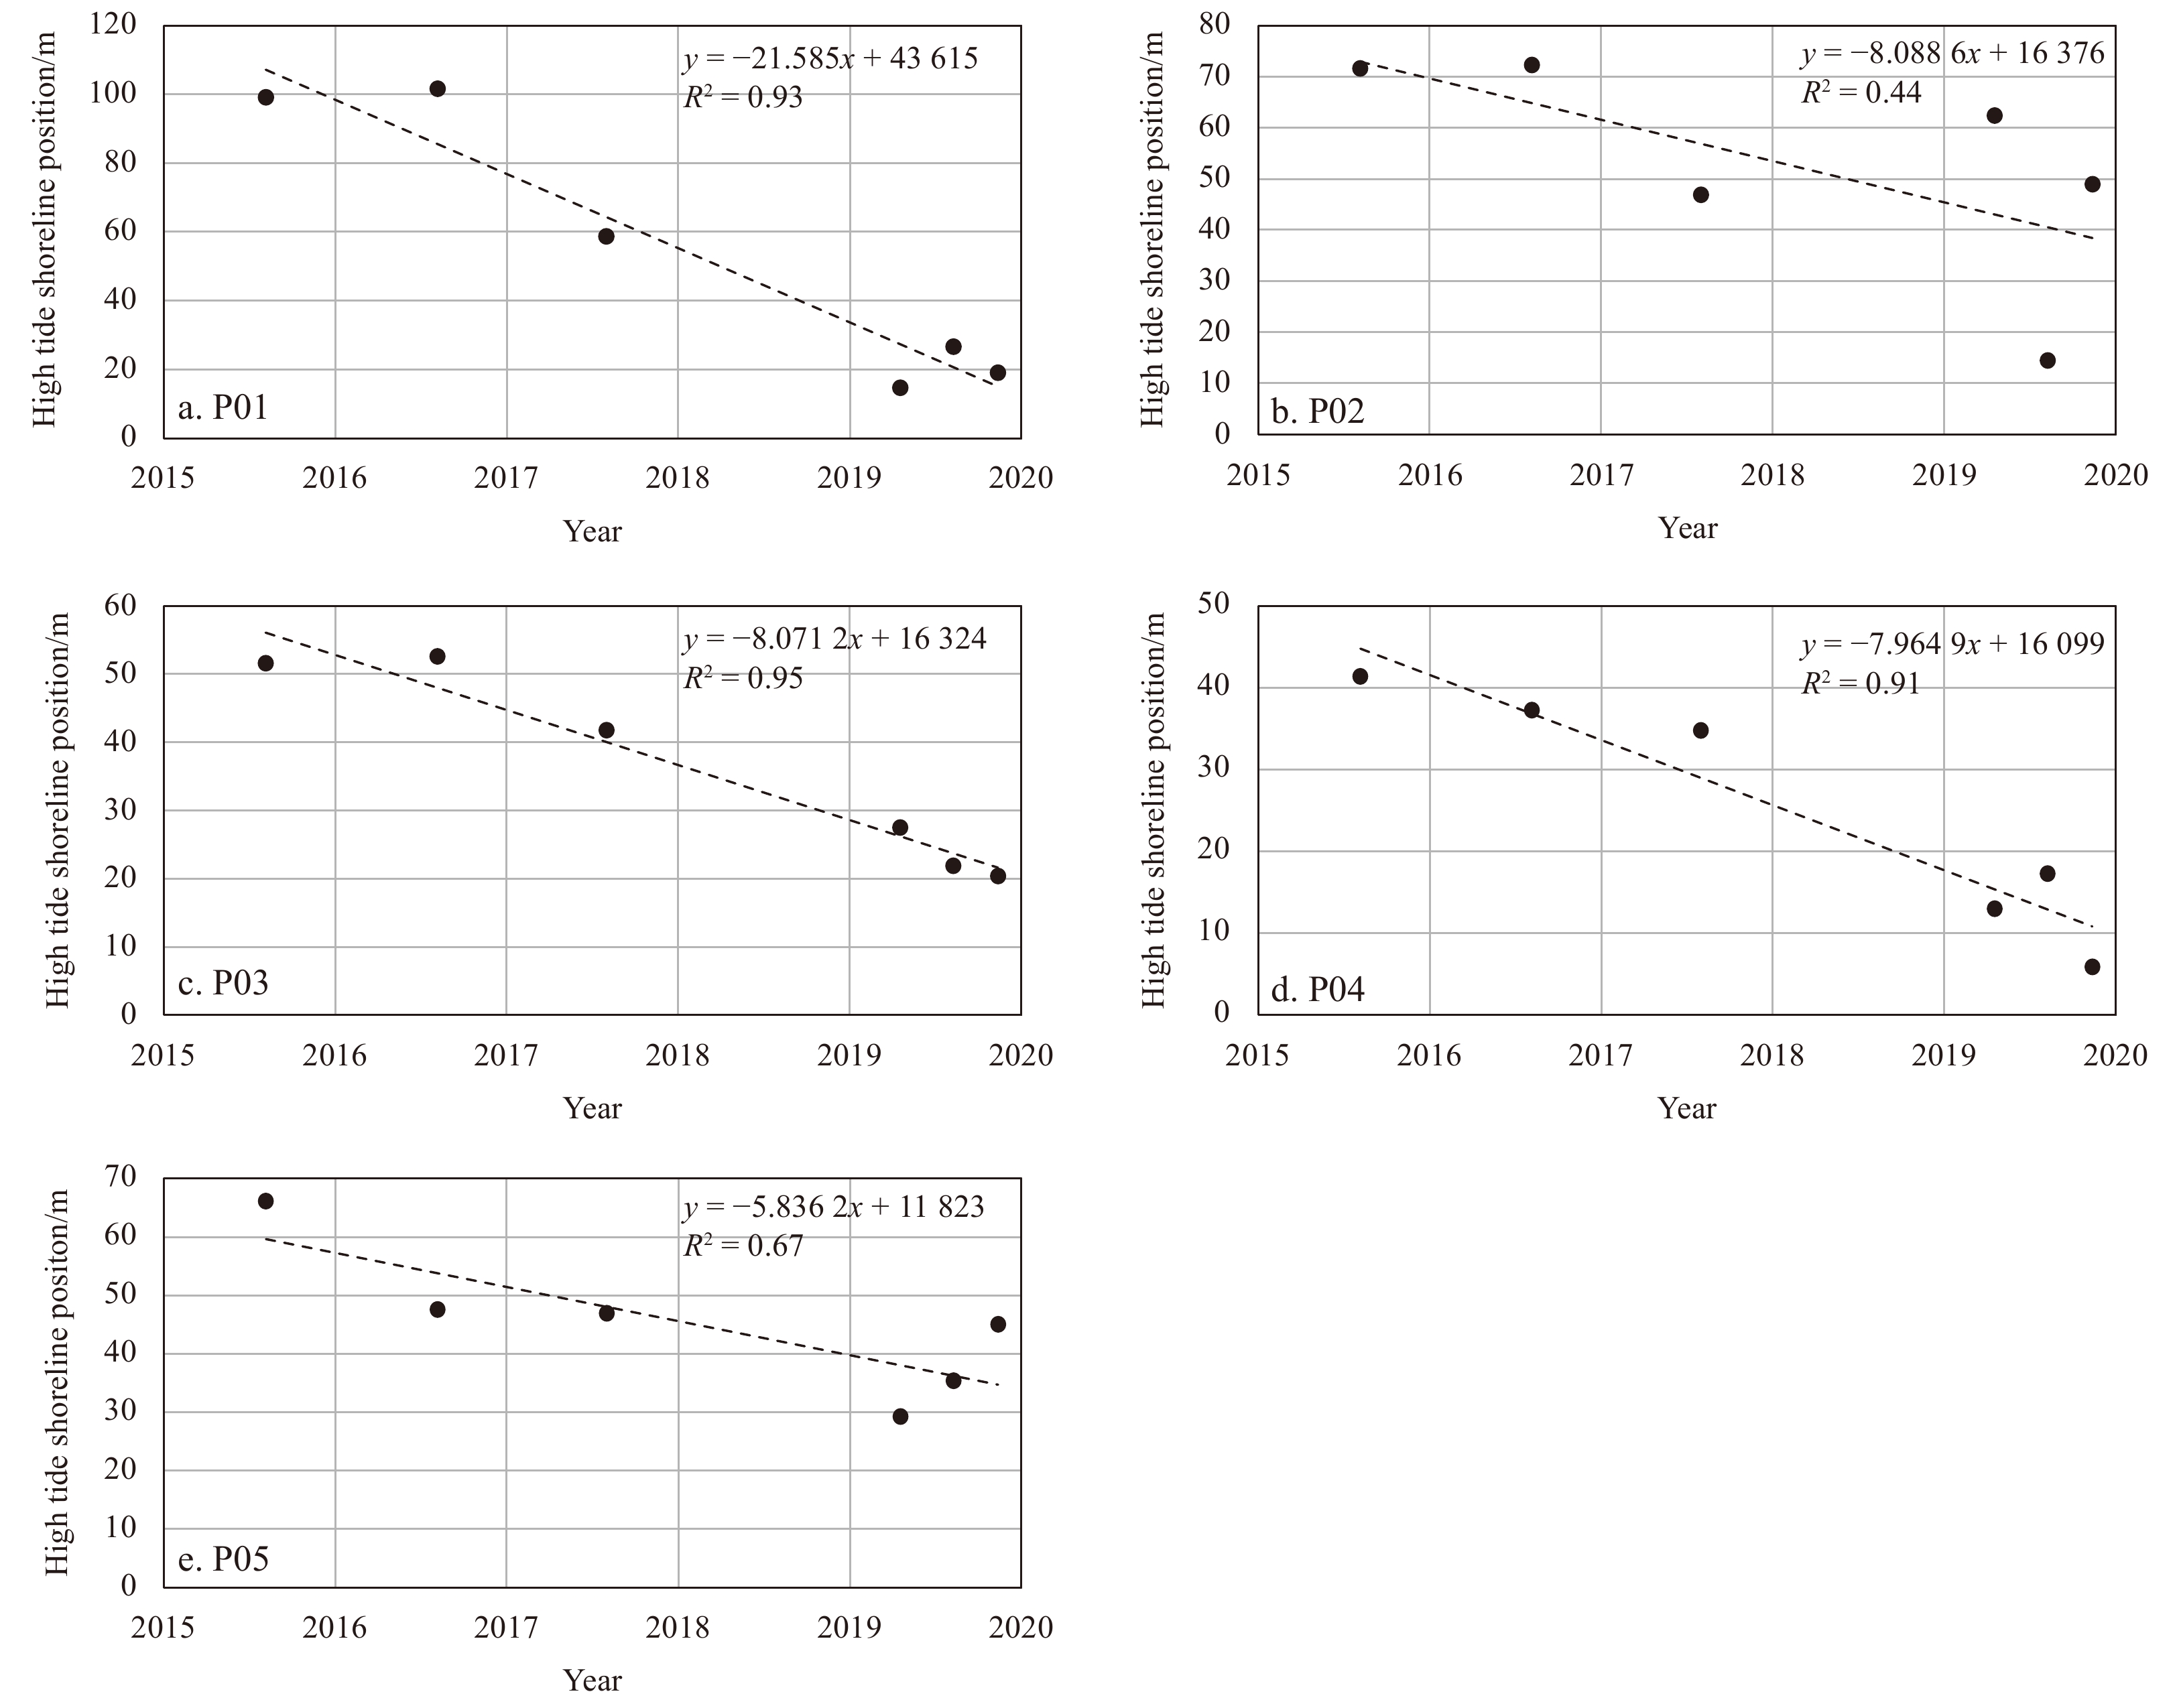
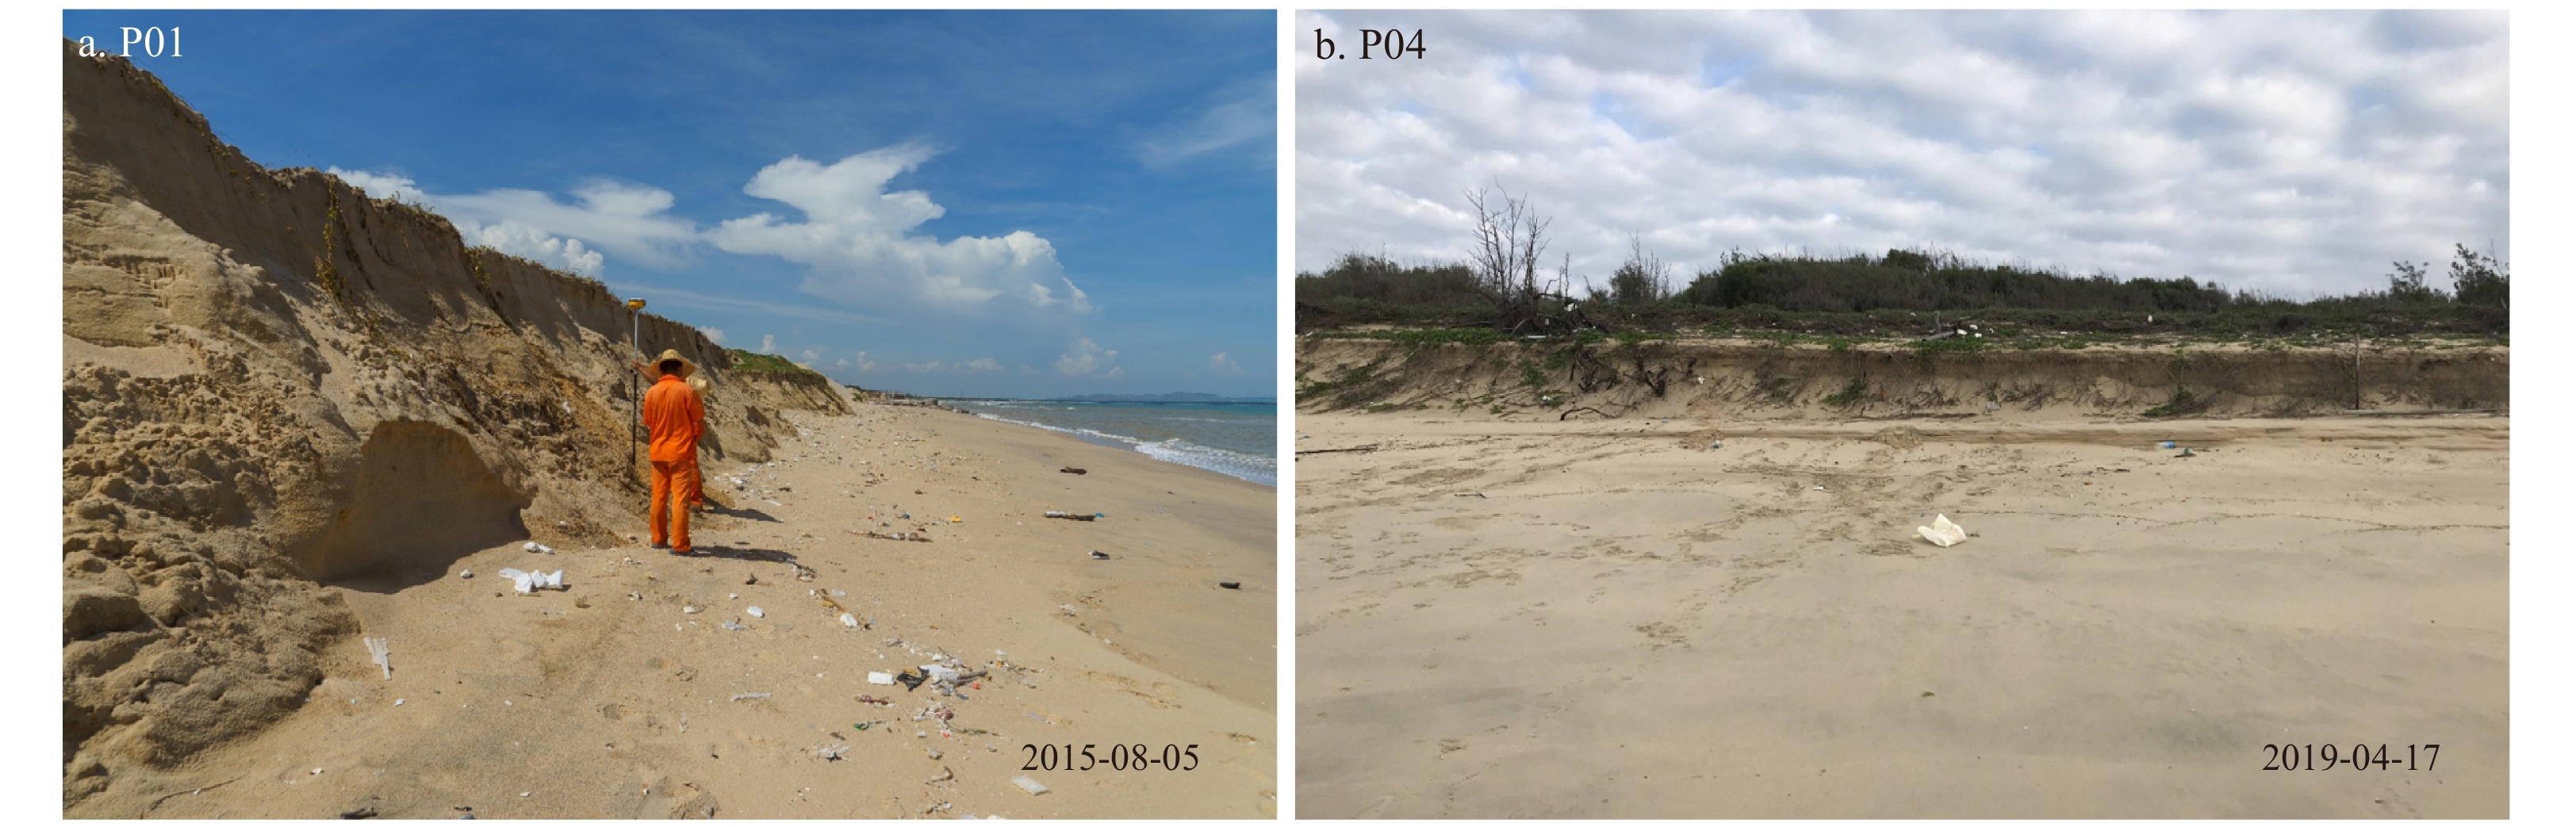
The advance or retreat rates of high-tide shorelines collected from six field observations along five beach profiles at the Sanzhou Bay from 2015 to 2019 were calculated using the linear regression method (Fig. 4). All five profiles experienced rapid retreat in those four years: the maximum erosion rate was 21.6 m/a, and the receding distance exceeded 80 m in P01. From west to east, the erosion rate of the five beach profiles gradually decreased. For example, the erosion rate was 8.1 m/a in P02 or P03, 8.0 m/a in P04, and 5.8 m/a in P05. The results also indicated that this serious erosion phenomenon not only destroyed the former beach but also substantially affected the stability of the backshore, manifested by the continuous retreat of the vertical backshore soil cliffs composed of loose sediment (Figs 2 and 5).


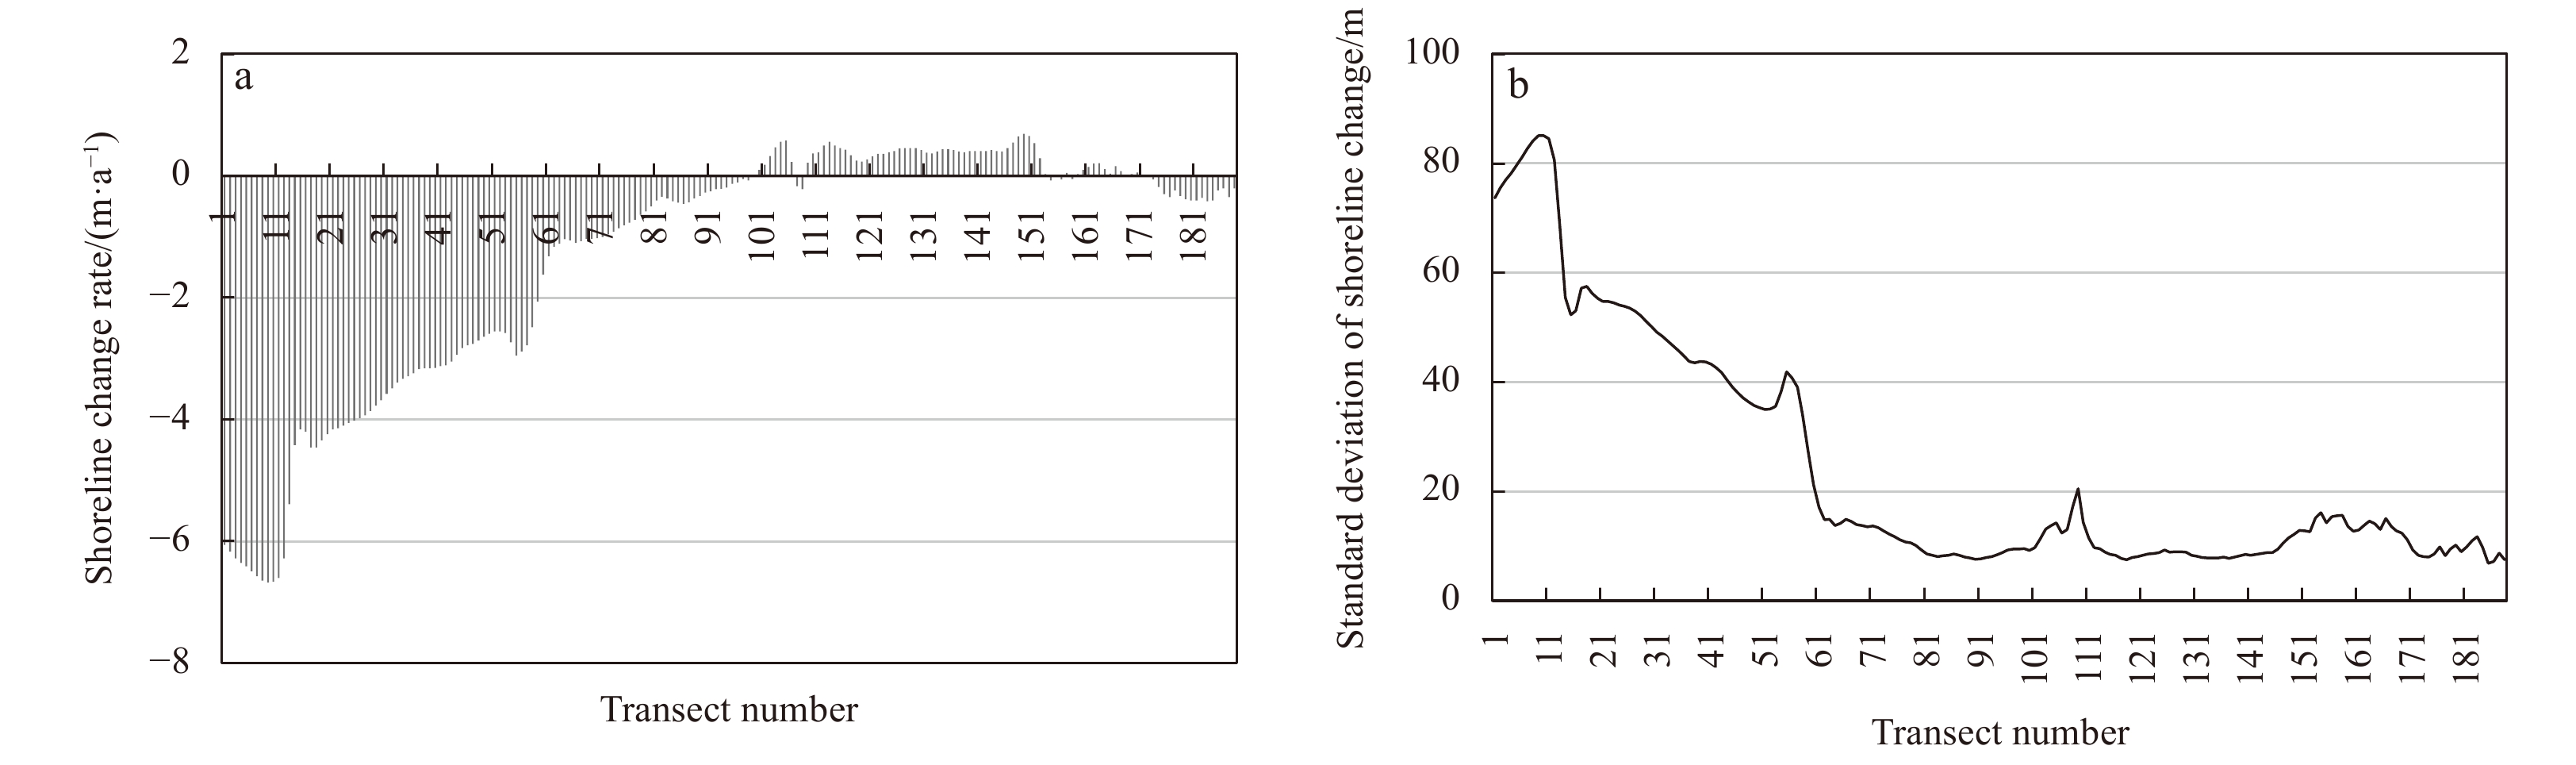
A total of 188 cross-shore transects were generated at 50 m intervals alongshore and intersected with the shorelines of all periods extracted from remote sensing images. Figure 6a shows the shoreline erosion and accretion rates from 1986 to 2019 calculated using the linear regression method. Erosion occurred in the western coastal segment covering transects from T01 to T98. The peak erosion rate was 6.7 m/a on transect T09, and the erosion rates gradually decreased from west to east in this area. However, the segment where transects T99–T172 were located had a low accretion rate as a whole with a peak accretion rate of 0.7 m/a on transect T149, except transects T107, T108, T154, T156, and T158 had an extremely low erosion rate (<0.2 m/a). Another segment covering transects T173–T188 had a relatively low erosion rate, and a peak erosion rate of 0.4 m/a was on transect T183. Additionally, Fig. 6b presents the standard deviations of shoreline position changes for 188 transects from 1986 to 2019, indicating that the shoreline variations on the western beach were intense, and the changes on the eastern beach were relatively small over the past 30 years. Del Río et al. (2013) suggested that a shoreline change rate of less than 0.75 m/a is a stable shoreline. Thus, the western beach of Sanzhou Bay has undergone significant erosion, whereas the eastern beach has been relatively stable over the past 30 years. Clearly, the western beach is a typical erosion hotspot.

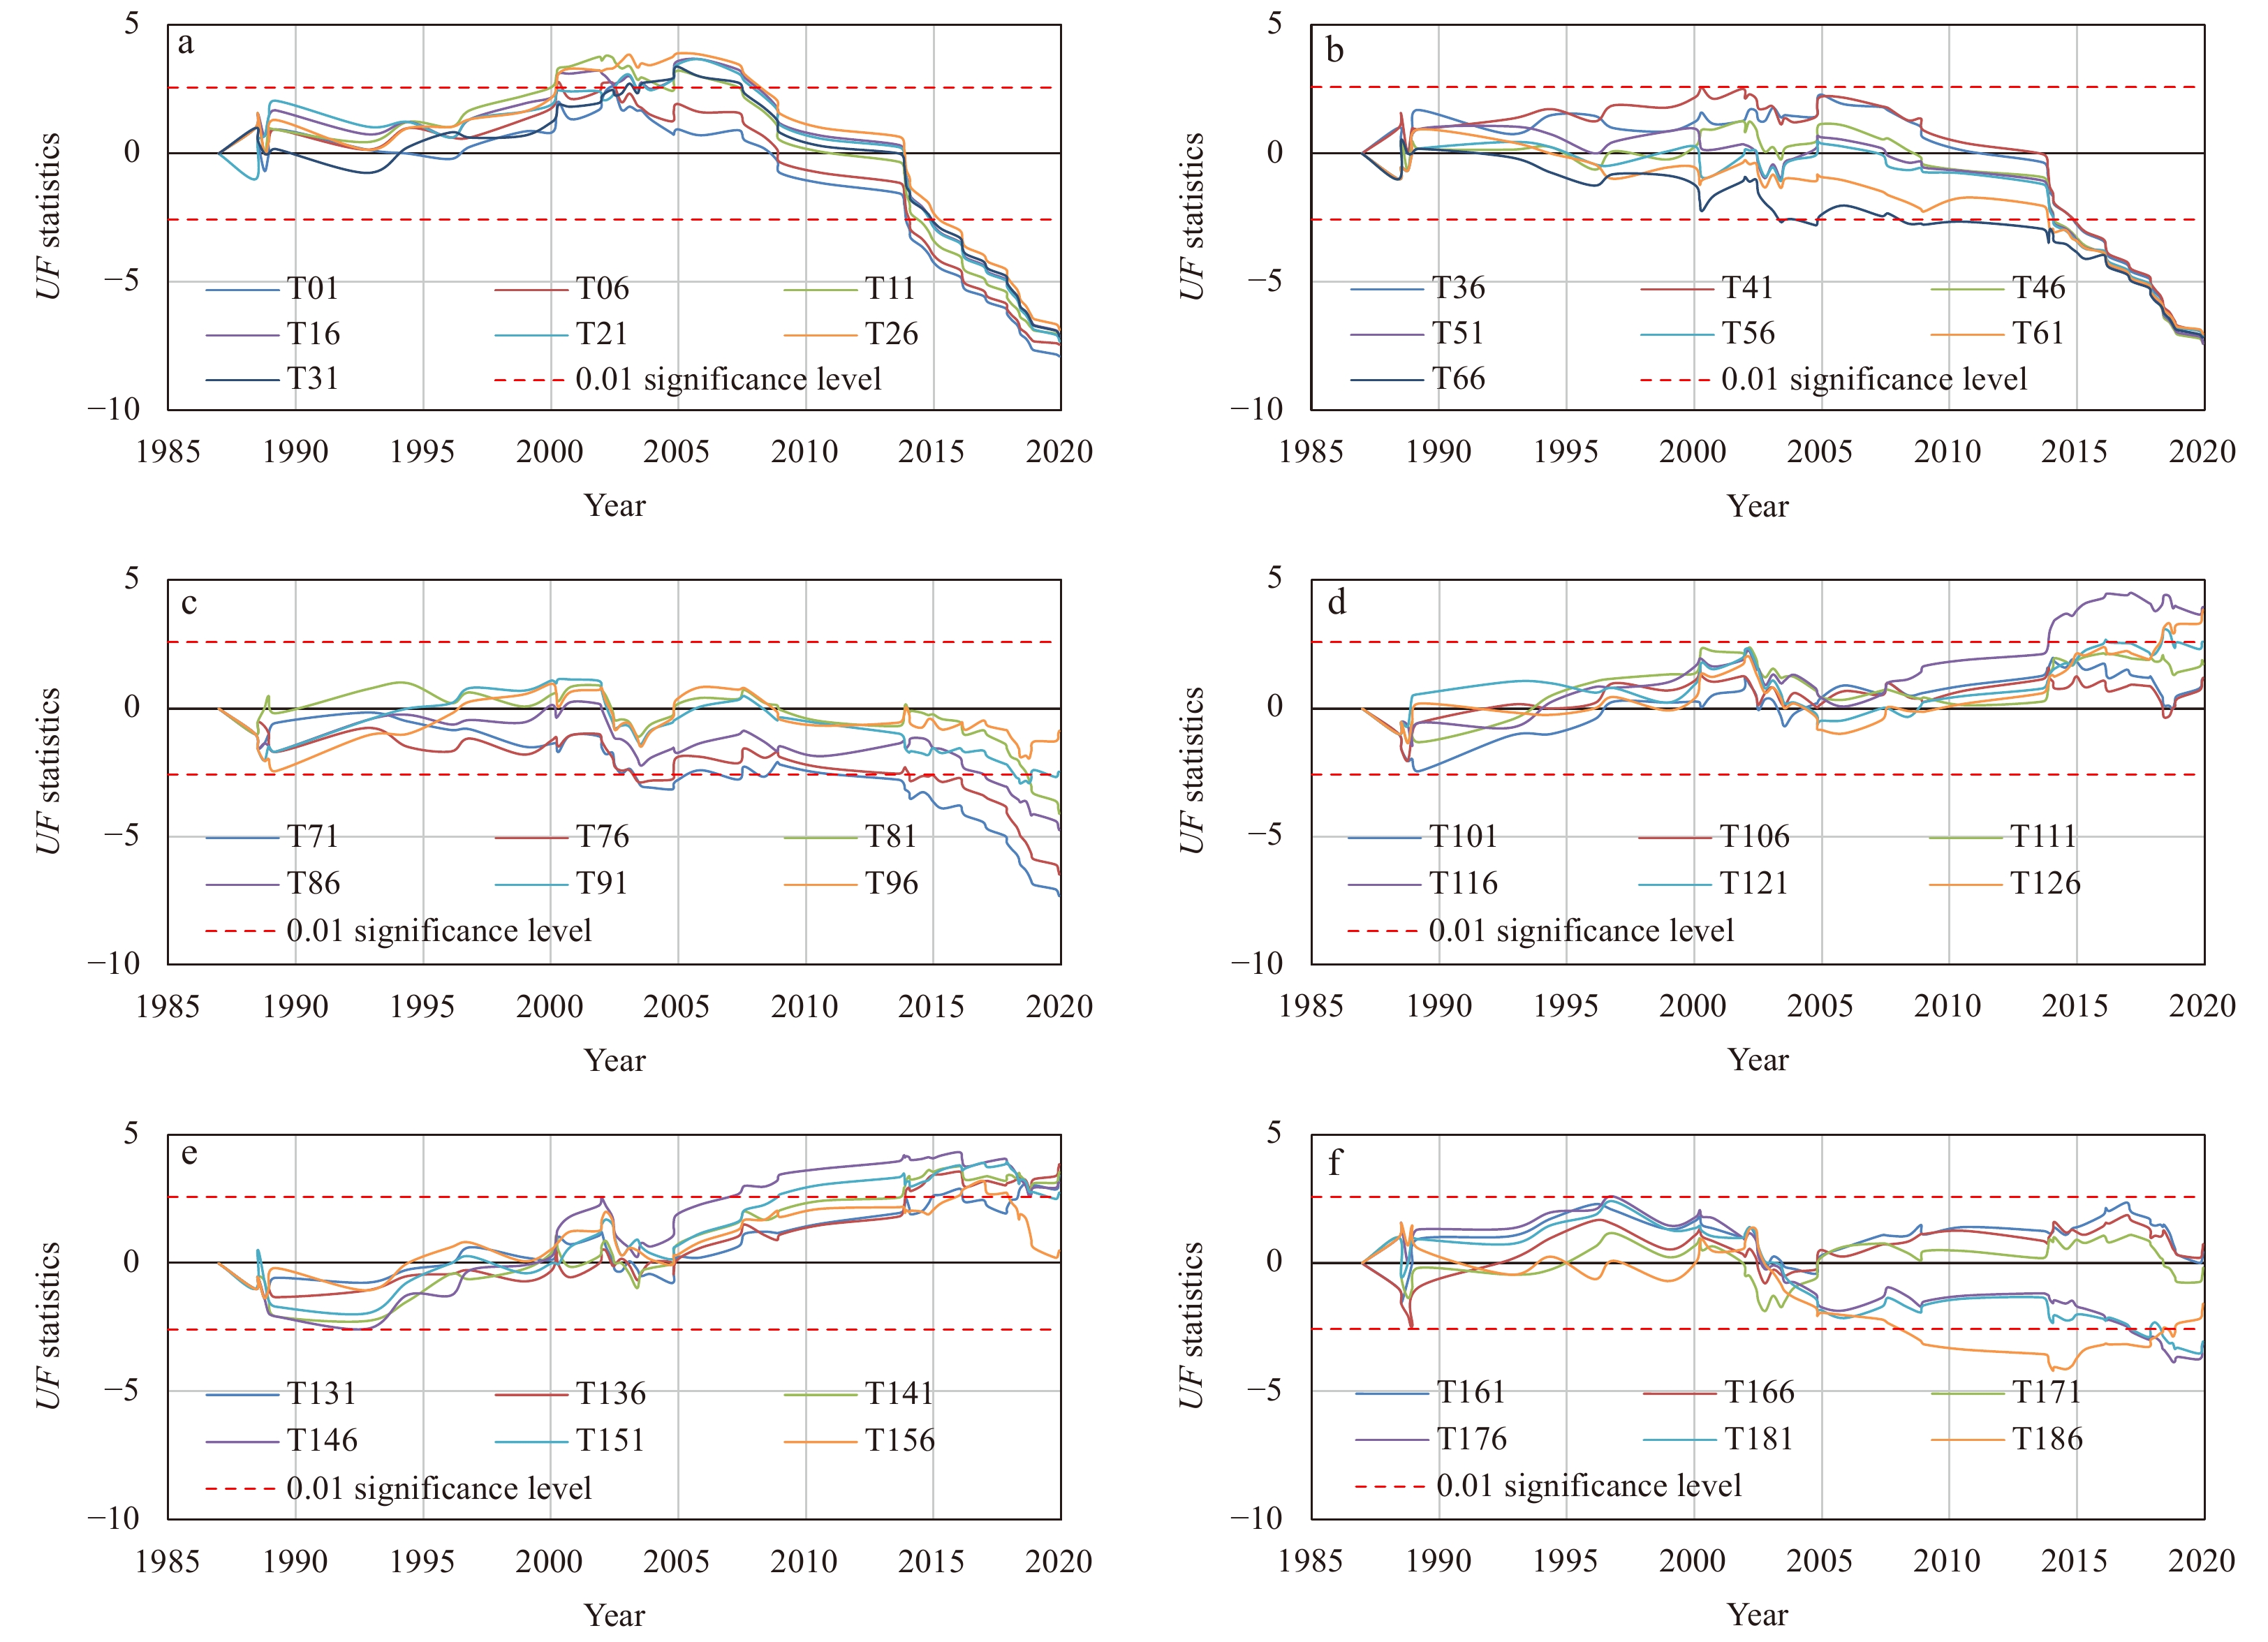
The measured beach profile data in the last five years and the remote sensing shoreline data in the past 30 years indicate that substantial erosion occurred on the western beach of Sanzhou Bay. For detecting when significant beach erosion began and easily identifying the causes of this hotspot, analyzing shoreline change processes in detail over the past 30 years is important. Linear and polynomial models were first applied to approximately assess the linear or non-linear behavior of the shoreline evolution based on the single-transect method. Increasing the order of the polynomial improves the accuracy of the model, but increases the complexity of the model (Figs 7a, c, e). However, this processing method cannot evaluate whether the data have been over-fitted. Thus, the M-K trend test was introduced in this study to address the significant trend change in shoreline positions in the long-term at a single transect. For instance, in Fig. 7b, the UF statistics indicate that the shorelines on transect T09 experienced accretion from 1986 to 2009, significantly from 2000 to 2005 (above the 0.01 significance level); however, they began to erode from 2009, with an increasingly significant erosion trend starting in 2014. Although the sixth-order polynomial model significantly improved the fitting effect of the shoreline position data on transect T167 (Fig. 7c), the result of the M-K trend test in Fig. 7d showed that the UF statistics did not pass the significance level of 0.01; therefore, the long-term shoreline trend was relatively stable. In this manner, additional transects were examined using UF statistics along the coast of Sanzhou Bay (Fig. 8).


The results show that the coastal segment from transects T01 to T31 had a significant accretion trend in the early stage and a significant erosion trend in the late stage (Fig. 8a). The segment from transects T36 to T96 had a relatively stable or slight erosion trend in the early period but a significant erosion trend in the late period. However, the obviousness of the trend of significant erosion in the late stage decreased toward the west of the bay (e.g., T96 transect) (Figs 8b, c). Additionally, the T101–T156 section had a relatively stable trend in the early period and a relatively significant accretion or stable state in the late period (Figs 8d, e). The segment covering transects T161–T186 showed a trend of longer-term stability or significant erosion in the late period (Fig. 8f). Based on the aforementioned analysis, the quadratic polynomial model is consistent with the trend of the shoreline change over the past 30 years and thus can approximately evaluate the non-linear behavior of the shoreline evolution. In addition, visual examination verified the high degree of spatial autocorrelation in the shoreline response for adjacent transects. The most important finding from Fig. 8 is that the western beach experienced an abrupt change in the longer-term trend at approximately the time of 2013.64 (corresponding to August 27, 2013, in the shoreline position dataset), which is expected to be the commencement of the erosion hotspot.
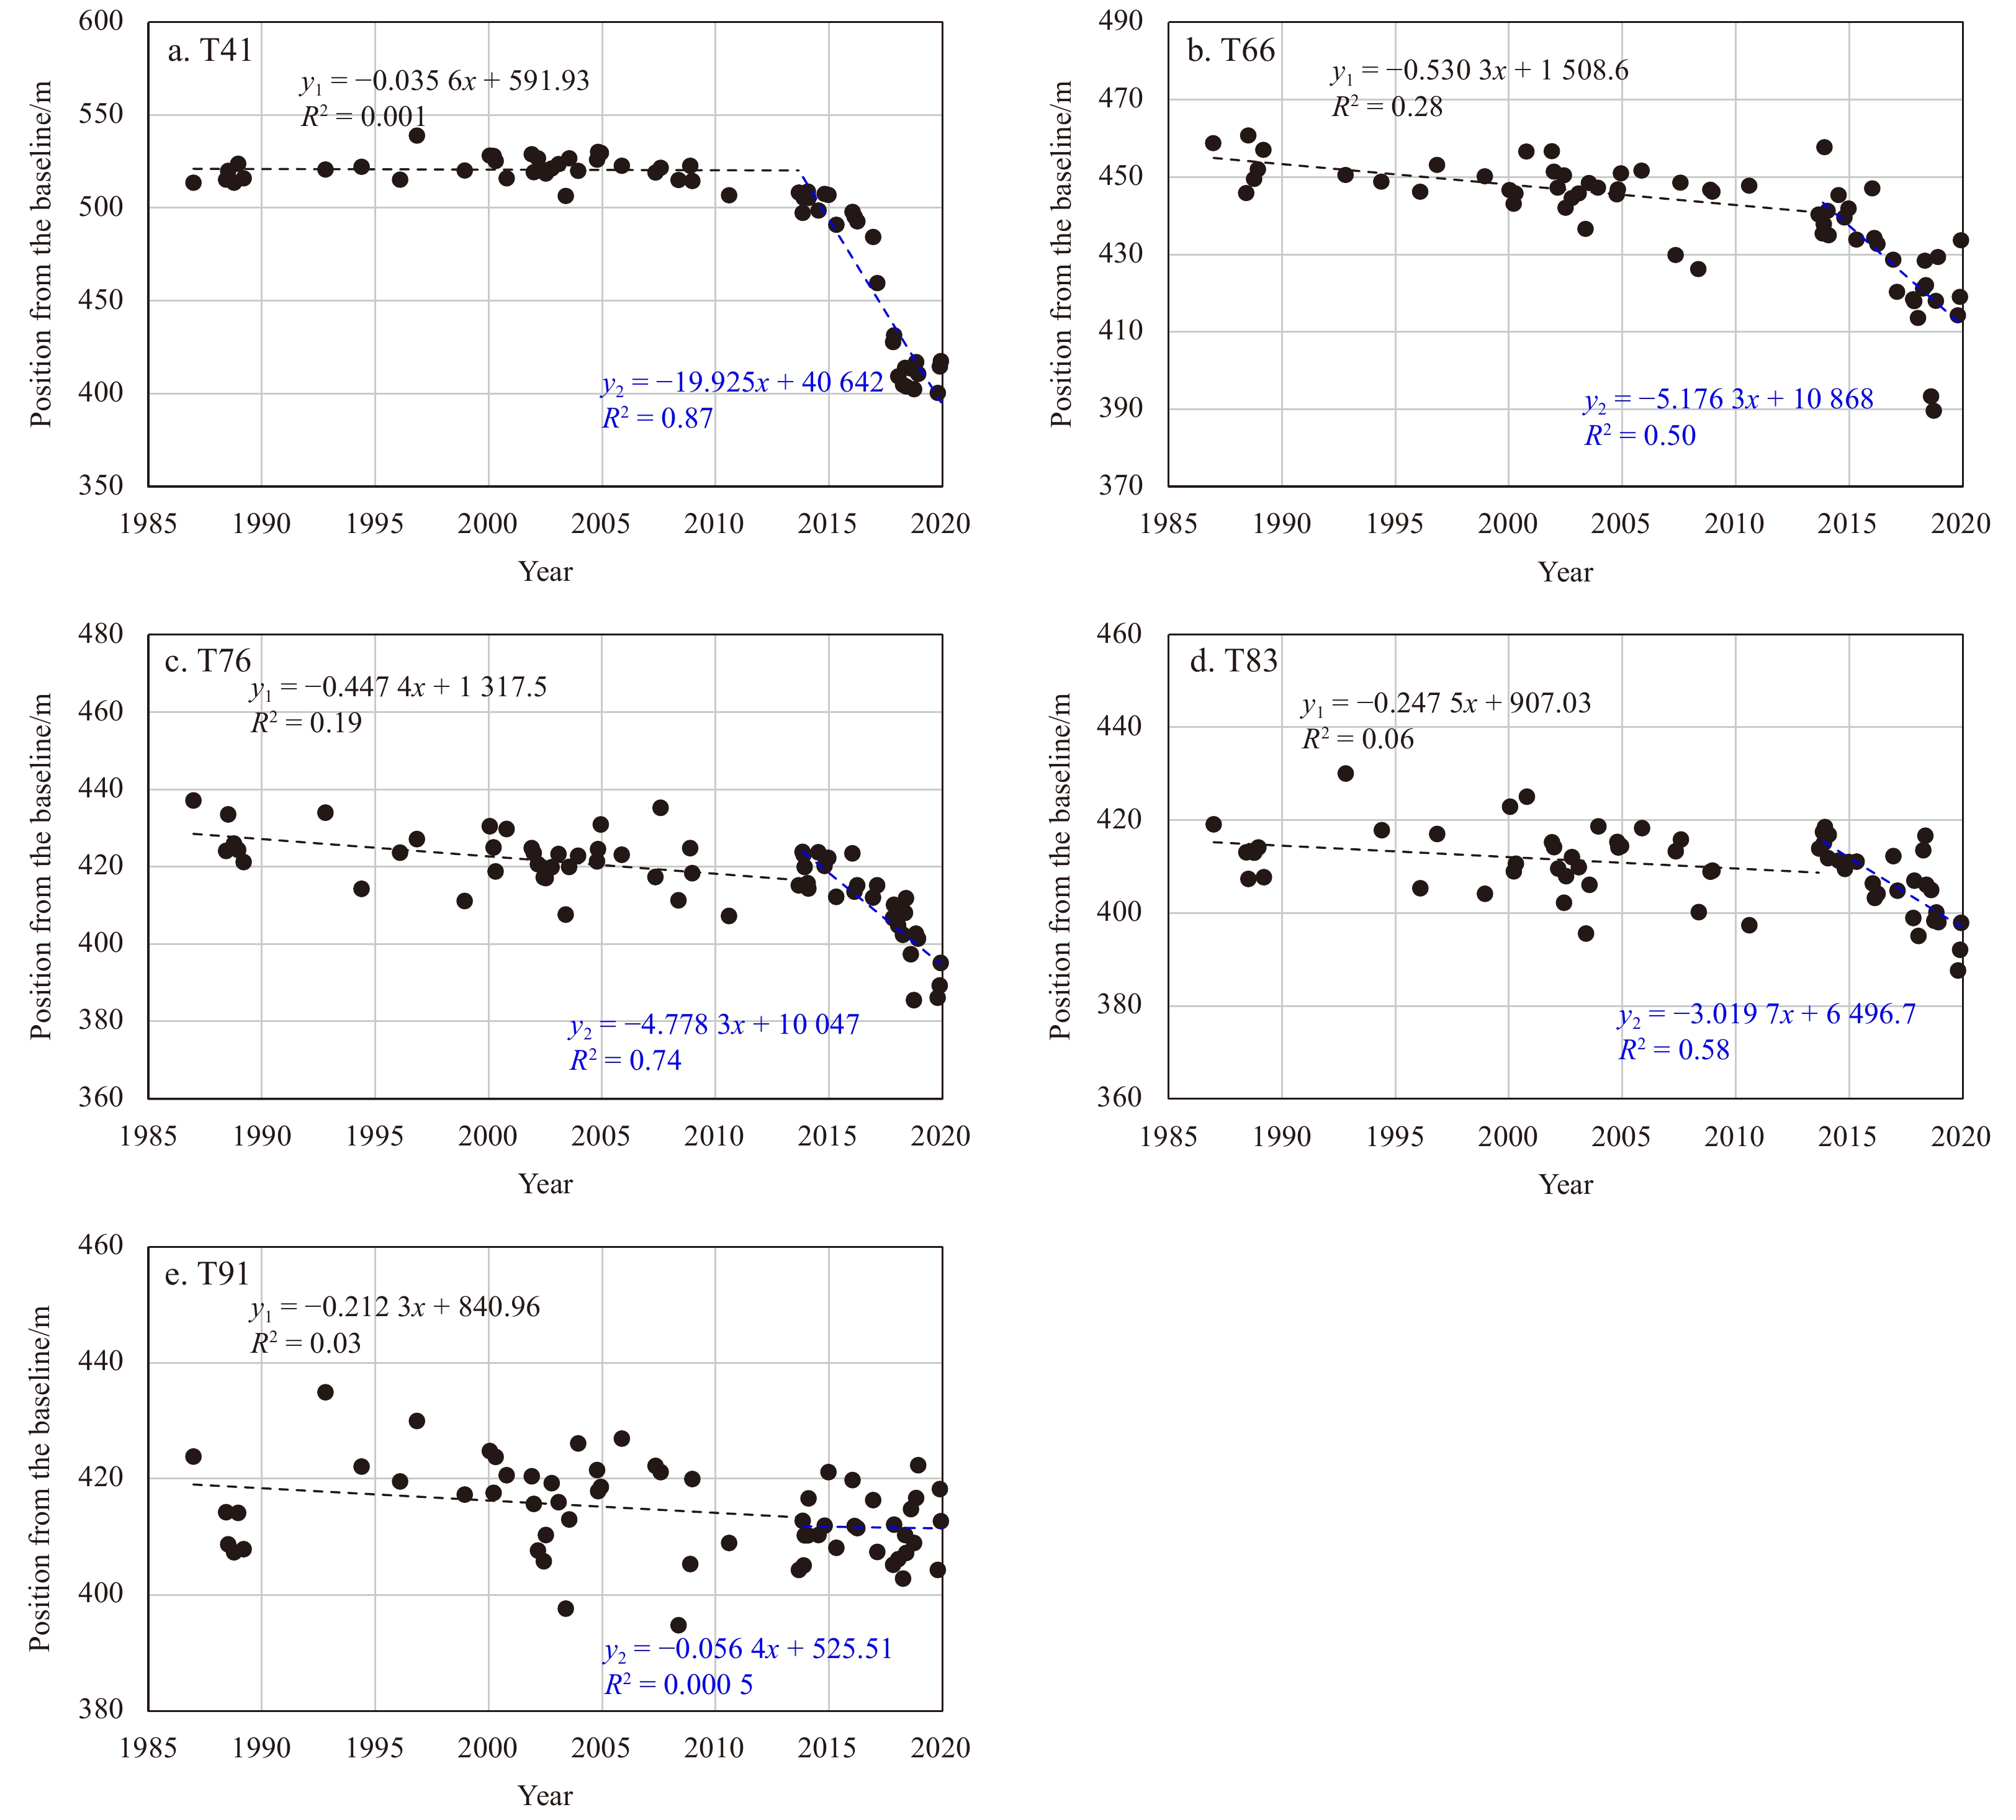
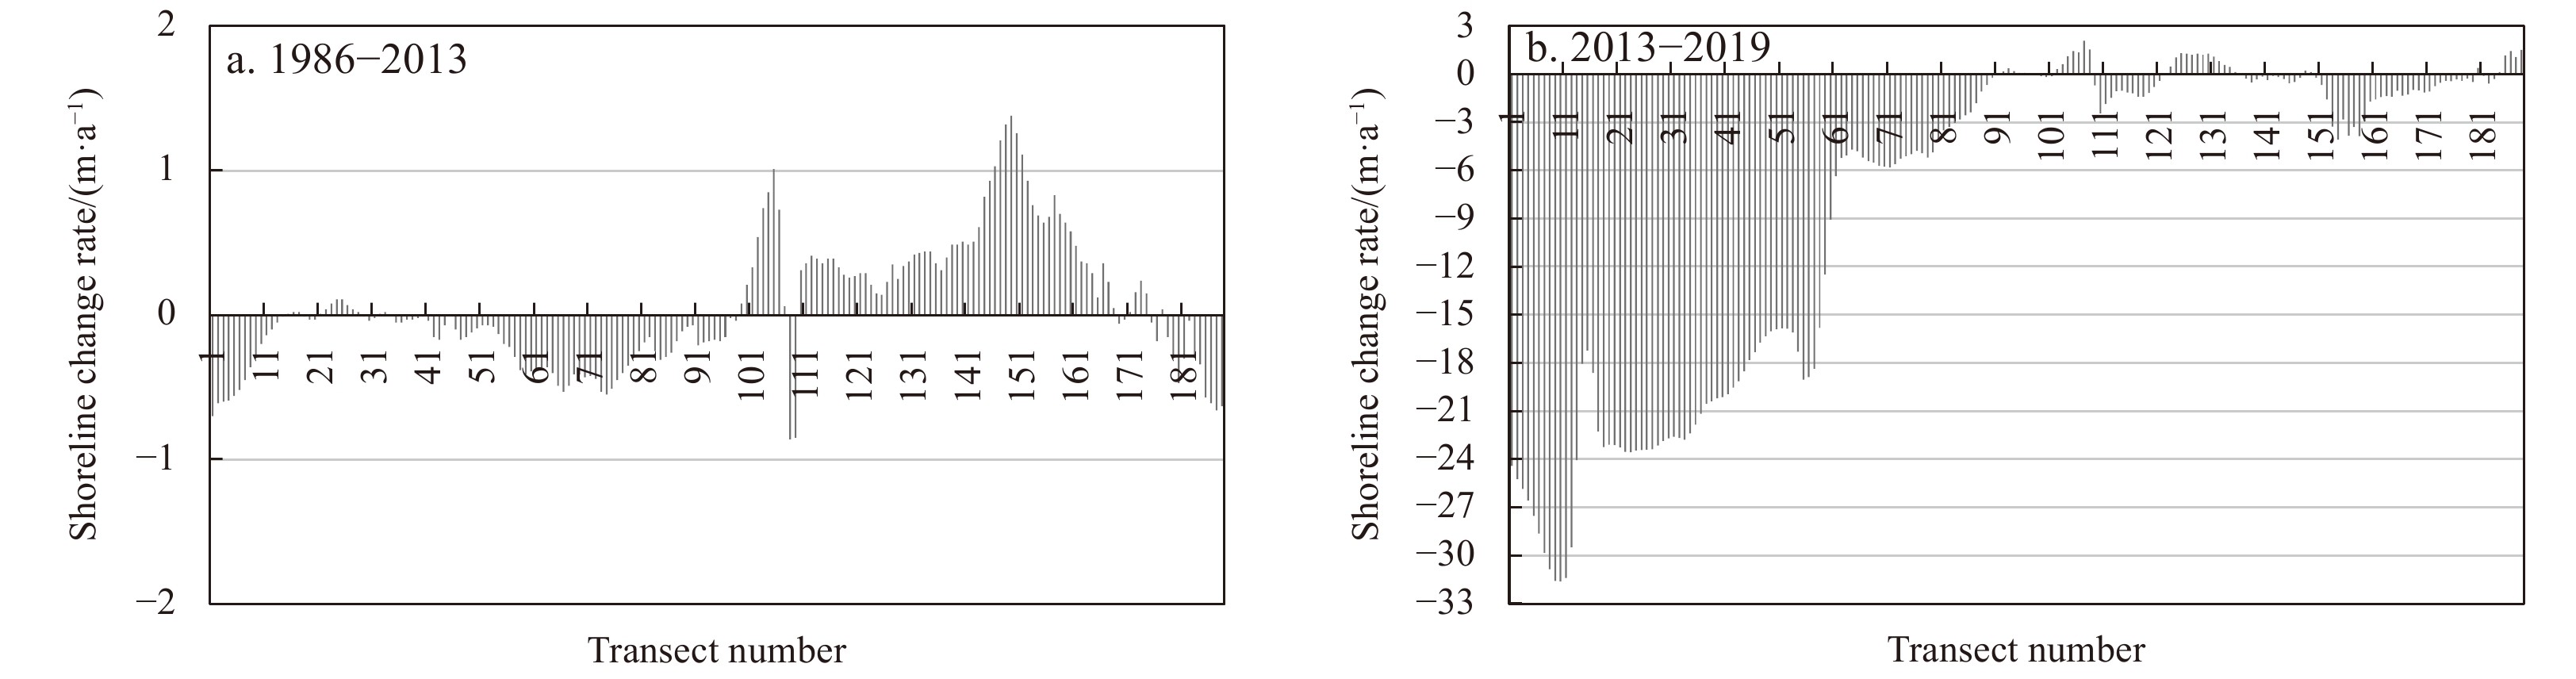
Table 1 lists the corresponding relationship between the five beach profiles observed from 2015 to 2019 and the corresponding transects generated by remote sensing shoreline data from 1986 to 2019; the values of the shoreline change rate were calculated using the linear regression method. For each of the five profiles or corresponding transect, the two data sources revealed that the beach was in an eroded state, and the erosion rate gradually decreased from west to east along the beach. However, the absolute values of the shoreline change rate calculated using remote sensing shoreline data were far lower than those obtained from the measured shoreline data from the five beach profiles. For example, the value of the erosion rate at P01/T41 was 21.6 m/a based on the measured shoreline data, and the corresponding value decreased sharply to 3.1 m/a from the remote sensing shoreline data. This finding reflects the unreliability of the linear hypothesis for analyzing long-term shoreline evolution. Therefore, the M-K trend test was performed to further evaluate the non-linear behavior of shoreline evolution. The encouraging finding obtained from Section 4.3 indicated 2013 as the starting time of the identified erosion hotspot (i.e., August 27, 2013, corresponding to the shoreline position dataset), indicating that the erosion hotspot revealed by the measured profile data is a continuation of a longer-term erosion process. According to this identified time, we divided the shoreline evolution on the corresponding five transects into two time periods and used the linear regression method to calculate the shoreline change rates of these two periods (Fig. 9). The results of the latter period show that the erosion rate of T41, T66, T76, T83, and T91 from 2013 to 2019 was 19.9 m/a, 5.2 m/a, 4.8 m/a, 3.0 m/a, and 0.1 m/a, respectively. These values are closer to those obtained from the measured beach profile data than those from the remote sensing shoreline data from 1986 to 2019, but there is some deviation, probably due to only six shoreline positions from the measured data being used to calculate change rate, which are more likely to be affected by outliers, especially those at the beginning. Thus, this time division was further applied to present the shoreline change in Sanzhou Bay in two periods over the past 30 years (Fig. 10). As also shown in Fig. 10a, the absolute values of the shoreline change rate on the overwhelming majority of transects was less than 0.75 m/a from 1986 to 2013, except for two erosive transects (T108 and T109) and 12 accretional transects (T104–T105, and T144–T153), among which the maximum accretion rate was 1.38 m/a at transect T149. This result also shows that that the western beach was in a relatively stable state during this period. However, since 2013, serious erosion has occurred on the coastal segment of transects T01–T86 with erosion rates of more than 2 m/a (Fig. 10b), indicating that the longshore shoreline length of the erosion hotspot exceeded 4.3 km. The more severe erosion occurred close to the west side of this bay, with an erosion peak rate of up to 31.6 m/a on transect T10. Thus, this erosion hotspot formed on the west side of Sanzhou Bay during this period is the most striking feature of shoreline changes in the near term and over the past 30 years.
| Measured profile | Change rate (2015–2019)/(m·a−1) | Corresponding transect | Change rate (1986–2019)/(m·a−1) |
| P01 | −21.6 | T41 | −3.1 |
| P02 | −8.1 | T66 | −1.1 |
| P03 | −8.1 | T76 | −0.8 |
| P04 | −8.0 | T83 | −0.4 |
| P05 | −5.8 | T91 | −0.3 |
 DownLoad:
CSV
DownLoad:
CSV


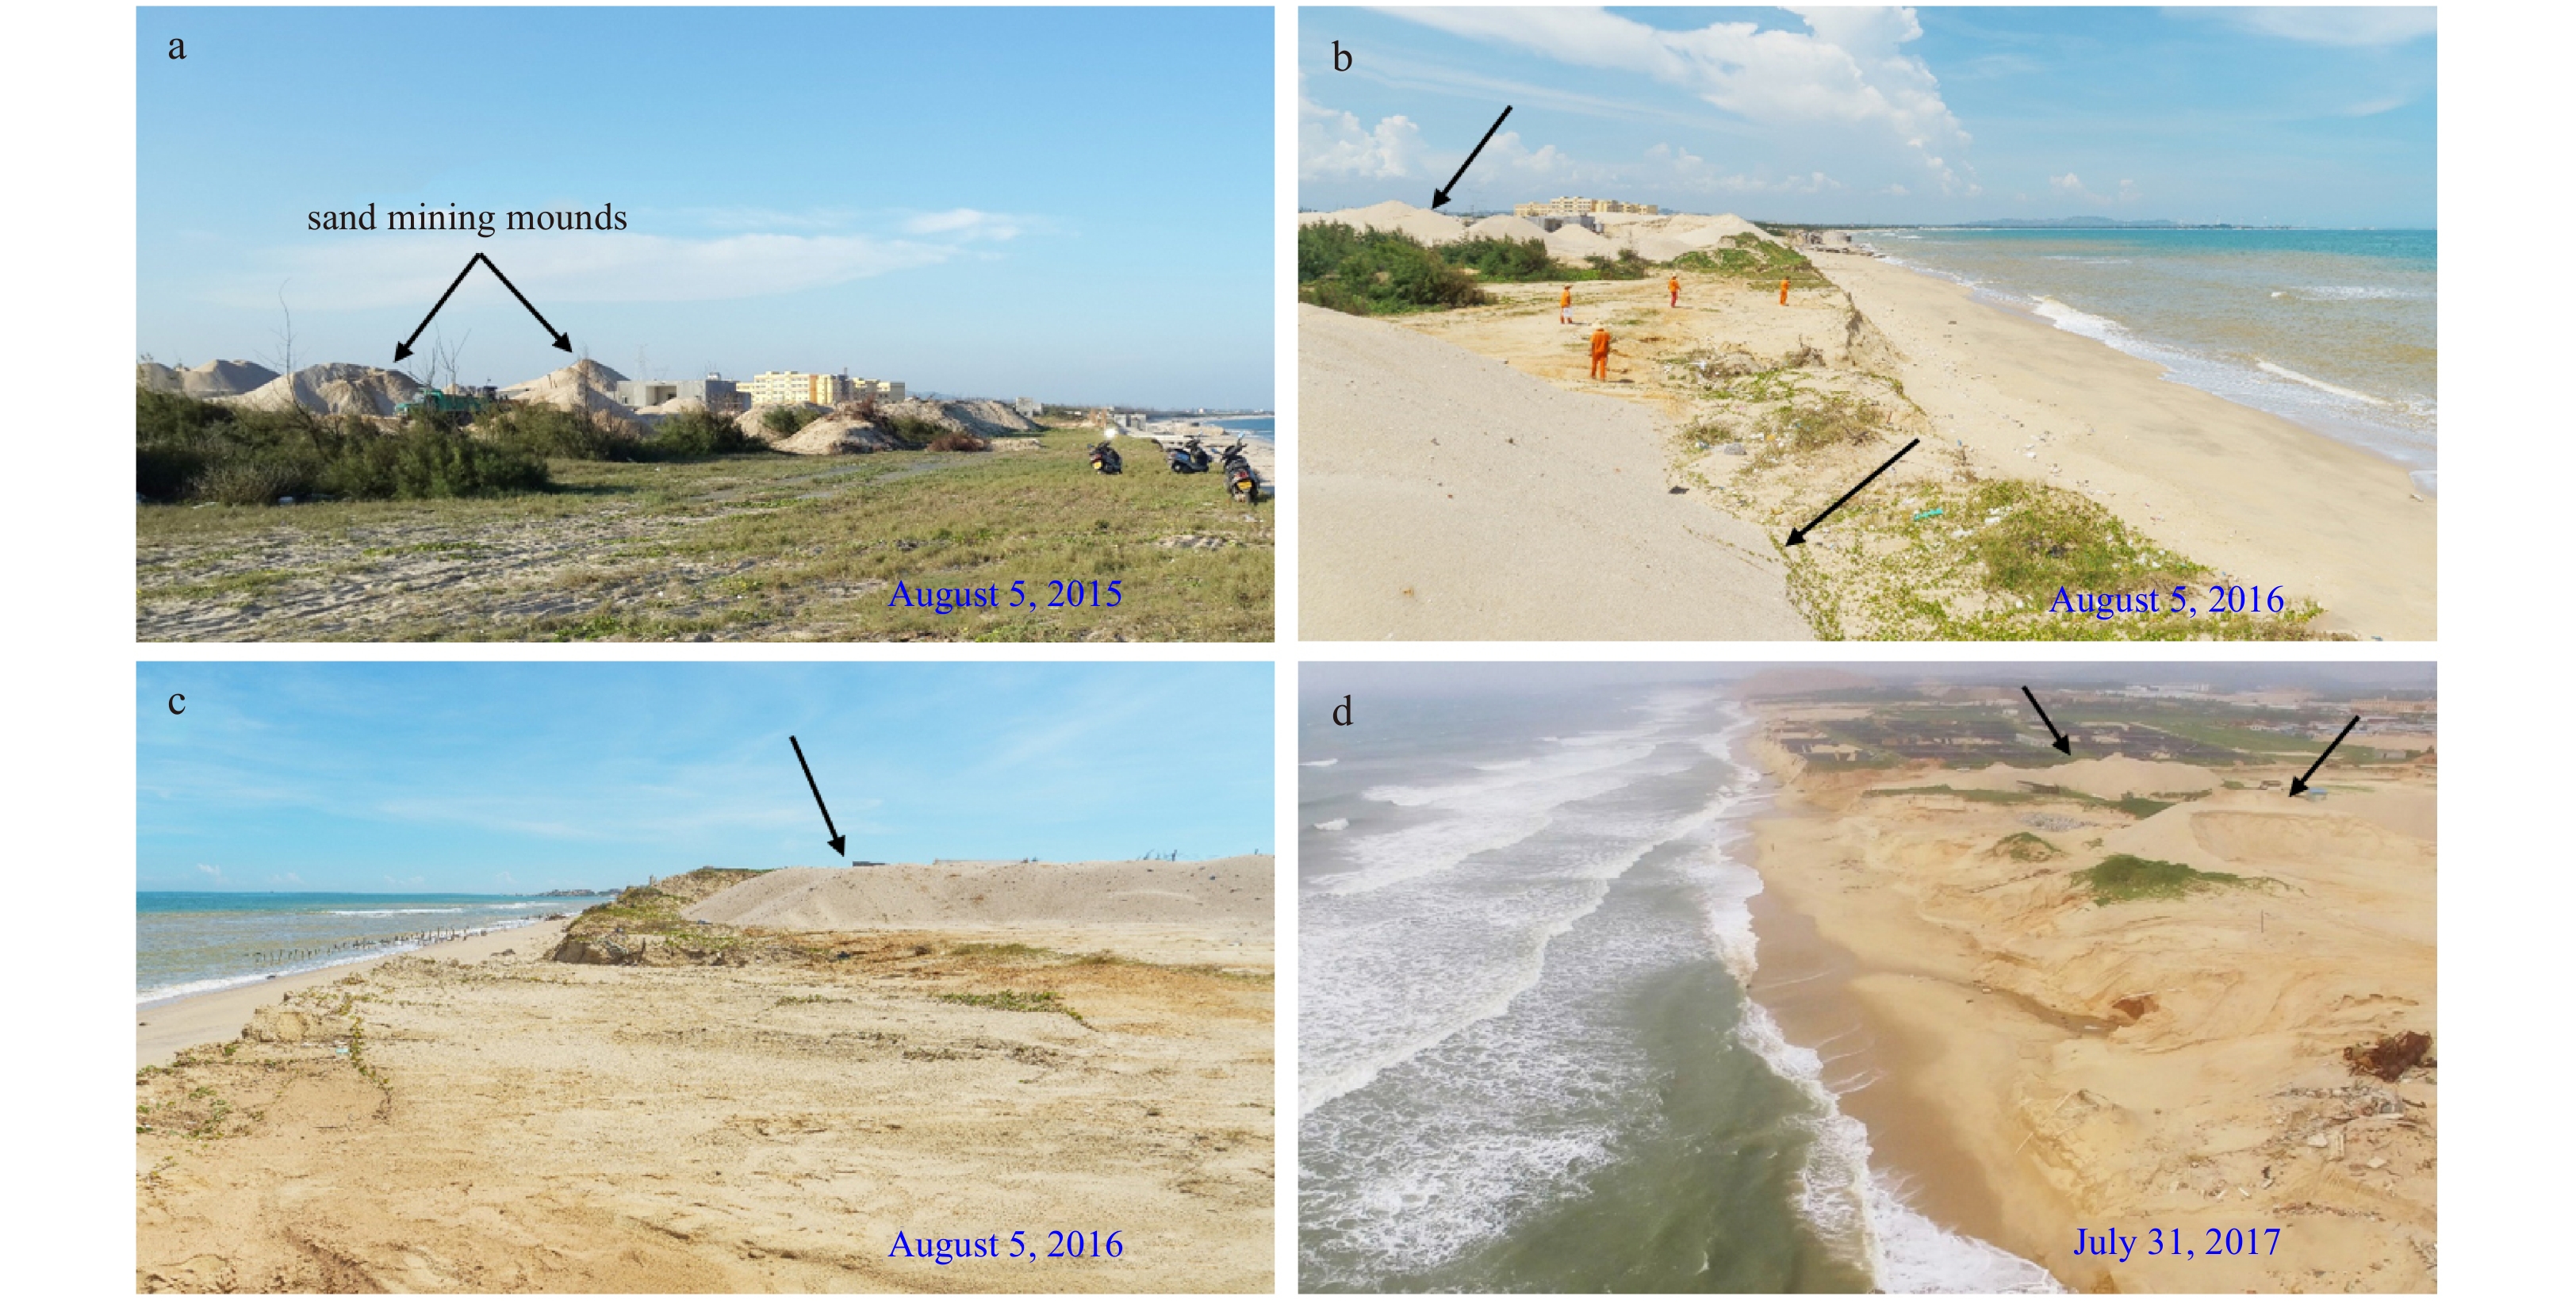
That the western beach of Sanzhou Bay was relatively stable from 1986 to 2013 and was significantly eroded from 2013 to 2019 suggests an abrupt change since 2013. The main causes leading to erosion hotspots include extreme events (List and Farris, 1999; List et al., 2006), a decrease in fluvial sediment availability (Del Río et al., 2013), and human intervention (Campbell and Jenkins, 2003; Bender and Dean, 2003). However, no river in or around Sanzhou Bay transports sediment to the study area. To evaluate whether the abrupt change was caused by typhoon events, this study extracted the significant wave heights every 6 h from 1986 to 2019 from the ERA-Interim wave reanalysis dataset at a model grid point (22.25°N, 115.75°E) located 58 km south of the western beach of Sanzhou Bay. Figure 11 shows the mean daily and monthly deep-water significant wave heights and identified typhoon events during the study period. A typhoon event was defined as a significant wave height greater than 3 m, and high waves due to winter cold-air outbreaks were excluded. The results in Fig. 11 indicate that at least 63 typhoon events have affected or hit the study area over the past 30 years. The three most significant typhoon events were Typhoon Mangkhut (No. 1822), with a peak wave height of 6.9 m in 2018; Typhoon Babs (No. 9812), with a peak wave height of 5.9 m in 1998; and Typhoon Imbudo (No. 0307), with a peak wave height of 5.4 m in 2003. Two typhoon events were identified from 2013 to 2014, namely Typhoon Jebi (No. 1309), with a peak wave height of 3.1 m, and Typhoon Utor (No. 1311), with a peak wave height of 3.5 m, which occurred in August 2013 (as shown by the blue dashed box in Fig. 11). These two typhoons finally landed in Wenchang, Hainan Province, and Yangxi, Guangdong Province. Their peak wave height were much lower than those of many typhoon events before 2013, and the typhoons did not directly hit the study area. Therefore, typhoon events could not be considered the main cause of the erosion hotspot of the western beach in Sanzhou Bay. Figure 12 shows a number of sand mounds observed on the backshore from 2015 to 2017, indicating that the most likely cause of the erosion hotspot was artificial sand mining activities.


Because of the absence of relevant studies on beach morphodynamics in the study area and relevant reports on this erosion hotspot, Google Earth image since 2010 was used to further analyze the erosion hotspot (Fig. 13). Y1 is the backshore benchmark of the measured beach profile P01 in 2019, and Y0 is an additional reference point added to the western side of the bay. Figure 13a shows that the western beach suffered minimal human activities before 2010, and the backshore was almost entirely covered by vegetation (e.g., Casuarina). However, in 2013, a sand stock dump appeared near Y0, and a large area between Y0 and Y1 was reclaimed as many aquaculture ponds (Fig. 13b). Subsequently, the backshore of the western beach was subjected to increasingly human activities (Figs 13c–f). The most prominent feature was the destruction of the backshore vegetation, and field investigations showed that the land was mainly used for industrial construction and agricultural cultivation. The maximum receding rate of T10, as high as 31.6 m/a from 2013 to 2019 (Fig. 10b); the sand stock dump near Y0 in 2013 (Fig. 13b); and several sand mounds observed from 2015 to 2017 (Fig. 12) indicate that artificial sand mining was the main cause of the formation of the erosion hotspot because the change in land use on the backshore was insufficient to cause such significant erosion.

Sand mining activities result in a decrease in sediment availability near the shore and destroy the morphodynamic beach equilibrium. During the survey period from 2015 to 2019, the most frequently occurring morphodynamic beach type was identified as rhythmic bar and beach (Fig. 14), indicating that the beach is mainly in a medium-wave energy environment. When the inshore sediment is reduced due to artificial mining and the nearshore hydrodynamic forcing is relatively unchanged, the sand on the beach must be sacrificed to maintain its morphodynamic equilibrium. The sand transported offshore is required not only to fill the sand mining pits but also to maintain the bar morphology. Backshore sediment is further sacrificed when there is insufficient sand on the beach to recover the original morphodynamic equilibrium. Typhoon events are the most significant natural drivers for achieving this goal. High typhoon waves hit the high backshore soil cliff composed of loose sediment, causing the extreme retreat of the soil cliff parallel to the coast, especially when backshore vegetation is destroyed. Consequently, an erosion hotspot was formed on the west side of Sanzhou Bay. Therefore, the most fundamental reason for the formation of erosion hotspots is artificial sand mining, but the current extremely significant shoreline retreat is also due to occasional typhoon events, reflecting the consequence of the joint action of human and natural processes. In addition to the main cause of artificial sand mining activities, the destruction of backshore vegetation contributes to beach erosion. Sun et al. (2015) demonstrated that most sandy beaches in Guangdong Province have undergone sand mining activities to varying degrees since the 1980s, and sand mining has become the primary cause of coastal erosion in some coastal sections. This study provides a specific example of rapid shoreline response to artificial sand mining activities. The formation of this erosion hotspot since 2013 not only led to significant beach retreat on the west side of Sanzhou Bay but also affected the safety of agricultural production and industrial layout behind the beach. This phenomenon is a stark warning about the cautious development and utilization of coastal zones and the strict control of human activities.

Based on six measured beach profile investigations from 2015 to 2019, this findings of this study demonstrated an erosion hotspot with a maximum shoreline erosion rate of more than 20 m/a and a maximum retreat distance of more than 80 m. To detect the time when the erosion hotspot began and the potential cause of its formation, we used 63 Landsat images from 1986 to 2019 to establish the time series of shoreline positions over the past 30 years by extracting high-tide shorelines. Then, to examine the long-term change processes of shorelines, this study introduced the M-K trend test method to evaluate the non-linear behavior of shorelines. The results show that the quadratic polynomial model conforms to the evolution trend of Sanzhou Bay, and it was found that the erosion hotspot was expected to start in approximately 2013, which is earlier than the measured period of beach profile. From 2013 to 2019, the erosion hotspot formed on the west side of the bay was characterized by erosion rates of more than 2 m/a and longshore shoreline length of more than 4.3 km, with a maximum erosion rate of 31.6 m/a. It is believed that the formation of the erosion hotspot is closely related to artificial sand mining activities near the shore of the western beach, which destroys the original morphodynamic equilibrium of the beach. Destruction of backshore vegetation also contributes to beach erosion. However, the unusually significant soil cliff retreat parallel to the coast on the western beach is also closely associated with typhoon events. This finding reflects the combined effects of human and natural processes. This study provides a concrete example of the rapid response of shorelines to human activities, which is a stark warning about the cautious development and utilization of coastal zones and the strict control of human activities.
|
Barnard P L, Short A D, Harley M D, et al. 2015. Coastal vulnerability across the Pacific dominated by El Niño/Southern Oscillation. Nature Geoscience, 8(10): 801–807. doi: 10.1038/ngeo2539
|
|
Bender C J, Dean R G. 2003. Wave field modification by bathymetric anomalies and resulting shoreline changes: a review with recent results. Coastal Engineering, 49(1–2): 125–153
|
|
Benkhattab F Z, Hakkou M, Bagdanavičiūtė I, et al. 2020. Spatial-temporal analysis of the shoreline change rate using automatic computation and geospatial tools along the Tetouan coast in Morocco. Natural Hazards, 104(1): 519–536. doi: 10.1007/s11069-020-04179-2
|
|
Campbell T J, Jenkins M G. 2003. Design considerations for hot spot erosion areas on beach nourishment projects. In: Proceedings of 28th International Conference on Coastal Engineering 2002. Cardiff: World Scientific, 3642–3648
|
|
Carvalho B C, Dalbosco A L P, Guerra J V. 2020. Shoreline position change and the relationship to annual and interannual meteo-oceanographic conditions in southeastern Brazil. Estuarine, Coastal and Shelf Science, 235: 106582
|
|
Dean R G, Liotta R, Simon G. 1999. Erosional Hot Spots. Gainesville: Coastal & Oceanographic Engineering Program, University of Florida, 60
|
|
Del Río L, Gracia F J, Benavente J. 2013. Shoreline change patterns in sandy coasts. A case study in SW Spain. Geomorphology, 196: 252–266. doi: 10.1016/j.geomorph.2012.07.027
|
|
Fenster M, Dolan R. 1994. Large-scale reversals in shoreline trends along the U. S. mid-Atlantic coast. Geology, 22(6): 543–546. doi: 10.1130/0091-7613(1994)022<0543:LSRIST>2.3.CO;2
|
|
Fenster M S, Dolan R, Elder J F. 1993. A new method for predicting shoreline positions from historical data. Journal of Coastal Research, 9(1): 147–171
|
|
Frazer L N, Genz A S, Fletcher C H. 2009. Toward parsimony in shoreline change prediction (I): Basics function methods. Journal of Coastal Research, 25(2): 366–379
|
|
Gao Yi, Wang Hui, Su Fenzhen, et al. 2013. The analysis of spatial and temporal changes of the continental coastlines of China in recent three decades. Haiyang Xuebao (in Chinese), 35(6): 31–42
|
|
Hakkou M, Maanan M, Belrhaba T, et al. 2018. Multi-decadal assessment of shoreline changes using geospatial tools and automatic computation in Kenitra coast, Morocco. Ocean & Coastal Management, 163: 232–239
|
|
Hapke C J, Reid D, Richmond B. 2009. Rates and trends of coastal change in California and the regional behavior of the beach and cliff system. Journal of Coastal Research, 2009(253): 603–615
|
|
Hou Xiyong, Wu Ting, Hou Wan, et al. 2016. Characteristics of coastline changes in mainland China since the early 1940s. Science China Earth Sciences, 59(9): 1791–1802. doi: 10.1007/s11430-016-5317-5
|
|
Hou Xiyong, Wu Ting, Wang Yuandong, et al. 2014. Extraction and accuracy evaluation of multi-temporal coastlines of China’s mainland since 1940s. Marine Sciences (in Chinese), 38(11): 66–73
|
|
Hu Yabin, Ma Yi, Sun Weifu, et al. 2016. A method of extracting sandy coastline based on multi-temporal images: a case in Haiyang Beach. Ocean Development and Management (in Chinese), 33(5): 32–36,49
|
|
Kendall M G. 1975. Rank Correlation Methods. London: Charles Grifin
|
|
Kish S A, Donoghue J F. 2013. Coastal response to storms and sea-level Rise: Santa Rosa Island, Northwest Florida, USA. Journal of Coastal Research, 63: 131–140. doi: 10.2112/SI63-012.1
|
|
Kraus N C, Galgano F A. 2001. Beach erosional hot spots: types, causes, and solutions. In: Proceedings of 14th Beach Preservation Technology Conference. Tallahassee, FL: Florida Shore and Beach Preservation Association, 64–80
|
|
List J H, Farris A S. 1999. Large-scale shoreline response to storms and fair weather. In: Proceedings of the International Conference-Coastal Engineering Conference 4. New York: American Society of Civil Engineering, 1324–1338
|
|
List J H, Farris A S, Sullivan C. 2006. Reversing storm hotspots on sandy beaches: spatial and temporal characteristics. Marine Geology, 226(3–4): 261–279
|
|
Liu Baiqiao, Meng Qingwei, Zhao Jianhua, et al. 2015. Variation of coastline resources utilization in China from 1990 to 2013. Journal of Natural Resources (in Chinese), 30(12): 2033–2044
|
|
Maiti S, Bhattacharya A K. 2009. Shoreline change analysis and its application to prediction: a remote sensing and statistics based approach. Marine Geology, 257(1–4): 11–23
|
|
Mann H B. 1945. Non-parametric tests against trend. Econometrica, 13(3): 245–259. doi: 10.2307/1907187
|
|
Sun Jie, Zhan Wenhuan, Yao Yantao, et al. 2015. Current situation and influence factors of coastal erosion in Guangdong. Haiyang Xuebao (in Chinese), 37(7): 142–152
|
|
Thieler E R, Himmelstoss E A, Zichichi J L, et al. 2009. Digital Shoreline Analysis System (DSAS) version 4.0 — An ArcGIS extension for calculating shoreline change. http://pubs.usgs.gov/of/2008/1278/[2022-05-11]
|
|
Wang Wenjie, Yang Xuewu. 1996. Beach phases and evolution in the coasts of South China. Tropic Oceanology (in Chinese), 15(4): 9–16
|
|
Xu Nan, Gong Peng. 2018. Significant coastline changes in China during 1991–2015 tracked by Landsat data. Science Bulletin, 63(14): 883–886. doi: 10.1016/j.scib.2018.05.032
|
|
Xu Jinyong, Zhang Zengxiang, Zhao Xiaoli, et al. 2013. Spatial-temporal analysis of coastline changes in northern China from 2000 to 2012. Acta Geographica Sinica (in Chinese), 68(5): 651–660
|
|
Zhang Xiang, Wang Xiaopeng, Huang Anqi, et al. 2021. Extraction of complex coastline feature and its multi-year changes in Shandong Peninsula based on remote sensing image. Transactions of Oceanology and Limnology (in Chinese), 43(2): 171–181
|
|
Zhu Luoyun, Liu Tingting, Fan Renfu, et al. 2022. Study on the evolution process and driving mechanism of the sandy shoreline of the Qiwang Bay in eastern Guangdong from 1986 to 2019. Haiyang Xuebao (in Chinese), 44(7): 82–94
|
| 1. | Cuiping Kuang, Jiadong Fan, Xuejian Han, et al. Numerical Modelling of Beach Profile Evolution with and without an Artificial Reef. Water, 2023, 15(21): 3832. doi:10.3390/w15213832 |
Figures(14) / Tables(1)

Supported by:
Beijing Renhe Information Technology Co. Ltd

Jitao Yu, Yuanting Ding, Lin Zhang, Pei Liu, Renfu Fan. Erosion hotspot identified along the sandy coast of Shanwei: characteristics and origin[J]. Acta Oceanologica Sinica, 2023, 42(7): 91-102. doi: 10.1007/s13131-022-2124-z

| Measured profile | Change rate (2015–2019)/(m·a−1) | Corresponding transect | Change rate (1986–2019)/(m·a−1) |
| P01 | −21.6 | T41 | −3.1 |
| P02 | −8.1 | T66 | −1.1 |
| P03 | −8.1 | T76 | −0.8 |
| P04 | −8.0 | T83 | −0.4 |
| P05 | −5.8 | T91 | −0.3 |
DownLoad:
CSV
 DownLoad:


 DownLoad: