

Figure
1.
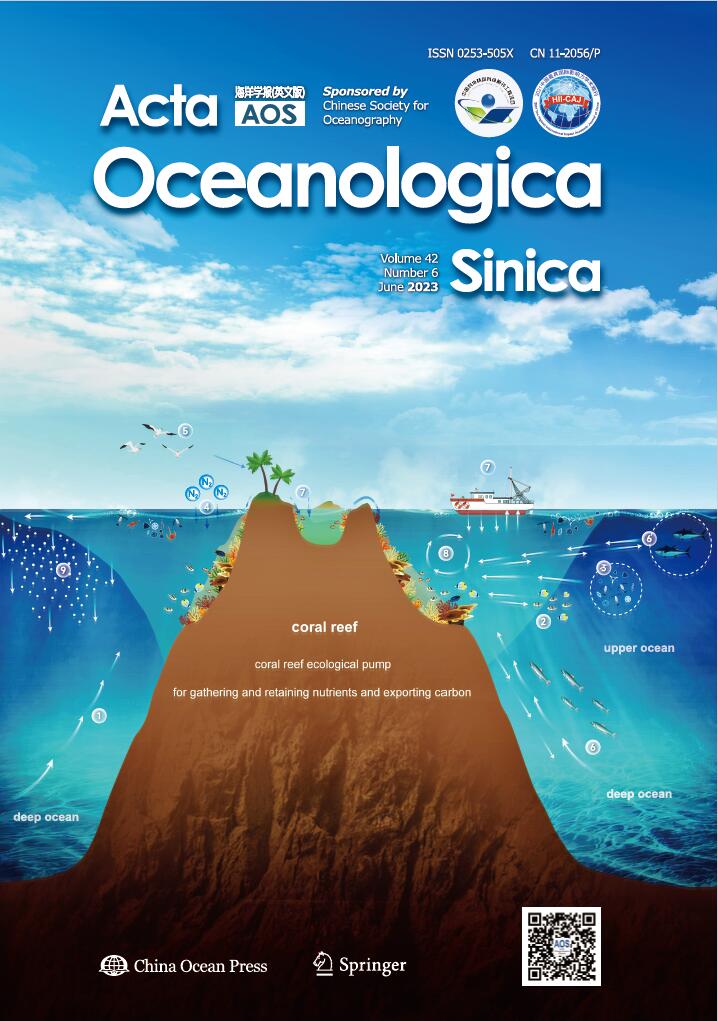
Gene maps of Cleistostoma dilatatum (a) and Euplax sp. (b) mitogenomes. Genes encoded on the heavy or light strands are shown outside or inside the circular gene map, respectively.
| Citation: | Longxiao Zheng, Mengquan Wu, Jie Zhao, Shaopeng Luan, Dongliang Wang, Wei Jiang, Mingyue Xue, Jiayan Liu, Yating Cui. Effects of Ulva prolifera dissipation on the offshore environment based on remote sensing images and field monitoring data[J]. Acta Oceanologica Sinica, 2023, 42(6): 112-120. doi: 10.1007/s13131-022-2129-7

|
With the rapid development of next-generation sequencing (NGS) technologies that can effectively analyze huge pools of molecular data, an increasing number of mitogenomes provide important insights into species evolution and phylogenetic relationships (Tan et al., 2018; Ruan et al., 2020, Yang et al., 2021). Generally, gene order in most vertebrate mitogenomes is considered conserved, e.g., less than 4% rearrangement ratio in fish mitogenomes (Li et al., 2013). However, extensive gene rearrangements have been observed in invertebrate mitogenomes (Wu et al., 2012; Liu et al., 2017; Jiang et al., 2018). Recent studies have shown that some of these rearrangements contain useful information for phylogeny, and many scholars have applied gene rearrangement as a new molecular marker in phylogenetic studies. For example, Akasaki et al. (2006) compared the gene rearrangement of subclass Coleoidea and proposed that the arrangements of mitochondrial genes in Oegopsida and Sepiida were derived from those of Octopoda. This conclusion is consistent with the results of their phylogenetic analysis based on mitochondrial genes. Through a comparative study of gene rearrangement and phylogenetic relationships of five species from the superfamily Tellinoidea, Yuan et al. (2012) suggested that the genus Sinonovacula should be placed in the superfamily Solenoidea instead of the superfamily Tellinoidea. Besides, Tan et al. (2018) compared the published mitogenome sequences of two infraorders (Anomura and Brachyura) and affirmed the potential value of using rearrangement information to investigate the phylogeny of Anomura.
In contrast, there are also some scholars consider that gene order is not suitable for phylogenetic reconstruction. For example, Xie et al. (2019) demonstrated that approach based on gene order alone is clearly inferior to sequence-based approaches to resolve major phylogenetic relationships. In their research, none of the relationships among major stylommatophoran groups were resolved in the gene order tree. Recently, Zhang et al. (2021b) reconstructed the phylogeny of Paguroidea based on both sequence data and gene order. The results indicated that gene order data did not seem to work well for phylogenetic analysis within families. From their gene order tree, the relationships within families are suspicious because two close relatives belonging to the same genus (Dardanus arrosor and D. aspersus) owned two different gene rearrangements. Of course, increasing the availability of mitogenomic data from different taxa will help to validate the applicability of gene order data in inferring phylogenetic relationships.
The infraorder Brachyura contains approximately 7 250 known species inhabiting marine, freshwater, and terrestrial habitats (Chen et al., 2018; Ma et al., 2019). Brachyura, as the oldest crab, originated in the Jurassic period (Schweitzer and Feldmann, 2010; Davie et al., 2015a), and a group of its members with extremely diverse morphology and ecology was finally formed after massive radiative evolution. However, the diversity has also caused remarkably challenges for species identification, and their real phylogenetic relationships remain controversial (Camargo et al., 2020; Tan et al., 2018). Grapsoidea and Ocypodoidea, two of the most abundant and economically important groups in Brachyura, are of commercial value to fisheries and aquaculture. However, the classification of Grapsoidea and Ocypodoidea has been controversial for a long time. Previous studies based on morphological features considered them to be monophyletic clades (Ng et al., 2008; Davie et al., 2015b). Recently, an increasing number of molecular studies have challenged the monophyly of these taxa (Chen et al., 2018, 2019; Lu et al., 2020). For example, molecular study of Wang et al. (2020) revealed that Ocypodoidea and Grapsoidea are divided into three clades, and similar findings were presented in Tan et al. (2018). Larger taxon samples are required to fully understand the phylogenetic relationships between Ocypodoidea and Grapsoidea in future studies.
Members of the family Camptandriidae Stimpson, 1858 are commonly found in the estuarine, mangrove mudflat, and open mudflat habitats in the Indo-West Pacific regions (Jones and Clayton, 1983). Species of this family share a distinct condition in the male first gonopod, in which the distal part is bent or twisted over the proximal base by about 180°, producing a strongly recurved structure (Naruse et al., 2015). Initially, this family was regarded as a subfamily of Ocypodidae. Subsequently, Camptandriinae was raised to the family level and a complete diagnosis of this family was carried out (Cheryl, 1997). According to WoRMS (
Members of the family Macrophthalmidae Dana, 1851 occur throughout the Indo-West Pacific, with most of the known species living in intertidal habitat (Mendoza and Ng, 2007). The macrophthalmids are distinguished primarily by having antennules that fold transversely or obliquely, a narrow inter-antennulary septum, external maxillipeds that do not completely close the buccal cavern, and eyestalks that are usually elongate (Davie, 2002). Although this family had long been regarded as a subfamily of Ocypodidae, Kitaura et al. (2002) provided clear molecular evidence that it should be regarded as a distinct family. At present, it includes 86 species belonging to 13 genera. Similarly, the genus Euplax H. Milne Edwards, 1852, it was initially regarded as a subgenus of Macrophthalmus Desmarest, 1823. Afterward, McLay et al. (2010) updated it to a valid genus. According to WoRMS, the genus Euplax only contains two species, Euplax dagohoyi (Mendoza and Ng, 2007) and Euplax leptophthalmus (H. Milne Edwards, 1852). To date, only three complete mitogenomes of this family are available from the National Center for Biotechnology Information (NCBI) dataset, and all of them belong to the genus Macrophthalmus. The phylogenetic relationships among Macrophthalmidae have been poorly resolved.
Accordingly, in the present study, two newly sequenced mitogenomes of Ocypodoidea (C. dilatatum and Euplax sp.) were reported for the first time, one of which (C. dilatatum) is the first species in the family Camptandriidae whose complete mitogenome was sequenced. The characteristics of these two mitogenomes and the other 17 mitogenomes clustering in one branch of the phylogenetic tree were compared. Genome collinearity analysis of 19 mitogenomes showed that 18 of them shared the same gene rearrangement, while that of C. dilatatum mitogenome was consistent with the ancestral gene arrangement of Brachyura. Possible models were proposed to explain the current mitogenomic rearrangements. The phylogeny of Brachyura was reconstructed and the evolutionary status of Camptandriidae was revealed for the first time from the mitogenomic level. These results will not only enrich the mitogenomes of Ocypodoidea and mitogenomic rearrangements, but also lay a foundation for further evolutionary studies of Brachyura.
Specimens of C. dilatatum and Euplax sp. were collected from Jiangsu Province, China (34°47′48.80″N, 119°13′42.38″E) and Hainan Province, China (18°24′39.48″N, 109°58′20.60″E), respectively. Specimens were immediately preserved in 95% ethanol until DNA extraction. According to the key morphological features of crabs, these two specimens were identified with a stereo dissecting microscope (Naderloo, 2017a, 2017b). The SQ Tissue DNA Kit (OMEGA) was used to extract the total genomic DNA from muscle tissue following the manufacturer’s instructions. The genomic DNA was sent to Shanghai Origingene Biopharm Technology Co., Ltd. for library preparation and high-throughput sequencing. The libraries were constructed by using the VAHTS Universal Plus DNA Library Prep Kit, with an insert size of 150 bp. Paired-end sequencing with a read length of 150 bp was performed on an Illumina Hiseq 6000 platform. Adapters and low-quality bases were removed using cutadapt v1.16 (Martin, 2011) with the following parameters: q, 20; m, 20. Trimmed reads shorter than 50 bp were discarded. Quality control of raw and trimmed reads was performed using FastQC v0.11.5 (
The newly assembled mitogenomes of C. dilatatum and Euplax sp. were annotated using the software of Sequin (version 15.10,
The base composition and relative synonymous codon usage (RSCU) were obtained using MEGA X (Kumar et al., 2018). The strand asymmetry was calculated using the following formulas: AT-skew = (A − T)/(A + T); GC-skew = (G − C)/(G + C) (Perna and Kocher, 1995). Synteny analysis between the genomes was performed using Mauve v2.4.0 (Darling et al., 2004). To estimate the evolutionary-selection constraints on 13 PCGs, the nonsynonymous (dN) and synonymous (dS) substitution rates were calculated using Mega X. The genetic distances of 13 PCGs were also estimated using Mega X based on the Kimura 2-parameter (K2P) substitution model.
The phylogeny of Brachyura was inferred based on 107 available complete mitogenomes and two newly determined ones (Table S1). The species Pagurus nigrofascia and P. gracilipes from Anomura were used as outgroups. PhyloSuite (Zhang et al., 2020a) was used to extract the nucleotide sequences of 13 PCGs for each of the above species from the GenBank files. The MAFFT program (Katoh et al., 2002) integrated into PhyloSuite was executed to align multiple sequences in normal-alignment mode, and ambiguously aligned regions were identified and moved by Gblocks (Talavera and Castresana, 2007). The alignments of individual genes were then concatenated and used to generate input files (Phylip and Nexus formats) for phylogenetic analysis. The best-fit models were selected by ModelFinder (Kalyaanamoorthy et al., 2017) based on the Bayesian Information Criterion (BIC). Phylogenetic trees were built under maximum likelihood (ML) and Bayesian inference (BI) methods. The ML analysis was carried out in IQ-TREE (Nguyen et al., 2015) using an ML+rapid bootstrap (BS) algorithm with 1000 replicates. The BI analysis was performed in MrBayes 3.2.6 (Ronquist et al., 2012) with default parameters and 3×10⁶ Markov Chain Monte Carlo generations. The trees were sampled every 1000 generations with a burn-in of 25%. The average standard deviation of split frequencies below 0.01 was considered to reach convergence.
The complete mitogenomes of C. dilatatum and Euplax sp. are 15 444 bp and 16 129 bp in length, respectively (GenBank accessions MW191756 and MT176431; the order of the following data is the same as these) (Fig. 1; Tables 1 and 2). These two mitogenomes both contain a typical set of 37 genes (13 PCGs, 22 tRNAs, and two rRNAs) and a putative control region (CR). Nine PCGs and 14 tRNAs are encoded by the heavy (H-) strand, while the remaining genes are encoded by the light (L-) strand. There are 140 intergenic nucleotides dispersed in 13 locations in C. dilatatum mitogenome, and 537 intergenic nucleotides in 17 locations in Euplax sp. mitogenome; respectively. The longest one is 53 bp (between ND5 and ND4) and 169 bp (between ND4L and ND6) in these two mitogenomes (Tables 1 and 2). The base composition of C. dilatatum mitogenome is 34.4% A, 34.7% T, 11.4% C, 19.5% G, and that of Euplax sp. is 34.9% A, 34.0% T, 10.4% C, 20.7% G; the AT contents are 69.1% and 68.9%, suggesting a strong AT bias (Tables S2 and S3).
| Gene | Position | Length/bp | Amino acid | Start/Stop codon | Anticodon | Intergenic region | Strand | |
| From | To | |||||||
| COI | 1 bp | 1534 bp | 1534 | 511 | ATG/T | – | 0 | H |
| Leu (L2) | 1535 bp | 1599 bp | 65 | – | – | TAA | 6 | H |
| COII | 1606 bp | 2293 bp | 688 | 229 | ATG/T | 0 | H | |
| Lys (K) | 2294 bp | 2363 bp | 70 | – | – | TTT | 0 | H |
| Asp (D) | 2364 bp | 2424 bp | 61 | – | – | GTC | 1 | H |
| ATP8 | 2426 bp | 2584 bp | 159 | 52 | ATG/TAA | – | –4 | H |
| ATP6 | 2581 bp | 3252 bp | 672 | 223 | ATA/TAA | – | –1 | H |
| COIII | 3252 bp | 4041 bp | 790 | 263 | ATG/T | – | 0 | H |
| Gly (G) | 4042 bp | 4105 bp | 64 | – | – | TCC | –3 | H |
| ND3 | 4103 bp | 4456 bp | 354 | 117 | ATT/TAA | – | 4 | H |
| Ala (A) | 4461 bp | 4525 bp | 65 | – | – | TGC | 4 | H |
| Arg (R) | 4530 bp | 4593 bp | 64 | – | – | TCG | 0 | H |
| Asn (N) | 4594 bp | 4662 bp | 69 | – | – | GTT | 0 | H |
| Ser (S1) | 4663 bp | 4729 bp | 67 | – | – | TCT | 0 | H |
| Glu (E) | 4730 bp | 4795 bp | 66 | – | – | TTC | 2 | H |
| His (H) | 4798 bp | 4862 bp | 65 | – | – | GTG | 1 | L |
| Phe (F) | 4864 bp | 4928 bp | 65 | – | – | GAA | –1 | L |
| ND5 | 4928 bp | 6643 bp | 1716 | 571 | ATT/TAA | – | 53 | L |
| ND4 | 6697 bp | 8034 bp | 1338 | 445 | ATG/TAA | – | –7 | L |
| ND4L | 8028 bp | 8330 bp | 303 | 100 | ATG/TAA | – | 9 | L |
| Thr (T) | 8340 bp | 8405 bp | 66 | – | – | TGT | 0 | H |
| Pro (P) | 8406 bp | 8470 bp | 65 | – | – | TGG | 2 | L |
| ND6 | 8473 bp | 8976 bp | 504 | 167 | ATT/TAA | – | –1 | H |
| Cyt b | 8976 bp | 10 110 bp | 1135 | 378 | ATG/T | – | 0 | H |
| Ser (S2) | 10 111 bp | 10 177 bp | 67 | – | – | TGA | 15 | H |
| ND1 | 10 193 bp | 11 131 bp | 939 | 312 | ATA/TAA | – | 34 | L |
| Leu (L1) | 11 166 bp | 11 232 bp | 67 | – | – | TAG | 0 | L |
| 16S | 11 233 bp | 12 546 bp | 1314 | – | – | – | 0 | L |
| Val (V) | 12 547 bp | 12 619 bp | 73 | – | – | TAC | 0 | L |
| 12S | 12 620 bp | 13 435 bp | 816 | – | – | – | 0 | L |
| CR | 13 436 bp | 14 024 bp | 589 | – | – | – | 0 | H |
| Ile (I) | 14 025 bp | 14 090 bp | 66 | – | – | GAT | –3 | H |
| Gln (Q) | 14 088 bp | 14 156 bp | 69 | – | – | TTG | 8 | L |
| Met (M) | 14 165 bp | 14 234 bp | 70 | – | – | CAT | 0 | H |
| ND2 | 14 235 bp | 15 245 bp | 1011 | 336 | ATT/TAG | – | –2 | H |
| Trp (W) | 15 244 bp | 15 315 bp | 72 | – | – | TCA | 1 | H |
| Cys (C) | 15 317 bp | 15 380 bp | 64 | – | – | GCA | 0 | L |
| Tyr (Y) | 15 381 bp | 15 444 bp | 64 | – | – | GTA | –1 | L |
| Note: – represents no data. | ||||||||
 DownLoad:
CSV
DownLoad:
CSV
| Gene | Position | Length/bp | Amino acid | Start/Stop codon | Anticodon | Intergenic region | Strand | |
| From | To | |||||||
| COI | 1 bp | 1539 bp | 1539 | 512 | ATG/TAA | – | –5 | H |
| Leu (L2) | 1535 bp | 1600 bp | 66 | – | – | TAA | 8 | H |
| COII | 1609 bp | 2296 bp | 688 | 229 | ATG/T | – | 28 | H |
| ATP8 | 2325 bp | 2486 bp | 162 | 53 | ATT/TAA | – | –4 | H |
| ATP6 | 2 483 bp | 3154 bp | 672 | 223 | ATA/TAA | – | –1 | H |
| COIII | 3154 bp | 3943 bp | 790 | 263 | ATG/T | – | 0 | H |
| Gly (G) | 3 944 bp | 4006 bp | 63 | – | – | TCC | –3 | H |
| ND3 | 4004 bp | 4357 bp | 354 | 117 | ATA/TAA | – | 1 | H |
| Ala (A) | 4359 bp | 4422 bp | 64 | – | – | TGC | 1 | H |
| Arg (R) | 4424 bp | 4487 bp | 64 | – | – | TCG | 0 | H |
| Asn (N) | 4488 bp | 4554 bp | 67 | – | – | GTT | 0 | H |
| Ser (S1) | 4555 bp | 4621 bp | 67 | – | – | TCT | 6 | H |
| Thr (T) | 4 628 bp | 4689 bp | 62 | – | – | TGT | 16 | H |
| Pro (P) | 4 706 bp | 4770 bp | 65 | – | – | TGG | 10 | L |
| ND1 | 4781 bp | 5707 bp | 927 | 308 | ATA/TAG | – | 33 | L |
| Leu (L1) | 5741 bp | 5807 bp | 67 | – | – | TAG | 0 | L |
| 16S | 5808 bp | 7170 bp | 1363 | – | – | – | 0 | L |
| 12S | 7171 bp | 8048 bp | 878 | – | – | – | 0 | L |
| His (H) | 8 049 bp | 8113 bp | 65 | – | – | GTG | –1 | L |
| ND5 | 8113 bp | 9813 bp | 1701 | 566 | ATG/TAA | – | 125 | L |
| Val (V) | 9939 bp | 10 011 bp | 73 | – | – | TAG | 0 | L |
| CR | 10 012 bp | 10 806 bp | 795 | – | – | – | 0 | H |
| Gln (Q) | 10 807 bp | 10 875 bp | 69 | – | – | TTG | 7 | L |
| Cys (C) | 10 883 bp | 10 944 bp | 62 | – | – | GCA | 0 | L |
| Tyr (Y) | 10 945 bp | 11 010 bp | 66 | – | – | GTA | 37 | L |
| Lys (K) | 11 048 bp | 11 116 bp | 69 | – | – | TTT | 0 | H |
| Asp (D) | 11 117 bp | 11 182 bp | 66 | – | – | GTC | 4 | H |
| Glu (E) | 11 187 bp | 11 249 bp | 63 | – | – | TTC | –1 | H |
| Phe (F) | 11 249 bp | 11 314 bp | 66 | – | – | GAA | 7 | L |
| ND4 | 11 322 bp | 12 659 bp | 1338 | 445 | ATG/TAA | – | –7 | L |
| ND4L | 12 653 bp | 12 955 bp | 303 | 100 | ATG/TAA | – | 169 | L |
| ND6 | 13 125 bp | 13 649 bp | 525 | 174 | ATT/TAA | – | –20 | H |
| Cyt b | 13 630 bp | 14 764 bp | 1135 | 378 | ATG/T | – | 0 | H |
| Ser (S2) | 14 765 bp | 14 830 bp | 66 | – | – | TGA | 76 | H |
| Ile (I) | 14 907 bp | 14 971 bp | 65 | – | – | GAT | 2 | H |
| Met (M) | 14 974 bp | 15 042 bp | 69 | – | – | CAT | 0 | H |
| ND2 | 15 043 bp | 16 053 bp | 1011 | 336 | ATG/TAG | – | –2 | H |
| Trp (W) | 16 052 bp | 16 121 bp | 70 | – | – | TCA | 7 | H |
| Note: – represents no data. | ||||||||
DownLoad:
CSV
All the 13 PCGs initiate with typical ATN codons in the two mitogenomes. The majority of PCGs terminate with TAA or TAG, while four PCGs in C. dilatatum mitogenome (COI, COII, COIII, and Cyt b) and three PCGs in Euplax sp. mitogenome (COII, COIII, and Cyt b) use a single T as a stop codon (Tables 1 and 2). Incomplete stop codons are common in metazoan mitogenomes and may be recovered via post-transcriptional polyadenylation (Ojala et al., 1981). The GC-skew values of nine PCGs (COI, COII, ATP8, ATP6, COIII, ND3, ND6, Cyt b, and ND2) are negative, indicating they are encoded by the H-strand, whereas the remaining four exhibit positive values, indicating they are encoded by the L-strand (Tables S2 and S3). The most frequently used amino acids are Leu and Ser. In comparison, the least common amino acids are Cys and Arg (Figs 2a, b). The RSCU values of each codon in these two mitogenomes are roughly identical (Figs 2c, d; Table S4). It is worth noting that the RSCU values for the codons NNU and NNA are usually greater than one, suggesting a strong AT bias in the third codon position.

Twenty-two tRNAs are scattered throughout the entire mitogenome (Tables 1 and 2). All of them can be folded into typical cloverleaf secondary structures except for S1 in both two mitogenomes (Figs S1 and S2). The lack of DHU arm in S1 is thought to be a common phenomenon in metazoan mitogenomes (Gong et al., 2020; Lu et al., 2020; Ruan et al., 2020). The 16S rRNA and 12S rRNA genes of C. dilatatum mitogenome are located between L1 and V, V and CR, respectively. While Euplax sp. mitogenome shares different rRNA arrangements (L1- 16S- 12S- H).
To estimate the evolutionary-selection constraints on 13 PCGs in 19 mitogenomes, we perform dN/dS analysis for each PCG. It is commonly accepted that dN/dS>1, dN/dS=1, and dN/dS<1 generally indicate positive selection, neutral mutation, and purifying selection, respectively (Yang, 2006). All of the dN/dS ratios are lower than one (<1), indicating that all 13 PCGs are evolving under purifying selection. ATP8 gene exhibits a highly relaxed purifying selection with the highest dN/dS value (0.619), whereas COI gene exhibits the strongest purifying selection with the lowest dN/dS value (0.077) (Fig. 3). The lowest dN/dS value of COI gene indicates that this gene is bound by the protein-coding function and bears strong natural selection pressure, thus ensuring the normal function of its encoded protein, which means that COI gene has an important role in the survival and evolution of the above species. Besides, we conduct genetic distance analysis for 13 PCGs. COI gene possesses the least genetic distance (average 0.214), and ATP gene captures the largest value (average 0.409), representing the most conserved and variable genes, respectively (Fig. 3).

Genomic synteny analysis reveals that four large genomic homologous regions are prevalent in all 19 mitogenomes (marked A–D in Fig. 4). It is evident that the homologous regions B and C are rearranged in C. dilatatum mitogenome when choosing Eriocheir sinensis (Brachyura: Varunidae) mitogenome as the reference sequence (Fig. 4). The two homologous regions show a C-B order in C. dilatatum mitogenome, while that the remaining crabs display a B-C order (Fig. 4). Further analysis indicated that C. dilatatum mitogenome was consistent with the ancestral gene arrangement of Brachyura, while that of the remaining crabs shared exactly the same gene rearrangements.

Gene arrangements in C. dilatatum and Euplax sp. mitogenomes are shown in Fig. 5. For C. dilatatum mitogenome, only a single H moves from the downstream of ND5 to downstream of E (Fig. 5A①) when compared with the gene order in ancestral crustaceans (the pancrutacean ground pattern) mitogenomes (Boore, 1999). In contrast, gene order in Euplax sp. mitogenome underwent large-scale gene rearrangements. At least nine gene clusters (or genes) significantly differ from the typical order, involving 12 tRNA genes (K, D, E, F, H, T, P, L1, V, Q, C, and Y), two rRNAs (16S rRNA and 12S rRNA), one PCG (ND1), and a putative CR (Fig. 5B). Of these gene rearrangements, three tRNA gene pairs (K-D, E-F, and C-Y) and two single tRNA genes (V and Q) are moved into the ND5 and ND4 junction (Fig. 5B①②⑥⑧⑨), forming an eight-tRNA cluster (V-Q-C-Y-K-D-E-F) if CR is not considered. The CR is shifted from the typical area between 12S rRNA and I to the V and Q junction (Fig. 5B⑦). A single H gene, one tRNA gene pair (T-P), and the ND1- L1-16S-12S gene cluster are moved to the position between S1 and ND5 (Fig. 5B③④⑤).

Currently, four widely-accepted mechanisms have been used to account for mitogenomic rearrangements, including tandem duplication and random loss (TDRL) model (Moritz and Brown, 1987), intramitochondrial recombination model (Poulton et al., 1993), tandem duplication and non-random loss model (Lavrov et al., 2002), and double replications and random loss model (Shi et al., 2014). How did the gene orders in these two newly sequenced mitogenomes emerge? Here, we proposed that the TDRL mechanism resulted in the generation of these two mitogenomes. The hypothesized intermediate steps are as follows. Firstly, the F-ND5-H genes underwent a complete copy, forming a dimeric block, (F-ND5-H)-(F-ND5-H). Consecutive copies were then followed by a random loss of the duplicated genes, forming a novel H-F-ND5 gene order (Fig. 6B). The H-F-ND5 gene cluster is a common phenomenon in the mitogenome of ancestral and most living species of Brachyura (Lu et al., 2020; Zhang et al., 2020b), including Portunidae, Grapsidae, Ocypodidae, Leucosiidae, Eriphiidae, and the C. dilatatum mitogenome in this study. In the second rearrangement event, the gene block from K to Y underwent a complete copy, forming a dimeric block (K-D-ATP8-ATP6-COIII-G-ND3-A-R-N-S1-E-H-F-ND5-ND4-ND4L-T-P-ND6-Cyt b-S2-ND1-L1-16S-V-12S-CR-I-Q-M-ND2-W-C-Y)-(K-D-ATP8-ATP6-COIII-G-ND3-A-R-N-S1-E-H-F-ND5-ND4-ND4L-T-P-ND6-Cyt b-S2-ND1-L1-16S-V-12S-CR-I-Q-M-ND2-W-C-Y). Consecutive copies were then followed by a random loss of supernumerary genes, forming a new gene block, (K-D-ATP8-ATP6-COIII-G-ND3-A-R-N-S1-E-F-ND4-ND4L-T-P-ND6-Cyt b-S2-ND1-L1-16S-12S-I-M-ND2-W-H-ND5-V-CR-Q-C-Y). In the following step, the newly formed gene block from K to Y underwent a second copy and likewise experienced a random loss of redundant genes. Finally, the ultimate gene arrangement in Euplax sp. mitogenome was generated (Fig. 6C), which is consistent with the ancestral gene arrangement of Varunidae and Macrophthalmidae (Wang et al., 2020). Summarily, all the rearrangement events mentioned above can be explained by TDRL model, which supposes that the rearranged gene order occurs via tandem duplications followed by random deletion of certain duplications (Moritz et al., 1987).

The phylogenetic trees obtained using BI and ML methods resulted in identical topological structures except for supporting values. Here, only one topology (BI) with both support values was presented (Fig. 7). The results show that all Macrophalmidae species cluster together as a group, wherein Euplax sp. shows the closest relationship with Macrophthalmus darwinensi. Our phylogenetic trees firstly show the evolutionary status of Camptandriidae that it has the most closely related relationship with Macrophalmidae. These two families (Camptandriidae and Macrophalmidae) as a group then form a sister clade with Varunidae. Macrophalmidae and Varunidae sharing exactly the same mitogenomic rearrangements gather together in the phylogenetic tree, which is in consistence with most molecular results (Chen et al., 2018; Wang et al., 2020; Zhang et al., 2021a). Camptandriidae mitogenome, however, capturing the conserved gene arrangement (ancestral gene arrangement of Brachyura) forms a clade with the taxa that share the identically large-scale gene rearrangements. Similar phenomena have been reported in increasing number of crab mitogenomes (Tan et al., 2018; Li et al., 2020; Zhang et al., 2020c, 2021b). For instance, our recent work found that two closely related species belonging to the same genus (D. arrosor and D. aspersus) possessed two different gene rearrangements (Zhang et al., 2021b). More complex situations exist in Potamidae mitogenomes (Zhang et al., 2020c). Thus it echoes the viewpoint that the mitogenomic gene rearrangement is likely a continuous and dynamic process and may occur very recently even after speciation events (Zhang et al., 2021b). Of course, since here C. dilatatum is the only species of the family Camptandriidae, the phylogenetic status of Camptandriidae and the aforesaid thought-provoking hypothesis should be confirmed with more species.

Of the 30 families in our phylogenetic tree, except for Xanthidae, Gecarcinidae, and Homolidae, each family forms a monophyletic clade (Fig. 7). Regarding the non-monophyly of Xanthidae, four Xanthidae species are divided into two clades. Three of them cluster together as a clade, and the remaining one (Leptodius sanguineus) forms a sister clade with the single representative of the family Oziidae (Epixanthus frontalis), which calls attention to authoritative identification of these two species (L. sanguineus and E. frontalis). Of course, the increasing samples of Oziidae will also help to clarify the suspicious classification and relationships. For two Gecarcinidae species, one of them (Gecarcoidea natalis) forms a sister clade with Sesarmidae species, and then clusters with the remaining one (Cardisoma carnifex). As far as the non-monophyly of Homolidae, the single representative of Latreilliidae (Latreillia valida) forms a sister clade with a member of the family Homolidae (Moloha majora), which calls attention to authoritative identification of L. valida. Furthermore, it is worth noting that almost one-third of the families (11/30) include only one representative, so the non-monophyly of relevant families should be treated with caution.
Viewed from a higher taxonomic level, most superfamilies of Brachyura are found to be monophyletic, with the exception of Eriphioidea, Ocypodoidea, and Grapsoidea (Fig. 7). Although the polyphyly of the above three superfamilies is well supported in our phylogenetic tree, the interrelationships of these groups remain largely disputable. Regarding the interrelationships among Ocypodoidea and Grapsoidea, no consensus has been reached in current studies. For example, Sesarmidae (Grapsoidea) have a close relationship with Gecarcinidae (Grapsoidea), and Dotillidae (Ocypodoidea) form a sister clade with Grapsidae (Grapsoidea) in our phylogenetic tree. However, in Tan et al. (2018) , Sesarmidae (Grapsoidea) first clustered with Dotillidae (Ocypodoidea), and then formed a sister clade with Gecarcinidae (Grapsoidea). While in Wang et al. (2020) , Dotillidae (Ocypodoidea) and Xenograpsidae (Grapsoidea) formed a sister clade, and then clustered with Sesarmidae (Grapsoidea). These three families as a group then formed a clade with Gecarcinidae (Grapsoidea). Therefore, more sampling across a breadth of taxonomic groups and integration of additional molecular data need to be mined in order to substantially resolve the interrelationships of these groups.
In this study, two newly sequenced mitogenomes of Ocypodoidea, C. dilatatum and Euplax sp., were reported for the first time. TDRL model is proposed to be involved in the evolution of these two mitochondrial gene rearrangements. Comparative mitogenomic analyses of the species clustering in one branch in the tree display two types of gene arrangements. The dN/dS ratio analysis of all PCGs indicates that purifying selection plays a leading role in the evolution of mitochondrial PCGs. Phylogenetic analyses show that Camptandriidae and Macrophalmidae are the most closely related species, and the polyphyly of three superfamilies (Ocypodoidea, Eriphioidea, and Grapsoidea) is well supported. Nevertheless, large-scale taxonomic samplings are still needed to confirm the phylogenetic status of Camptandriidae and the non-monophyly of relative families due to limited representatives. Also, the authentic relationships within Brachyura will be better understood with the help of increasing samplings and data.
|
Chen Jing, Li Hongmei, Zhang Zenghui, et al. 2020. DOC dynamics and bacterial community succession during long-term degradation of Ulva prolifera and their implications for the legacy effect of green tides on refractory DOC pool in seawater. Water Research, 185: 116268. doi: 10.1016/j.watres.2020.116268
|
|
Deng Xue, Liu Tao, Liu Chunying, et al. 2018. Effects of Ulva prolifera blooms on the carbonate system in the coastal waters of Qingdao. Marine Ecology Progress Series, 605: 73–86. doi: 10.3354/meps12739
|
|
Ding Yuemin. 2014. Impacts of Ulva (Enteromorpha) prolifera in the green tide on the Yellow Sea ecological environment-implications from migration and transformation of biogenic elements (in Chinese)[dissertation]. Qingdao: Institute of Oceanology, Chinese Academy of Sciences
|
|
Feng Lina, Zhang Haibo, Sun Yuyan, et al. 2020. On nutrient releases from the decomposition of Ulva prolifera green tide and their impacts on nearshore seawaters in the southern Yellow Sea. Haiyang Xuebao (in Chinese), 42(8): 59–68
|
|
Franke A, Clemmesen C. 2011. Effect of ocean acidification on early life stages of Atlantic herring (Clupea harengus L.). Biogeosciences, 8(12): 3697–3707. doi: 10.5194/bg-8-3697-2011
|
|
Gao Guang, Gao Qi, Bao Menglin, et al. 2019. Nitrogen availability modulates the effects of ocean acidification on biomass yield and food quality of a marine crop Pyropia yezoensis. Food Chemistry, 271: 623–629. doi: 10.1016/j.foodchem.2018.07.090
|
|
Gao Guang, Zhao Xin, Jiang Meijia, et al. 2021. Impacts of marine heatwaves on algal structure and carbon sequestration in conjunction with ocean warming and acidification. Frontiers in Marine Science, 8: 758651. doi: 10.3389/fmars.2021.758651
|
|
Hao Binfei, Yang Hong, Ma Mingguo, et al. 2020. Variation in land use and land surface parameters in the three gorges reservoir catchment based on Google Earth Engine. Resources and Environment in the Yangtze Basin (in Chinese), 29(6): 1343–1355
|
|
Hu Yubin, Liu Chunying, Yang Guipeng, et al. 2015. The response of the carbonate system to a green algal bloom during the post-bloom period in the southern Yellow Sea. Continental Shelf Research, 94: 1–7. doi: 10.1016/j.csr.2014.12.006
|
|
Jiao Nianzhi, Cai Ruanhong, Zheng Qiang, et al. 2018. Unveiling the enigma of refractory carbon in the ocean. National Science Review, 5(4): 459–463. doi: 10.1093/nsr/nwy020
|
|
Kong Fanzhou, Jiang Peng, Wei Chuanjie, et al. 2018. Co-occurence of green tide, golden tide and red tides along the 35°N transect in the yellow sea during spring and summer in 2017. Oceanologia et Limnologia Sinica (in Chinese), 49(5): 1021–1030
|
|
Kwon H K, Kang H, Oh Y H, et al. 2017. Green tide development associated with submarine groundwater discharge in a coastal harbor, Jeju, Korea. Scientific Reports, 7(1): 6325. doi: 10.1038/s41598-017-06711-0
|
|
Li Dongxue, Gao Zhiqiang, Song Debin. 2021a. Analysis of environmental factors affecting the large-scale long-term sequence of green tide outbreaks in the Yellow Sea. Estuarine, Coastal and Shelf Science, 260: 107504,
|
|
Li Dongxue, Gao Zhiqiang, Xu Fuxiang. 2021b. Research on the dissipation of green tide and its influencing factors in the Yellow Sea based on Google Earth Engine. Marine Pollution Bulletin, 172: 112801. doi: 10.1016/j.marpolbul.2021.112801
|
|
Li Binghan, Liu Chunying, Deng Xue, et al. 2021c. Responses of the marine carbonate system to a green tide: a case study of an Ulva prolifera bloom in Qingdao coastal waters. Harmful Algae, 110: 102133. doi: 10.1016/j.hal.2021.102133
|
|
Liu Dongyan, Keesing J K, Xing Qianguo, et al. 2009. World’s largest macroalgal bloom caused by expansion of seaweed aquaculture in China. Marine Pollution Bulletin, 58(6): 888–895. doi: 10.1016/j.marpolbul.2009.01.013
|
|
Liu Xiangqing, Wang Zongling, Xin Ming, et al. 2016. Study on process of nutrient release during the decay of Ulva Prolifera. Marine Environmental Science (in Chinese), 35(6): 801–805, 813
|
|
Liu Chunxiang, Zou Dinghui, Liu Zhiwei, et al. 2020. Ocean warming alters the responses to eutrophication in a commercially farmed seaweed, Gracilariopsis lemaneiformis. Hydrobiologia, 847(3): 879–893. doi: 10.1007/s10750-019-04148-2
|
|
Lv Mengchen, Yuan Mengqi, Wang Ying, et al. 2021. Allelopathic effects of Ulva linza on marine phytoplankton and identification of the allelochemicals. Environmental Science and Pollution Research, 28(33): 45714–45723. doi: 10.1007/s11356-021-13734-8
|
|
Nguyen U N T, Pham L T H, Dang T D. 2020. Correction to: an automatic water detection approach using Landsat 8 OLI and Google Earth Engine cloud computing to map lakes and reservoirs in New Zealand. Environmental Monitoring and Assessment, 192(9): 616. doi: 10.1007/s10661-020-08581-y
|
|
Ogawa T, Ohki K, Kamiya M. 2015. High heterozygosity and phenotypic variation of zoids in apomictic Ulva prolifera (Ulvophyceae) from brackish environments. Aquatic Botany, 120: 185–192. doi: 10.1016/j.aquabot.2014.05.015
|
|
Schreyers L, van Emmerik T, Biermann L, et al. 2021. Spotting green tides over brittany from space: three decades of monitoring with landsat imagery. Remote Sensing, 13(8): 1408. doi: 10.3390/rs13081408
|
|
Sun Xiao, Wu Mengquan, Xing Qianguo, et al. 2018. Spatio-temporal patterns of Ulva prolifera blooms and the corresponding influence on chlorophyll-a concentration in the southern Yellow Sea, China. Science of the Total Environment, 640–641: 807–820,
|
|
Wang Bin, Wu Lei. 2021. Numerical study on the massive outbreak of the Ulva prolifera green tides in the southwestern Yellow Sea in 2021. Journal of Marine Science and Engineering, 9(11): 1167. doi: 10.3390/jmse9111167
|
|
Wang You, Yu Zhiming, Song Xiuxian, et al. 2007. Effects of macroalgae Ulva pertusa (Chlorophyta) and Gracilaria lemaneiformis (Rhodophyta) on growth of four species of bloom-forming dinoflagellates. Aquatic Botany, 86(2): 139–147. doi: 10.1016/j.aquabot.2006.09.013
|
|
Wang Chao, Yu Rencheng, Zhou Mingjiang. 2011. Acute toxicity of live and decomposing green alga Ulva (Enteromorpha) prolifera to abalone Haliotis discus hannai. Chinese Journal of Oceanology and Limnology, 29(3): 541–546. doi: 10.1007/s00343-011-0126-3
|
|
Wang Chao, Yu Rencheng, Zhou Mingjiang. 2012. Effects of the decomposing green macroalga Ulva (Enteromorpha) prolifera on the growth of four red-tide species. Harmful Algae, 16: 12–19. doi: 10.1016/j.hal.2011.12.007
|
|
Wu Mengquan, Guo Hao, Zhang Anding, et al. 2014. Research on the characteristics of Ulva Prolifera in Shandong Peninsula during 2008–2012 based on MODIS data. Spectroscopy and Spectral Analysis (in Chinese), 34(5): 1312–1318
|
|
Xing Qianguo, Hu Chuanmin, Tang Danling, et al. 2015. World’s largest macroalgal blooms altered phytoplankton biomass in summer in the Yellow Sea: satellite observations. Remote Sensing, 7(9): 12297–12313. doi: 10.3390/rs70912297
|
|
Xu Jianfang, Fan Xiao, Zhang Xiaowen, et al. 2012. Evidence of coexistence of C3 and C4 photosynthetic pathways in a green-tide-forming alga, Ulva prolifera. PLoS ONE, 7(5): e37438. doi: 10.1371/journal.pone.0037438
|
|
Yin Qi, Liu Maolin, Cheng Junyi, et al. 2019. Mapping paddy rice planting area in northeastern China using spatiotemporal data fusion and phenology-based method. Remote Sensing, 11(14): 1699. doi: 10.3390/rs11141699
|
|
Zhang Baowei, Guo Jianzhong, Li Ziwei, et al. 2022a. Identifying the spatio-temporal variations of Ulva prolifera disasters in all life cycle. Journal of Water and Climate Change, 13(2): 629–644. doi: 10.2166/wcc.2021.424
|
|
Zhang Yongyu, He Peimin, Li Hongmei, et al. 2019. Ulva prolifera green-tide outbreaks and their environmental impact in the Yellow Sea, China. National Science Review, 6(4): 825–838. doi: 10.1093/nsr/nwz026
|
|
Zhang Xiaoli, Song Yanjing, Liu Dongyan, et al. 2015. Macroalgal blooms favor heterotrophic diazotrophic bacteria in nitrogen-rich and phosphorus-limited coastal surface waters in the Yellow Sea. Estuarine, Coastal and Shelf Science, 163: 75–81,
|
|
Zhang Guangzong, Wu Mengquan, Sun Xiao, et al. 2018. The inter-annual drift and driven force of Ulva prolifera bloom in the southern Yellow Sea. Oceanologia et Limnologia Sinica (in Chinese), 49(5): 1084–1093
|
|
Zhang Guangzong, Wu Mengquan, Wei Juan, et al. 2021a. Adaptive threshold model in Google Earth Engine: a case study of Ulva prolifera extraction in the South Yellow Sea, China. Remote Sensing, 13(16): 3240. doi: 10.3390/rs13163240
|
|
Zhang Guangzong, Wu Mengquan, Zhang Anding, et al. 2020. Influence of sea surface temperature on outbreak of Ulva prolifera in the southern Yellow Sea, China. Chinese Geographical Science, 30(4): 631–642. doi: 10.1007/s11769-020-1129-9
|
|
Zhang Guangzong, Wu Mengquan, Zhou Min, et al. 2022b. The seasonal dissipation of Ulva prolifera and its effects on environmental factors: based on remote sensing images and field monitoring data. Geocarto International, 37(3): 860–878. doi: 10.1080/10106049.2020.1745301
|
|
Zhang Pengyan, Xin Yu, Zhong Xiaosong, et al. 2021b. Integrated effects of Ulva prolifera bloom and decay on nutrients inventory and cycling in marginal sea of China. Chemosphere, 264: 128389. doi: 10.1016/j.chemosphere.2020.128389
|
|
Zhang Hailong, Yuan Yibo, Xu Yongjiu, et al. 2021c. Remote sensing method for detecting green tide using HJ-CCD top-of-atmosphere reflectance. International Journal of Applied Earth Observation and Geoinformation, 102: 102371. doi: 10.1016/j.jag.2021.102371
|
|
Zhang Yongyu, Zhang Jihong, Liang Yantao, et al. 2017a. Carbon sequestration processes and mechanisms in coastal mariculture environments in China. Science China: Earth Sciences, 60(12): 2097–2107. doi: 10.1007/s11430-017-9148-7
|
|
Zhang Yao, Zhao Meixun, Cui Qiu, et al. 2017b. Processes of coastal ecosystem carbon sequestration and approaches for increasing carbon sink. Science China: Earth Sciences, 60(5): 809–820. doi: 10.1007/s11430-016-9010-9
|
|
Zhao Peng, Jiang Shu, Shi Jianbin. 2021. Blue carbon in the special report on the ocean and cryosphere in a Changing climate and its impacts. Marine Sciences (in Chinese), 45(2): 137–143
|
|
Zheng Xiaozhong, Ding Zhaokun, Xu Youqing, et al. 2009. Physiological roles of fatty acyl desaturases and elongases in marine fish: characterisation of cDNAs of fatty acyl Δ6 desaturase and elovl5 elongase of cobia (Rachycentron canadum). Aquaculture, 290(1–2): 122–131,
|
|
Zheng Longxiao, Wu Mengquan, Cui Yating, et al. 2022a. What causes the great green tide disaster in the South Yellow Sea of China in 2021?. Ecological Indicators, 140: 108988,
|
|
Zheng Longxiao, Wu Mengquan, Zhou Min, et al. 2022b. Spatiotemporal distribution and influencing factors of Ulva prolifera and Sargassum and their coexistence in the South Yellow Sea, China. Journal of Oceanology and Limnology, 40(3): 1070–1084. doi: 10.1007/s00343-021-1040-y
|
|
Zhou Min, Wu Mengquan, Zhao Lianjie, et al. 2022. Temporal and spatial distributions and influencing factors of HABs outbreaks around the north of Shandong Peninsula during 2000–2019: based on remote sensing images and field monitoring data. Geocarto International, 37(25): 8440–8455. doi: 10.1080/10106049.2021.2002425
|

Figures(5) / Tables(3)

Supported by:
Beijing Renhe Information Technology Co. Ltd

Ying Zhang, Liming Wei, Bingjian Liu, Liqin Liu, Zhenming Lü, Li Gong. Two complete mitogenomes of Ocypodoidea (Decapoda: Brachyura), Cleistostoma dilatatum (Camptandriidae) and Euplax sp. (Macrophthalmidae) and its phylogenetic implications[J]. Acta Oceanologica Sinica, 2023, 42(4): 81-92. doi: 10.1007/s13131-022-2054-9

| Gene | Position | Length/bp | Amino acid | Start/Stop codon | Anticodon | Intergenic region | Strand | |
| From | To | |||||||
| COI | 1 bp | 1534 bp | 1534 | 511 | ATG/T | – | 0 | H |
| Leu (L2) | 1535 bp | 1599 bp | 65 | – | – | TAA | 6 | H |
| COII | 1606 bp | 2293 bp | 688 | 229 | ATG/T | 0 | H | |
| Lys (K) | 2294 bp | 2363 bp | 70 | – | – | TTT | 0 | H |
| Asp (D) | 2364 bp | 2424 bp | 61 | – | – | GTC | 1 | H |
| ATP8 | 2426 bp | 2584 bp | 159 | 52 | ATG/TAA | – | –4 | H |
| ATP6 | 2581 bp | 3252 bp | 672 | 223 | ATA/TAA | – | –1 | H |
| COIII | 3252 bp | 4041 bp | 790 | 263 | ATG/T | – | 0 | H |
| Gly (G) | 4042 bp | 4105 bp | 64 | – | – | TCC | –3 | H |
| ND3 | 4103 bp | 4456 bp | 354 | 117 | ATT/TAA | – | 4 | H |
| Ala (A) | 4461 bp | 4525 bp | 65 | – | – | TGC | 4 | H |
| Arg (R) | 4530 bp | 4593 bp | 64 | – | – | TCG | 0 | H |
| Asn (N) | 4594 bp | 4662 bp | 69 | – | – | GTT | 0 | H |
| Ser (S1) | 4663 bp | 4729 bp | 67 | – | – | TCT | 0 | H |
| Glu (E) | 4730 bp | 4795 bp | 66 | – | – | TTC | 2 | H |
| His (H) | 4798 bp | 4862 bp | 65 | – | – | GTG | 1 | L |
| Phe (F) | 4864 bp | 4928 bp | 65 | – | – | GAA | –1 | L |
| ND5 | 4928 bp | 6643 bp | 1716 | 571 | ATT/TAA | – | 53 | L |
| ND4 | 6697 bp | 8034 bp | 1338 | 445 | ATG/TAA | – | –7 | L |
| ND4L | 8028 bp | 8330 bp | 303 | 100 | ATG/TAA | – | 9 | L |
| Thr (T) | 8340 bp | 8405 bp | 66 | – | – | TGT | 0 | H |
| Pro (P) | 8406 bp | 8470 bp | 65 | – | – | TGG | 2 | L |
| ND6 | 8473 bp | 8976 bp | 504 | 167 | ATT/TAA | – | –1 | H |
| Cyt b | 8976 bp | 10 110 bp | 1135 | 378 | ATG/T | – | 0 | H |
| Ser (S2) | 10 111 bp | 10 177 bp | 67 | – | – | TGA | 15 | H |
| ND1 | 10 193 bp | 11 131 bp | 939 | 312 | ATA/TAA | – | 34 | L |
| Leu (L1) | 11 166 bp | 11 232 bp | 67 | – | – | TAG | 0 | L |
| 16S | 11 233 bp | 12 546 bp | 1314 | – | – | – | 0 | L |
| Val (V) | 12 547 bp | 12 619 bp | 73 | – | – | TAC | 0 | L |
| 12S | 12 620 bp | 13 435 bp | 816 | – | – | – | 0 | L |
| CR | 13 436 bp | 14 024 bp | 589 | – | – | – | 0 | H |
| Ile (I) | 14 025 bp | 14 090 bp | 66 | – | – | GAT | –3 | H |
| Gln (Q) | 14 088 bp | 14 156 bp | 69 | – | – | TTG | 8 | L |
| Met (M) | 14 165 bp | 14 234 bp | 70 | – | – | CAT | 0 | H |
| ND2 | 14 235 bp | 15 245 bp | 1011 | 336 | ATT/TAG | – | –2 | H |
| Trp (W) | 15 244 bp | 15 315 bp | 72 | – | – | TCA | 1 | H |
| Cys (C) | 15 317 bp | 15 380 bp | 64 | – | – | GCA | 0 | L |
| Tyr (Y) | 15 381 bp | 15 444 bp | 64 | – | – | GTA | –1 | L |
| Note: – represents no data. | ||||||||
DownLoad:
CSV
| Gene | Position | Length/bp | Amino acid | Start/Stop codon | Anticodon | Intergenic region | Strand | |
| From | To | |||||||
| COI | 1 bp | 1539 bp | 1539 | 512 | ATG/TAA | – | –5 | H |
| Leu (L2) | 1535 bp | 1600 bp | 66 | – | – | TAA | 8 | H |
| COII | 1609 bp | 2296 bp | 688 | 229 | ATG/T | – | 28 | H |
| ATP8 | 2325 bp | 2486 bp | 162 | 53 | ATT/TAA | – | –4 | H |
| ATP6 | 2 483 bp | 3154 bp | 672 | 223 | ATA/TAA | – | –1 | H |
| COIII | 3154 bp | 3943 bp | 790 | 263 | ATG/T | – | 0 | H |
| Gly (G) | 3 944 bp | 4006 bp | 63 | – | – | TCC | –3 | H |
| ND3 | 4004 bp | 4357 bp | 354 | 117 | ATA/TAA | – | 1 | H |
| Ala (A) | 4359 bp | 4422 bp | 64 | – | – | TGC | 1 | H |
| Arg (R) | 4424 bp | 4487 bp | 64 | – | – | TCG | 0 | H |
| Asn (N) | 4488 bp | 4554 bp | 67 | – | – | GTT | 0 | H |
| Ser (S1) | 4555 bp | 4621 bp | 67 | – | – | TCT | 6 | H |
| Thr (T) | 4 628 bp | 4689 bp | 62 | – | – | TGT | 16 | H |
| Pro (P) | 4 706 bp | 4770 bp | 65 | – | – | TGG | 10 | L |
| ND1 | 4781 bp | 5707 bp | 927 | 308 | ATA/TAG | – | 33 | L |
| Leu (L1) | 5741 bp | 5807 bp | 67 | – | – | TAG | 0 | L |
| 16S | 5808 bp | 7170 bp | 1363 | – | – | – | 0 | L |
| 12S | 7171 bp | 8048 bp | 878 | – | – | – | 0 | L |
| His (H) | 8 049 bp | 8113 bp | 65 | – | – | GTG | –1 | L |
| ND5 | 8113 bp | 9813 bp | 1701 | 566 | ATG/TAA | – | 125 | L |
| Val (V) | 9939 bp | 10 011 bp | 73 | – | – | TAG | 0 | L |
| CR | 10 012 bp | 10 806 bp | 795 | – | – | – | 0 | H |
| Gln (Q) | 10 807 bp | 10 875 bp | 69 | – | – | TTG | 7 | L |
| Cys (C) | 10 883 bp | 10 944 bp | 62 | – | – | GCA | 0 | L |
| Tyr (Y) | 10 945 bp | 11 010 bp | 66 | – | – | GTA | 37 | L |
| Lys (K) | 11 048 bp | 11 116 bp | 69 | – | – | TTT | 0 | H |
| Asp (D) | 11 117 bp | 11 182 bp | 66 | – | – | GTC | 4 | H |
| Glu (E) | 11 187 bp | 11 249 bp | 63 | – | – | TTC | –1 | H |
| Phe (F) | 11 249 bp | 11 314 bp | 66 | – | – | GAA | 7 | L |
| ND4 | 11 322 bp | 12 659 bp | 1338 | 445 | ATG/TAA | – | –7 | L |
| ND4L | 12 653 bp | 12 955 bp | 303 | 100 | ATG/TAA | – | 169 | L |
| ND6 | 13 125 bp | 13 649 bp | 525 | 174 | ATT/TAA | – | –20 | H |
| Cyt b | 13 630 bp | 14 764 bp | 1135 | 378 | ATG/T | – | 0 | H |
| Ser (S2) | 14 765 bp | 14 830 bp | 66 | – | – | TGA | 76 | H |
| Ile (I) | 14 907 bp | 14 971 bp | 65 | – | – | GAT | 2 | H |
| Met (M) | 14 974 bp | 15 042 bp | 69 | – | – | CAT | 0 | H |
| ND2 | 15 043 bp | 16 053 bp | 1011 | 336 | ATG/TAG | – | –2 | H |
| Trp (W) | 16 052 bp | 16 121 bp | 70 | – | – | TCA | 7 | H |
| Note: – represents no data. | ||||||||
DownLoad:
CSV
| Gene | Position | Length/bp | Amino acid | Start/Stop codon | Anticodon | Intergenic region | Strand | |
| From | To | |||||||
| COI | 1 bp | 1534 bp | 1534 | 511 | ATG/T | – | 0 | H |
| Leu (L2) | 1535 bp | 1599 bp | 65 | – | – | TAA | 6 | H |
| COII | 1606 bp | 2293 bp | 688 | 229 | ATG/T | 0 | H | |
| Lys (K) | 2294 bp | 2363 bp | 70 | – | – | TTT | 0 | H |
| Asp (D) | 2364 bp | 2424 bp | 61 | – | – | GTC | 1 | H |
| ATP8 | 2426 bp | 2584 bp | 159 | 52 | ATG/TAA | – | –4 | H |
| ATP6 | 2581 bp | 3252 bp | 672 | 223 | ATA/TAA | – | –1 | H |
| COIII | 3252 bp | 4041 bp | 790 | 263 | ATG/T | – | 0 | H |
| Gly (G) | 4042 bp | 4105 bp | 64 | – | – | TCC | –3 | H |
| ND3 | 4103 bp | 4456 bp | 354 | 117 | ATT/TAA | – | 4 | H |
| Ala (A) | 4461 bp | 4525 bp | 65 | – | – | TGC | 4 | H |
| Arg (R) | 4530 bp | 4593 bp | 64 | – | – | TCG | 0 | H |
| Asn (N) | 4594 bp | 4662 bp | 69 | – | – | GTT | 0 | H |
| Ser (S1) | 4663 bp | 4729 bp | 67 | – | – | TCT | 0 | H |
| Glu (E) | 4730 bp | 4795 bp | 66 | – | – | TTC | 2 | H |
| His (H) | 4798 bp | 4862 bp | 65 | – | – | GTG | 1 | L |
| Phe (F) | 4864 bp | 4928 bp | 65 | – | – | GAA | –1 | L |
| ND5 | 4928 bp | 6643 bp | 1716 | 571 | ATT/TAA | – | 53 | L |
| ND4 | 6697 bp | 8034 bp | 1338 | 445 | ATG/TAA | – | –7 | L |
| ND4L | 8028 bp | 8330 bp | 303 | 100 | ATG/TAA | – | 9 | L |
| Thr (T) | 8340 bp | 8405 bp | 66 | – | – | TGT | 0 | H |
| Pro (P) | 8406 bp | 8470 bp | 65 | – | – | TGG | 2 | L |
| ND6 | 8473 bp | 8976 bp | 504 | 167 | ATT/TAA | – | –1 | H |
| Cyt b | 8976 bp | 10 110 bp | 1135 | 378 | ATG/T | – | 0 | H |
| Ser (S2) | 10 111 bp | 10 177 bp | 67 | – | – | TGA | 15 | H |
| ND1 | 10 193 bp | 11 131 bp | 939 | 312 | ATA/TAA | – | 34 | L |
| Leu (L1) | 11 166 bp | 11 232 bp | 67 | – | – | TAG | 0 | L |
| 16S | 11 233 bp | 12 546 bp | 1314 | – | – | – | 0 | L |
| Val (V) | 12 547 bp | 12 619 bp | 73 | – | – | TAC | 0 | L |
| 12S | 12 620 bp | 13 435 bp | 816 | – | – | – | 0 | L |
| CR | 13 436 bp | 14 024 bp | 589 | – | – | – | 0 | H |
| Ile (I) | 14 025 bp | 14 090 bp | 66 | – | – | GAT | –3 | H |
| Gln (Q) | 14 088 bp | 14 156 bp | 69 | – | – | TTG | 8 | L |
| Met (M) | 14 165 bp | 14 234 bp | 70 | – | – | CAT | 0 | H |
| ND2 | 14 235 bp | 15 245 bp | 1011 | 336 | ATT/TAG | – | –2 | H |
| Trp (W) | 15 244 bp | 15 315 bp | 72 | – | – | TCA | 1 | H |
| Cys (C) | 15 317 bp | 15 380 bp | 64 | – | – | GCA | 0 | L |
| Tyr (Y) | 15 381 bp | 15 444 bp | 64 | – | – | GTA | –1 | L |
| Note: – represents no data. | ||||||||
| Gene | Position | Length/bp | Amino acid | Start/Stop codon | Anticodon | Intergenic region | Strand | |
| From | To | |||||||
| COI | 1 bp | 1539 bp | 1539 | 512 | ATG/TAA | – | –5 | H |
| Leu (L2) | 1535 bp | 1600 bp | 66 | – | – | TAA | 8 | H |
| COII | 1609 bp | 2296 bp | 688 | 229 | ATG/T | – | 28 | H |
| ATP8 | 2325 bp | 2486 bp | 162 | 53 | ATT/TAA | – | –4 | H |
| ATP6 | 2 483 bp | 3154 bp | 672 | 223 | ATA/TAA | – | –1 | H |
| COIII | 3154 bp | 3943 bp | 790 | 263 | ATG/T | – | 0 | H |
| Gly (G) | 3 944 bp | 4006 bp | 63 | – | – | TCC | –3 | H |
| ND3 | 4004 bp | 4357 bp | 354 | 117 | ATA/TAA | – | 1 | H |
| Ala (A) | 4359 bp | 4422 bp | 64 | – | – | TGC | 1 | H |
| Arg (R) | 4424 bp | 4487 bp | 64 | – | – | TCG | 0 | H |
| Asn (N) | 4488 bp | 4554 bp | 67 | – | – | GTT | 0 | H |
| Ser (S1) | 4555 bp | 4621 bp | 67 | – | – | TCT | 6 | H |
| Thr (T) | 4 628 bp | 4689 bp | 62 | – | – | TGT | 16 | H |
| Pro (P) | 4 706 bp | 4770 bp | 65 | – | – | TGG | 10 | L |
| ND1 | 4781 bp | 5707 bp | 927 | 308 | ATA/TAG | – | 33 | L |
| Leu (L1) | 5741 bp | 5807 bp | 67 | – | – | TAG | 0 | L |
| 16S | 5808 bp | 7170 bp | 1363 | – | – | – | 0 | L |
| 12S | 7171 bp | 8048 bp | 878 | – | – | – | 0 | L |
| His (H) | 8 049 bp | 8113 bp | 65 | – | – | GTG | –1 | L |
| ND5 | 8113 bp | 9813 bp | 1701 | 566 | ATG/TAA | – | 125 | L |
| Val (V) | 9939 bp | 10 011 bp | 73 | – | – | TAG | 0 | L |
| CR | 10 012 bp | 10 806 bp | 795 | – | – | – | 0 | H |
| Gln (Q) | 10 807 bp | 10 875 bp | 69 | – | – | TTG | 7 | L |
| Cys (C) | 10 883 bp | 10 944 bp | 62 | – | – | GCA | 0 | L |
| Tyr (Y) | 10 945 bp | 11 010 bp | 66 | – | – | GTA | 37 | L |
| Lys (K) | 11 048 bp | 11 116 bp | 69 | – | – | TTT | 0 | H |
| Asp (D) | 11 117 bp | 11 182 bp | 66 | – | – | GTC | 4 | H |
| Glu (E) | 11 187 bp | 11 249 bp | 63 | – | – | TTC | –1 | H |
| Phe (F) | 11 249 bp | 11 314 bp | 66 | – | – | GAA | 7 | L |
| ND4 | 11 322 bp | 12 659 bp | 1338 | 445 | ATG/TAA | – | –7 | L |
| ND4L | 12 653 bp | 12 955 bp | 303 | 100 | ATG/TAA | – | 169 | L |
| ND6 | 13 125 bp | 13 649 bp | 525 | 174 | ATT/TAA | – | –20 | H |
| Cyt b | 13 630 bp | 14 764 bp | 1135 | 378 | ATG/T | – | 0 | H |
| Ser (S2) | 14 765 bp | 14 830 bp | 66 | – | – | TGA | 76 | H |
| Ile (I) | 14 907 bp | 14 971 bp | 65 | – | – | GAT | 2 | H |
| Met (M) | 14 974 bp | 15 042 bp | 69 | – | – | CAT | 0 | H |
| ND2 | 15 043 bp | 16 053 bp | 1011 | 336 | ATG/TAG | – | –2 | H |
| Trp (W) | 16 052 bp | 16 121 bp | 70 | – | – | TCA | 7 | H |
| Note: – represents no data. | ||||||||
 DownLoad:


 DownLoad:


