
Figure
1.
Destruction of artificial landfill project at Nanhua reef in the South China Sea under the typhoon “Moli”. Satellite imageries are sourced from Google EarthTM.
| Citation: | Yu Yao, Baobao Zhou, Zhongwei Zhao, Xianjin Chen, Long Chen. An investigation of the morphodynamic change of reef islands under monochromatic waves[J]. Acta Oceanologica Sinica, 2023, 42(7): 41-50. doi: 10.1007/s13131-023-2156-z

|
Coral reef islands (also known as “motu” in Polynesian language) are defined as sandy or gravel islands located on the reef platforms (Masselink et al., 2020), which are built by unconsolidated reef-derived carbonate sediments. Such features as characterized with low elevation, small area, sensitivity to the surroundings, and high population density have made them attract global concern about their future stability and existence, especially for those mid-ocean atoll nations (Kench et al., 2015; Nicholls and Cazenave, 2010; Nurse et al., 2014). The persistence and habitability of reef islands are commonly considered to be impacted by the global climate change, profoundly the long-term sea level rise (SLR) (Dickinson, 2009; Storlazzi et al., 2015, 2018) and short-term tropical cyclones (Etienne and Terry, 2012; Kench et al., 2006, Sengupta et al., 2021a, b). Projection of ongoing SLR (Kopp et al., 2014; Deconto and Pollard, 2016) and increased storm magnitude (Shope et al., 2016) are expected to increase both the magnitude and frequency of coastal flooding (Quataert et al., 2015; Storlazzi et al., 2018) and wave erosion that destabilizing reef islands (Grady et al., 2013). Figure 1 shows an artificial landfill project at Nanhua reef in the South China Sea was destroyed by typhoon “Moli” in late December 2015. However, recent studies have shown that reef islands are capable to self-adjust its morphology in response to the changing sea level and wave condition (Costa et al., 2019; Masselink et al., 2020; Tuck et al., 2019b). Hence, most reef islands are likely to be stable or even enlarged when facing such extreme conditions, indicating that those islands can persist on the reef platforms in the future (McLean and Kench, 2015; Kench et al., 2015, 2018; Duvat, 2019). Therefore, a better understanding of the physical processes controlling the morphological response of reef islands to SLR and storms will be essential for government agencies of atoll nations to plan adaptation and risk reduction strategies.
Previous studies tackling morphodynamic change of reef islands mostly focused on field investigations (Etienne and Terry, 2012; Kench et al., 2006, 2015; Kayanne et al., 2016; Talavera et al., 2021), leaving laboratory study on the responses of reef island morphological change to SLR and/or wave conditions rare in the field. To the best of the authors’ knowledge, Tuck et al. (2019b) remains the pioneering study to perform a series of physical laboratory experiments in a wave flume. Their physical model was built with quartz sand (median grainsize 0.35 mm) and its original morphology was constructed according to a transact surveyed at Fatato Island, Funafuti Atoll (South Pacific). They measured the island’s morphodynamic responses to changing incident significant wave height and SLR, revealing reef islands move lagoonward on reef platforms in such conditions. Their results suggested the overwash process potentially serves as the mechanism to build and keep the island freeboard above the sea level. Their physical model was later further extended, using the entire Fatato Island as the prototype and via wave-basin experiments in Tuck et al. (2019a). They found that lagoonward island recession, vertical seaward crest accretion and spit rotation are the key forms of morphological responses of the island to the changing sea level and incident wave height. They also highlighted the magnitude and rate of such morphodynamic adjustment is closely related to the increasing sea level and wave height. More recently, Tuck et al. (2021) improved the experimental design of Tuck et al., (2019b) by gradually adding a small fraction of sediment volume to the island’s shoreline, investigating the impact of storm-driven sediment supply on the island’s morphological response. Their observations show that the sediment supply notably promotes the increase of island elevation but dampens both the island migration and the subaerial volume reduction in response to SLR. All the laboratory studies emphasize the consideration of morphodynamic processes of reef islands is urgently needed into the flood assessment models so as to provide accurate estimation of future flood risks.
Numerical models provide us alternative ways to interpret wave, current and sediment processes in reef environments. Reef hydrodynamic simulations in laboratory-scale studies have been mostly addressed with Boussinesq models such as FUNWAVE (Ning et al., 2019; Su et al., 2015; Su and Ma, 2018) and COULWAVE (Yao et al., 2012, 2016), as well as non-hydrostatic models such as NHWAVE (Ma et al., 2014; Shi et al., 2018) and SWASH (Buckley et al., 2014; Liu et al., 2021). More sophisticated models based on the Navier-Stokes equations, although less computationally efficient, have also been applied when examining wave-reef interaction problems (Franklin et al., 2013; Li et al., 2019; Yao et al., 2020, 2022). However, the morphodynamic processes have not been considered in all above models.
The open-source horizontally two-dimensional (2DH) numerical model XBeach includes both a phased-averaged surfbeat method (XB-SB; Buckley et al., 2014; Quataert et al., 2015; Van Dongeren et al., 2013) and a phase-resolving nonhydrostatic approach (XB-NH; Pearson et al., 2017; Quataert et al., 2020), have been most frequently used in previous studies to simulate the wave processes over both field and laboratory reefs. Aside from wave and current modeling, XBeach has additional modules to simulate sediment transport and bed morphological change, and it has been successfully used to study various coastal problems such as sediment transport in beach environments (Elsayed and Oumeraci, 2017; McCall et al., 2015), wave-driven erosion of sand dunes (Berard et al., 2017; De Winter et al., 2015) and morphodynamic response of barrier islands to hurricanes (Harter and Figlus, 2017; Lindemer et al., 2010). As for the issues investigated in this study, only Masselink et al. (2020) conducted numerical simulations using the horizontally one-dimensional (1DH) form of an improved XB-NH model to reproduce the wave-flume experiments of Tuck et al. (2019b). Their simulations show that reef islands comprised of gravels are morphodynamically resilient landforms, they evolve with SLR via accreting to positive freeboard while retreating lagoonward. Such island adjustment is caused by the wave overtopping process that transfer sediments from the seaward beach face to the island top, which is consistent with the laboratory observation. Subsequently, Masselink et al. (2021) used the same model to explore the role of future reef growth in morphological response of reef islands to SLR. Their results show that although reef growth significantly reduces the wave energy at the island shoreline due to wave breaking across the platform, it does not increase the ability of islands to adjust to SLR. For the same incident wave forcing, gravel islands build up higher than sand islands due to their steeper beach face gradient leading to higher runup. In general, these studies have shown the necessity to include a morphodynamic model in assessing the climate-related impacts on the reef islands.
In the present study, we report a new series of laboratory wave-flume experiments focusing on the morphodynamic change of coral reef islands to varying ocean forcing conditions (including SLR). Our experimental design differs from that of Tuck et al. (2019b) in the following aspects: (1) carbonate sand instead of quartz sand is used to build the physical island model to avoid the scaling effect for the sediment density; (2) monochromatic waves rather than spectral waves are used for which the reported overtopping and overwash processes are easier to be identified; (3) the profile of reef island is idealized as trapezoid compared to the realistic double-ridged profile of Fatato Island. In this way, the results obtained in this study can be more generalized and accommodated for various reef islands. Meanwhile, we also adopt the 1DH form of XB-NH model to numerically investigate the responses of reef island morphological change to a series of island morphological features (island width, island height, island location, and island side slope) that are not fully covered by existing laboratory (Tuck et al., 2019b, 2021) and numerical studies (Masselink et al., 2020, 2021).
The rest of this paper is arranged as follows: Laboratory setup is introduced in Section 2. The governing equations and the setup of the numerical model are described in Section 3. The analyses of experimental measurements are reported in Section 4. Numerical model validation and application for which experimental data are not available are given by Section 5. Main conclusions drawn in the present study are listed in Section 6.
Laboratory experiments are implemented in a wave flume (40 m long, 0.5 m wide and 0.8 m high) in the Hydraulic Modeling Laboratory, Changsha University of Science and Technology. The flume is installed with a piston-type wave-maker to produce the target waves at its one end and there is a slope built with porous materials to absorb wave reflection at its other end. The sizes of both reef platform and reef island physical models are designed with a 1:50 geometrical scale according to the Froude law of similarity based on the surveyed profile of Fatato Island as reported by Tuck et al. (2019b). As shown in Fig. 2a, a horizontal reef platform (8 m in cross-shore width, 0.3 m above the flume bed) is constructed followed by a 1:6 fore-reef/back-reef slope at the seaside/leeside edge. Behind the platform, there is a lagoon. The fore-reef slope toe is set at 20.5 m downstream of the wave-maker. The whole reef model is constructed by polyvinyl chloride (PVC) plates with their widths matching the flume width. As aforementioned, a sandy reef island consists of carbonate sand is installed on the central platform with its seaside beach toe located D = 2 m from the reef edge. The island profile is idealized as a trapezoid-shape profile (W = 1 m for its top width, hi = 0.05 m for its height, and s = 1:6 for its seaside and leeside beach slopes) rather than the realistic double-ridged profile observed at Fatato Island. The median diameter/grainsize of the coral sand is 0.4 mm, which is comparable to 0.35 mm of quartz sand used by Tuck et al. (2019b). By assuming spherical particles, the corresponding settling velocity (calculated by the formulations proposed by Riazi et al. (2020) for carbonate sediments) is 0.050 m/s for our coral sand with a density of 2 750 kg/m3 while it is 0.078 m/s (calculated by the formulations proposed by Cheng (1997) for quartz grains) for their quartz sand with a density of 2 650 kg/m3. The effect of reef surface roughness is not considered at this stage because it is difficult to idealize the full complexity of reef roughness in the laboratory environment.

Similar to the previous laboratory experiments (Tuck et al., 2019a, b), the experiments in this study are designed to examine the morphodynamic responses of reef island to both incident wave height and SLR, which are supposed to be the direct impacts of global climate change. Therefore, a scenario with the monochromatic wave height of H0 = 0.1 m, monochromatic wave period of T = 1.5 s and the island freeboard (positive/negative value denotes the emerged/submerged condition) of F = 0 m (i.e., the reef-flat still water level hr = 0.05 m) is selected as the benchmark test. Based on the 1:50 model scale, the prototype wave height and island freeboard are H0 = 5 m and F = 0 m, respectively. Meanwhile, three additional incident monochromatic wave heights (H0 = 0.06 m, 0.08 m, 0.12 m) and four freeboards (F = 0.05 m, 0.025 m, −0.025 m, −0.05 m) are tested, corresponding to the prototype wave heights of 3.0 m, 4.0 m and 6.0 m and island freeboards of 2.5 m, 1.25 m, −1.25 m and −2.5 m. During each test, we only change H0 or F while keeping the other one the same as that in the benchmark test. Thus totally, 8 scenarios are examined experimentally in this study. By considering the requirement that our laboratory results can be more generalized, our tested ranges of both H0 and F are designed to be notably larger than those tested by Tuck et al. (2019b), which are only 3 m and 4 m for H0 as well as 0.5 m and 1.0 m for
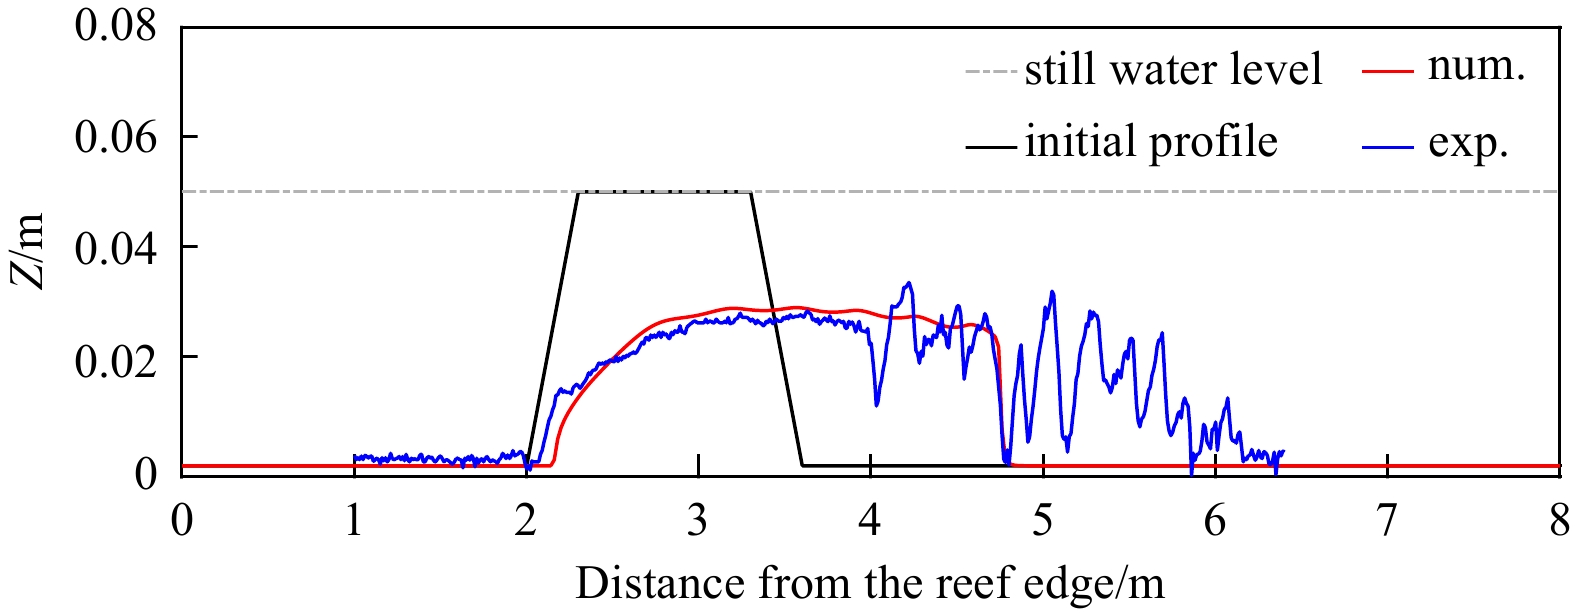
Three capacitance-type wave gauges (G1−G3 in Fig. 2a, Bo Ming, Ltd., Tianjin, China) are located seaward of the fore-reef slope to monitor the incident waves with a sampling frequency of 50 Hz. The reef island morphology is measured along the cross-shore central island profile by a laser beam profiler (Fig. 2d, Type LRI-Ⅲ, Wuhan Tianjun Yuanda, Ltd., China). Surveys are conducted following the start of wave-maker at 1-hour interval during each test until the island reaches a morphodynamic quasi-equilibrium profile defined by less than 5% difference in the lagoonward island recession between successive surveys. A video camera (HDR-PJ675, SONY, Ltd., Tokyo, Japan) is installed on one side of the flume to record wave process around the reef island with a sampling frequency of 25 frame per second (fps). Taking the benchmark test as an example, Fig. 3a shows that the wavemaker is generally required to run for at least 6 h to achieve an equilibrium island profile. Each run is also repeated for three times, and the experimental repeatability is satisfactory in view of the whole island profile except for the rear part where a series of random sand ripples can be observed (Fig. 3b).

In the present study, we use the XBeach non-hydrostatic phase-resolving model (XB-NH) that can resolve various wave motions, thus it is particularly suitable for laboratory scale problem. XB-NH calculates the depth-averaged flow associated with waves and currents based on the non-linear shallow water equations. It also adds a correction into the non-hydrostatic pressure in a similar way to the SWASH model (Zijlema et al., 2011). In this study, we adopt its 1DH equations as follows, although its 2DH form is also possible,
| $$ \frac{{\partial \eta }}{{\partial t}} + \frac{{\partial uh}}{{\partial x}} = 0, $$ | (1) |
| $$ \frac{{\partial u}}{{\partial t}} + u\frac{{\partial u}}{{\partial x}} - \,{\nu _{\rm{h}}}\frac{{{\partial ^2}u}}{{\partial {x^2}}} = - \frac{1}{\rho }\frac{{\partial \left( {\;\bar q + \rho g\eta } \right)}}{{\partial x}} - {c_{\rm{f}}}\frac{{u\left| u \right|}}{h} , $$ | (2) |
where x and t denote the horizontal spatial and temporal coordinates, respectively,
| $$ {c_{\rm{f}}} = \frac{{g{n^2}}}{{{h^{1/3}}}}. $$ | (3) |
XB-NH includes the depth-limited wave breaking using a shock capturing scheme based on the momentum conservation. However, as a depth-integrated model, it cannot explicitly computes the overturning of plunging breakers. To determine both the magnitude and the location of wave breaking, a hydrostatic front approximation is employed where the pressure distribution undernearth the breaking waves is assumed to be hydrostatic (Smit et al., 2010). There is an interval between a maximum steepness value (by default = 0.40) and a secondary steepness value (by default it is half of the specified maximum value) for the local surface steepness where the nonhydrostatic pressure correction is switched off, see Smit et al. (2013) for details.
Different sediment transport equations are adopted in the latest version of XBeach to compute bed, suspended and total sediment loads. The sediment transport process is simulated using the depth-averaged advection-diffusion equation of Galappatti and Vreugdenhil (1985).
| $$ \frac{{\partial hC}}{{\partial t}} + \frac{{\partial hC{u^E}}}{{\partial x}} + \frac{\partial }{{\partial x}}\left[ {{D_{\rm{h}}}h\frac{{\partial C}}{{\partial x}}} \right] = \frac{{h{C_{{\rm{eq}}}} - hC}}{{{T_{\rm{s}}}}}, $$ | (4) |
where C is the depth-averaged sediment concentration varying on the time scale of wave group, Ceq is the equilibrium sediment concentration,
| $$ {T_{\rm{s}}} = \max \left( {{f_{{T_{\rm{s}}}}} \cdot \frac{h}{{{w_{\rm{s}}}}},{T_{{\rm{s}},\min }}} \right), $$ | (5) |
where
| $$ {w_{\rm{s}}} = {\alpha _1}\sqrt {\varDelta g{D_{50}}} + {\alpha _2}\frac{{\varDelta gD_{50}^2}}{\nu }, $$ | (6) |
| $$ {\alpha _1} = 1.06\tanh (0.016{A^{0.50}}\exp ( - 120/A)), $$ | (7) |
| $$ {\alpha _2} = 0.055\tanh (12{A^{ - 0.59}}\exp ( - 0.000\;4A)) , $$ | (8) |
| $$ A = \varDelta gD_{50}^3/{\nu ^2} , $$ | (9) |
A is the Archimedes buoyancy index,
| $$ {C_{{\rm{eq}}}} = \max \left( {\min \left( {{C_{{\rm{eq,b}}}},\frac{1}{2}{C_{\max }}} \right) + \min \left( {{C_{{\rm{eq,s}}}},\frac{1}{2}{C_{\max }}} \right),0} \right), $$ | (10) |
where
The finite difference method with the first-order upwind scheme is adopted to resolve the depth-averaged sediment concentration, C, and then the cross-shore sediment transport rate,
| $$ {q_x} = hC{u^E} + {D_{\rm{h}}}h\frac{{\partial C}}{{\partial x}}. $$ | (11) |
In terms of the gradient in the sediment transport, the bed level is updated according to
| $$ \frac{{\partial {z_{\rm{b}}}}}{{\partial t}} + \frac{{{f_{{\rm{mor}}}}}}{{\left( {1 - p} \right)}}\frac{{\partial {q_x}}}{{\partial x}} = 0, $$ | (12) |
where
Referring to Fig. 2, the numerical computational domain is established to reproduce the full setup of the experimental domain. On the offshore (left) boundary, incident wave and inflow conditions are imposed. Meanwhile, a weakly reflective-type boundary condition is set on both ends of the domain to ensure the absorption of wave reflection. The time step during the computation is estimated according to a Courant number
There is a group of model parameters related to both hydrodynamic and morphodynamic modules of XBeach. We try our best to keep those parameters as default values, thus only several parameters are calibrated to achieve a best match between the numerical simulations and laboratory experiments. The calibrated model parameters are obtained with Manning frictional coefficient n = 0.075 (its default value is 0.01), maximum wave steepness criterium

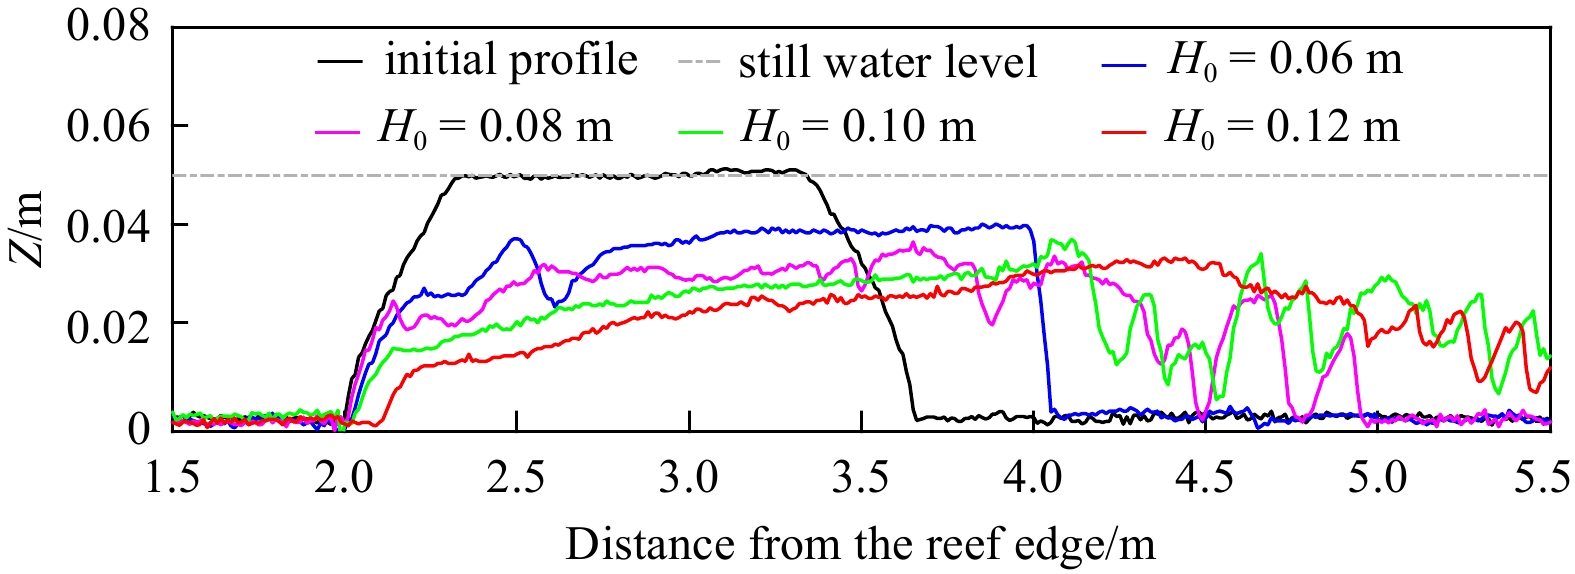
We firstly examine measured equilibrium reef island profiles with varying incident wave height (Fig. 5). At smaller wave height when

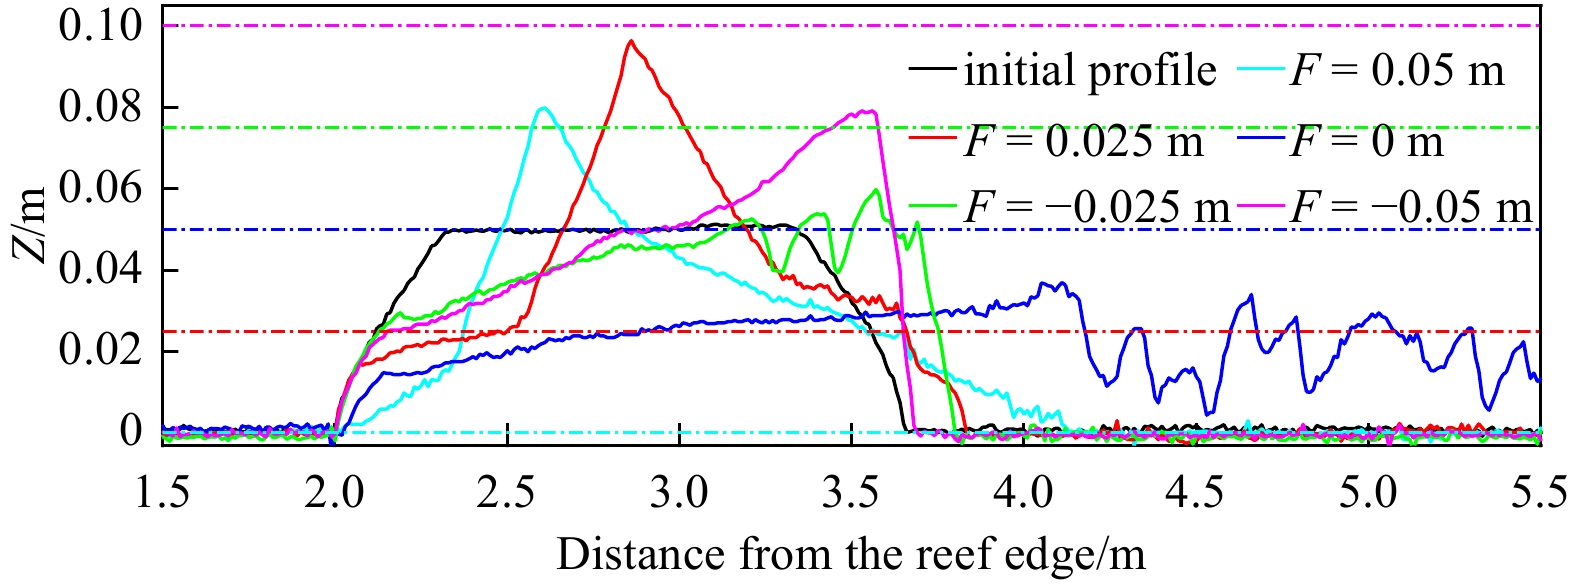
As for the effect of reef island freeboard due to SLR, Fig. 6 shows that the sediments near the island’s seaside beach are transported to the emergent island top by wave overtopping with larger freeboards ( F = 0.05 m and F = 0.025 m). This leads to a crest accretion located at the central island, which is consistent with the laboratory observation of Tuck et al. (2019b), although their initial island has an double-ridged profile. Significant island-crest lowering, thus island destruction, across the reef platform occurs under the zero emergence (F = 0 m), this may be the case for Nanhua reef under typhoon “Moli” as shown in Fig. 1. After that, as the island becomes more submerged, the island crest forms at the island’s leeside beach. The crest moves further seaward but its elevation increases significantly as

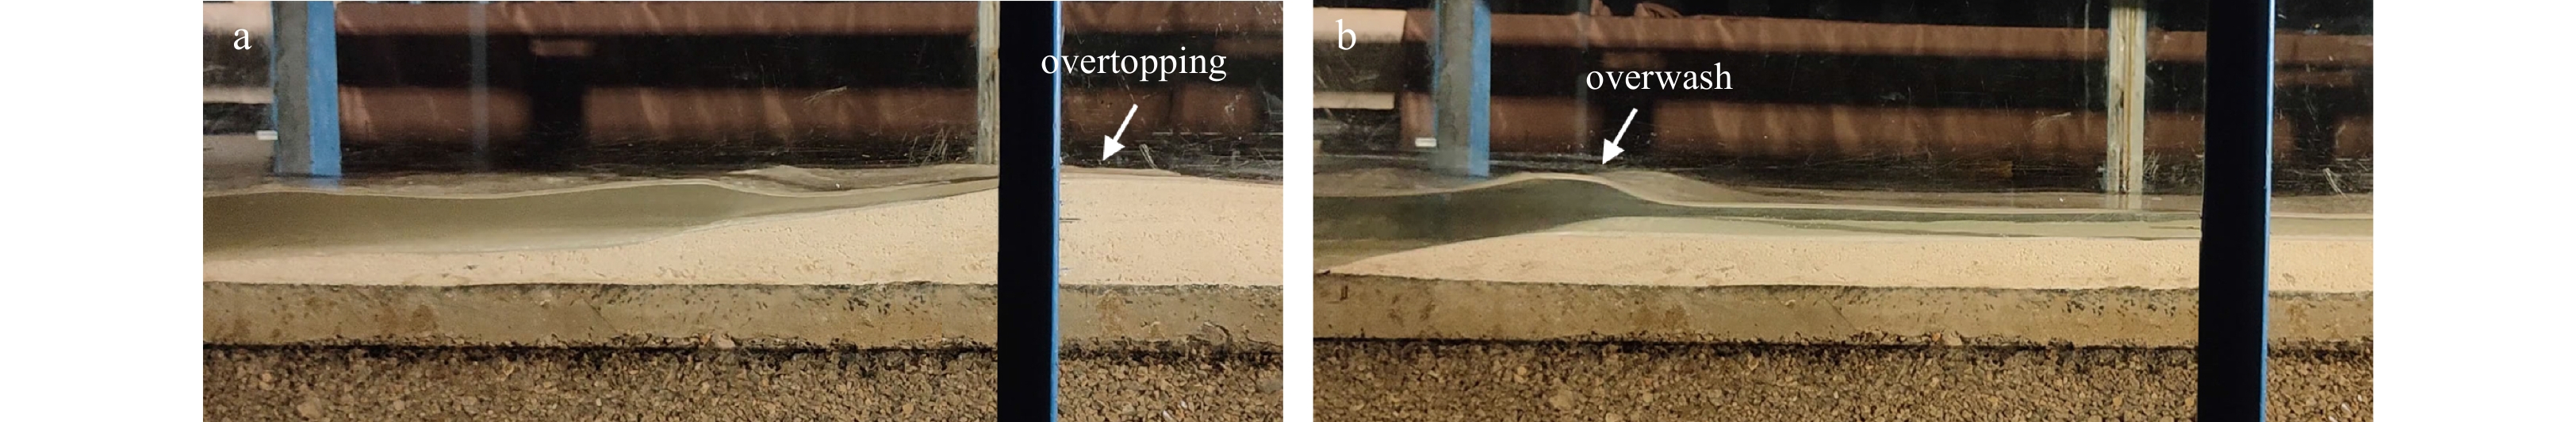
Previous laboratory studies with similar design (Tuck et al., 2019a, b) have identified that overtopping and overwash processes can physically account for such island evolution as can be observed in both Figs 5 and 6. This can be further verified in our experiments based on the records from the video camera. Notably, under small wave height and SLR, the overtopping process dominates, leading to an increase in the island crest elevation (e.g., Fig. 7a). On the contrary, under large wave height and intermediate SLR (i.e., zero freeboard), the washover process dominates, resulting in rollover of the entire island (e.g., Fig. 7b). A further increase in SLR reduces the depth-limited breaking-wave action thus weaken the washover process.

Since the effects of wave event (indicated by the wave height) and SLR on the island change have been investigated in the laboratory experiments in this study, in this section, we focus on the impacts of varying morphologic features of the island on the island migration. Four related parameters (island top width
| Factors | Tested values |
| Island top width W/m | 0.5, 1.0, 1.5, 2.0 |
| Island height $ {h_i} $/m | 0.025, 0.05, 0.075,0.1 |
| Distance between island toe and reef edge D/m | 1, 2, 3, 4 |
| Island side slope $ s $ | 1:3, 1:6, 1:9, 1:12 |
| Note: Boldface indicates the defaults. | |
 DownLoad:
CSV
DownLoad:
CSV
The island is found more difficult to be eroded responding to the increase of island’s top width due to increased sediment mass as well as larger wave dissipation occurring over wider island top (Fig. 8). Thus both the lagoonward recession of the island as well as its crest lowering are weakened, indicating that the narrow island is more vulnerable to the overwash process.

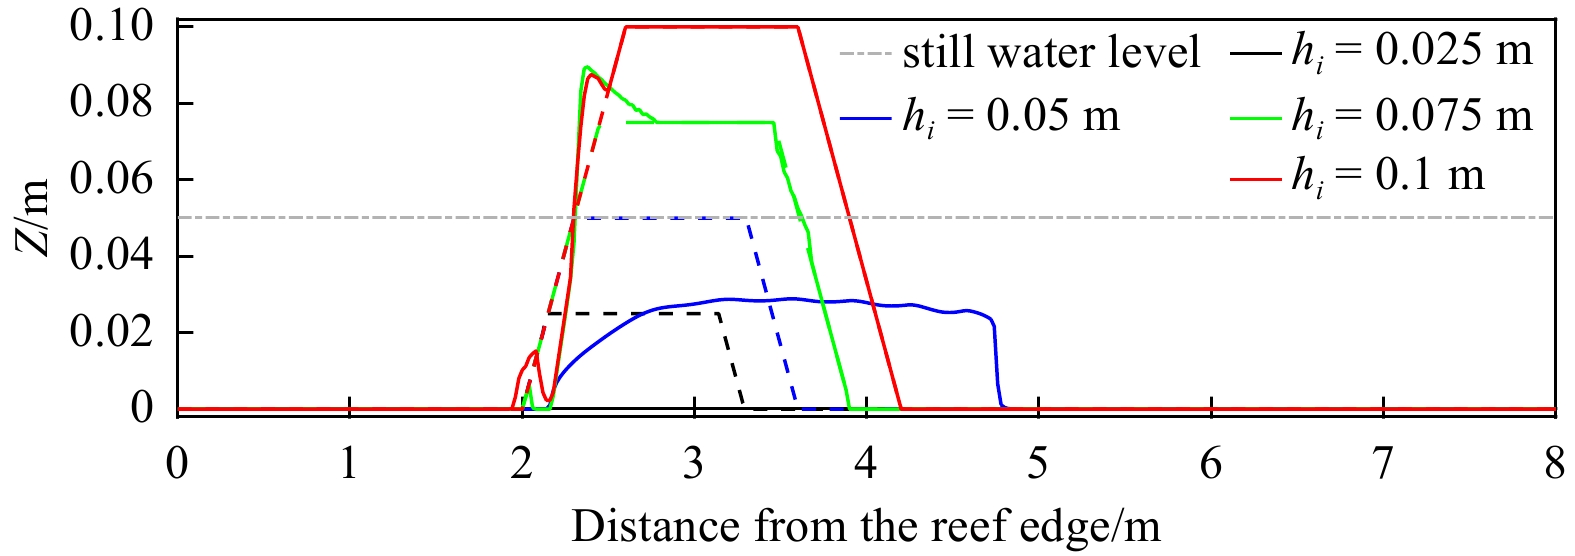
As the island height increases from 0.025 m to 0.1 m (Fig. 9), the island top changes from submerged to emerged conditions. A transition from the buildup of island seaside beach (similar to scenario with F > 0 in Fig. 6 due to the wave overtopping) to the destruction of whole island profile (similar to F < 0 in Fig. 6 due to the wave overtopping) can be observed. Particularly, at the small

As for the effect of the island location indicated by the distance between island beach toe and reef edge (Fig. 10), the influence of overwash process will decline as a result of enhanced energy dissipation from both wave breaking and bottom friction when travelling longer distances over reef flat. Consequently, the lagoonward island movement decreases but its crest elevation reduction is almost unaltered.

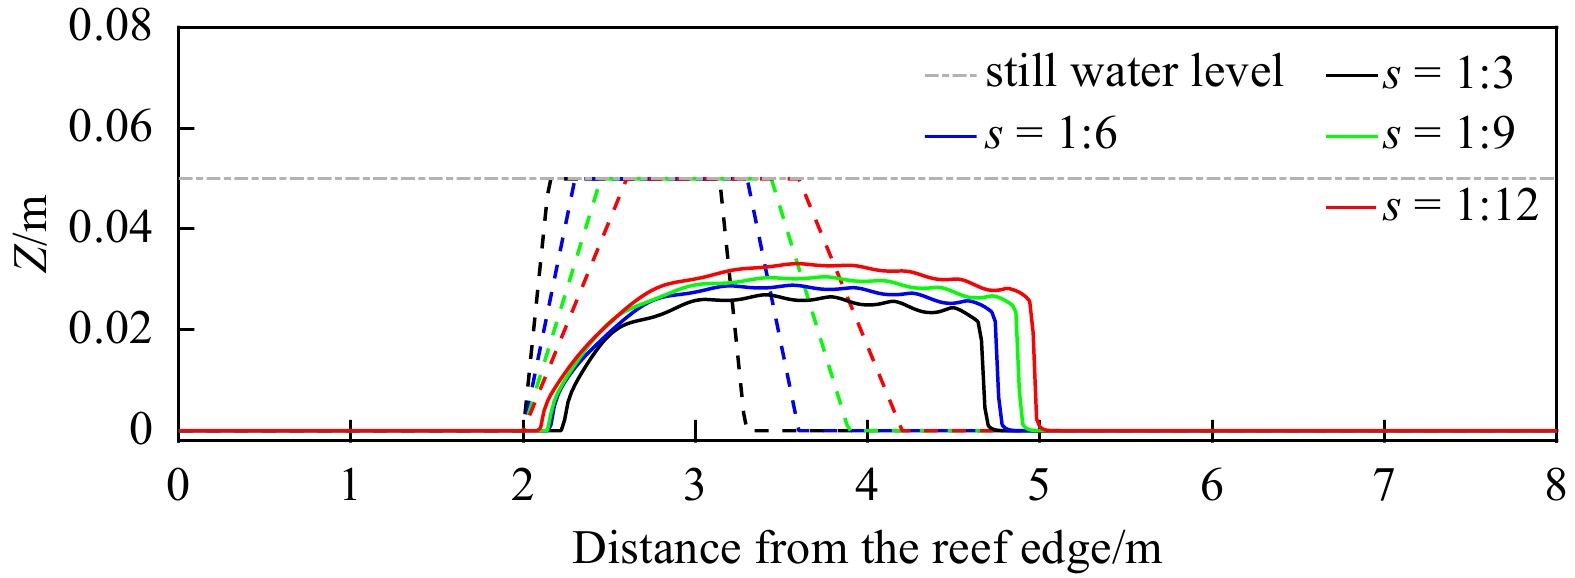
Comparatively speaking, the island morphodynamic change is less sensitive to the variation of island beach slope (Fig. 11). Both the inland recession of the island as well as the crest lowering slightly decreases as the beach slope becomes steeper. This is mainly due to fact that steeper slope reflects more incident wave energy thus less energy being kept for the wave overwash process.

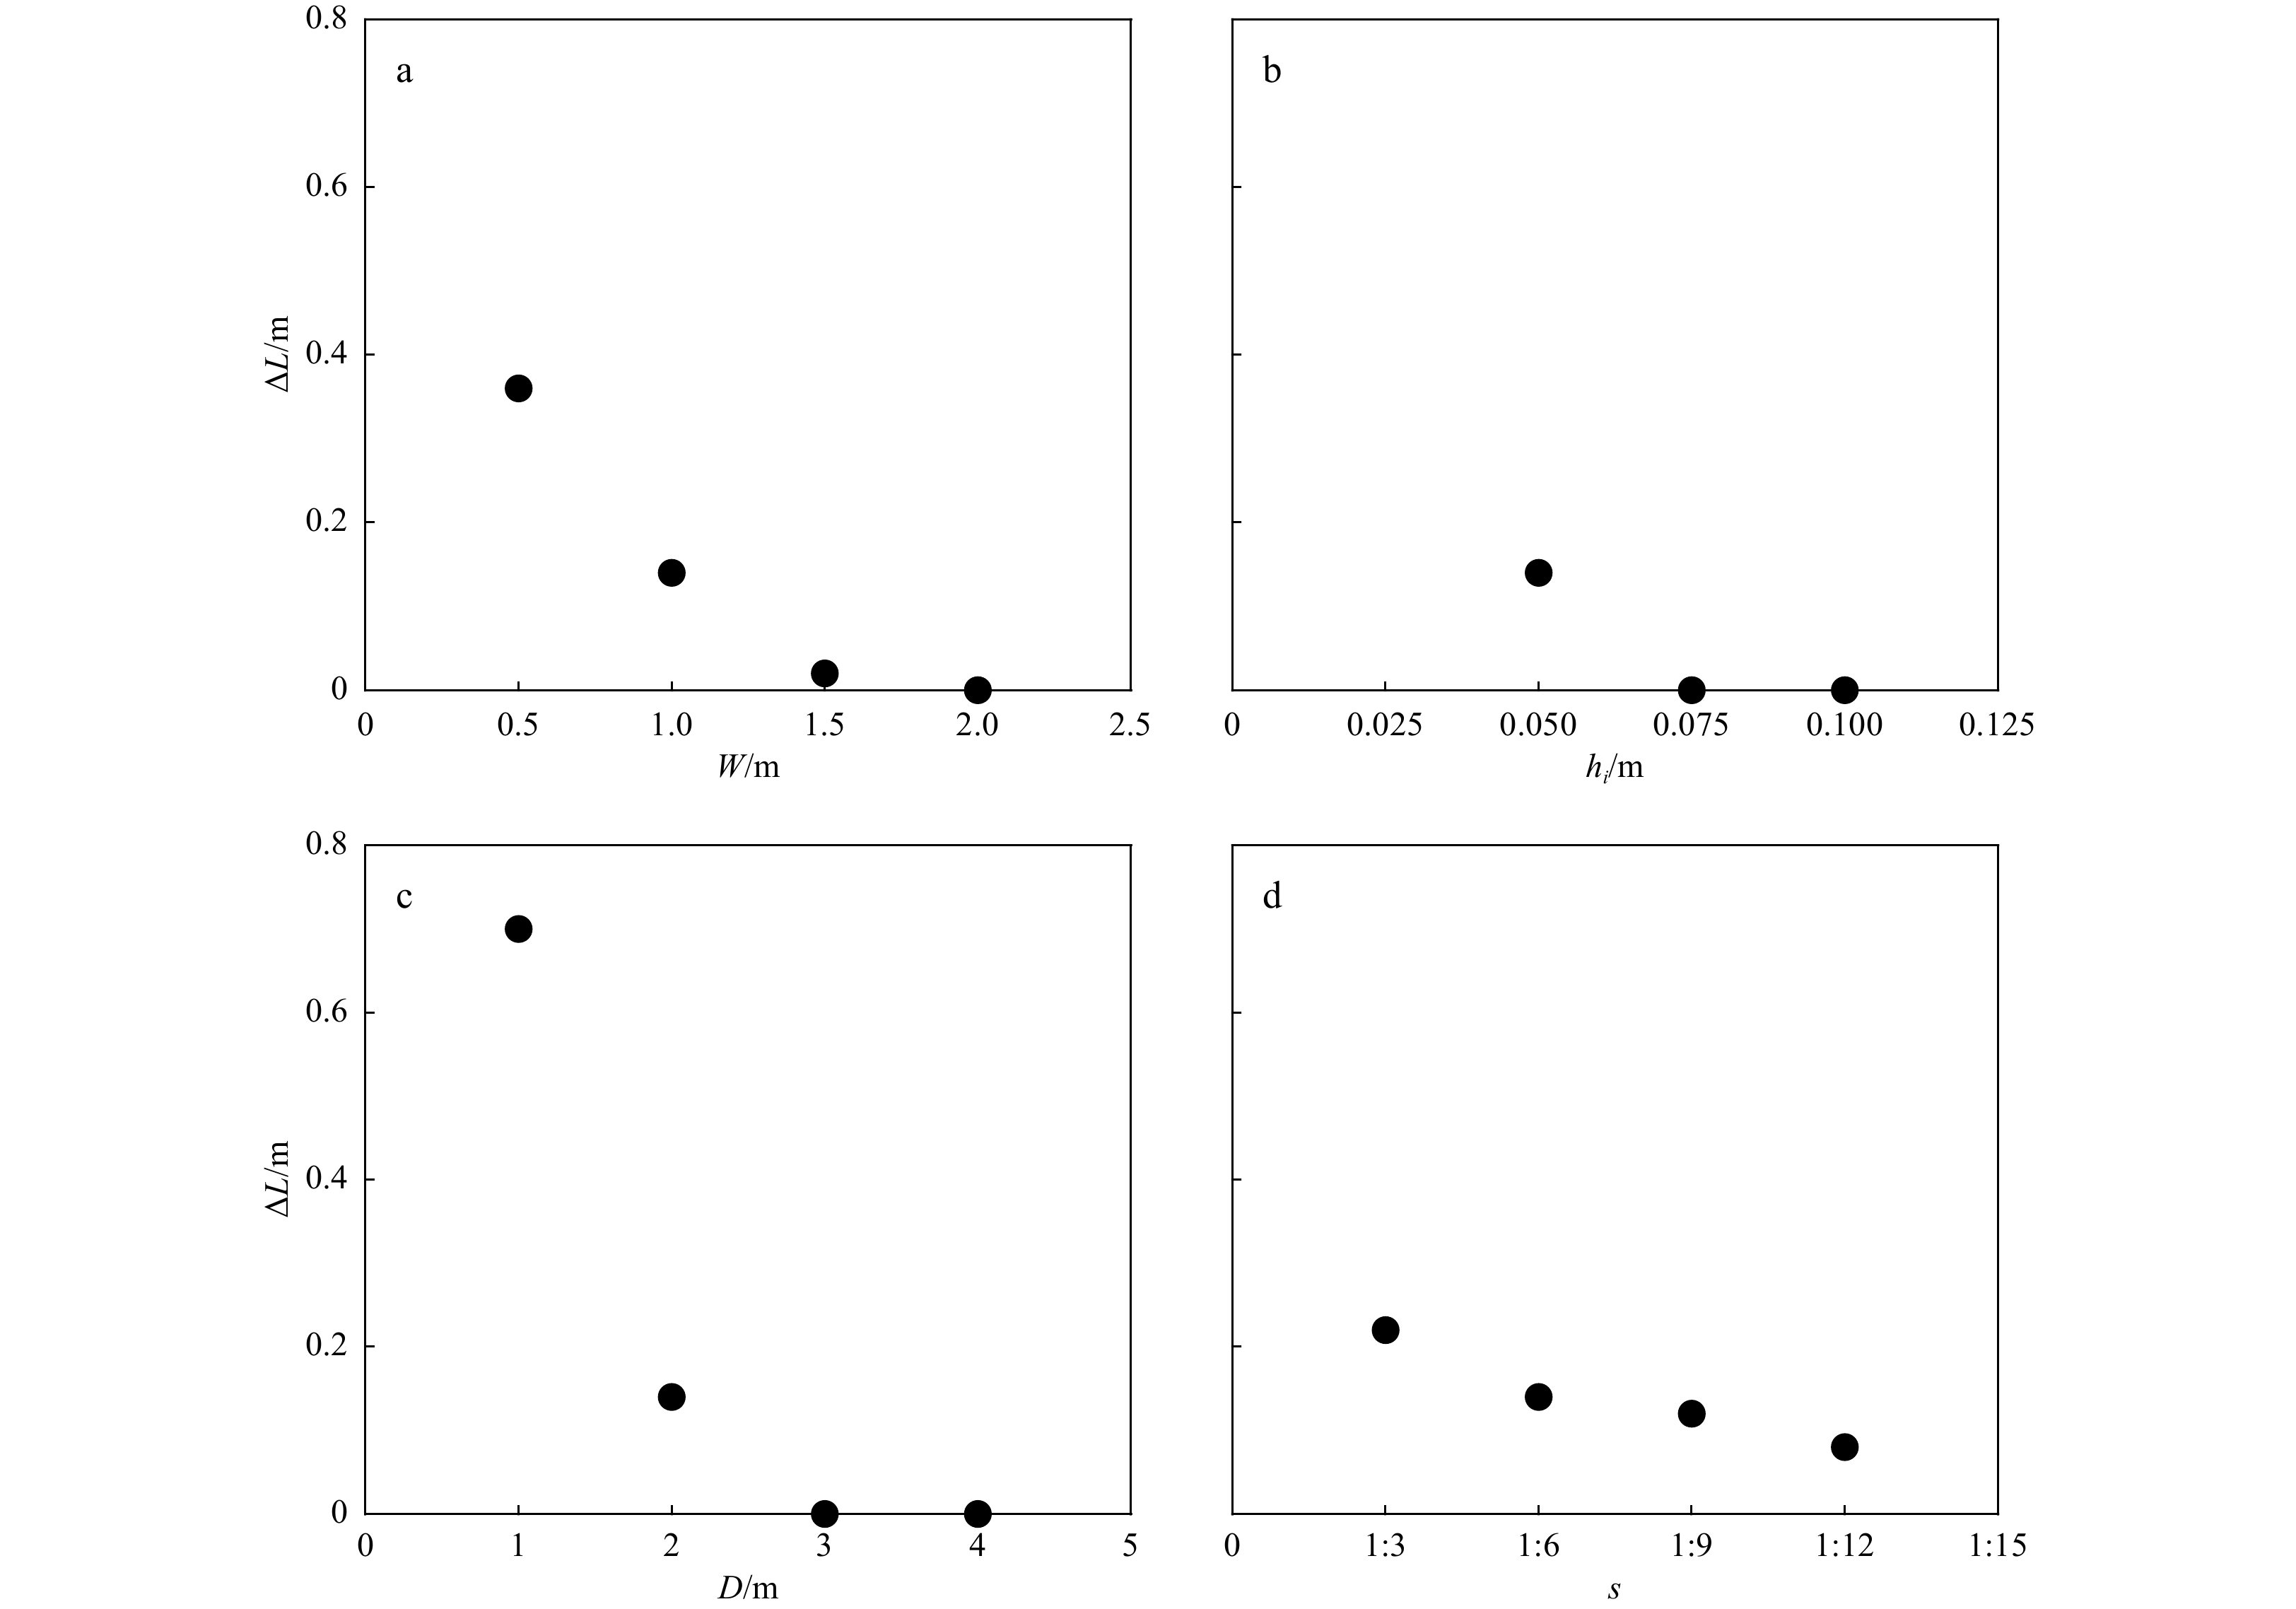
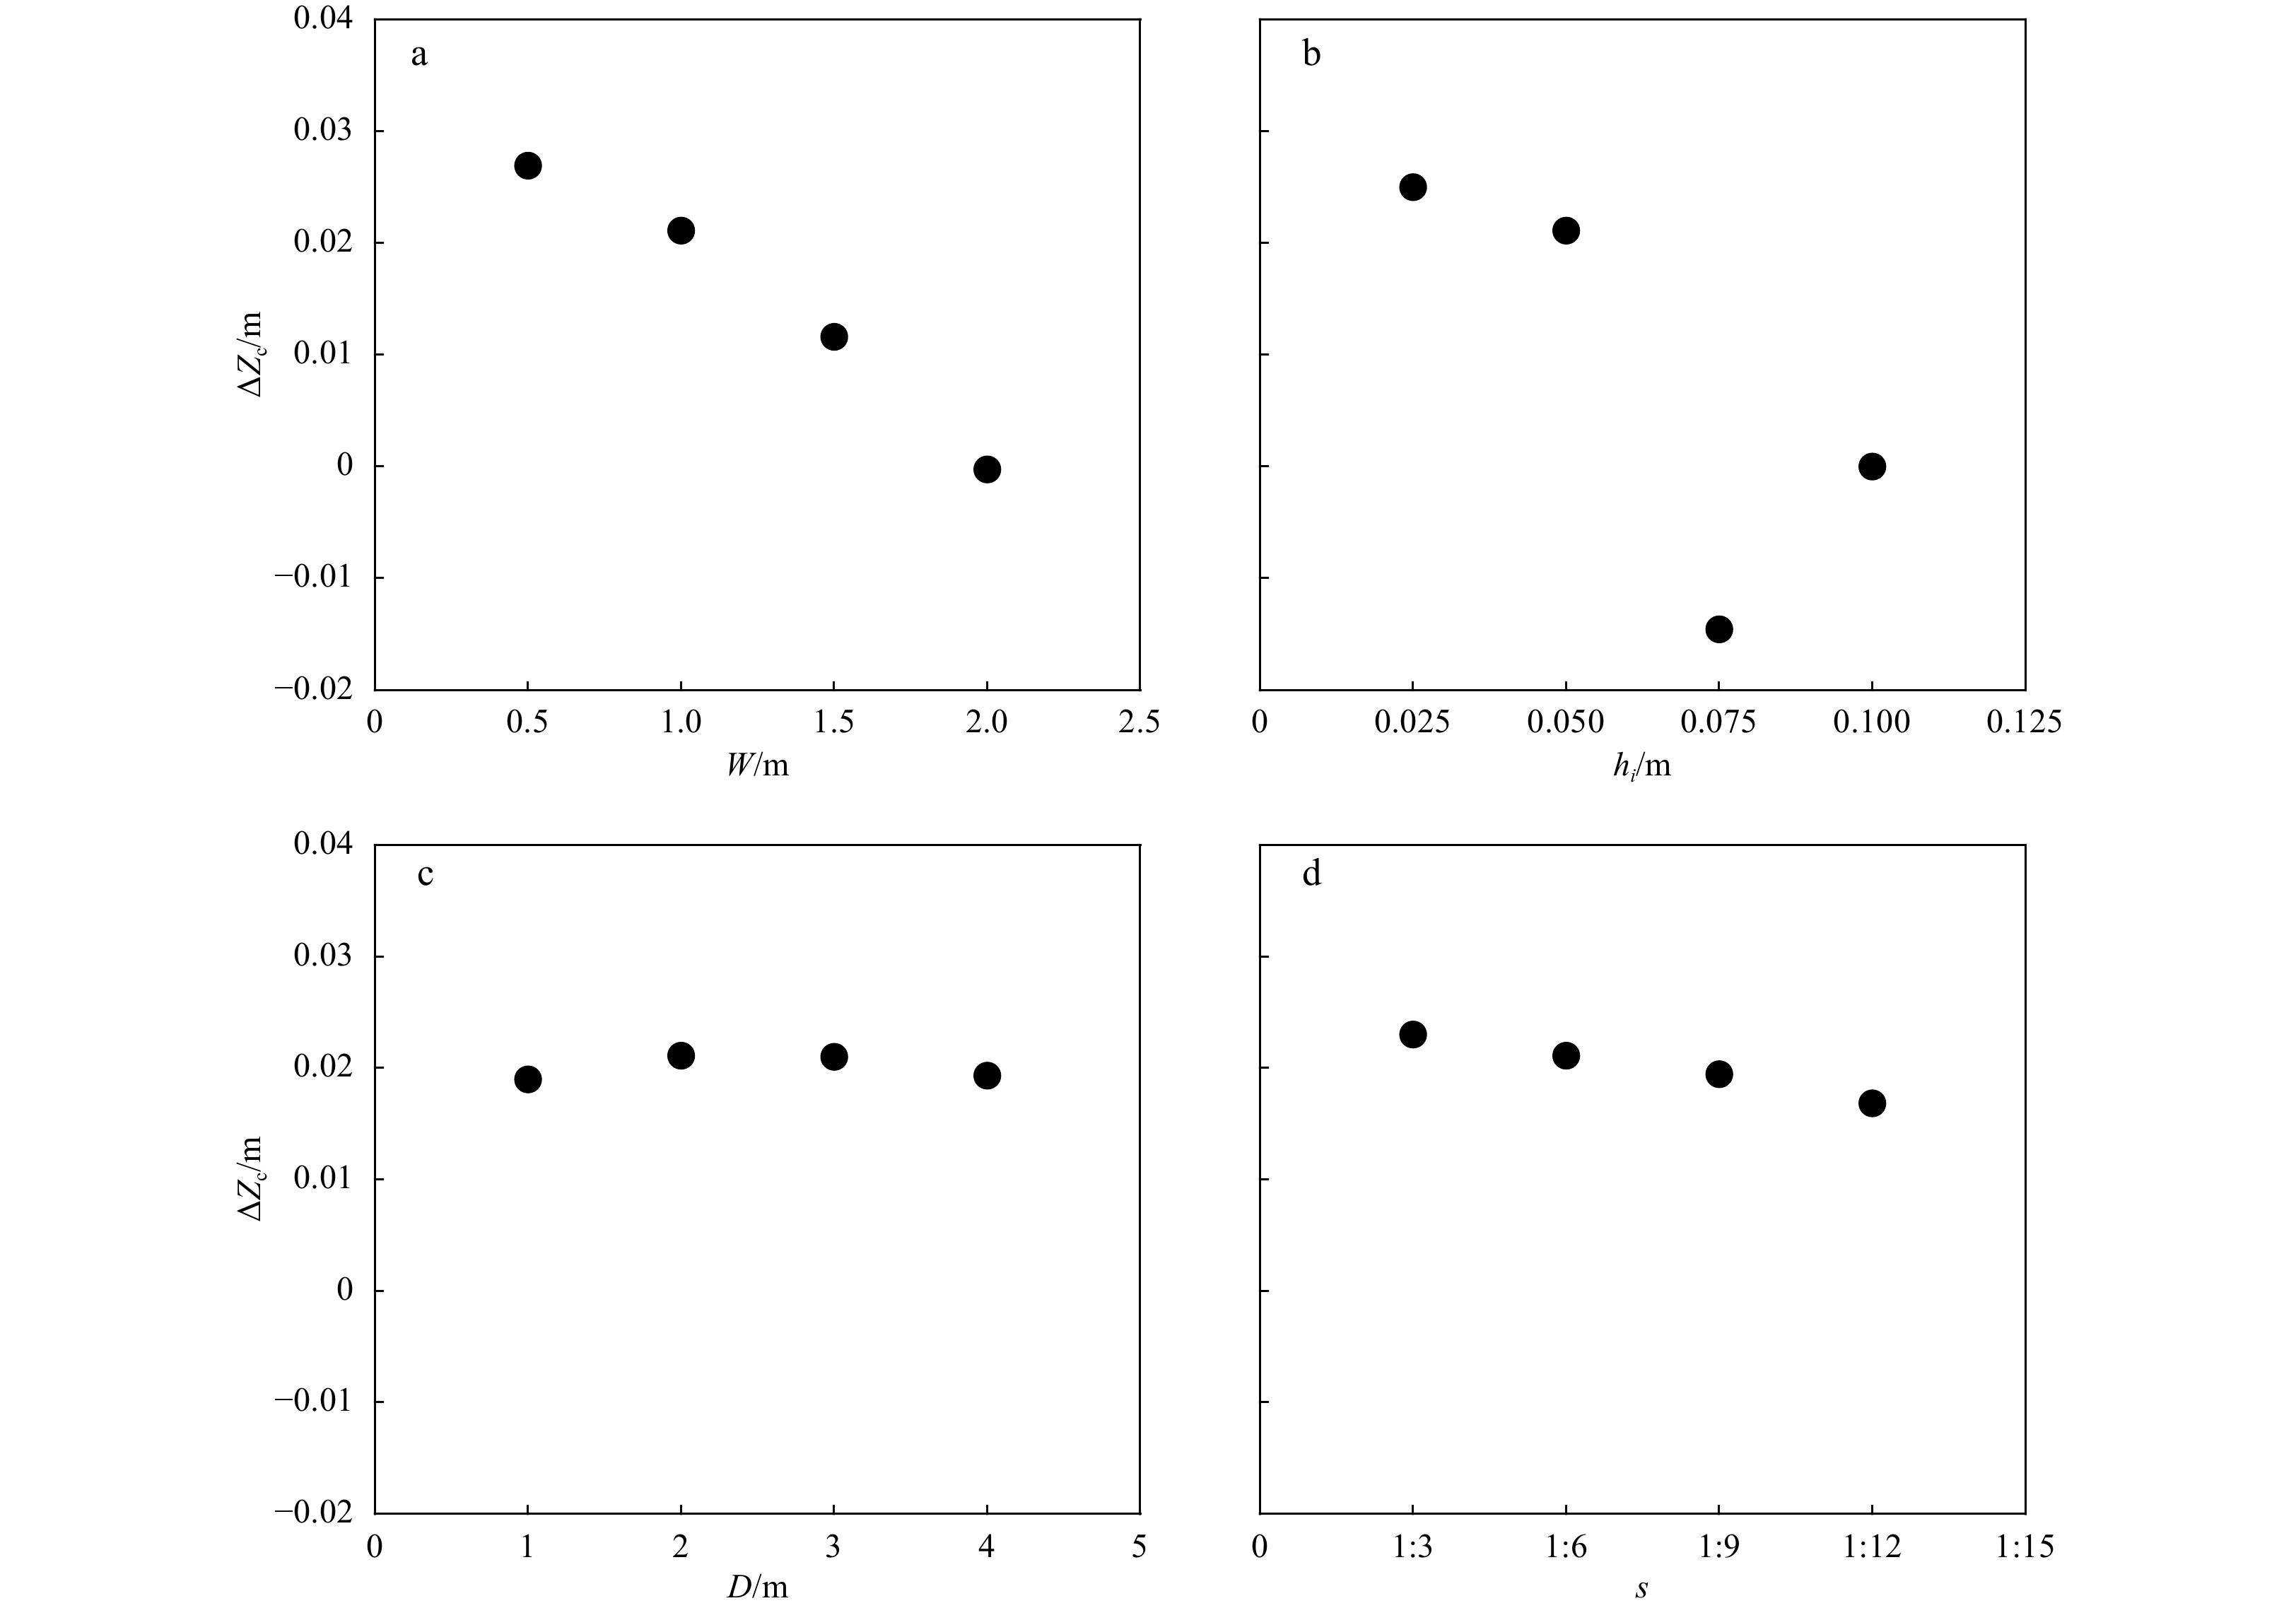
The variations of island migration in terms of its lagoonward recession (indicated by the difference in the seaward beach toe location between the initial profile and the equilibrium profile,


In accordance with those can be observed from Figs 8–11, Fig. 12 indicates again that
To better interpret wave and sediment processes over a reef island located on the reef flat subjected to the momocharomatic waves, a new set of laboratory experiments is implemented in a wave flume to explore the morphodynamic change of reef islands to varying ocean forcing conditions. It is found that under small wave height and SLR conditions, the dominating overtopping process leads to an increase in the island crest elevation. Under large wave height and intermediate SLR conditions (i.e., around zero freeboard), the dominating washover process can move or even destroy the entire island. A further increase in SLR reduces the breaking-induced washover process thus a buildup of the island crest can again be found. Subsequently, the XBeach numerical model using its phase-resolving nonhydrostatic module (XB-NH) combined with its sediment transport module is adopted. The adopted model is firstly calibrated using our experimental measurement of the equilibrium reef island profile exposed to momocharomatic waves. It is then used to examine the impacts of island morphological factors on the island evolution. Analyses indicate that the reef island with smaller width, smaller height, smaller distance from the reef edge and milder beach slope is more vulnerable to the wave overwash process in view of its increased lagoonward recession and crest lowering.
Our findings in this study also show that coral reef islands can accrete vertically in response to the sea level rise and the increased storminess. Such natural adaptation may support future persistence and habitability of those reef islands, which provides valuable guidance for coastal defense purpose. Further research can be directed to incorporate realistic island profile, carbonate sediment supply, more wave regimes as well as the variation of sediment types among different islands considering their local species of corals.
|
Ahrens J P. 2000. A fall-velocity equation. Journal of Waterway, Port, Coastal, and Ocean Engineering, 126(2): 99–102
|
|
Berard N A, Mulligan R P, da Silva A M F, et al. 2017. Evaluation of XBeach performance for the erosion of a laboratory sand dune. Coastal Engineering, 125: 70–80. doi: 10.1016/j.coastaleng.2017.04.002
|
|
Buckley M, Lowe R, Hansen J. 2014. Evaluation of nearshore wave models in steep reef environments. Ocean Dynamics, 64(6): 847–862. doi: 10.1007/s10236-014-0713-x
|
|
Cheng N S. 1997. Simplified settling velocity formula for sediment particle. Journal of Hydraulic Engineering, 123(2): 149–152. doi: 10.1061/(ASCE)0733-9429(1997)123:2(149)
|
|
Costa M B, Macedo E C, Siegle E. 2019. Wave refraction and reef island stability under rising sea level. Global and Planetary Change, 172: 256–267. doi: 10.1016/j.gloplacha.2018.10.015
|
|
De Winter R C, Gongriep F, Ruessink B G. 2015. Observations and modeling of alongshore variability in dune erosion at Egmond aan Zee, the Netherlands. Coastal Engineering, 99: 167–175. doi: 10.1016/j.coastaleng.2015.02.005
|
|
Deconto R M, Pollard D. 2016. Contribution of Antarctica to past and future sea-level rise. Nature, 531(7596): 591–597. doi: 10.1038/nature17145
|
|
Dickinson W R. 2009. Pacific atoll living: How long already and until when?. GSA Today, 19(3): 4–10. doi: 10.1130/GSATG35A.1
|
|
Duvat V K E. 2019. A global assessment of atoll island planform changes over the past decades. WIREs Climate Change, 10(1): e557
|
|
Elsayed S M, Oumeraci H. 2017. Effect of beach slope and grain-stabilization on coastal sediment transport: An attempt to overcome the erosion overestimation by XBeach. Coastal Engineering, 121: 179–196. doi: 10.1016/j.coastaleng.2016.12.009
|
|
Etienne S, Terry J P. 2012. Coral boulders, gravel tongues and sand sheets: features of coastal accretion and sediment nourishment by Cyclone Tomas (March 2010) on Taveuni Island, Fiji. Geomorphology, 175–176: 54–65
|
|
Franklin G, Mariño-Tapia I, Torres-Freyermuth A. 2013. Effects of reef roughness on wave setup and surf zone currents. Journal of Coastal Research, 65: 2005–2010
|
|
Galappatti G, Vreugdenhil C B. 1985. A depth-integrated model for suspended sediment transport. Journal of Hydraulic Research, 23(4): 359–377. doi: 10.1080/00221688509499345
|
|
Grady A E, Moore L J, Storlazzi C D, et al. 2013. The influence of sea level rise and changes in fringing reef morphology on gradients in alongshore sediment transport. Geophysical Research Letters, 40(12): 3096–3101. doi: 10.1002/grl.50577
|
|
Hallermeier R J. 1981. Terminal settling velocity of commonly occurring sand grains. Sedimentology, 28(6): 859–865. doi: 10.1111/j.1365-3091.1981.tb01948.x
|
|
Harter C, Figlus J. 2017. Numerical modeling of the morphodynamic response of a low-lying barrier island beach and foredune system inundated during Hurricane Ike using XBeach and CSHORE. Coastal Engineering, 120: 64–74. doi: 10.1016/j.coastaleng.2016.11.005
|
|
Kayanne H, Aoki K, Suzuki T, et al. 2016. Eco-geomorphic processes that maintain a small coral reef island: Ballast Island in the Ryukyu Islands, Japan. Geomorphology, 271: 84–93. doi: 10.1016/j.geomorph.2016.07.021
|
|
Kench P S, Brander R W, Parnell K E, et al. 2006. Wave energy gradients across a Maldivian atoll: Implications for island geomorphology. Geomorphology, 81(1–2): 1–17
|
|
Kench P S, Ford M R, Owen S D. 2018. Patterns of island change and persistence offer alternate adaptation pathways for atoll nations. Nature Communications, 9(1): 605. doi: 10.1038/s41467-018-02954-1
|
|
Kench P S, Thompson D, Ford M R, et al. 2015. Coral islands defy sea-level rise over the past century: records from a central Pacific atoll. Geology, 43(6): 515–518. doi: 10.1130/G36555.1
|
|
Kopp R E, Horton R M, Little C M, et al. 2014. Probabilistic 21st and 22nd century sea-level projections at a global network of tide-gauge sites. Earth’s Future, 2(8): 383–406. doi: 10.1002/2014EF000239
|
|
Li Jinxuan, Zang Jun, Liu Shuxue, et al. 2019. Numerical investigation of wave propagation and transformation over a submerged reef. Coastal Engineering Journal, 61(3): 363–379. doi: 10.1080/21664250.2019.1609712
|
|
Lindemer C A, Plant N G, Puleo J A, et al. 2010. Numerical simulation of a low-lying barrier island’s morphological response to Hurricane Katrina. Coastal Engineering, 57(11–12): 985–995
|
|
Liu Ye, Liao Zhiling, Fang Kezhao, et al. 2021. Uncertainty of wave runup prediction on coral reef-fringed coasts using SWASH model. Ocean Engineering, 242: 110094. doi: 10.1016/j.oceaneng.2021.110094
|
|
Ma Gangfeng, Su Shih-Feng, Liu Shuguang, et al. 2014. Numerical simulation of infragravity waves in fringing reefs using a shock-capturing non-hydrostatic model. Ocean Engineering, 85: 54–64. doi: 10.1016/j.oceaneng.2014.04.030
|
|
Masselink G, Beetham E, Kench P. 2020. Coral reef islands can accrete vertically in response to sea level rise. Science Advances, 6(24): eaay3656. doi: 10.1126/sciadv.aay3656
|
|
Masselink G, McCall R, Beetham E, et al. 2021. Role of future reef growth on morphological response of coral reef islands to sea-level rise. Journal of Geophysical Research: Earth Surface, 126(2): e2020JF005749
|
|
McCall R T, Masselink G, Poate T G, et al. 2015. Modelling the morphodynamics of gravel beaches during storms with XBeach-G. Coastal Engineering, 103: 52–66. doi: 10.1016/j.coastaleng.2015.06.002
|
|
McLean R, Kench P. 2015. Destruction or persistence of coral atoll islands in the face of 20th and 21st century sea-level rise?. WIREs Climate Change, 6(5): 445–463. doi: 10.1002/wcc.350
|
|
Nicholls R J, Cazenave A. 2010. Sea-level rise and its impact on coastal zones. Science, 328(5985): 1517–1520. doi: 10.1126/science.1185782
|
|
Ning Yue, Liu Weijie, Zhao Xizeng, et al. 2019. Study of irregular wave run-up over fringing reefs based on a shock-capturing Boussinesq model. Applied Ocean Research, 84: 216–224. doi: 10.1016/j.apor.2019.01.013
|
|
Nurse L A, McLean R F, Agard J, et al. 2014. Small islands. In: Barros V R, Field C B, Dokken D J, et al., eds. Climate Change 2014: Impacts, Adaptation, and Vulnerability. Part B: Regional Aspects. Contribution of Working Group II to the Fifth Assessment Report of the Intergovernmental Panel on Climate Change. Cambridge, United Kingdom and New York, NY: Cambridge University Press, 1613–1654
|
|
Pearson S G, Storlazzi C D, Van Dongeren A R, et al. 2017. A Bayesian-based system to assess wave-driven flooding hazards on coral reef-lined coasts. Journal of Geophysical Research: Oceans, 122(12): 10099–10117. doi: 10.1002/2017JC013204
|
|
Quataert E, Storlazzi C, Van Rooijen A, et al. 2015. The influence of coral reefs and climate change on wave-driven flooding of tropical coastlines. Geophysical Research Letters, 42(15): 6407–6415
|
|
Quataert E, Storlazzi C, Van Dongeren A, et al. 2020. The importance of explicitly modelling sea-swell waves for runup on reef-lined coasts. Coastal Engineering, 160: 103704. doi: 10.1016/j.coastaleng.2020.103704
|
|
Riazi A, Vila-Concejo A, Salles T, et al. 2020. Improved drag coefficient and settling velocity for carbonate sands. Scientific Reports, 10(1): 9465. doi: 10.1038/s41598-020-65741-3
|
|
Sengupta M, Ford M R, Kench P S. 2021a. Shoreline changes in coral reef islands of the Federated States of Micronesia since the mid-20th century. Geomorphology, 377: 107584. doi: 10.1016/j.geomorph.2020.107584
|
|
Sengupta M, Ford M R, Kench P S. 2021b. Multi-decadal planform changes on coral reef islands from atolls and mid-ocean reef platforms of the equatorial Pacific Ocean: Gilbert Islands, Republic of Kiribati. Geomorphology, 389: 107831. doi: 10.1016/j.geomorph.2021.107831
|
|
Shi Jian, Zhang Chi, Zheng Jinhai, et al. 2018. Modelling wave breaking across coral reefs using a non-hydrostatic model. Journal of Coastal Research, 85: 501–505. doi: 10.2112/SI85-101.1
|
|
Shope J B, Storlazzi C D, Erikson L H, et al. 2016. Changes to extreme wave climates of islands within the Western Tropical Pacific throughout the 21st century under RCP 4.5 and RCP 8.5, with implications for island vulnerability and sustainability. Global and Planetary Change, 141: 25–38. doi: 10.1016/j.gloplacha.2016.03.009
|
|
Smagorinsky J. 1963. General circulation experiments with the primitive equations. I. The basic experiment. Monthly Weather Review, 91(3): 99–164. doi: 10.1175/1520-0493(1963)091<0099:GCEWTP>2.3.CO;2
|
|
Smit P B, Stelling G S, Roelvink D J A, et al. 2010. XBeach: Non-hydrostatic model: Validation, verification and model description. Delft, The Netherlands: Delft University of Technology
|
|
Smit P, Zijlema M, Stelling G. 2013. Depth-induced wave breaking in a non-hydrostatic, near-shore wave model. Coastal Engineering, 76: 1–16. doi: 10.1016/j.coastaleng.2013.01.008
|
|
Storlazzi C D, Elias E P L, Berkowitz P. 2015. Many atolls may be uninhabitable within decades due to climate change. Scientific Reports, 5(1): 14546. doi: 10.1038/srep14546
|
|
Storlazzi C D, Gingerich S B, Van Dongeren A, et al. 2018. Most atolls will be uninhabitable by the mid-21st century because of sea-level rise exacerbating wave-driven flooding. Science Advances, 4(4): eaay9741. doi: 10.1126/sciadv.aap9741
|
|
Su Shih-Feng, Ma Gangfeng. 2018. Modeling two-dimensional infragravity motions on a fringing reef. Ocean Engineering, 153: 256–267. doi: 10.1016/j.oceaneng.2018.01.111
|
|
Su Shih-Feng, Ma Gangfeng, Hsu Tai-Wen. 2015. Boussinesq modeling of spatial variability of infragravity waves on fringing reefs. Ocean Engineering, 101: 78–92. doi: 10.1016/j.oceaneng.2015.04.022
|
|
Talavera L, Vila-Concejo A, Webster J M, et al. 2021. Morphodynamic controls for growth and evolution of a rubble coral island. Remote Sensing, 13(8): 1582. doi: 10.3390/rs13081582
|
|
Tuck M E, Ford M R, Kench P S, et al. 2021. Sediment supply dampens the erosive effects of sea-level rise on reef islands. Scientific Reports, 11: 5523. doi: 10.1038/s41598-021-85076-x
|
|
Tuck M E, Ford M R, Masselink G, et al. 2019a. Physical modelling of reef island topographic response to rising sea levels. Geomorphology, 345: 106833. doi: 10.1016/j.geomorph.2019.106833
|
|
Tuck M E, Kench P S, Ford M R, et al. 2019b. Physical modelling of the response of reef islands to sea-level rise. Geology, 47(9): 803–806. doi: 10.1130/G46362.1
|
|
Van Dongeren A, Lowe R, Pomeroy A, et al. 2013. Numerical modeling of low-frequency wave dynamics over a fringing coral reef. Coastal Engineering, 73: 178–190. doi: 10.1016/j.coastaleng.2012.11.004
|
|
Van Thiel de Vries J S M. 2009. Dune erosion during storm surges [dissertation]. Delft: Delft University of Technology
|
|
Yao Yu, Becker J M, Ford M R, et al. 2016. Modeling wave processes over fringing reefs with an excavation pit. Coastal Engineering, 109: 9–19. doi: 10.1016/j.coastaleng.2015.11.009
|
|
Yao Yu, Chen Xianjin, Xu Conghao, et al. 2022. Numerical modelling of wave transformation and runup over rough fringing reefs using VARANS equations. Applied Ocean Research, 118: 102952. doi: 10.1016/j.apor.2021.102952
|
|
Yao Yu, Huang Zhenghua, Monismith S G, et al. 2012. 1DH Boussinesq modeling of wave transformation over fringing reefs. Ocean Engineering, 47: 30–42. doi: 10.1016/j.oceaneng.2012.03.010
|
|
Yao Yu, Liu Yichen, Chen Long, et al. 2020. Study on the wave-driven current around the surf zone over fringing reefs. Ocean Engineering, 198: 106968. doi: 10.1016/j.oceaneng.2020.106968
|
|
Zijlema M, Stelling G, Smit P. 2011. SWASH: an operational public domain code for simulating wave fields and rapidly varied flows in coastal waters. Coastal Engineering, 58(10): 992–1012. doi: 10.1016/j.coastaleng.2011.05.015
|
| 1. | Yu Yao, Zhangyan Li, Zhongwei Zhao, et al. Study on the morphodynamic response of reef flat with moveable bed to monochromatic waves. Marine Geology, 2025, 481: 107479. doi:10.1016/j.margeo.2025.107479 | |
| 2. | Paul S. Kench. Effects of Environmental and Climatic Changes on Coral Reef Islands. Annual Review of Marine Science, 2025, 17(1): 301. doi:10.1146/annurev-marine-032223-030921 | |
| 3. | Yu Yao, Danni Zhong, Jiangxia Li, et al. Modeling of extreme waves in the South China Sea under the influence of tropical cyclones: long-term statistical perspective in Xisha reef islands. Natural Hazards, 2024, 120(14): 13181. doi:10.1007/s11069-024-06729-4 |

Figures(13) / Tables(1)

Supported by:
Beijing Renhe Information Technology Co. Ltd

Yu Yao, Baobao Zhou, Zhongwei Zhao, Xianjin Chen, Long Chen. An investigation of the morphodynamic change of reef islands under monochromatic waves[J]. Acta Oceanologica Sinica, 2023, 42(7): 41-50. doi: 10.1007/s13131-023-2156-z

| Factors | Tested values |
| Island top width W/m | 0.5, 1.0, 1.5, 2.0 |
| Island height $ {h_i} $/m | 0.025, 0.05, 0.075,0.1 |
| Distance between island toe and reef edge D/m | 1, 2, 3, 4 |
| Island side slope $ s $ | 1:3, 1:6, 1:9, 1:12 |
| Note: Boldface indicates the defaults. | |
DownLoad:
CSV
 DownLoad:


 DownLoad: