

Figure
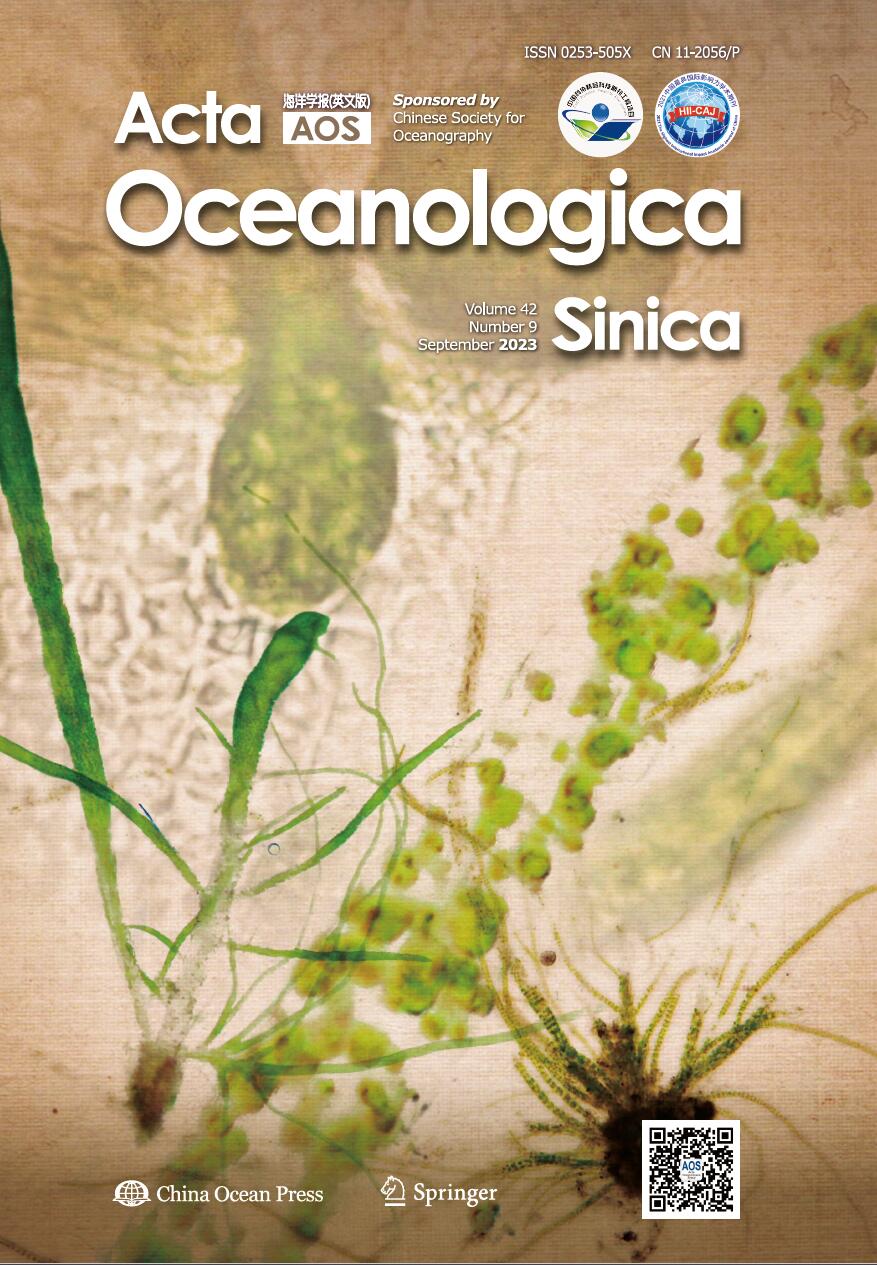
1.
Locations of sampling stations.
| Citation: | Jiang Li, Luying Zhao, Xiaoqian Gu, Chengxuan Li, Qian Zhang, Liping Fu, Ao Zhang. Vertical microbial profiling of water column reveals prokaryotic communities and distribution features of Antarctic Peninsula[J]. Acta Oceanologica Sinica, 2023, 42(9): 90-100. doi: 10.1007/s13131-023-2160-3

|
Microorganisms are ubiquitously distributed in marine environments and play pivotal roles in maintaining ecosystem functions. In addition, marine microorganisms have distinct geographical distributions, which contribute significantly to biomass and primary production in their ecosystems. The structure of microbial communities in the ocean displays vertical and horizontal patterns associated with variations in physicochemical and biological conditions (Giovannoni and Stingl, 2005; Zinger et al., 2011; Walsh et al., 2015) that can be modified by variations in environmental factors over a range of time scales (Fuhrman et al., 2015; Giovannoni and Vergin, 2012). A comprehensive and thorough investigation of the microbial diversity in seawaters is essential to understand the ecological role of microorganisms in these habitats.
Polar oceans play a significant role in the global carbon cycle and account for 4%–11% of the global carbon export to the ocean interior (Laws et al., 2000). The Southern Ocean, defined here as the region of the world’s ocean south of the subantarctic front, accounts for approximately 10% of the total ocean area of the planet, or approximately 7% of the Earth’s surface. The unique physicochemical properties of the Southern Ocean enable high levels of microbial primary production to occur (Wilkins et al., 2013a); however, most of its microbial communities remain unexplored.
An increasing number of studies have investigated the bacterial communities in different geographical regions of Antarctica and the Southern Ocean (Aislabie et al., 2008; Chong et al., 2009a, 2009b, 2013; Shivaji et al., 2011; Torstensson et al., 2015; Venkatachalam et al., 2019). Most of these studies have focused on the bacterial diversity and function of soils, lakes, surface seawater and sea ice (Yergeau et al., 2007a, 2007b, 2007c, 2012; Torstensson et al., 2015; Dinasquet et al., 2017). Most of the small number of studies on prokaryotic community composition using state of the art molecular approaches have been limited to near-surface waters down to a depth of 200 m (Manganelli et al., 2009; Ghiglione and Murray, 2012; Landa et al., 2016). However, limited information on prokaryotic community composition is available from mesopelagic and bathypelagic waters of the Southern Ocean (Wilkins et al., 2013b).
The development of high throughput sequencing (HTS) technologies during the last decade has revolutionized the study of natural microbial communities, now characterized as the ‘‘unseen majority’’. This technology allows, in a cost-effective way, the analysis of diversity, metabolic functions, and biological interactions in complex, uncultured microbial communities. Extraction of DNA from mixed communities of microbes, followed by HTS, has greatly increased our understanding of the fundamental roles played by terrestrial, aquatic, and human associated microbiota (Fierer et al., 2007; Zinger et al., 2011; The Human Microbiome Project Consortium, 2012).
The advent of second- and third-generation sequencing technologies has enabled microbial ecologist to elucidate microbial communities of an environment at increased depth and breadth. The aim of the present study was to character the prokaryotic diversity and distribution patterns of communities around the Antarctic Peninsula water samples at various depth and investigate their variations with environmental parameters. These results can improve our knowledge of the microbial communities and their potential ecological functions within the Southern Ocean.
Seawater samples were collected by the R/V XIANGYANGHONG 01 around the Antarctic Peninsula area of the Southern Ocean (8 sites, 63 samples) during China’s Antarctic scientific investigation from 2017 to 2018 (Fig. 1; Table 1). Water samples were collected using Niskin sampling bottles, a CTD (Sea-Bird Electronics, USA) profiler was deployed to record temperature, depth, salinity, and dissolved oxygen profiles. All water samples from each station were prefiltered through a mesh sieve to remove most of the mesozooplankton and large particles, then were filtered through 0.22 µm acetate membranes (Merck Millipore, USA) using a vacuum pump while on board. The total organic carbon and chlorophyll a of seawaters were analyzed as described by Park (1969). All samples were stored in −80℃ freezer on board until further analysis.
| No. | Station | Date (UTC) | Time (UTC) | Latitude | Longitude | Depth/m |
| 1 | SR0107 | 2018-01-02 | 17:42 | 59°57.588' S | 62°18.739'W | 3 237 |
| 2 | DA03 | 2018-01-04 | 9:58 | 60°42.002'S | 53°0.073'W | 456 |
| 3 | D305 | 2018-01-09 | 10:11 | 59°0.040'S | 49°36.002'W | 3 922 |
| 4 | D311 | 2018-01-10 | 16:35 | 62°0.114'S | 48°23.971'W | 3 266 |
| 5 | D506 | 2018-01-20 | 8:01 | 59°29.968'S | 42°30.116'W | 3 001 |
| 6 | D510 | 2018-01-21 | 19:34 | 61°17.989'S | 42°29.975'W | 520 |
| 7 | DZ04 | 2018-01-29 | 1:35 | 60°40.884'S | 48°56.869'W | 1 147 |
| 8 | HS0A | 2018-02-01 | 17:22 | 62°25.914'S | 58°24.620'W | 1 052 |
 DownLoad:
CSV
DownLoad:
CSV
Total genomic DNA was extracted from each acetate membrane sample using a FastDNA Spin Kit for Soil (MP Biomedicals, Santa Ana, CA, USA) following the manufacturer’s instructions. The extracted DNA samples were quantified using a NanoDrop 2000 spectrophotometer (Thermo Fisher Scientific, Waltham, MA, USA). The conserved sequences flanking the hypervariable V3–V4 region of the 16S rRNA gene served as primer sites to generate PCR amplicons. PCR was performed on 20 ng of sample DNA using a PCR mix containing 0.2 µL Taq polymerase, 5 µL buffer, and a 10 µmol/L concentration of both forward and reverse primers 341F (CCTAYGGGRBGCASCAG) and 806R (GGACTACNNGGGTATCTAAT) with Barcode Tags. The amplicon libraries were constructed under the following PCR conditions: 94℃ for 2 min, and 30 cycles of 94℃ for 30 s, 55℃ for 20 s, and 72℃ for 1 min, with a final extension step held at 74℃ for 10 min. Thereafter, amplicon PCR products were purified using QIA quick PCR purification columns (Qiagen Inc., Valencia, CA, USA) and pooled in equimolar concentrations. The amplicon library was purified and sequenced on an Illumina MiSeq sequencing-by-synthesis platform (Novogene Bioinformatics Technology Co. Ltd., Beijing, China).
After sequencing, the barcodes and amplicon primer sequences were removed, and reads with more than one unknown nucleotide (N), reads with ≥3% of bases with Phred values of <27, and reads with a length greater than 2 standard deviations away from the mean read length were removed. Chimeras were removed using the UCHIME algorithm. Subsequent analyses on the resulting pooled reads were carried out using QIIME (V1.7.0). Pooled sequences were denoised using Acacia (version 1.5), which algorithmically corrected pyrosequencing errors and removed reads with a length more than 2 standard deviations away from the mean read length. The operational taxonomic units (OTUs) were clustered at 97% similarity using the uclust OTU picking method and the most abundant reads from each OTU were aligned using the Py-NAST algorithm.
Alpha diversity was applied in analyzing the complexity of species diversity for each sample, and the observed-species, Chao1, Shannon, Simpson, Abundance-based Coverage Estimator (ACE), and Good’s coverage indices were evaluated using QIIME (V1.7.0) (Caporaso et al., 2010). Linear discriminant analysis (LDA) coupled with effect size measurements (LEfSe) analysis was performed using the Kruskal–Wallis rank sum test to detect microbial taxa with significantly different abundances among stations, and LDA was used to estimate the effect size of each taxon (Segata et al., 2011). Canonical correspondence analysis (CCA) was carried out based on environmental parameters such as temperature, DO concentration, salinity, and depth using PAST3 (Hammer et al., 2001). Variation partitioning analysis (VPA) was employed to identify the relative importance of each environmental variable and their interactions in influencing the variation of prokaryotic communities (R D Core Team, 2008). To test the correlations between microbial community diversity and environmental factors, we adopted Spearman correlation analysis, which was performed with the R software (V 2.15.3). To explore the potential function of identified species in the biochemical cycling of environmental samples, we used FAPROTAX to predict the functional classification based on species information.
The environmental parameters of the samples collected and the number of OTUs generated for each of the sample are presented in Fig. 2. Samples were grouped based on depth for analysis and comparison purpose as Group A (chlorophyll a maximum-zone, 0–30 m), Group B (Halocline-zone, 75–100 m), Group C (O2 minimum-zone, 200–1 000 m), Group D (deep water, ≥2 000 m).

Sequence reads with an average of 371 bp were generated after trimming the primer sequences from the beginning and end of the raw data. A total of 4 720 089 valid reads and 48 188 OTUs (at the 97% level, corresponding to taxonomically valid species) were obtained from the 63 seawater samples of 8 stations (Table 2). In addition, the Good’s coverage values of all libraries were ≥99% (Table 3), indicating that the libraries adequately reflected the bacterial communities of the samples.
| Station ID | Raw_reads | Clean_reads | Average length/nt | Unique_tag | operation taxonomic unit |
| DZ04 | 85 925.29 | 80 431.86 | 371.28 | 17 794.43 | 746.71 |
| D506 | 81 482.22 | 76 914.56 | 370.88 | 22 243.22 | 785.66 |
| DA03 | 87 184.57 | 76 857.00 | 370.71 | 20 270.71 | 888.42 |
| D510 | 79 533.43 | 74 742.14 | 371.57 | 23 185.29 | 714.14 |
| HSA | 74 749.29 | 59 261.86 | 371.14 | 18 102.29 | 550.28 |
| SR0107 | 80 856.36 | 77 193.55 | 370.72 | 22 337.00 | 913.54 |
| D311 | 78 915.67 | 74 208.17 | 371.50 | 21 128.17 | 682.66 |
| D305 | 80 973.11 | 77 158.89 | 370.66 | 25 446.78 | 741.66 |
DownLoad:
CSV
| Number | Depth/m | Observed species | Shannon | Simpson | Chao1 | ACE | Good’s coverage |
| Vertical.1 | 0 | 408.37 | 5.36 | 0.94 | 537.09 | 537.74 | 0.99 |
| Vertical.2 | 30 | 416.50 | 5.53 | 0.94 | 528.94 | 540.14 | 0.99 |
| Vertical.3 | 75 | 534.75 | 5.91 | 0.95 | 648.74 | 662.71 | 0.99 |
| Vertical.4 | 100 | 632.25 | 6.13 | 0.95 | 793.81 | 787.07 | 0.99 |
| Vertical.5 | 200 | 769.83 | 6.22 | 0.94 | 962.32 | 982.97 | 0.99 |
| Vertical.6 | 500 | 849.42 | 6.57 | 0.95 | 1 040.85 | 1 051.24 | 0.99 |
| Vertical.7 | 1 000 | 874.00 | 6.62 | 0.96 | 1 074.29 | 1 078.05 | 0.99 |
| Vertical.8 | ≥2 000 | 875.00 | 6.49 | 0.96 | 1 092.54 | 1 095.79 | 0.99 |
DownLoad:
CSV
The taxonomic data covered a broad spectrum of known microbial phyla. The microbial community composition was similar among the different stations, but the relative abundances were different; the dominant phylum was Pseudomonadota (orginal name: Proteobacteria; Oren and Garrity, 2021), which comprised approximately 48% of the total abundance. The second most abundant phylum was Oxyphotobacteria, which accounted for approximately 24% of the total. The third most abundant phylum was Bacteroidota (original name: Bacteroidetes; Oren and Garrity, 2021), which comprised approximately 18%. These three phyla accounted for an average of 90% (range: 83%–99%) of the total OTUs in all samples (Fig. S1).
We investigated the differences in microbial community composition at different depths. At vertical level (Fig. 3a), the dominant phylum was also Pseudomonadota, Oxyphotobacteria, Bacteroidota, these three phyla accounted for an average of 91% (range: 99%, 95%, 83%, 84%) of the total OTUs from epipelagic to bathypelagic water column. The higher abundance of Archaea (Thaumarchaeota and Euryarchaeota) phyla was found in Group C and Group D water column samples (4.3%, 3.4%; 1.7%, 1.6%). Moreover, compared with Group A and Group B, there are higher abundance of Actinobacteria , Nitrospinota (original name: Nitrospinae; Oren and Garrity, 2021), Planctomycetota (original name: Planctomycetes; Oren and Garrity, 2021) and Verrucomicrobiota (original name: Verrucomicrobia; Oren and Garrity, 2021) in Group C (1.7%, 1.7%, 1.6%, 1.3%) and Group D (1.8%, 0.7%, 1.7%, 1.2%).

In class level (Fig. 3b), the dominant phylum was unidentified Oxyphotobacteria, Gammaproteobacteria, Alphaproteobacteria, Bacteroidia, these four phyla accounted for an average of 87% (range: 79%–95%) of the total OTUs from Group A to Group D. Higher abundance of Nitrososphaeria, unidentified Bacteria, Thermoplasmata, Acidimicrobiia, Nitrospinia and Deltaproteobacteria were existed at Group C (4.3%, 1.6%, 1.7%, 1.6%, 1.7%, 2.7%) and Group D (3.4%, 1.9%, 1.6%, 1.7%, 0.7%, 2.4%).
In genus level (Fig. 3c), the dominant phylum was unidentified Oxyphotobacteria and unidentified Alphaproteobacteria, these two phyla accounted for an average of 35% (range: 43%–29%) of the total OTUs from Group A to Group D. Higher abundance of unidentified Flavobacteriaceae (3.2%), Planktomarina (4.9%) was found at Group A, higher abundance of SUP05 cluster (5.6%) and Planktomarina (4.1%) was found at Group B, higher abundance of SUP05 cluster (5.5%), Marinobacter (4.8%), Alcanivorax (5.1%) was found at Group C. However, there higher abundance of Zunongwangia (3.3%) and Leeuwenhoekiella (3.0%) were existed at Group D.
Alpha diversity indices of all the samples are presented in Table 3. In general, the microbial community diversity and richness was increased from surface to bathypelagic water column samples.
In general, higher richness (Chao1 value) and higher bacterial community diversity (observed species and Shannon index) were observed with increasing water depth for almost all stations. In the epipelagic water column (Group A), the observed species were 408.37 and 416.5, the Chao1 values were 537.09 and 528.94, and the Shannon index values were 5.36 and 5.53, respectively. In the mesopelagic zone (Group B), higher observed species, Chao1 and Shannon index values were observed, with values of 534.75 and 632.25, 648.74 and 793.81, and 5.91 and 6.13, respectively. In Group C (O2 minimum-zone, 200–1 000 m), the observed species were 769.83, 849.42 and 832.5, the Chao1 values were 962.32, 1 040.85 and 1 040.89 and the Shannon index values were 6.22, 6.57 and 6.48, respectively. In the bathypelagic region (Group D), the observed species was 875, the Chao1 values was 1 092.54 and the Shannon index values was 6.49, respectively. There was little difference in Simpson index values among the different group.
Cluster analysis of the microbial community composition at phylum level revealed similar community composition among different depth of water column. However, UPGMA clustering result showed that the community composition was more similar between epipelagic (Group A) and mesopelagic (Group B) water column samples groupings, and more similar between O2 minimum-zone (Group C) and bathypelagic (Group D) water column samples groupings (Fig. 4).

The PCoA analysis exhibited a similar trend that community composition of water column was consistent with depth at all sites. In general, community composition was more similar between surface and mesopelagic water column samples, and more similar between O2 minimum-zone and bathypelagic water column samples (Fig. 5).

In general, the microbial community compositions were similar within the same depth regions, but predominant prokaryotic communities were detected in each of depth water column. The LDA scores showed that bacterial community abundances varied between the different depth regions. Thirty-four clades were found to have higher abundance in the bacterial community (LDA score >4) of these samples ( Fig. 6). Of which, there are 12 clades with higher abundance in the bacterial community of surface water column samples (Group A), where high abundance of Bacteroidota, including Bacterodia, Cryomorphaceae, Flavobacteriales, Flavobacteriaceae, Polaribacter, Polaribacter irgensii; Pseudomonadota, including Rhodobacterales, Rhodobacteraceae, and Planktomarinam, which was belonged to Planctomycetes. In Group B, seven clades were identified with high abundance including Alphaproteobacteria, Candidatus pelagibacter and Gammaproteobacteria. In Group C, there were 20 clades with high abundance in the prokaryotic community that were highest among those described all the four groups, high abundance of Deltaproteobacteria; Gammaproteobacteria, including Pseudomonadales, Moraxellaceae, Psychrobacter, Alcanivoracaceae, Alcanivorax, Marinobacter and Nitrososphaeria, including Nitrosopumilales, Nitrosopumilaceae; uncultured SUP05 cluster bacterium; moreover, high abundance of Archaea, including Thaumarchaeota, was found in this group. In bathypelagic region (Group D); high abundance of Alteromonadales, and Zunongwangia, Leewenhoekiella, which was belonged to Flavobacteriales, were found in this region.

Influence of environmental factors on bacterial community structure analysis was studied in samples among the four groups using CCA (Fig. 7). The CCA results showed that abiotic environmental factors, including DO concentration, temperature, salinity, geographical environment factors (depth and geographical distance (PCNM)), and biotic environmental factors (Chl a and TOC) have obviously correlation with microbial community, these factors act alone or together to affect the microbial community diversity and distribution pattern of seawater (Table S1).

The Spearman result demonstrated the variations in the distribution pattern of specific dominant phylum with respect to DO, salinity, Chl a, TOC and depth (Fig. S2a). Bacterial phyla including Bacteroidota, Oxyphotobacteria, which showed relatively higher abundance in Group A samples (0 and 30 m) were found to be significantly positively correlated to the DO and Chl a, but negatively related to salinity and depth indicating their dominance at surface of sea column with higher DO and Chl a level.
On the contrary, the phyla Planctomycetota, Verrucomicrobiota, Acidobacteria, and Nitrospinota, which were predominantly observed in Group C (200 m, 500 m and 1 000 m) and Group D (≥2 000 m) samples correlated positively with depth and salinity but negatively related to DO and Chl aconcentrations, indicating their dominance at lower DO level of bathypelagic zone. Archaeal phyla including Euryarchaeota, Thaumarchaeota, which were predominantly observed in O2 minimum-zone samples (200 m, 500 m and >1 000 m) significantly positively related to the depth and salinity, but negatively related to DO and Chl a concentrations. Almost all species were positively related to the TOC, but except Fibrobacteres, these species correlation with TOC did not reach statistical significance.
Spearman results showed that environmental factors have influence not only on community composition but also prokaryotic diversity. Figure S2b showed that depth and salinity were found to be significantly positively related to PD_whole_tree, ACE indices, Chao1 indices, Shannon indices and observed_species, but significantly negatively related to goods_coverage indices. On the contrary, DO and Chl a level were positively related to goods_coverage indices, but significantly negatively related to PD_whole_tree, ACE indices, Chao1 indices, Shannon indices and observed_species. Almost all the diversity indices were positively related to TOC and negatively related to temperature, but these differences did not reach statistical significance.
The contribution of water traits (depth, temperature, salinity, and DO), and biotic factor (Chl a) to networked communities was illustrated with Variance Partitioning Analysis and found that the networked community was only weakly affected by those environmental factors, which only explained 23.77% of the variation, leaving 76.23% of the variation unexplained (Fig. S3).
To explore the potential function of microbial communities in terms of biogeochemical cycling, we used FAPROTAX software to predict the functional classification based on species information. The results predicted more than ten mainly functional classifications such as chemoheterotrophy, carbon, nitrogen, phosphorus and sulfur circulation, animal and human pathogens, and methane generation and fermentation, among others.
When the frequency of each annotated function was compared among different depth region, the relative abundances of the reads were surprisingly different (Fig. 8). At the surface of the water column (Group A), there was high abundance of intracellular_parasites, dark_sulfur_oxidation and dark_sulfite_oxidation. But there was high abundance of methanol_oxidation, methylotrophy, animal_parasites_or_symbionts, human_pathogens and aromatic_compound_degradation, dark_oxidation_of_sulfur_compound, nitrate_reduction, dark_sulfide_oxidation, nitrogen respiration and nitrate respiration, that were found at Group B (75 m and 100 m). In O2 minimum-zone (Group C), high abundance of nitrite_ammonification, human_pathogens_diarrhea, fumarate_respiraton, human_pathogens_gastroenteritis, ureolysis, aerobic_nitrite_oxidation, nitrification, sulfate_respiration, human_gut, mammal_gut, respiration_of_sulfur_compound, functions were found. However, there was high abundance of chemoheterotrophy, aerobic_chemoheterotrophy, dark_hydrogen_oxidation, denitrification, nitrite_denitrification, nitrous_oxide_denitrification, fermentation, hydrocarbon_degradation existed at bathypelagic zone (Group D).

The Southern Ocean is expansive with many environmental variables that might affect community composition, but phyla Pseudomonadota, Oxyphotobacteria, and Bacteroidota were the three most abundant phyla, while they also dominate the microbial population in temperate or tropical marine environments (Wilkins et al., 2012). In this study, variation in microbial phylotypes along the water depth in Antarctic Peninsula region of the Southern Ocean was investigated. Although changes in community composition with depth have previously been documented, but studies of taxonomic richness with depth of the Southern Ocean have few reports. The present study revealed significantly higher abundance of Pseudomonadota, which by previous reports were found to be the dominant bacterial phyla across global ocean primarily responsible for nitrogen fixation at various depths (Loescher et al., 2014; Jayakumar et al., 2017). At surface, higher abundance of Oxyphotobacteria (also known as blue-green bacteria) are important primary producers, with some taxa capable of fixing both atmospheric carbon and nitrogen (Hartmann et al., 2014; Karlson et al., 2015). These bacteria attach to phytoplankton aggregates and efficiently degrade and preferentially consume high-molecular-mass organic matter, rather than monomeric organic compounds, as primary carbon and energy sources (Ward, 1996). Moreover, high abundance of Bacteroidota in Group A was in line with earlier reports suggesting the presence of the members of the phylum in surface waters (Jayakumar et al., 2017; Fandino et al., 2001). Marine Bacteroidetes, in general, and marine Flavobacteriia, in particular, have been ascribed to act as degraders of biopolymers, such as proteins and polysaccharides (Thomas et al., 2011).
The microbial community structure varies with changes in DO levels, depth, and temperature (Wright et al., 2012; Aldunate et al., 2018), especially, the relationship between oxygen and taxonomic richness suggests that respiration might have a significant role in shaping bacterial richness in the open ocean (Walsh et al., 2016). In present study, there are obviously O2 minimum-zone existed between 200–1 000 m (Fig. 2), which is usually formed due to higher primary productivity on the surface. Samples collected from oxygen-minimum depths (200 m, 500 m and 1 000 m) had higher abundance of Gammaproteobacteria as compared to other samples. Previous studies reported that various Gammaproteobacterial groups have been detected in the Southern Ocean waters (Murray and Grzymski, 2007; Grzymski et al., 2012; Wilkins et al., 2012; Williams et al., 2012). These chemoorganotrophs are also putative sulfur-oxidizers with the potential for autotrophic denitrification coupled with sulfur oxidation (Goffredi et al., 2004). Sulfur oxidation had been suggested to be the primary process of energy metabolism driving deep-sea vent ecosystems (Nakagawa et al., 2005).
Moreover, relatively higher proportion of Deltaproteobacteria was observed in the bathypelagic water column than in other depth water columns. Deltaproteobacteria have rarely been detected at high abundance in surface waters (Venter et al., 2004), and this is also the case for the Southern Ocean (Murray and Grzymski, 2007; West et al., 2008; Murray et al., 2011; Ducklow et al., 2011; Ghiglione and Murray, 2012; Jamieson et al., 2012; Wilkins et al., 2012). The Deltaproteobacteria participate in carbon fixation via the Calvin cycle and in sulfur oxidation, as well as oxidation of methylated compounds (Swan et al., 2011), therefore members of this class might be significant contributors to chemoautotrophy in the dark ocean (Swan et al., 2011).
In addition, there are relatively higher abundance of Archaea, such as Thaumarchaeota, existed at Group C. Studies have increasingly reported that members of the Thaumarchaeota are among the most important ammonia-oxidizing organisms and play important roles in the nitrogen cycles of marine environments (Francis et al., 2007; Mincer et al., 2007).
One of the remarkable features of deep ocean is high pressure, correspondingly, significant abundance of piezophilic bacterial group, such as Alteromonadales, was detected at depth more than 2 000 m of bathypelagic zone. These piezophilic microbial groups could break down the high molecular weight particulate organic matter to dissolved organic matter, by of which they play an important role in regulating the global ocean carbon cycle.
Although environmental parameters, including depth, DO concentration, Chl a concentration, salinity, temperature, significantly contributed to the prokaryotic diversity and community distribution, but in present study, which only explained 23.77% of the variation, leaving 76.23% of the variation unexplained. Previous studies have shown that microbial communities are unique to each water body (Esper and Zonneveld, 2002; Ward et al., 2003; Selje et al., 2004; Abell and Bowman, 2005) which will be affected in a unique way by climate change and anthropogenic impact (Brown et al., 2012). Meanwhile, this phenomenon is consistent with the old adage, “Everything is everywhere but the environment selects”, in which microorganisms are considered to be ubiquitously dispersed because of their small size, large numbers and low extinction rates (Walsh et al., 2016).
The Shannon index and Chao1 value were chosen to reflect the degree of bacterial community diversity and richness; higher Shannon indices indicated higher diversity of the bacterial community and higher Chao1 values indicated higher richness of the bacterial community (Liu et al., 2017). In present study, water column bacterial communities at all sites exhibited a clear depth profile, with samples declining in similarity from the sea surface to the abyssopelagic waters; overall, diversity in the water column is generally lowest at the ocean surface and highest in the bathypelagic zone. Our results were in accordance with previously described trends (DeLong et al., 2006; Brown et al., 2009; Treusch et al., 2009). Although changes in community composition with depth have previously been well documented, studies of taxonomic richness with depth have yielded mixed results. Our results showed that bacterial richness in the water column was lowest at the surface and highest within the bathypelagic zone at each of our sites, which was in accordance with previous studies that have reported higher richness in the deeper water column (Pommier et al., 2010; Kembel et al., 2011; Ghiglione et al., 2012), whereas others have reported declines in taxonomic richness with increasing ocean depth (Brown et al., 2009; Agogué et al., 2011; Bryant et al., 2012).
Our Spearman results showed that diversity induces, such as ACE, Chao1, Shannon, and observed_species, were obviously positively correlated with depth and salinity concentrations. Conversely, these diversity were obviously negatively correlated with DO and Chl a concentrations. Water traits showed higher Chl a level at surface and oxygen minimum zone at Group B, high productivity in surface water can lead to the formation of oxygen deficient zones in deeper water, where unique communities may form in response to the deoxygenation (Beman and Carolan, 2013), which is one of the important condition for higher microbial biodiversity at deeper water.
Many environmental variables, such as DO concentrations, depth, Chl a concentrations, salinity, temperatures and TOC concentrations, might affect microbial community composition and function. In present study, the chlorophyll a maximum was strongly developed at epipelagic water column samples (0–30 m) located above the depth of the Halocline-zone and, a pronounced O2 minimum zone located below the Halocline-zone between 200 m to 1 000 m. Consistent with environmental parameters, the functional prediction results showed that obviously different metabolism function along the vertical transect was observed in this study. Higher abundance of nitrogen-metabolizing function in Group C samples could be ascribed to the significant presence of Nitrospinae, which was predominantly observed in O2 minimum zone samples negatively related to DO. At bathypelagic zone, higher abundance of dark hydrogen oxidation, denitrification, hydrocarbon degradation and chemoheterotrophy-metabolizing function existed at this region could well be associated with the abundant presence of piezophilic community, such as Zunogwangia and Leeuwenhoekiella, which were belonged to Alteromonadales. As mentioned previously, FAPROTAX provides a prediction of microbiome function but not an actual measurement of such function (Cleary et al., 2015). The results, however, still provide some interesting insights into potential bacterial community function that, in the future, should be tested with studies that measure actual gene presence or expression.
Our study provides the first profiles of prokaryotic diversity and community composition at different depth water column samples in Antarctic Peninsula region based on HTS. In general, the microbial community diversity and richness increased from surface to bathypelagic water column samples. Although Pseudomonadota, Oxyphotobacteria, and Bacteroidota dominated the prokaryotic communities in different depth regions, however, distinct differentiation of prokaryotic communities was observed at four sampling regions. Environmental parameters, including depth, DO concentration, Chl a concentration, salinity, temperature, significantly contributed to the prokaryotic diversity and community distribution, but which only explained 23.77% of the variation, leaving 76.23% of the variation unexplained. Consistent with microbial community distribution, the functional prediction results showed that obviously different metabolism function along the vertical transect was observed. The current work will provide baseline information of prokaryotic diversity and community composition at different depth water column samples for better understanding of the microbial ecology and nutrient cycles in Antarctic Peninsula region of the Southern Ocean.
Acknowledgements: This research was supported by the R/VXIANGYANGHONG01 voyage of 34th Antarctic Scientific Investigation of China. We are grateful to all the laboratory members for their technical advice and helpful suggestions.|
Abell G C J, Bowman J P. 2005. Ecological and biogeographic relationships of class Flavobacteria in the Southern Ocean. FEMS Microbiology Ecology, 51(2): 265–277. doi: 10.1016/j.femsec.2004.09.001
|
|
Agogué H, Lamy D, Neal P R, et al. 2011. Water mass-specificity of bacterial communities in the North Atlantic revealed by massively parallel sequencing. Molecular Ecology, 20(2): 258–274. doi: 10.1111/j.1365-294X.2010.04932.x
|
|
Aislabie J M, Jordan S, Barker G M. 2008. Relation between soil classification and bacterial diversity in soils of the Ross Sea region, Antarctica. Geoderma, 144(1−2): 9–20. doi: 10.1016/j.geoderma.2007.10.006
|
|
Aldunate M, De la Iglesia R, Bertagnolli A D, et al. 2018. Oxygen modulates bacterial community composition in the coastal upwelling waters off central Chile. Deep-Sea Research Part II: Topical Studies in Oceanography, 156: 68–79. doi: 10.1016/j.dsr2.2018.02.001
|
|
Beman J M, Carolan M T. 2013. Deoxygenation alters bacterial diversity and community composition in the ocean’s largest oxygen minimum zone. Nature Communications, 4: 2705. doi: 10.1038/ncomms3705
|
|
Brown M V, Lauro F M, DeMaere M Z, et al. 2012. Global biogeography of SAR11 marine bacteria. Molecular Systems Biology, 8: 595. doi: 10.1038/msb.2012.28
|
|
Brown M V, Philip G K, Bunge J A, et al. 2009. Microbial community structure in the North Pacific Ocean. The ISME Journal, 3(12): 1374–1386. doi: 10.1038/ismej.2009.86
|
|
Bryant J A, Stewart F J, Eppley J M, et al. 2012. Microbial community phylogenetic and trait diversity declines with depth in a marine oxygen minimum zone. Ecology, 93(7): 1659–1673. doi: 10.1890/11-1204.1
|
|
Caporaso J G, Kuczynski J, Stombaugh J, et al. 2010. QIIME allows analysis of high-throughput community sequencing data. Nature Methods, 7(5): 335–336. doi: 10.1038/nmeth.f.303
|
|
Chong C W, Dunn M J, Convey P, et al. 2009a. Environmental influences on bacterial diversity of soils on Signy Island, maritime Antarctic. Polar Biology, 32(11): 1571–1582. doi: 10.1007/s00300-009-0656-8
|
|
Chong C W, Goh Y S, Convey P, et al. 2013. Spatial pattern in Antarctica: what can we learn from Antarctic bacterial isolates?. Extremophiles, 17(5): 733–745
|
|
Chong C W, Tan G Y A, Wong R C S, et al. 2009b. DGGE fingerprinting of bacteria in soils from eight ecologically different sites around Casey Station, Antarctica. Polar Biology, 32(6): 853–860. doi: 10.1007/s00300-009-0585-6
|
|
Cleary D F R, de Voogd N J, Polónia A R M, et al. 2015. Composition and predictive functional analysis of bacterial communities in seawater, sediment and sponges in the Spermonde Archipelago, Indonesia. Microbial Ecology, 70(4): 889–903. doi: 10.1007/s00248-015-0632-5
|
|
DeLong E F, Preston C M, Mincer T, et al. 2006. Community genomics among stratified microbial assemblages in the ocean’s interior. Science, 311(5760): 496–503. doi: 10.1126/science.1120250
|
|
Dinasquet J, Richert I, Logares R, et al. 2017. Mixing of water masses caused by a drifting iceberg affects bacterial activity, community composition and substrate utilization capability in the Southern Ocean. Environmental Microbiology, 19(6): 2453–2467. doi: 10.1111/1462-2920.13769
|
|
Ducklow H W, Myers K M S, Erickson M, et al. 2011. Response of a summertime Antarctic marine bacterial community to glucose and ammonium enrichment. Aquatic Microbial Ecology, 64(3): 205–220. doi: 10.3354/ame01519
|
|
Esper O, Zonneveld K A F. 2002. Distribution of organic-walled dinoflagellate cysts in surface sediments of the Southern Ocean (eastern Atlantic sector) between the Subtropical Front and the Weddell Gyre. Marine Micropaleontology, 46(1−2): 177–208. doi: 10.1016/S0377-8398(02)00041-5
|
|
Fandino L B, Riemann L, Steward G F, et al. 2001. Variations in bacterial community structure during a dinoflagellate bloom analyzed by DGGE and 16S rDNA sequencing. Aquatic Microbial Ecology, 23(2): 119–130
|
|
Fierer N, Breitbart M, Nulton J, et al. 2007. Metagenomic and small-subunit rRNA analyses reveal the genetic diversity of bacteria, archaea, fungi, and viruses in soil. Applied and Environmental Microbiology, 73(21): 7059–7066. doi: 10.1128/AEM.00358-07
|
|
Francis C A, Beman J M, Kuypers M M M. 2007. New processes and players in the nitrogen cycle: the microbial ecology of anaerobic and archaeal ammonia oxidation. The ISME Journal, 1(1): 19–27. doi: 10.1038/ismej.2007.8
|
|
Fuhrman J A, Cram J A, Needham D M. 2015. Marine microbial community dynamics and their ecological interpretation. Nature Reviews Microbiology, 13(3): 133–146. doi: 10.1038/nrmicro3417
|
|
Ghiglione J F, Galand P E, Pommier T, et al. 2012. Pole-to-pole biogeography of surface and deep marine bacterial communities. Proceedings of the National Academy of Sciences, 109(43): 17633–17638. doi: 10.1073/pnas.1208160109
|
|
Ghiglione J F, Murray A E. 2012. Pronounced summer to winter differences and higher wintertime richness in coastal Antarctic marine bacterioplankton. Environmental Microbiology, 14(3): 617–629. doi: 10.1111/j.1462-2920.2011.02601.x
|
|
Giovannoni S J, Stingl U. 2005. Molecular diversity and ecology of microbial plankton. Nature, 437(7057): 343–348. doi: 10.1038/nature04158
|
|
Giovannoni S J, Vergin K L. 2012. Seasonality in ocean microbial communities. Science, 335(6069): 671–676. doi: 10.1126/science.1198078
|
|
Goffredi S K, Waren A, Orphan V J, et al. 2004. Novel forms of structural integration between microbes and a hydrothermal vent gastropod from the Indian Ocean. Applied and Environmental Microbiology, 70(5): 3082–3090. doi: 10.1128/AEM.70.5.3082-3090.2004
|
|
Grzymski J J, Riesenfeld C S, Williams T J, et al. 2012. A metagenomic assessment of winter and summer bacterioplankton from Antarctica Peninsula coastal surface waters. The ISME Journal, 6(10): 1901–1915. doi: 10.1038/ismej.2012.31
|
|
Hammer Ø, Harper D A T, Ryan P D. 2001. PAST: Palaeontological Statistics Software Package for Education and Data Analysis. Palaeontologia Electronica, 4(1): 1–9
|
|
Hartmann M, Gomez-Pereira P, Grob C, et al. 2014. Efficient CO2 fixation by surface Prochlorococcus in the Atlantic Ocean. The ISME Journal, 8(11): 2280–2289
|
|
Jamieson R E, Rogers A D, Billett D S M, et al. 2012. Patterns of marine bacterioplankton biodiversity in the surface waters of the Scotia Arc, Southern Ocean. FEMS Microbiology Ecology, 80(2): 452–468. doi: 10.1111/j.1574-6941.2012.01313.x
|
|
Jayakumar A, Chang B X, Widner B, et al. 2017. Biological nitrogen fixation in the oxygen-minimum region of the eastern tropical North Pacific Ocean. The ISME Journal, 11(10): 2356–2367. doi: 10.1038/ismej.2017.97
|
|
Karlson A M L, Duberg J, Motwani N H, et al. 2015. Nitrogen fixation by cyanobacteria stimulates production in Baltic food webs. AMBIO, 44(S3): 413–426. doi: 10.1007/s13280-015-0660-x
|
|
Kembel S W, Eisen J A, Pollard K S, et al. 2011. The phylogenetic diversity of metagenomes. PLoS ONE, 6(8): e23214. doi: 10.1371/journal.pone.0023214
|
|
Landa M, Blain S, Christaki U, et al. 2016. Shifts in bacterial community composition associated with increased carbon cycling in a mosaic of phytoplankton blooms. The ISME Journal, 10(1): 39–50. doi: 10.1038/ismej.2015.105
|
|
Laws E A, Falkowski P G, Smith Jr W O, et al. 2000. Temperature effects on export production in the open ocean. Global Biogeochemical Cycles, 14(4): 1231–1246. doi: 10.1029/1999GB001229
|
|
Liu Ning, Zhou Jialiang, Han Lujia, et al. 2017. Role and multi-scale characterization of bamboo biochar during poultry manure aerobic composting. Bioresource Technology, 241: 190–199. doi: 10.1016/j.biortech.2017.03.144
|
|
Loescher C R, Großkopf T, Desai F D, et al. 2014. Facets of diazotrophy in the oxygen minimum zone waters off Peru. The ISME Journal, 8(11): 2180–2192. doi: 10.1038/ismej.2014.71
|
|
Manganelli M, Malfatti F, Samo T J, et al. 2009. Major role of microbes in carbon fluxes during austral winter in the southern drake passage. PLoS ONE, 4(9): e6941. doi: 10.1371/journal.pone.0006941
|
|
Mincer T J, Church M J, Taylor L T, et al. 2007. Quantitative distribution of presumptive archaeal and bacterial nitrifiers in Monterey Bay and the North Pacific subtropical gyre. Environmental Microbiology, 9(5): 1162–1175. doi: 10.1111/j.1462-2920.2007.01239.x
|
|
Murray A E, Grzymski J J. 2007. Diversity and genomics of Antarctic marine micro-organisms. Philosophical Transactions of the Royal Society B: Biological Sciences, 362(1488): 2259–2271. doi: 10.1098/rstb.2006.1944
|
|
Murray A E, Peng V, Tyler C, et al. 2011. Marine bacterioplankton biomass, activity and community structure in the vicinity of Antarctic icebergs. Deep-Sea Research Part II: Topical Studies in Oceanography, 58(11−12): 1407–1421. doi: 10.1016/j.dsr2.2010.11.021
|
|
Nakagawa S, Takai K, Inagaki F, et al. 2005. Distribution, phylogenetic diversity and physiological characteristics of epsilon-Proteobacteria in a deep-sea hydrothermal field. Environmental Microbiology, 7(10): 1619–1632. doi: 10.1111/j.1462-2920.2005.00856.x
|
|
Oren A, Garrity G M. 2021. Valid publication of the names of forty-two phyla of prokaryotes. International Journal of Systematic and Evolutionary Microbiology, 71(10): 005056
|
|
Park P K. 1969. A practical handbook of seawater analysis. Fisheries Research Board of Canada Bulletin 167. J. D. H. Strickland, T. R. Parsons. The Quarterly Review of Biology , 44 (3): 327.
|
|
Pommier T, Neal P R, Gasol J M, et al. 2010. Spatial patterns of bacterial richness and evenness in the NW Mediterranean Sea explored by pyrosequencing of the 16S rRNA. Aquatic Microbial Ecology, 61(3): 221–233. doi: 10.3354/ame01484
|
|
R D Core Team. 2008. R: A Language and Environment for Statistical Computing. Vienna, Austria: R Foundation for Statistical Computing. http://www.R-project.org, ISBN 3-900051-07-0"[2022-03-21/2022-03-23]
|
|
Segata N, Izard J, Waldron L, et al. 2011. Metagenomic biomarker discovery and explanation. Genome Biology, 12(6): R60. doi: 10.1186/gb-2011-12-6-r60
|
|
Selje N, Simon M, Brinkhoff T. 2004. A newly discovered Roseobacter cluster in temperate and polar oceans. Nature, 427(6973): 445–448. doi: 10.1038/nature02272
|
|
Shivaji S, Kumari K, Kishore K H, et al. 2011. Vertical distribution of bacteria in a lake sediment from Antarctica by culture-independent and culture-dependent approaches. Research in Microbiology, 162(2): 191–203. doi: 10.1016/j.resmic.2010.09.020
|
|
Swan B K, Martinez-Garcia M, Preston C M, et al. 2011. Potential for chemolithoautotrophy among ubiquitous bacteria lineages in the dark ocean. Science, 333(6047): 1296–1300. doi: 10.1126/science.1203690
|
|
The Human Microbiome Project Consortium. 2012. Structure, function and diversity of the healthy human microbiome. Nature, 486(7402): 207–214. doi: 10.1038/nature11234
|
|
Thomas F, Hehemann J H, Rebuffet E, et al. 2011. Environmental and gut Bacteroidetes: the food connection. Frontiers in Microbiology, 2: 93
|
|
Torstensson A, Dinasquet J, Chierici M, et al. 2015. Physicochemical control of bacterial and protist community composition and diversity in Antarctic sea ice. Environmental Microbiology, 17(10): 3869–3881. doi: 10.1111/1462-2920.12865
|
|
Treusch A H, Vergin K L, Finlay L A, et al. 2009. Seasonality and vertical structure of microbial communities in an ocean gyre. The ISME Journal, 3(10): 1148–1163. doi: 10.1038/ismej.2009.60
|
|
Venkatachalam S, Matcher G F, Lamont T, et al. 2019. Influence of oceanographic variability on near-shore microbial communities of the sub-Antarctic Prince Edward Islands. Limnology and Oceanography, 64(1): 258–271. doi: 10.1002/lno.11035
|
|
Venter J C, Remington K, Heidelberg J F, et al. 2004. Environmental genome shotgun sequencing of the Sargasso Sea. Science, 304(5667): 66–74. doi: 10.1126/science.1093857
|
|
Walsh E A, Kirkpatrick J B, Rutherford S D, et al. 2016. Bacterial diversity and community composition from seasurface to subseafloor. The ISME Journal, 10(4): 979–989. doi: 10.1038/ismej.2015.175
|
|
Walsh E A, Smith D C, Sogin M L, et al. 2015. Bacterial and archaeal biogeography of the deep chlorophyll maximum in the South Pacific Gyre. Aquatic Microbial Ecology, 75(1): 1–13. doi: 10.3354/ame01746
|
|
Ward B B. 1996. Nitrification and ammonification in aquatic systems. Life Support and Biosphere Science: International Journal of Earth Space, 3: 25–29
|
|
Ward P, Whitehouse M, Brandon M, et al. 2003. Mesozooplankton community structure across the Antarctic Circumpolar Current to the north of South Georgia: Southern Ocean. Marine Biology, 143(1): 121–130. doi: 10.1007/s00227-003-1019-6
|
|
West N J, Obernosterer I, Zemb O, et al. 2008. Major differences of bacterial diversity and activity inside and outside of a natural iron-fertilized phytoplankton bloom in the Southern Ocean. Environmental Microbiology, 10(3): 738–756. doi: 10.1111/j.1462-2920.2007.01497.x
|
|
Wilkins D, Lauro F M, Williams T J, et al. 2013a. Biogeographic partitioning of Southern Ocean microorganisms revealed by metagenomics. Environmental Microbiology, 15(5): 1318–1333. doi: 10.1111/1574-6976.12007
|
|
Wilkins D, van Sebille E, Rintoul S R, et al. 2013b. Advection shapes Southern Ocean microbial assemblages independent of distance and environment effects. Nature Communications, 4: 2457. doi: 10.1038/ncomms3457
|
|
Wilkins D, Yau S, Williams T J, et al. 2012. Key microbial drivers in Antarctic aquatic environments. FEMS Microbiology Reviews, 37(3): 303–335
|
|
Williams T J, Long E, Evans F, et al. 2012. A metaproteomic assessment of winter and summer bacterioplankton from Antarctic Peninsula coastal surface waters. The ISME Journal, 6(10): 1883–1900. doi: 10.1038/ismej.2012.28
|
|
Wright J J, Konwar K M, Hallam S J. 2012. Microbial ecology of expanding oxygen minimum zones. Nature Reviews Microbiology, 10(6): 381–394. doi: 10.1038/nrmicro2778
|
|
Yergeau E, Bokhorst S, Huiskes A H L, et al. 2007a. Size and structure of bacterial, fungal and nematode communities along an Antarctic environmental gradient. FEMS Microbiology Ecology, 59(2): 436–451
|
|
Yergeau E, Bokhorst S, Kang Sanghoon, et al. 2012. Shifts in soil microorganisms in response to warming are consistent across a range of Antarctic environments. The ISME Journal, 6(3): 692–702. doi: 10.1038/ismej.2011.124
|
|
Yergeau E, Kang Sanghoon, He Zhili, et al. 2007b. Functional microarray analysis of nitrogen and carbon cycling genes across an Antarctic latitudinal transect. The ISME Journal, 1(2): 163–179. doi: 10.1038/ismej.2007.24
|
|
Yergeau E, Newsham K K, Pearce D A, et al. 2007c. Patterns of bacterial diversity across a range of Antarctic terrestrial habitats. Environmental Microbiology, 9(11): 2670–2682. doi: 10.1111/j.1462-2920.2007.01379.x
|
|
Zinger L, Amaral-Zettler L A, Fuhrman J A, et al. 2011. Global patterns of bacterial beta-diversity in seafloor and seawater ecosystems. PLoS ONE, 6(9): e24570. doi: 10.1371/journal.pone.0024570
|


Figures(8) / Tables(3)

Supported by:
Beijing Renhe Information Technology Co. Ltd


| No. | Station | Date (UTC) | Time (UTC) | Latitude | Longitude | Depth/m |
| 1 | SR0107 | 2018-01-02 | 17:42 | 59°57.588' S | 62°18.739'W | 3 237 |
| 2 | DA03 | 2018-01-04 | 9:58 | 60°42.002'S | 53°0.073'W | 456 |
| 3 | D305 | 2018-01-09 | 10:11 | 59°0.040'S | 49°36.002'W | 3 922 |
| 4 | D311 | 2018-01-10 | 16:35 | 62°0.114'S | 48°23.971'W | 3 266 |
| 5 | D506 | 2018-01-20 | 8:01 | 59°29.968'S | 42°30.116'W | 3 001 |
| 6 | D510 | 2018-01-21 | 19:34 | 61°17.989'S | 42°29.975'W | 520 |
| 7 | DZ04 | 2018-01-29 | 1:35 | 60°40.884'S | 48°56.869'W | 1 147 |
| 8 | HS0A | 2018-02-01 | 17:22 | 62°25.914'S | 58°24.620'W | 1 052 |
DownLoad:
CSV
| Station ID | Raw_reads | Clean_reads | Average length/nt | Unique_tag | operation taxonomic unit |
| DZ04 | 85 925.29 | 80 431.86 | 371.28 | 17 794.43 | 746.71 |
| D506 | 81 482.22 | 76 914.56 | 370.88 | 22 243.22 | 785.66 |
| DA03 | 87 184.57 | 76 857.00 | 370.71 | 20 270.71 | 888.42 |
| D510 | 79 533.43 | 74 742.14 | 371.57 | 23 185.29 | 714.14 |
| HSA | 74 749.29 | 59 261.86 | 371.14 | 18 102.29 | 550.28 |
| SR0107 | 80 856.36 | 77 193.55 | 370.72 | 22 337.00 | 913.54 |
| D311 | 78 915.67 | 74 208.17 | 371.50 | 21 128.17 | 682.66 |
| D305 | 80 973.11 | 77 158.89 | 370.66 | 25 446.78 | 741.66 |
DownLoad:
CSV
| Number | Depth/m | Observed species | Shannon | Simpson | Chao1 | ACE | Good’s coverage |
| Vertical.1 | 0 | 408.37 | 5.36 | 0.94 | 537.09 | 537.74 | 0.99 |
| Vertical.2 | 30 | 416.50 | 5.53 | 0.94 | 528.94 | 540.14 | 0.99 |
| Vertical.3 | 75 | 534.75 | 5.91 | 0.95 | 648.74 | 662.71 | 0.99 |
| Vertical.4 | 100 | 632.25 | 6.13 | 0.95 | 793.81 | 787.07 | 0.99 |
| Vertical.5 | 200 | 769.83 | 6.22 | 0.94 | 962.32 | 982.97 | 0.99 |
| Vertical.6 | 500 | 849.42 | 6.57 | 0.95 | 1 040.85 | 1 051.24 | 0.99 |
| Vertical.7 | 1 000 | 874.00 | 6.62 | 0.96 | 1 074.29 | 1 078.05 | 0.99 |
| Vertical.8 | ≥2 000 | 875.00 | 6.49 | 0.96 | 1 092.54 | 1 095.79 | 0.99 |
DownLoad:
CSV
| No. | Station | Date (UTC) | Time (UTC) | Latitude | Longitude | Depth/m |
| 1 | SR0107 | 2018-01-02 | 17:42 | 59°57.588' S | 62°18.739'W | 3 237 |
| 2 | DA03 | 2018-01-04 | 9:58 | 60°42.002'S | 53°0.073'W | 456 |
| 3 | D305 | 2018-01-09 | 10:11 | 59°0.040'S | 49°36.002'W | 3 922 |
| 4 | D311 | 2018-01-10 | 16:35 | 62°0.114'S | 48°23.971'W | 3 266 |
| 5 | D506 | 2018-01-20 | 8:01 | 59°29.968'S | 42°30.116'W | 3 001 |
| 6 | D510 | 2018-01-21 | 19:34 | 61°17.989'S | 42°29.975'W | 520 |
| 7 | DZ04 | 2018-01-29 | 1:35 | 60°40.884'S | 48°56.869'W | 1 147 |
| 8 | HS0A | 2018-02-01 | 17:22 | 62°25.914'S | 58°24.620'W | 1 052 |
| Station ID | Raw_reads | Clean_reads | Average length/nt | Unique_tag | operation taxonomic unit |
| DZ04 | 85 925.29 | 80 431.86 | 371.28 | 17 794.43 | 746.71 |
| D506 | 81 482.22 | 76 914.56 | 370.88 | 22 243.22 | 785.66 |
| DA03 | 87 184.57 | 76 857.00 | 370.71 | 20 270.71 | 888.42 |
| D510 | 79 533.43 | 74 742.14 | 371.57 | 23 185.29 | 714.14 |
| HSA | 74 749.29 | 59 261.86 | 371.14 | 18 102.29 | 550.28 |
| SR0107 | 80 856.36 | 77 193.55 | 370.72 | 22 337.00 | 913.54 |
| D311 | 78 915.67 | 74 208.17 | 371.50 | 21 128.17 | 682.66 |
| D305 | 80 973.11 | 77 158.89 | 370.66 | 25 446.78 | 741.66 |
| Number | Depth/m | Observed species | Shannon | Simpson | Chao1 | ACE | Good’s coverage |
| Vertical.1 | 0 | 408.37 | 5.36 | 0.94 | 537.09 | 537.74 | 0.99 |
| Vertical.2 | 30 | 416.50 | 5.53 | 0.94 | 528.94 | 540.14 | 0.99 |
| Vertical.3 | 75 | 534.75 | 5.91 | 0.95 | 648.74 | 662.71 | 0.99 |
| Vertical.4 | 100 | 632.25 | 6.13 | 0.95 | 793.81 | 787.07 | 0.99 |
| Vertical.5 | 200 | 769.83 | 6.22 | 0.94 | 962.32 | 982.97 | 0.99 |
| Vertical.6 | 500 | 849.42 | 6.57 | 0.95 | 1 040.85 | 1 051.24 | 0.99 |
| Vertical.7 | 1 000 | 874.00 | 6.62 | 0.96 | 1 074.29 | 1 078.05 | 0.99 |
| Vertical.8 | ≥2 000 | 875.00 | 6.49 | 0.96 | 1 092.54 | 1 095.79 | 0.99 |
 DownLoad:

 DownLoad:


