Laboratory of Ocean and Coast Geology, Third Institute of Oceanography, Ministry of Natural Resources, Xiamen 361005, China
2.
Fujian Provincial Key Laboratory of Marine Physical and Geological Processes, Xiamen 361005, China
3.
Fujian Provincial Key Laboratory of Marine Ecological Protection and Restoration, Xiamen 361005, China
4.
Xiamen Ocean Engineering Exploration and Design Institute Co. Ltd., Xiamen 361005, China
5.
School of Environment and Resource, Southwest University of Science and Technology, Mianyang 621010, China
Funds:
The Scientific Research Foundation of Third Institute of Oceanography, Ministry of Natural Resources under contract Nos 2018028, 2019005 and 2019018; the Science and Technology Project in Fujian Province, China under contract No. 2021H0041.
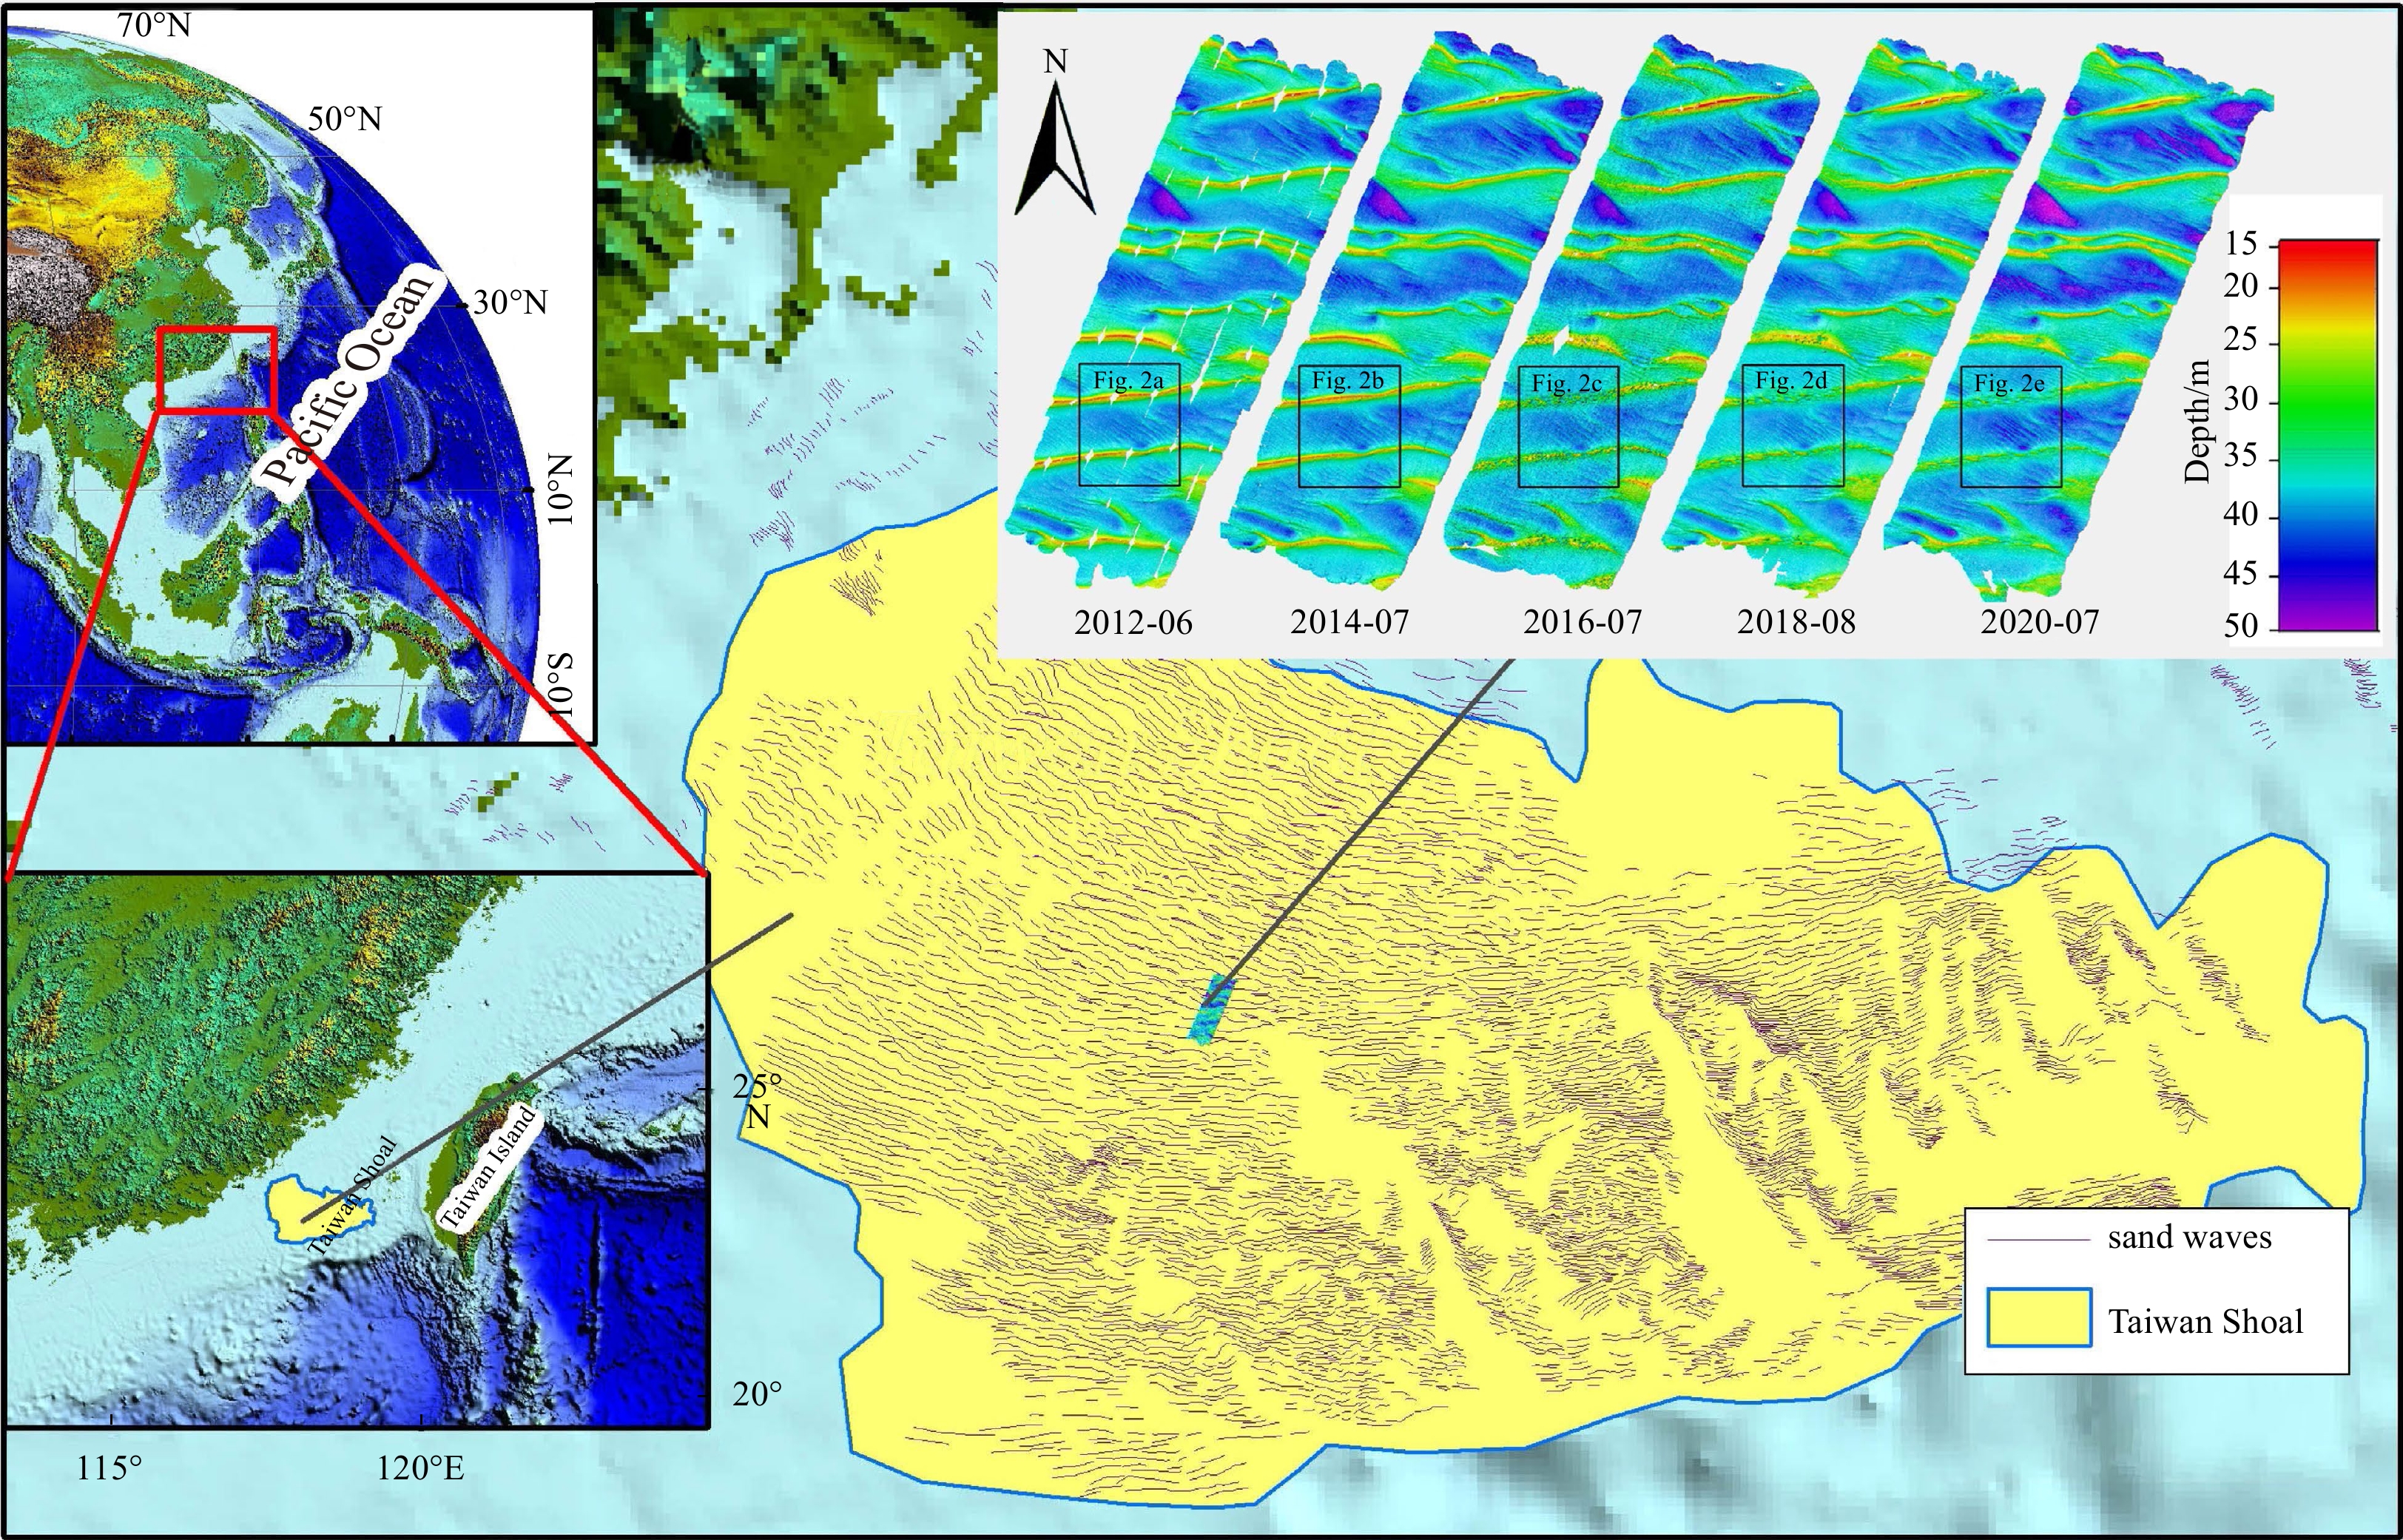
Sand waves in the Taiwan Shoal are characterized by two distinct spatial scales. Giant sand waves have a length of 2 kilometers with height between 5 m and 25 m, whilst small sand waves is less than 100-m long with height less than 5 m between giant sand wave peaks (crests). A series of five high-resolution multi-beam echo-sounding surveys between 2012 and 2020 in the middle of Taiwan Shoal indicated that artificial dredging on the giant sand waves had caused sand wave reform and evolution. Overall, the removal of giant sand waves significantly affected the migration of small sand waves adjacent to the dredging site, with the latter on both sides of the former appear to migrate towards the dredging pit. Moreover, in the dredging area, new sand waves emerged with wavelength much smaller than the original giant sand waves, while the convergent pattern of the small sand waves tends to store and form the giant sand waves, which might spread far beyond the survey period.
The co-occurrence of two or more pollutants is common in aquatic environments, especially in areas with high human activity. Certain environmental pollutants can easily interact, causing unexpected combined toxicity to aquatic organisms. For example, nanoplastics decrease the developmental toxicity caused by polycyclic aromatic hydrocarbons (PAHs) (Trevisan et al., 2019), but enhance the cardiac toxicity induced by DDT in zebrafish larvae (Varshney et al., 2023). Therefore, to fully assess the ecological risk of an environmental pollutant, it is crucial not only to clarify the individual effects, but also to understand its interaction and combined effects with concomitant pollutants.
Plastics have been used intensively by human society for more than 50 years, and the consequent environmental problems caused by plastics have received much attention in recent years. Marine ecosystems are severely suffering from plastic pollution, as about 10% of annual plastic production ends up in the oceans (Avio et al., 2015). Once entering the oceans, plastic debris keeps releasing microplastics (smaller than 5 mm) and nanoplastics (smaller than 1 μm) under environmental weathering (Andrady, 2011). The reported environmental concentrations of microplastics and nanoplastics are up to 10 000 mg/L in marine surface waters (Allen et al., 2022). A recent study shows that the average concentration of nanoplastics for Antarctic sea ice is 52.3 ng/ml (Materić et al., 2022), indicating a high prevalence of nanoplastics in the oceans. Aquatic organisms can ingest microplastics and nanoplastics passively and actively (Li et al., 2021). The ingested microplastics and nanoplastics can be transferred to and accumulated in many organs, leading to various adverse effects such as shortened lifespan, aging acceleration, metabolic disorders, neural dysfunctions, etc (Xiang et al., 2022; Abdolahpur Monikh et al., 2023; Xiao et al., 2023). Additionally, microplastics and nanoplastics with large surface/volume ratios and hydrophobicity have a high adsorption capacity for other pollutants, resulting in combined toxicity (Wang et al., 2016).
As another widespread anthropogenic pollutant, antibiotics have been frequently detected in the water ranging from ng/L to μg/L. Sulfamethazine (SMZ) is one of the most commonly used sulfonamide antibiotics. The environmental concentration of SMZ can be over 1 000 ng/L in some aquatic environments, higher than many other sulfonamide antibiotics (Zhao et al., 2016; Bu et al., 2013; Ji et al., 2012). For instance, the maximum concentration of SMZ in the Huangpu River is 623.27 ng/L, much higher than that of sulfapyridine (57.39 ng/L), sulfadiazine (40.55 ng/L), sulfamethoxazole (55.24 ng/L), sulfachlororyridazine (58.29 ng/L), oxytetracycline (37.17 ng/L), chlortetracycline (16.80 ng/L), florfenicol (46.63 ng/L), etc (Jiang et al., 2011). Exposure to SMZ inhibits microalgae growth, hampers crustacean reproduction, and causes developmental malformation in fish embryos (De Liguoro et al., 2009; Yan et al., 2018). Furthermore, SMZ is easily adsorbed on different types of microplastics and nanoplastics (including PS, PE, PET, PP, etc.) with partition coefficient Kd values ranging from 15.1 L/kg to 38.7 L/kg (Guo et al., 2019), higher than that of other antibiotics, such as sulfadiazine-microplastics (ranging from 6.61 L/kg to 7.85 L/kg) and trimethoprim-microplastics (ranging from 8.38 L/kg to 17.1 L/kg) (Li et al., 2018), implying that environmental SMZ and nanoplastics are likely to interact and cause potential combined toxicity. In aquatic environments, pollutants can reach and affect aquatic animals through either a waterborne or dietary exposure route, and differences in toxicity have been documented after exposure to the same pollutant (Geens et al., 2012; Wang, 2013; Xie et al., 2010). Nanoplastics and SMZ are reported to be highly bioaccumulated in aquatic animals (Rist et al., 2017; Zhao et al., 2016), suggesting that their toxicity via the dietary exposure route (trophic transfer) could be dominant. Given that the co-occurrence of nanoplastics and SMZ is common in coastal environments, clarifying their combined toxicity, especially via the dietary exposure route, in marine animals is of great importance.
Reproductive success ensures the continuity of fish species. Changes in spermatogenesis or oogenesis can be the main drivers of alterations in fish population growth (Segner, 2011). In male fish, spermatogenesis, in which spermatogonia proliferate and differentiate to form mature spermatozoa, is a highly coordinated and organized process (Schulz et al., 2010). First, undifferentiated type A spermatogonia (Aund), which have the potential for self-renewal and differentiation, differentiate into differentiated type A spermatogonia (Adiff) with reduced potential for self-renewal. Then Adiff irreversibly divide into type B spermatogonia. After the final mitosis, type B spermatogonia give rise to spermatocytes which then enter meiosis and differentiate into spermatids. At last, spermatids undergo a final differentiation period and become functional spermatozoa. Disorders in spermatogenesis would lead to low fertility in males and consequently affect fish populations. Therefore, exploring the toxicity of nanoplastics and SMZ in fish spermatogenesis is of necessity when evaluating their potential threat to ecological structures and functions.
Marine medaka (Oryzias melastigma) is a useful marine model fish in toxicology studies, as its generation time is short (2−3 months), the breeding and culturing technique is well developed, and the whole genome information is available (Gao et al., 2018; Kim et al., 2018; Zheng et al., 2024). In this study, we exposed marine medaka (O. melastigma) to diet-borne SMZ and nanoplastics, individually and in combination, for 30 d. The effects on spermatogenesis (including the gonadosomatic index, proportions of germ cells at different developmental stages, and expression of spermatogenesis-related genes) were investigated. The results demonstrated that dietary exposure to SMZ reduced the GSI value and the self-renewal of Aund in the male O. melastigma. The presence of PS alleviated the SMZ-induced low GSI value by enhancing the spermatogonia differentiation instead of reversing the suppressed self-renewal of Aund. Our findings would help better understand the toxicity of antibiotics and nanoplastics in fish and assess their potential ecological risk in marine ecosystems.
2.
Materials and methods
2.1
Chemicals and test organisms
Sulfamethazine (SMZ) and square polystyrene (PS) fragments with a side length of 100 nm were purchased from Tokyo Chemical Industry Co., Ltd. (Tokyo, Japan) and Xi'an Ruixi Biological Technology Co. Ltd. (Shanxi, China), respectively.
Oryzias melastigma was cultured in glass aquaria with a recirculatory system. Automatic photoperiod controllers were used to keep the fish in 16 h light: 8 h darkness. The pH, salinity, and temperature of seawater were set at (8.0 ± 0.1)℃, (30 ± 1)℃ and (24 ± 2)℃, respectively. The fish were fed Artemia salina twice a day.
2.2
Experimental design
The preparation of SMZ and PS-enriched diet was described in our previous study (Zhang et al., 2021b). First, the working solutions of SMZ and PS were mixed with dry commercial feed pellets. Then the wet mixture was freeze dried in a drier for 2 d for a long storage life. For the control feed, double-distilled water (the solvent for nanoplastics and SMZ) was used to mix with dry commercial feed pellets. The exposure experiment consisted of 5 groups: Control (fed with the control feed); SMZ at a low concentration (0.28 mg/g dry feed, L-SMZ); SMZ at a high concentration (4.62 mg/g dry feed, H-SMZ); PS (3.45 mg/g dry feed) and a mixture group (4.62 mg/g SMZ and 3.45 mg/g PS, SMZ + PS). Measurement of SMZ and PS in the diet was previously described (Zhang et al., 2021b). Briefly, the measurement of SMZ was performed on Agilent 1290 ultra-high performance liquid chromatography coupled with Agilent 6400 Series triple quadrupole mass spectrometer (Agilent Technologies, California, USA) using sulfamerazine as internal standard. Fluorescent PS was adopted to measure the realistic concentration of PS. The fluorescent intensity in the diet was determined using the Nanodrop 3300. The choice of SMZ concentration was selected according to the legal doses in aquaculture (1–10 mg/g in feed) in China, the United States and Italy (Lalumera et al., 2004; Limbu et al., 2018) and recent toxicological studies using the dietary exposure route (Zhou et al., 2018; Ming et al., 2020). Nanoplastics can be highly bioaccumulated in lower trophic animals (up to ~10 mg/g body weight in Daphnia magna) (Rist et al., 2017). The concentration of nanoplastics in the diet was set at 3.45 mg/g. During exposure, adult fish (with a male-to-female ratio of 1:1) were fed twice a day. The feces were removed, and the medium in tanks was renewed every 2 d. The whole exposure experiment lasted for 30 d. After exposure, the fish were anesthetized on ice and then dissected for further analysis. The gonadosomatic index (GSI) was calculated as GSI (%) = [gonad weight (g)/total body weight (g)] × 100%.
2.3
Histological analysis
The testes were dissected and fixed in 4% paraformaldehyde for 12 h and then transferred to 70% ethanol. After being dehydrated in ethanol (70%−100%), the testes were embedded in the paraplast. The embedded testes were sectioned into 5 μm- thick slides using a retracting microtome. After deparaffinization and rehydration, the sections were stained with hematoxylin.
2.4
Real-time PCR
Real-time PCR was performed according to our previous method (Zhang et al., 2021a, 2021b). To obtain the relative expression level of interest genes, the delta-delta CT method was used (Schmittgen and Livak, 2008). The expression of genes involved in spermatogenesis (nanos homolog 2, nanos2; piwi-like protein 1, piwil1; deleted in azoospermia-like, dazl; synaptonemal complex protein 3, sycp3; outer dense fiber of sperm tails 3b, odf3b; septin 7, sept7; steroidogenic acute regulatory protein, star and 17β-hydroxysteroid dehydrogenase, 17β-hsd; cytochrome P450 family 19 subfamily A, cyp19a; androgen receptor α, arα and androgen receptor β, arβ; anti-Müllerian hormone, amh; gonadal soma derived factor, gsdf; insulin-like growth factor 3, igf3; insulin-like peptide 3, insl3 and wnt family member 5A, wnt5a), apoptosis (caspase 3a, cas3; caspase 3b, cas3b; caspase 8, cas8 and caspase 9, cas9) and vitellogenesis (vitellogenin-1, vtg1; vitellogenin-2, vtg2; choriogenin-H, chgh and choriogenin-L, chgl) were measured and normalized to the internal control gene β-actin, which is widely used in toxicological study of marine medaka (Zhang et al., 2021a, 2021b).
2.5
Statistical analyses
To evaluate the statistical differences, either Student’s t-test (control vs. PS; H-SMZ vs. H-SMZ + PS) or one-way analysis of variance (ANOVA) analysis test followed by Fisher’s least significant difference (LSD) post hoc test (control, L-SMZ and H-SMZ) was used (SPSS, IBM, Chicago, USA). Normality and homogeneity of variance of data were tested using Shapiro-Wilk and Bartlett’s tests, prior to ANOVA analyses.
3.
Results
In female, no significant differences were observed in the GSI value, fertilization rate, embryo hatching rate, or hepic vtg1, vtg2, chgh and chgl transcripts between all treatments after 30 d of exposure (Fig. S1).
3.1
Gonadosomatic index
A significant decrease in GSI was observed in the male fish from the L-SMZ and H-SMZ groups (32.3% and 36.5%, respectively) relative to the control males (Fig. 1). The GSI of the male fish from the H-SMZ + PS group was close to that of the control male fish and 42.6% higher (p = 0.0074) than that of the H-SMZ group.
Figure
1.
Gonadosomatic indexes (GSI) in the sulfamethazine (SMZ) and nano polystyrene (PS) exposed male O. melastigma. Asterisks indicated significant differences (*0.01 < p < 0.05, ** p ≤ 0.01, n ≥ 5).
Compared to the control, no clear histopathological changes were found in the testes from the L-SMZ, H-SMZ, PS or H-SMZ + PS groups (Fig. 2). Germ cells at different stages, i.e., undifferentiated type A spermatogonia (Aund), differentiated type A spermatogonia (Adiff), type B spermatogonia (B), spermatocytes (SC) and spermatids (ST), could be clearly identified and the structure of the cysts was intact and normal in all the five groups.
Figure
2.
Paraffin sections of testis from the Control (a), L-SMZ (b), H-SMZ (c), PS (d) and H-SMZ + PS (e) groups. No significant effects of PS, SMZ or their binary mixture on the morphological structure of testis were observed. Aund, undifferentiated type A spermatogonia; Adiff, differentiated type A spermatogonia; B, type B spermatogonia; SC, spermatocyte; ST, spermatids.
3.3
Proportions of germ cells at different developmental stages
Compared to the Control, the nanos2 (a marker gene for Aund) transcripts in the H-SMZ group were significantly decreased by 39.4% (p = 0.048 1) (Fig. 3a). Relative to the H-SMZ group, a slight but insignificant (p = 0.119 6) increase of nanos2 transcripts was found in the H-SMZ + PS group. The dazl (a marker gene for type B spermatogonia) and sycp3 (a marker gene for SC) transcripts were respectively elevated by 52.1% (p = 0.000 5) and 22.3% (p = 0.046 9) in the male fish from the H-SMZ + PS group compared to the H-SMZ group (Figs 3b and c).
Figure
3.
Relative expression of germ cell marker genes in the sulfamethazine (SMZ) and nano polystyrene (PS) exposed male O. melastigma. Representation of spermatogenesis from type A undifferentiated spermatogonia to spermatozoa was modified from Schulz et al., (2010) (a). The transcriptional expression levels of nanos2 (b), piwil1 (c), dazl (d), sycp3 (e), odf3b (f) and sept7 (g) were measured. Asterisks indicated significant differences (*0.01 < p < 0.05, ** p ≤ 0.01, n ≥ 5). Aund, undifferentiated type A spermatogonia; Adiff, differentiated type A spermatogonia; B, type B spermatogonia; SC, spermatocyte; ST, spermatids; SZ, spermatozoa.
3.4
Transcriptional expression of spermatogenesis related genes
For the sex hormones production and biological functions related genes, their transcriptional expression was generally down-regulated by individual exposure to SMZ (Fig. 4). On the contrary, the expression of star was obviously upregulated in the PS alone group and the H-SMZ + PS group. In terms of the growth factors involved in spermatogenesis, the expression of amh and gsdf was down-regulated, while that of igf3 was up-regulated in the four treatments. Individual exposure to H-SMZ dramatically down-regulated the expression of insl3. Interestingly, the expression of insl3 was not dysregulated by PS alone, but the presence of PS slightly alleviated the inhibition caused by SMZ. For the apoptosis related genes, in general, exposure to SMZ and/or PS showed a promoting effect.
Figure
4.
Relative expression of spermatogenesis related genes in the sulfamethazine (SMZ) and nano polystyrene (PS) exposed male O. melastigma. The values of four treatment groups were normalized to the control which was set to 0. Color bar from red to green represented the fold change from increasing to decreasing (n ≥ 5).
In this study, dietary exposure to SMZ caused obvious reproductive toxicity in the male O. melastigma, while no clear effect on egg production or hepatic vitellogenesis-related genes was observed in the female fish. It is reported that after exposure to 40 μg/L SMZ for 24 h, the bioconcentration factor (BCF) of SMZ in the testis (~6) is much higher than in the ovary (~27) (Zhao et al., 2016). Besides, exposure to SMZ causes different effects on the gut microbiota communities between the male and female O. melastigma (Zhang et al., 2021b; Zhao et al., 2016). Gut microbiota can interact with host’s estrogen, androgens, insulin, and other hormones via microbial products and consequently affect host reproduction (Qi et al., 2021). For example, microbially secreted β-glucuronidase can metabolize host estrogens from their conjugate forms to their deconjugated forms (Plottel and Blaser, 2011). These results suggest that the gender-specific reproductive toxicity of SMZ in O. melastigma may be due to the different gonadal SMZ levels and the difference in reconstructed gut microbiota communities (as well as microbial products) between female and male fish. Similarly, a recent study shows that exposure to β-diketone antibiotics induces gender-specific reproductive toxicity in zebrafish. GSI values in male zebrafish are significantly decreased under 6.25 mg/L β-diketone antibiotics treatment, while GSI values in females are decreased only under higher concentration treatment (25 mg/L) (Wang et al., 2017). It seems that male fish are more vulnerable and are faced with a higher risk of SMZ pollution.
Exposure to SMZ downregulated the expression of the Aund maker gene nanos2 in O. melastigma, suggesting that the self-renewal and proportion of Aund was suppressed. Since Aund is the primary source of subsequent differentiated germ cells (Schulz et al., 2010), the decreased amount of Aund could lead to a decrease in the number of all types of germ cells (including functional spermatozoa), which is in line with the observation of a decrease in GSI after SMZ exposure. The mechanism underlying the suppression of self-renewal and proportion of Aund by SMZ was investigated. A down-regulated expression of star (mediates the rate-limiting step in steroid biosynthesis) and cyp19a (converts androgens into estrogens) was observed after SMZ exposure, indicating a decrease in the 17β-estradiol (E2) level. In teleost, E2 plays an important role in spermatogonia renewal (Schulz et al., 2010). For instance, 10 pg/ml of E2 was sufficient to induce spermatogonial renewal divisions in cultured testicular tissue of Japanese eel (Miura et al., 1999), and a low dose of E2 promotes spermatogonial renewal in Japanese medaka (Song and Gutzeit, 2003). Therefore, the observed SMZ-induced suppression of spermatogonial renewal could be partially due to the declined E2 level (Manna et al., 2016). Besides of steroid hormones, growth factors participate the complex regulatory network to maintain the balance between self-renewal and differentiation of Aund. Igf3 (produced by Sertoli cells) and Insl3 (produced by Leydig cells) are reported to promote spermatogonia differentiation in teleost (Crespo et al., 2016; Nóbrega et al., 2015), while Amh, Gsdf, and Wnt5a are associated with spermatogonia self-renewal (Schulz et al., 2010; Crespo et al., 2020). In this study, L-SMZ downregulated amh and gsdf transcripts but upregulated igf3, insl3, and wnt5a transcripts, indicating that the balance of self-renewal/differentiation was shifted to differentiation. On the contrary, H-SMZ downregulated not only the self-renewal related genes (i.e., amh, gsdf and wnt5a) but also the differentiation promoting gene insl3, which implies a suppression in differentiation and less differentiated germ cells. This might account for the observed lower GSI in the H-SMZ group than that in the L-SMZ group. During spermatogenesis, there is a requirement of germ cell death by apoptosis to maintain normal germ cell development and to achieve a normal sperm output (Hikim and Swerdloff, 1999; Almeida et al., 2013). After SMZ exposure, increases in the expression of caspases in the testes were observed, suggesting that this balance was disrupted and abnormal cell apoptosis occurs. Taken together, the SMZ-induced decreases in the proportion of Aund and the GSI value in O. melastigma might be achieved via disrupting sex hormone production, growth factor network and the balance of apoptosis in the testes.
Different to SMZ, individual exposure to PS did not cause obvious effects on the GSI value or the proportions of germ cells at different developmental stages in the male O. melastigma. Interestingly, the presence of PS reversed the SMZ-induced decrease in GSI to the normal level. Recently, a growing body of evidence demonstrates that microplastics/nanoplastics could alleviate the toxicity of other environmental pollutants via interaction. For instance, polycyclic aromatic hydrocarbons (PAHs) are sorbing to the surface of the Nano-PS, decreasing the concentration, uptake, and developmental toxicity of free PAHs in the zebrafish embryos (Trevisan et al., 2019). Similarly, our previous study also shows that the mixture of SMZ and PS caused more modest effects on the gut microbiota and intestinal antioxidant physiology than the SMZ alone in O. melastigma (Zhang et al., 2021b). Importantly, in this study, the observed alleviation effect of PS was not achieved simply by reducing the free SMZ molecules. The decreased number of Aund by SMZ was unaltered in the H-SMZ + PS group. Instead, the levels of star, 17β-hsd, dazl and sycp3 transcripts were enhanced, suggesting that the production of sex hormones and the spermatogonial differentiation might be promoted, which compensates the decrease of GSI. Apparently, additional research is needed for a mechanistic understanding of this alleviation effect (e.g., the translocation of the PS and SMZ complex and the potential role of gut microbiota).
5.
Conclusions
This research demonstrates that dietary exposure to SMZ reduces the GSI value and the self-renewal of Aund via disrupting the testicular sex hormone production, the growth factor network and the balance of apoptosis in the male O. melastigma. Individual exposure to PS does not affect the proportions of germ cells at different developmental stages or the GSI value, but dysregulates the expression of several spermatogenesis related genes. There is no simple antagonism between PS and SMZ regarding to the individual toxicity in the testes. Interestingly, the presence of PS alleviates the decreased GSI value by SMZ. The alleviation effect is achieved via enhancing spermatogonia differentiation instead of reversing the suppressed self-renewal of Aund, suggesting that the mixture of PS and SMZ could cause reproductive effects in a different way. Our findings expand our understanding of the ecological risk of antibiotics, nanoplastics, and their mixture to fish populations.
Bao Jingjing, Cai Feng, Ren Jianye, et al. 2014. Morphological characteristics of sand waves in the middle Taiwan Shoal based on multi-beam data analysis. Acta Geologica Sinica (English Edition), 88(5): 1499–1512. doi: 10.1111/1755-6724.12314
Bao Jingjing, Cai Feng, Shi Fengyan, et al. 2020. Morphodynamic response of sand waves in the Taiwan Shoal to a passing tropical storm. Marine Geology, 426: 106196. doi: 10.1016/j.margeo.2020.106196
Berné S, Vagner P, Guichard F, et al. 2002. Pleistocene forced regressions and tidal sand ridges in the East China Sea. Marine Geology, 188(3–4): 293–315. doi: 10.1016/S0025-3227(02)00446-2
Besio G, Blondeaux P, Brocchini M, et al. 2004. On the modeling of sand wave migration. Journal of Geophysical Research: Oceans, 109(C4): C04018. doi: 10.1029/2002JC001622
Campmans G H P, Roos P C, De Vriend H J, et al. 2017. Modeling the influence of storms on sand wave formation: A linear stability approach. Continental Shelf Research, 137: 103–116. doi: 10.1016/j.csr.2017.02.002
Campmans G H P, Roos P C, De Vriend H J, et al. 2018. The influence of storms on sand wave evolution: A nonlinear idealized modeling approach. Journal of Geophysical Research: Earth Surface, 123(9): 2070–2086. doi: 10.1029/2018JF004616
Campmans G H P, Roos P C, Van der Sleen N R, et al. 2021. Modeling tidal sand wave recovery after dredging: Effect of different types of dredging strategies. Coastal Engineering, 165: 103862. doi: 10.1016/j.coastaleng.2021.103862
Chen Hsien-Wen, Liu Cho-Teng, Matsuno T, et al. 2016. Temporal variations of volume transport through the Taiwan Strait, as identified by three-year measurements. Continental Shelf Research, 114: 41–53. doi: 10.1016/j.csr.2015.12.010
Chuang Wen-Ssn, Li Hsien-Wen, Tang Tswen Yung, et al. 1993. Observations of the countercurrent on the inshore side of the Kuroshio northeast of Taiwan. Journal of Oceanography, 49(5): 581–592. doi: 10.1007/BF02237464
Du Xiaoqin, Gao Shu, Li Yan. 2010. Hydrodynamic processes and bedload transport associated with large-scale sandwaves in the Taiwan Strait. Journal of Coastal Research, 26(4): 688–698
Hanes D M. 2012. The genesis of an inter-field marine sandwave and the associated anti-asymmetry migration of neighboring crests. Geophysical Research Letters, 39(4): L04402. doi: 10.1029/2011GL050641
Harris P T. 1991. Reversal of subtidal dune asymmetries caused by seasonally reversing wind-driven currents in Torres Strait, northeastern Australia. Continental Shelf Research, 11(7): 655–662. doi: 10.1016/0278-4343(91)90018-2
Hong Huasheng, Zhang Caiyun, Shang Shangling, et al. 2009. Interannual variability of summer coastal upwelling in the Taiwan Strait. Continental Shelf Research, 29(2): 479–484. doi: 10.1016/j.csr.2008.11.007
Hu Jianyu, Kawamura Hiroshi, Li Chunyan, et al. 2010. Review on current and seawater volume transport through the Taiwan Strait. Journal of Oceanography, 66: 591–610. doi: 10.1007/s10872-010-0049-1
Hu Zifeng, Qi Yiquan, He Xianqiang, et al. 2019. Characterizing surface circulation in the Taiwan Strait during NE monsoon from Geostationary Ocean Color Imager. Remote Sensing of Environment, 221: 687–694. doi: 10.1016/j.rse.2018.12.003
Hulscher S J M H. 1996. Tidal-induced large-scale regular bed form patterns in a three-dimensional shallow water model. Journal of Geophysical Research: Oceans, 101(C9): 20727–20744. doi: 10.1029/96JC01662
Hulscher S J M H, Knaapen M A F, Scholl O. 2000. Regeneration of dredged sand waves.Proceedings of Marine sandwave Dynamics, 23–24
IHO. 2008. IHO Standards for Hydrographic Surveys, S-44. 5th ed. Monaco: International Hydrographic Organization, 1–23
Jan Sen, Chao Shenyu. 2003. Seasonal variation of volume transport in the major inflow region of the Taiwan Strait: the Penghu Channel. Deep Sea Research Part II: Topical Studies in Oceanography, 50(6−7): 1117–1126. doi: 10.1016/S0967-0645(03)00013-4
Katoh K, Kume H, Kuroki K, et al. 1998. The development of sand waves and the maintenance of navigation channels in the Bisanseto Sea. In: Proceedings of the 26th International Conference on Coastal Engineering. Copenhagen: ASCE, 3490–3502
Knaapen M A F, Hulscher S J M H. 2002. Regeneration of sand waves after dredging. Coastal Engineering, 46(4): 277–289. doi: 10.1016/S0378-3839(02)00090-X
Knaapen M A F, Hulscher S J M H, Scholl O. 2000. Can we predict the growth of sand waves? Hindcast of a field experiment in the Bisanseto Sea, Japan. In: Proceedings of the 27th International Conference on Coastal Engineering. Sydney, ASCE, 2661–2671. doi: 10.1061/40549(276)208
Li Li, Guo Xiaogang, Liao Enhui, et al. 2018. Subtidal variability in the Taiwan Strait induced by combined forcing of winter monsoon and topography. Science China Earth Sciences, 61(4): 483–493. doi: 10.1007/s11430-016-9132-9
Liu Zhenxia, Xia Dongxing, Berné S, et al. 1998. Tidal deposition systems of China’s continental shelf, with special reference to the eastern Bohai Sea. Marine Geology, 145(3–4): 225–253. doi: 10.1016/S0025-3227(97)00116-3
McCave I N. 1971. Sand waves in the North Sea off the coast of Holland. Marine Geology, 10(3): 199–225. doi: 10.1016/0025-3227(71)90063-6
Oey Lie-Yauw, Chang Yu-Lin, Lin Yu Chun, et al. 2014. Cross flows in the Taiwan Strait in winter. Journal of Physical Oceanography, 44(3): 801–817. doi: 10.1175/JPO-D-13-0128.s1
Off T. 1963. Rhythmic linear sand bodies caused by tidal currents. AAPG Bulletin, 47(2): 324–341
Shen Junqiang, Qiu Yun, Guo Xiaogang, et al. 2017. The spatio-temporal variation of wintertime subtidal currents in the western Taiwan Strait. Acta Oceanologica Sinica, 36(11): 4–13. doi: 10.1007/s13131-017-1120-1
Shen Junqiang, Zhang Junpeng, Qiu Yun, et al. 2019. Winter counter-wind current in western Taiwan Strait: Characteristics and mechanisms. Continental Shelf Research, 172: 1–11. doi: 10.1016/j.csr.2018.11.005
Terwindt J H J. 1971. Sand waves in the southern bight of the North Sea. Marine Geology, 10(1): 51–67. doi: 10.1016/0025-3227(71)90076-4
Van de Meene J W H, Boersma J R, Terwindt J H J. 1996. Sedimentary structures of combined flow deposits from the shoreface-connected ridges along the central Dutch coast. Marine Geology, 131(3–4): 151–175. doi: 10.1016/0025-3227(95)00074-7
Verboven I. 2017. Regeneration of tidal sand waves after dredging field data analysis, model simulations, and synthesis to dredging strategies [dissertation]. Enschede: University of Twente
Wang Yuhuai, Jan Sen, Wang Dongping. 2003. Transports and tidal current estimates in the Taiwan Strait from shipboard ADCP observations (1999–2001). Estuarine, Coastal and Shelf Science, 57(1–2): 193–199,
Wang Li, Pawlowicz R, Wu Xiongbin, et al. 2021. Wintertime variability of currents in the southwestern Taiwan Strait. Journal of Geophysical Research: Oceans, 126(5): e2020JC016586. doi: 10.1029/2020JC016586
Zhou Jieqiong, Wu Ziyin, Jin Xianglong, et al. 2018. Observations and analysis of giant sand wave fields on the Taiwan Banks, northern South China Sea. Marine Geology, 406: 132–141. doi: 10.1016/j.margeo.2018.09.015
Figure 1. Location of Taiwan Shoal in the south of Taiwan Strait, showing sand wave dredging site (modified from Bao et al. (2020)).
Figure 2. Results of a digital terrain model for the five surveys during 2012–2020, showing crest line alignments of the giant sand waves (KL) and small sand waves (MN) plus multiple profiles in the feature region.
Figure 3. Crest line profiles of KL for the giant sand waves (a) and MN for the small sand waves (b) in the five surveys during 2012 and 2020 (refer to Fig. 2)
Figure 4. Evolution of dredged area SW-A and the variation in mean height difference between two consecutive measurements (“+”for sedimentation, “−” for erosion).
Figure 5. Movement of multiple small sand wave crest lines in the troughs of giant sand waves in the feature region. DTM: Digital Terrain Model.
Figure 6. Profiles of sand waves across the small sand waves in the troughs of giant sand waves.
Figure 7. Converging migration of both giant sand waves and small sand waves after dredging, showing distribution of 20 divisions (yellow strip area) consisting of sedimentation and erosion.


 DownLoad:


 DownLoad:


