Second Institute of Oceanography, Ministry of Natural Resources, Hangzhou 310012, China
2.
Key Laboratory of Ocean Space Resource Management Technology, Ministry of Natural Resources, Hangzhou 310012, China
3.
Guangxi Key Laboratory of Beibu Gulf Marine Resources, Environment and Sustainable Development, Fourth Institute of Oceanography, Ministry of Natural Resources, Beihai 536000, China
4.
State Key Laboratory of Estuarine and Coastal Research, East China Normal University, Shanghai 200241, China
5.
School of Geography and Ocean Science, Nanjing University, Nanjing 210023, China
Funds:
The Zhejiang Provincial Natural Science Foundation of China under contract No. LHZ22D060001; the Scientific Research Funds of the Second Institute of Oceanography, Ministry of Natural Resources under contract Nos JG2315 and XRJH2309; the National Key R&D Program of China under contract No. 2022YFC3106200.
Beach erosion has occurred globally in recent decades due to frequent and severe storms. Dongsha beach, located in Zhujiajian Island, Zhejiang Province, China, is a typical embayed sandy beach. This study focused on the morphodynamic response of Dongsha beach to typhoon events, based on beach topographies and surficial sediment characteristics acquired before and after four typhoon events with varying intensities. The four typhoons had different effects on the topography and sediment characteristics of Dongsha beach. Typhoons Ampil and Danas caused the largest (−51.72 m3/m) and the smallest erosion (−8.01 m3/m), respectively. Remarkable alongshore patterns of beach profile volumetric changes were found after the four typhoon events, with more erosion in the southern and central parts of the beach and few changes in the northern part. Grain size coarsening and poor sorting were the main sediment patterns on the beach influenced by different typhoons. Typhoons that occurred in the same year after another typhoon enhanced the effect of the previous typhoon on sediment coarsening and sorting variability, but this cumulative effect was not found between typhoons that occurred during different years. A comparison of the collected data revealed that the topographic state of the beach before the typhoon, typhoon characteristics, and tidal conditions were possible reasons for the difference in the responses of Dongsha beach to typhoon events. More severe beach erosion was caused by typhoons with higher intensity levels and longer durations, and high tide levels during typhoons can determine the upper limit of the beach profile erosion site. Taken together, these results can be used to improve beach management for storm prevention.
Sandy coasts account for more than one-third of the world’s non-frozen coastline (Luijendijk et al., 2018) and have high socioeconomic and ecological value. However, as an important component of the global coast, sandy coasts have been continuously eroded, with 15% of sandy beaches retreating landward at a rate of 1 m/a or even faster in recent years (Luijendijk et al., 2018). Vousdoukas et al. (2020) simulated future global sandy shoreline changes and showed that the global sandy shoreline will recede by an average of more than 100 m by 2100, implying direct loss of beach resources in some local areas.
Storm event is an important driver of sandy coast erosion, creating strong wave energy environments that can produce dramatic short-term changes in beach geomorphology. Over the past few decades, beach storm response has been widely studied globally. The responses of natural beaches to storm events vary, and the factors that contribute to this variation include storm characteristics and beach features (Cooper et al., 2004). It has been suggested that the beach response depends primarily on the number of storms and their intensities, and storm clusters may cause more extensive beach erosion than individual storms (Karunarathna et al., 2014; Senechal et al., 2015). However, despite the high energy levels maintained by storm clusters, erosion may decrease and reach equilibrium during successive storms (Aagaard et al., 2012). The temporal sequence of storms within a cluster may also play a key role in storm intensity (Castelle et al., 2015; Coco et al., 2014; Guo et al., 2020). Storm wave height and peak wave period are key parameters linking wave action to beach response, thus defining potential thresholds for storm impact. The time period when the storm reached the peak during the tidal cycle can also influence beach storm response characteristics (Anthony, 2013; Cai et al., 2006; Masselink et al., 2016). Previous studies have demonstrated that the shoreline direction and storm track affect the wave incidence angle, which in turn affects the beach response by controlling the coastal sediment transport (Castelle et al., 2015; Qi et al., 2010). In addition to being influenced by hydrodynamics, difference in beach responses to storms are also related to beach morphology (Haerens et al., 2012), beach type (Burvingt et al., 2017; Masselink et al., 2016; Qi et al., 2010), sediment grain size (Prodger et al., 2016), and geological conditions (Loureiro et al., 2012; Qi et al., 2010).
Facing with storm erosion and the stress of short in beach resources, a better understanding of embayed beach morphodynamic response to storms is needed for beach protection (Burvingt et al., 2017; Guo et al., 2020; Masselink et al., 2016; Sancho-García et al., 2013). Typhoon events in the Northwest Pacific can always bring storm waves and surges, resulting in considerable and site-specific beach erosion (Cai et al., 2006; Guo et al., 2018; Liu et al., 2022; Qi et al., 2010; Yin et al., 2019) and further affecting the beach long-term evolution. Datasets with adequate spatiotemporal resolution are uncommon and limited by the complexity of storm process and the harshness of observation conditions (Coco et al., 2014). Although typhoon induced storm response has been well studied, a large number of field observations are still required to deepen the understanding of the detailed process and internal mechanism of embayed beach processes under storm conditions (Anthony, 2013; Forbes et al., 2004), especially for the storms induced by different typhoon events with varying intensities.
Under the background of widespread global coastal erosion, about 50% of the sandy coast in China is continuously eroding and retreating (Third Institute of Oceanography, 2010). The sandy coasts of China are more than 5 000 km long with widely varying geomorphic features, in which embayed beaches are the most prevalent (Cai, 2019). Zhejiang Province is an important coastal province of China, while the embayed sandy and gravel coasts account for only 3% of its coast, suffering a great number of economic losses from typhoon induced storm disasters for years (Second Institute of Oceanography, 2012). Zhoushan Archipelago is one of the main distribution areas of beach resources in Zhejiang, among which Zhujiajian Island, the famous tourist destination, is the most representative island due to its rich beach types (Xia, 2014). Therefore, in this study, we take Dongsha beach, a typical embayed sandy beach on Zhujiajian Island in Zhejiang Province as an example, using beach topography, surficial sediment, and hydrodynamic data, to analyze the topography and sediment characteristics of the embayed beach under the influence of different typhoons, investigate the morphodynamic response pattern of the embayed beach to typhoon events, discuss the influencing factors of various morphodynamic responses of embayed beach, and provide reference for beach storm prevention.
2.
Materials and methods
2.1
Study area
Zhujiajian Island is the fifth largest island in the Zhoushan Archipelago, Zhejiang Province, China (Figs 1a, b), with a land area of 62.20 km2 and a coastline of 79.20 km (Xia, 2014). The embayed beaches on the east coast of Zhujiajian Island are famous tourist destinations in China. Faced with frequent typhoon events, the local management department has performed human intervention to resist erosion of different beaches on Zhujiajian Island. Seawall construction is the main protection measure used to prevent storm-induced shoreline retreat. In addition, small-scale, short-interval beach nourishment projects have been implemented to resist severe storm erosion and to maintain the recreational beach function (Guo et al., 2020).
Figure
1.
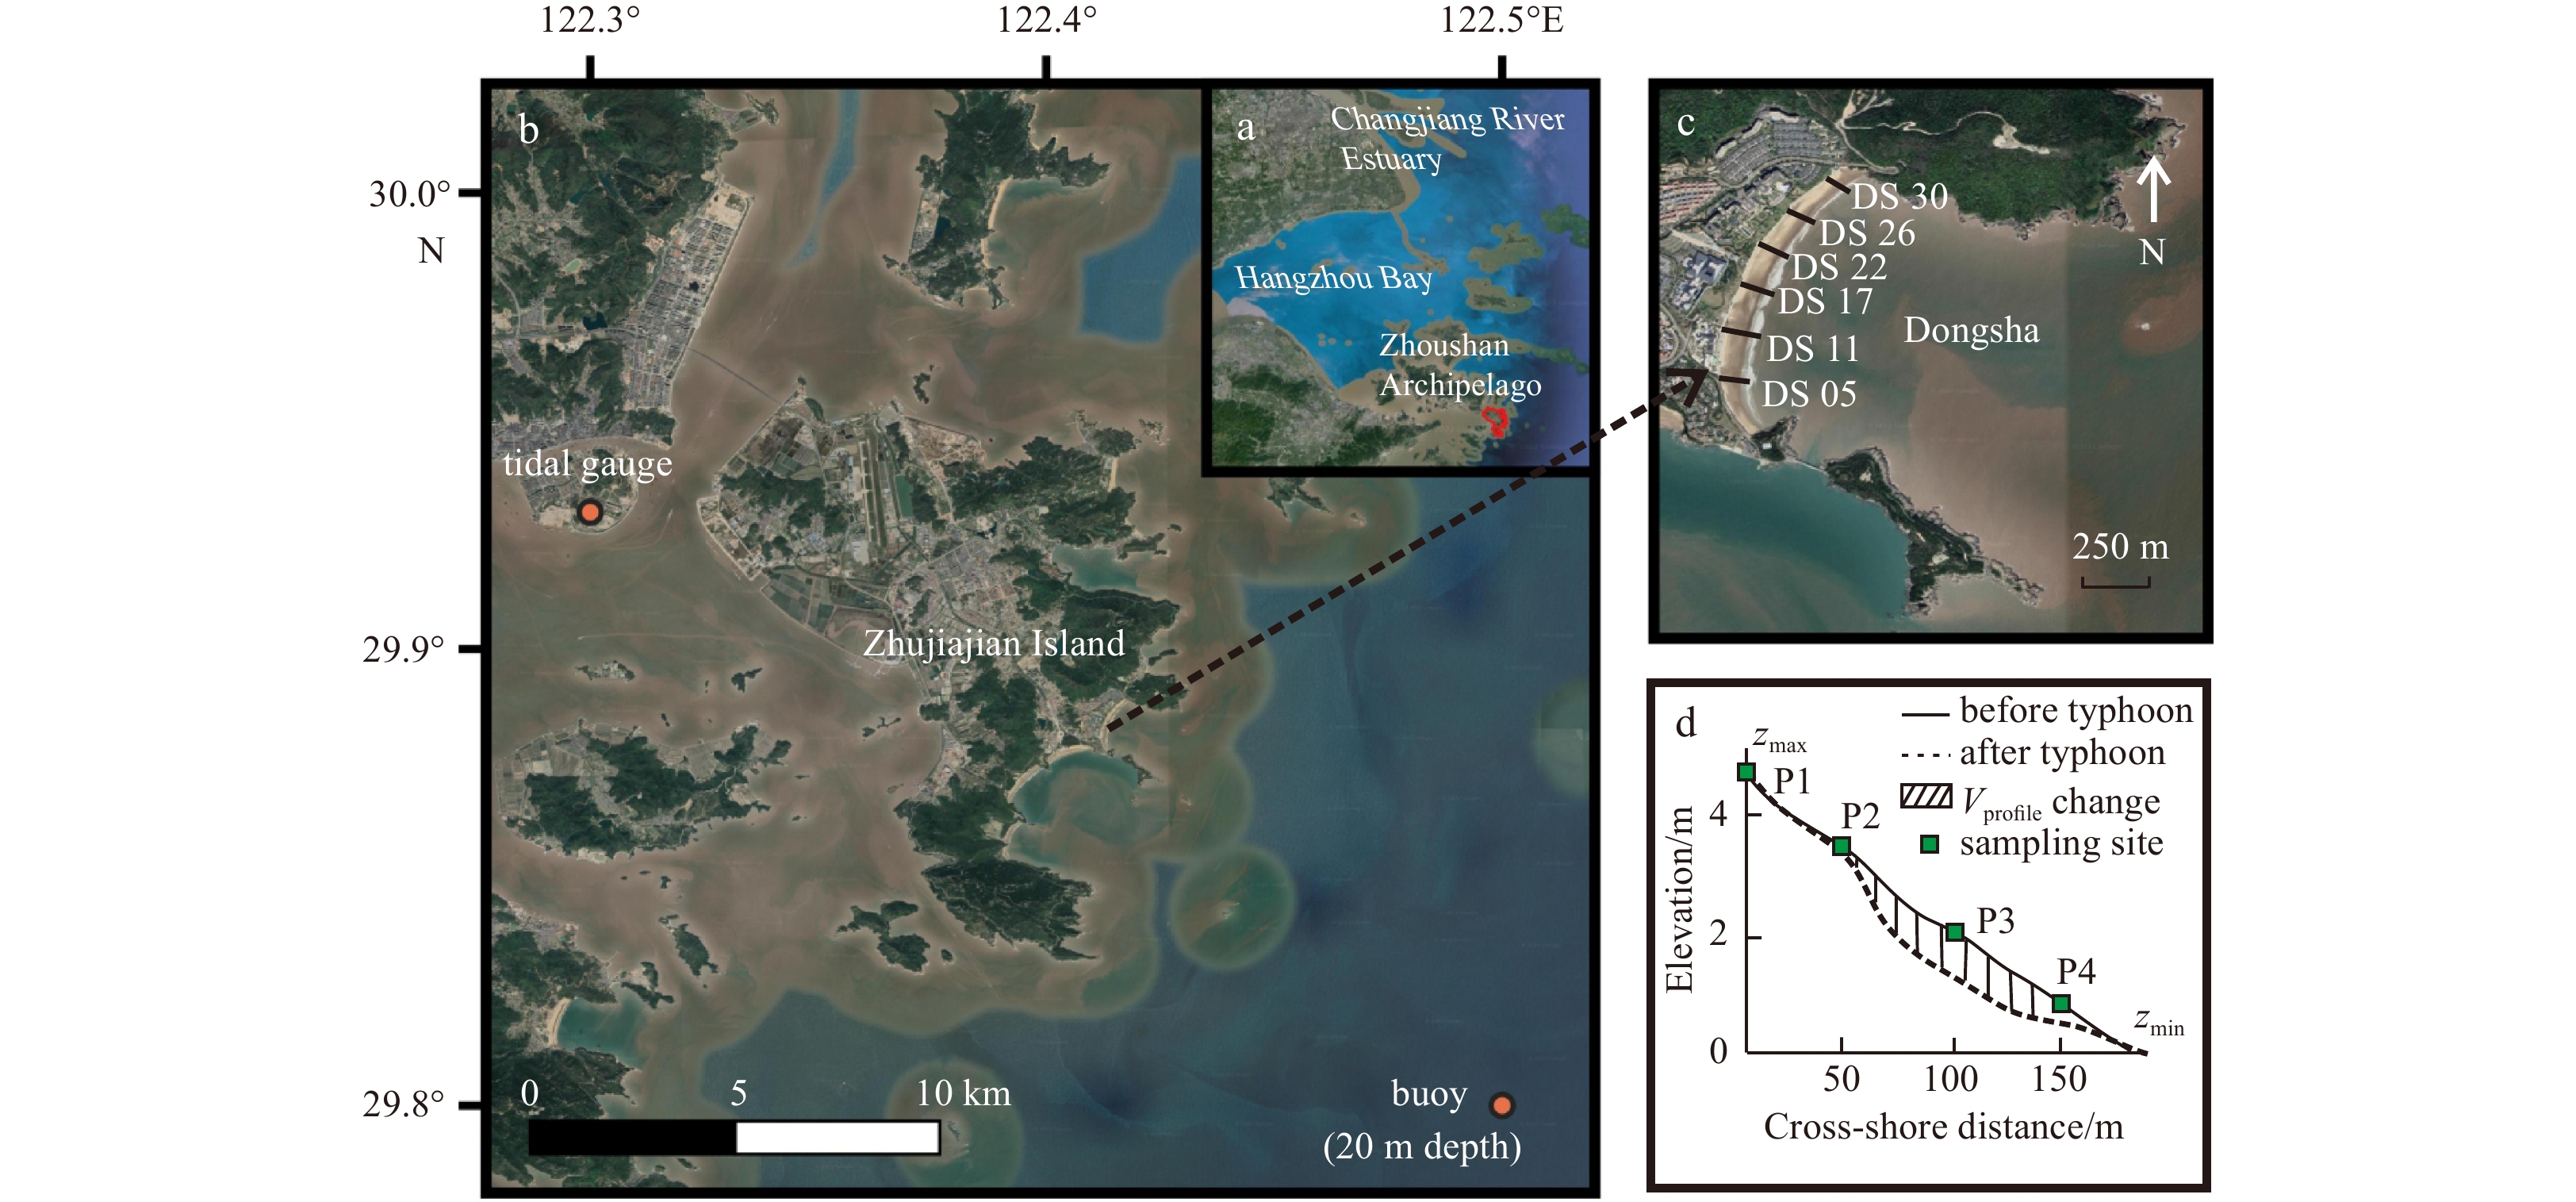
Sketch of study area, topography and sediment measurement settings: location of Zhuajiajian Island (a), locations of tidal gauge and wave buoy (b), typical profiles setting on Dongsha beach (c) and the sampling sites (green rectangles) on each profile (d). DS05, DS11, DS17, DS22, DS26, and DS30 in c are the typical profiles set on Dongsha, while P1, P2, P3, and P4 are the cross-shore sampling sites on each typical profile with a space interval of 50 m. The satellite images were downloaded from Google Earth.
Dongsha beach is a 1 500 m-long embayed sandy beach, with two headlands extending approximately 1 350 m offshore (Fig. 1c). The beach slope ranges along the coast from 2.90% to 3.50%, and surficial sediment D50 ranges from $ \varPhi$=1.40 to $\varPhi $=2.74. Sand dunes existed at the landside of the beach before, while the completion of the seawall in 2012 broke the balance of the cross-shore sediment (Cheng et al., 2014) and further led to dune disappearance. The seawall construction and frequent storms have resulted in considerable beach erosion for years (Guo et al., 2018). To fight storm-driven erosion and increase the dry beach area, beach nourishments have been performed with a total of 52 000 m3 placed on Dongsha beach between 2016 and 2017, with a large impact on beach processes (Guo et al., 2020).
2.2
Hydrodynamic data during typhoon events
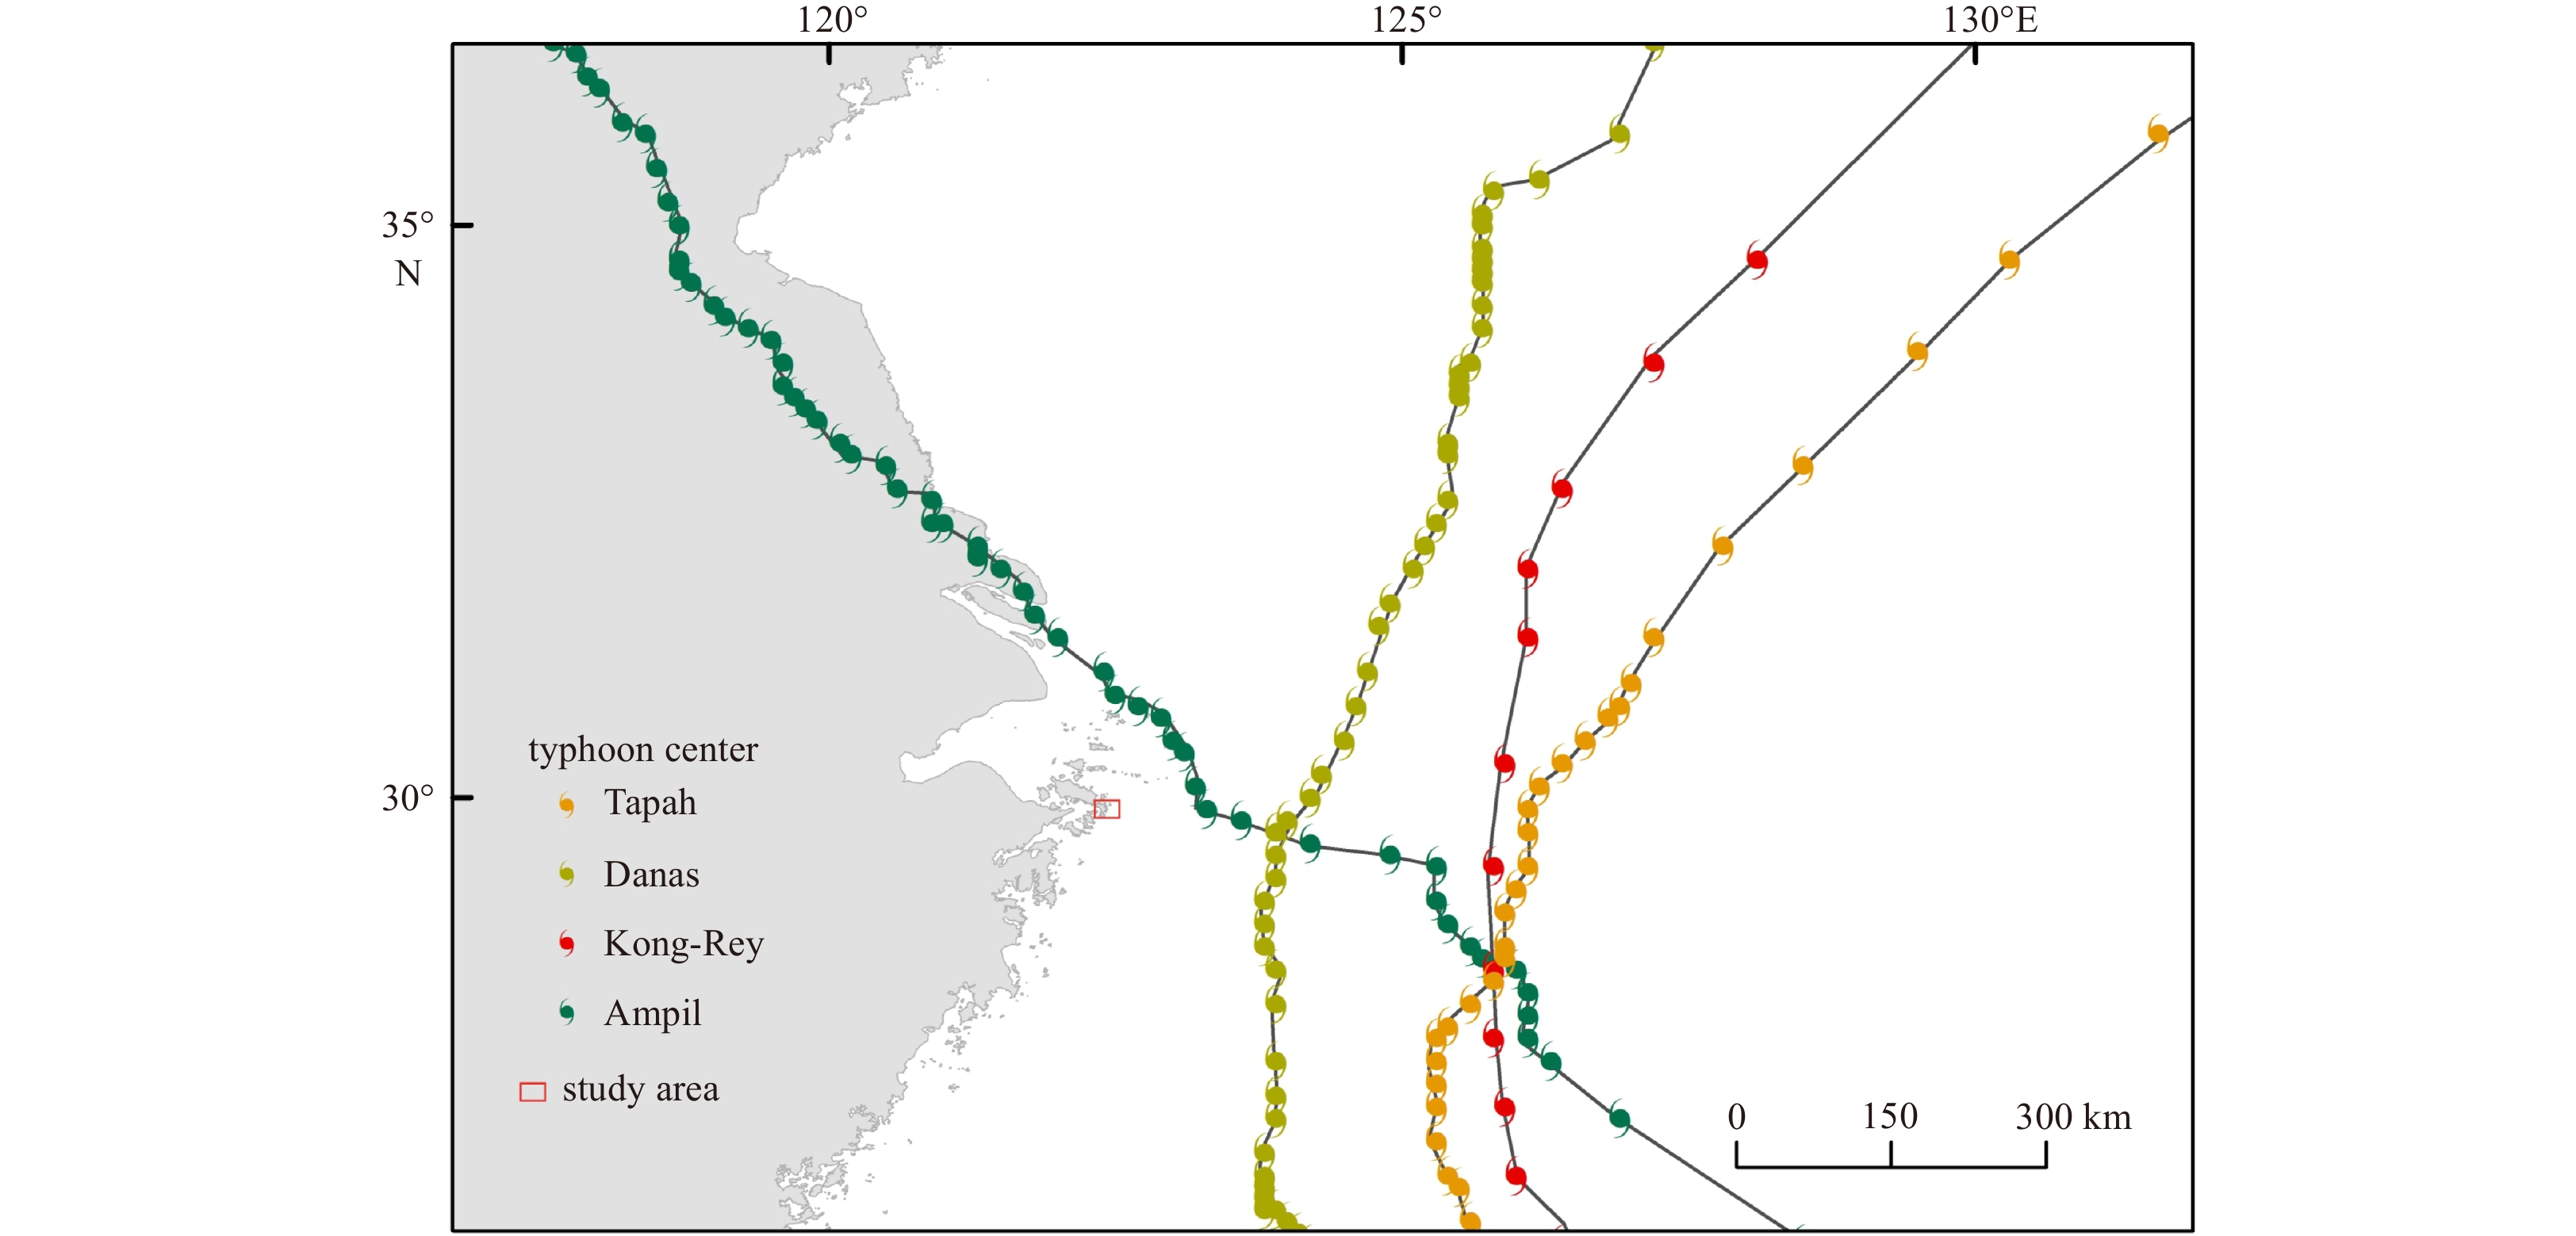
From 1949 to 2019, a total of 46 typhoons landed Zhejiang Province and 236 typhoons affected the coast of Zhejiang (Guo et al., 2019). In this study, four typhoon events that affected the study area were monitored during the typhoon seasons of 2018 and 2019 (Fig. 2), and their characteristics were collected from the typhoon website of National Meteorological Center of China (http://typhoon.nmc.cn/; Table 1). Figure 3 shows the wind speed and air pressure at the centers of the four typhoon events in this study, the maximum wind speeds at the centers of Ampil, Kong-Rey, Danas, and Tapah reached 28 m/s, 60 m/s, 23 m/s, 33 m/s, respectively. The lowest air pressures at the centers of the four typhoons were 980 hPa, 920 hPa, 988 hPa, and 975 hPa, respectively. The classifications of the four typhoons are severe tropical storm Ampil, super typhoon Kong-Rey, severe tropical storm Danas, and typhoon Tapah, with affecting durations of 17 h, 21 h, 10 h, and 18 h, respectively.
Figure
2.
Moving tracks of four typhoon events affecting Zhujiajian Island during the study period.
Table
1.
Information of four typhoon events affecting the study area in this study during 2018 and 2019
Typhoon
Classification
Affecting time span
Affecting duration/h
Ampil
severe tropical storm
2018/07/21 20:00 – 2018/07/22 13:00
17
Kong-Rey
super typhoon
2018/10/05 02:00 – 2018/10/05 23:00
21
Danas
severe tropical storm
2019/07/19 07:00 – 2019/07/19 17:00
10
Tapah
typhoon
2019/09/21 11:00 – 2019/09/22 05:00
18
Note: Affecting time span was detected according to the data collected from the typhoon website of National Meteorological Center of China (http://typhoon.nmc.cn/).
Figure
3.
The wind speed and atmospheric pressure at the centers of the four typhoon events: wind speed of Ampil (a), atmospheric pressure of Ampil (b), wind speed of Kong-Rey (c), atmospheric pressure of Kong-Rey (d), wind speed of Danas (e), atmospheric pressure of Danas (f), wind speed of Tapah (g), and atmospheric pressure of Tapah (h).
Nearshore hydrodynamic data were also obtained during the typhoon events. The wave data including wave direction, significant wave height (Hs), and peak wave period were collected hourly from a wave buoy (29.80°N, 122.50°E; Fig. 1b) located at a depth of approximately 20 m. The dominant wave direction in the study area was from the east, and the waves with larger Hs primarily came from the northeast and southeast, with the annual average Hs and wave period of 0.82 m and 6.20 s, respectively (Guo et al., 2020). The tidal data (astronomical and measured tides) were provided by the Shenjiamen Marine Station (29.93°N, 122.30°E; Fig. 1b), and the surge levels were calculated using measured tidal level minus astronomical tidal level. The tides in the study area were primarily semi-diurnal, with an average tidal range of 2.60 m (Xia, 2014).
2.3
Topographic data
To obtain the topography and surficial sediment changes of Dongsha Beach induced by different typhoon events, we conducted eight field campaigns before and after the four typhoon events in this study (Table 2). Thirty profiles including six typical profiles (DS05, DS11, DS17, DS22, DS26, and DS30) were set on Dongsha beach with an alongshore interval of 50 m during each field campaign, which were named from DS01 to DS30 according to their positions on the beach from south to north (Fig. 1c). The beach topography was monitored at low tide using real-time kinetic global positioning system (RTK GPS) from a network of continuously operating reference stations (CORS, with plane and vertical precisions of ±8 mm and ±15 mm, respectively) with fixed-point measurements starting from the base (the artificial seawall). The elevation data of 240 profiles were corrected to the Yellow Sea Datum 1985.
Table
2.
Number of profiles and surficial sediment samples collected on Dongsha beach during each field campaign in this study
The beach sand volume per unit meter width, Vprofile in m3/m, was calculated for every typical profile based on the shortest profile over the study period according to Burvingt et al. (2018):
where z corresponds to the topographic values interpolated per meter, zmin and zmax are the lowest and fixed backshore (the foot of seawall) topographic points (Fig. 1d), respectively. The zmin on the beach is near 0 m elevation in the Yellow Sea Datum 1985. The profile volume changes per unit meter width were calculated for every post-typhoon survey relative to the survey before the typhoon event. We also used the inverse distance weight interpolation method (Shepard, 1968) to generate digital elevation models from the beach profiles of each survey, and the interpolation was carried out on a regular grid with alongshore and cross-shore mesh sizes of 5 m and 1 m, respectively. The elevation difference and the total beach volume change could subsequently be calculated, and the erosion/accretion patterns of the beach were then analyzed.
2.4
Surficial sediments
A total of 1 035 surficial sediment samples from 240 profiles were acquired during the eight field campaigns (Table 2). The cross-shore sampling sites (P1, P2, P3, and P4) were set starting from the seawall and approximately 50 m spaced along each profile. P1 is the first sampling site along the cross-shore profile, while P4 is the last sampling site along the cross-shore profile (Fig. 1d). Sediment samples were processed according to standard laboratory procedures (Carver, 1971). Sediment grain size analyses were performed using SFY-D sonic vibration-type automatic sieving grain size analyzer (Nanjing Zhonghu Technology Co., Ltd, China) after desalination and separation. The graphical method (Folk and Ward, 1957) was used to calculate the grain size parameters (mean grain size, skewness, sorting coefficient, and kurtosis) of the surficial sediment.
3.
Results
3.1
Nearshore waves and tides during four typhoon events
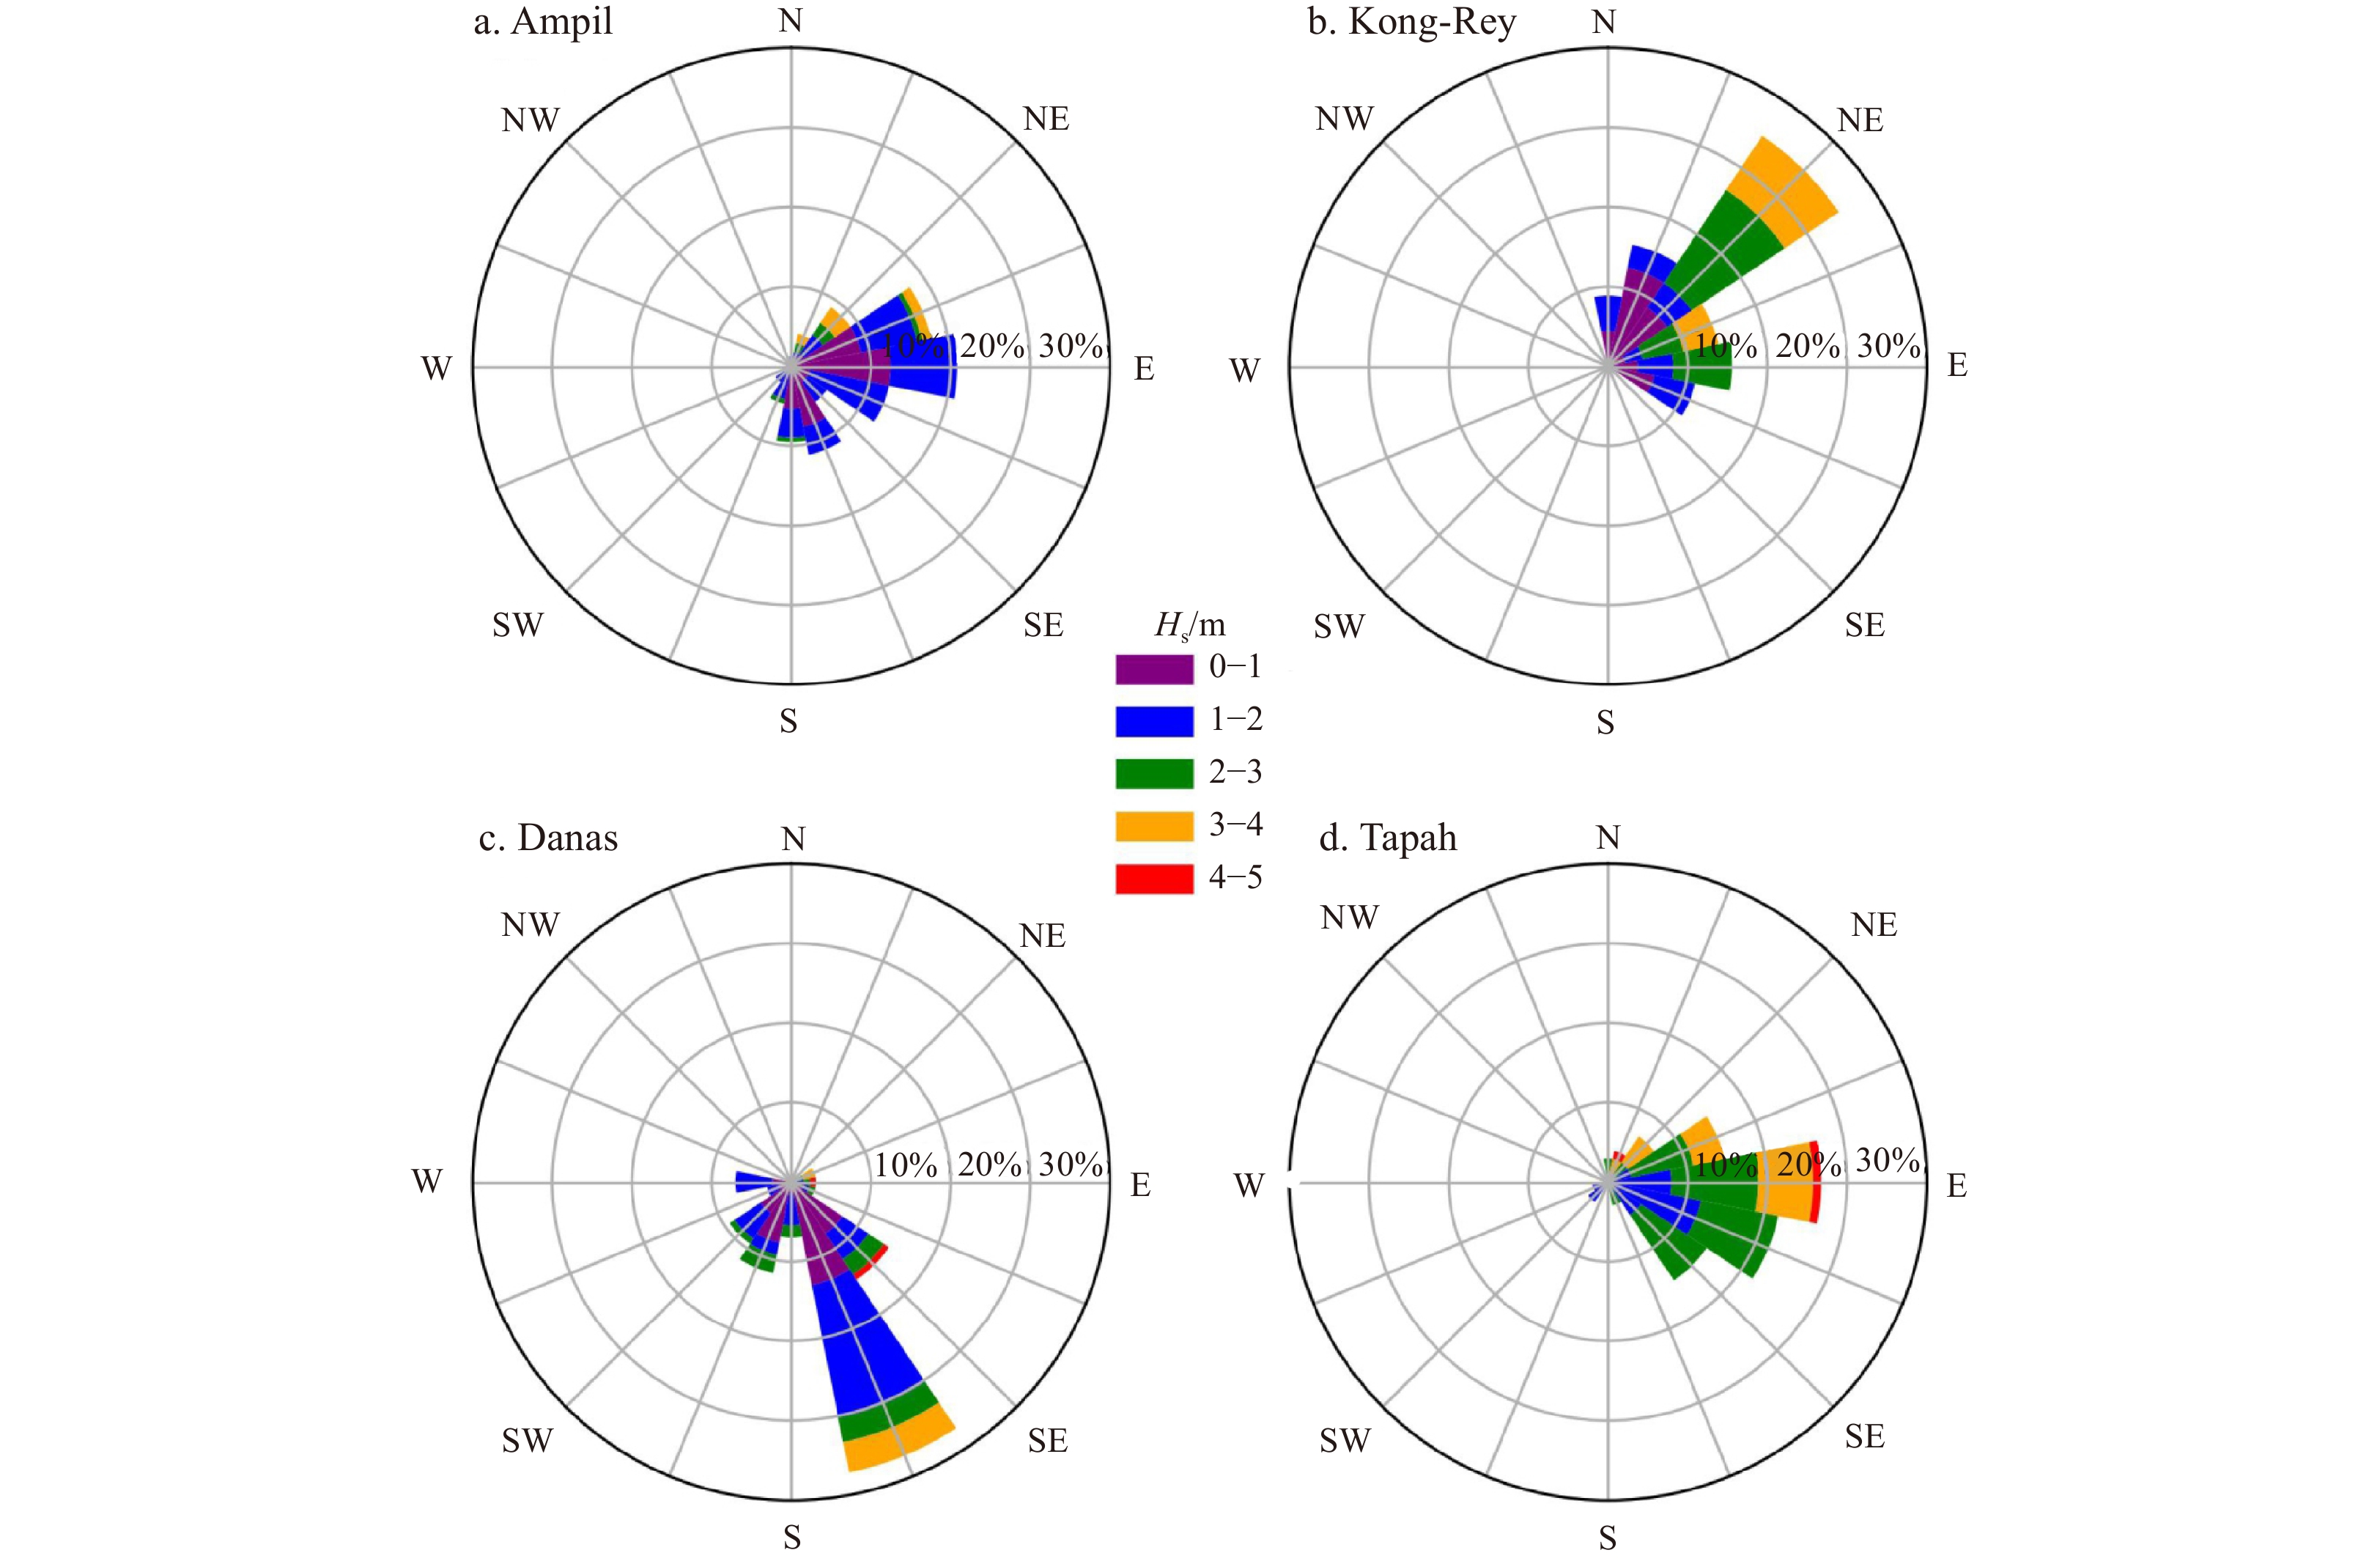
The peak Hs during Ampil, Kong-Rey, Danas, and Tapah were 3.87 m, 4.36 m, 4.68 m, and 4.03 m, respectively (Fig. 4). The average Hs during the four typhoon events were 1.33 m, 1.76 m, 1.40 m, and 2.49 m, respectively, while the annual average Hs is only 0.82 m (Guo et al., 2020), showing that the four typhoon events all caused storm waves. The peak wave periods during the peaks of the four typhoon events were 10.20 s, 11 s, 9.20 s, and 7.80 s, respectively. Additionally, the main wave directions of the four typhoons were from E, NE, SE, and E, respectively, indicating that all the waves can affect Dongsha beach.
Figure
4.
Significant wave heights and mean wave directions during four typhoon events.
The hourly measured tidal level, astronomical tidal level, and storm surge level with respect to Yellow Sea Datum 1985 in the study area were illustrated in Fig. 5. It can be seen from Fig. 5 that the minimum and maximum tidal levels, which occurred during typhoon Ampil and Kong-Rey, reached −1.36 m and 2.26 m, respectively. Ampil, Kong-Rey, and Tapah affected the study area during the neap tide, whereas Danas affected Dongsha during the spring tide. The four typhoon events caused remarkable storm surges, with maximum surge values of 0.69 m, 0.85 m, 0.60 m, and 0.98 m, respectively. Although the storm surges were induced by the typhoons, the high tide level did not exceed 2.50 m during the four typhoon events (Fig. 5).
Figure
5.
Tidal levels and surge levels during four typhoon events: Ampil (a), Kong-Rey (b), Danas (c), and Tapah (d).
3.2
Sediment characteristic response to different typhoon events
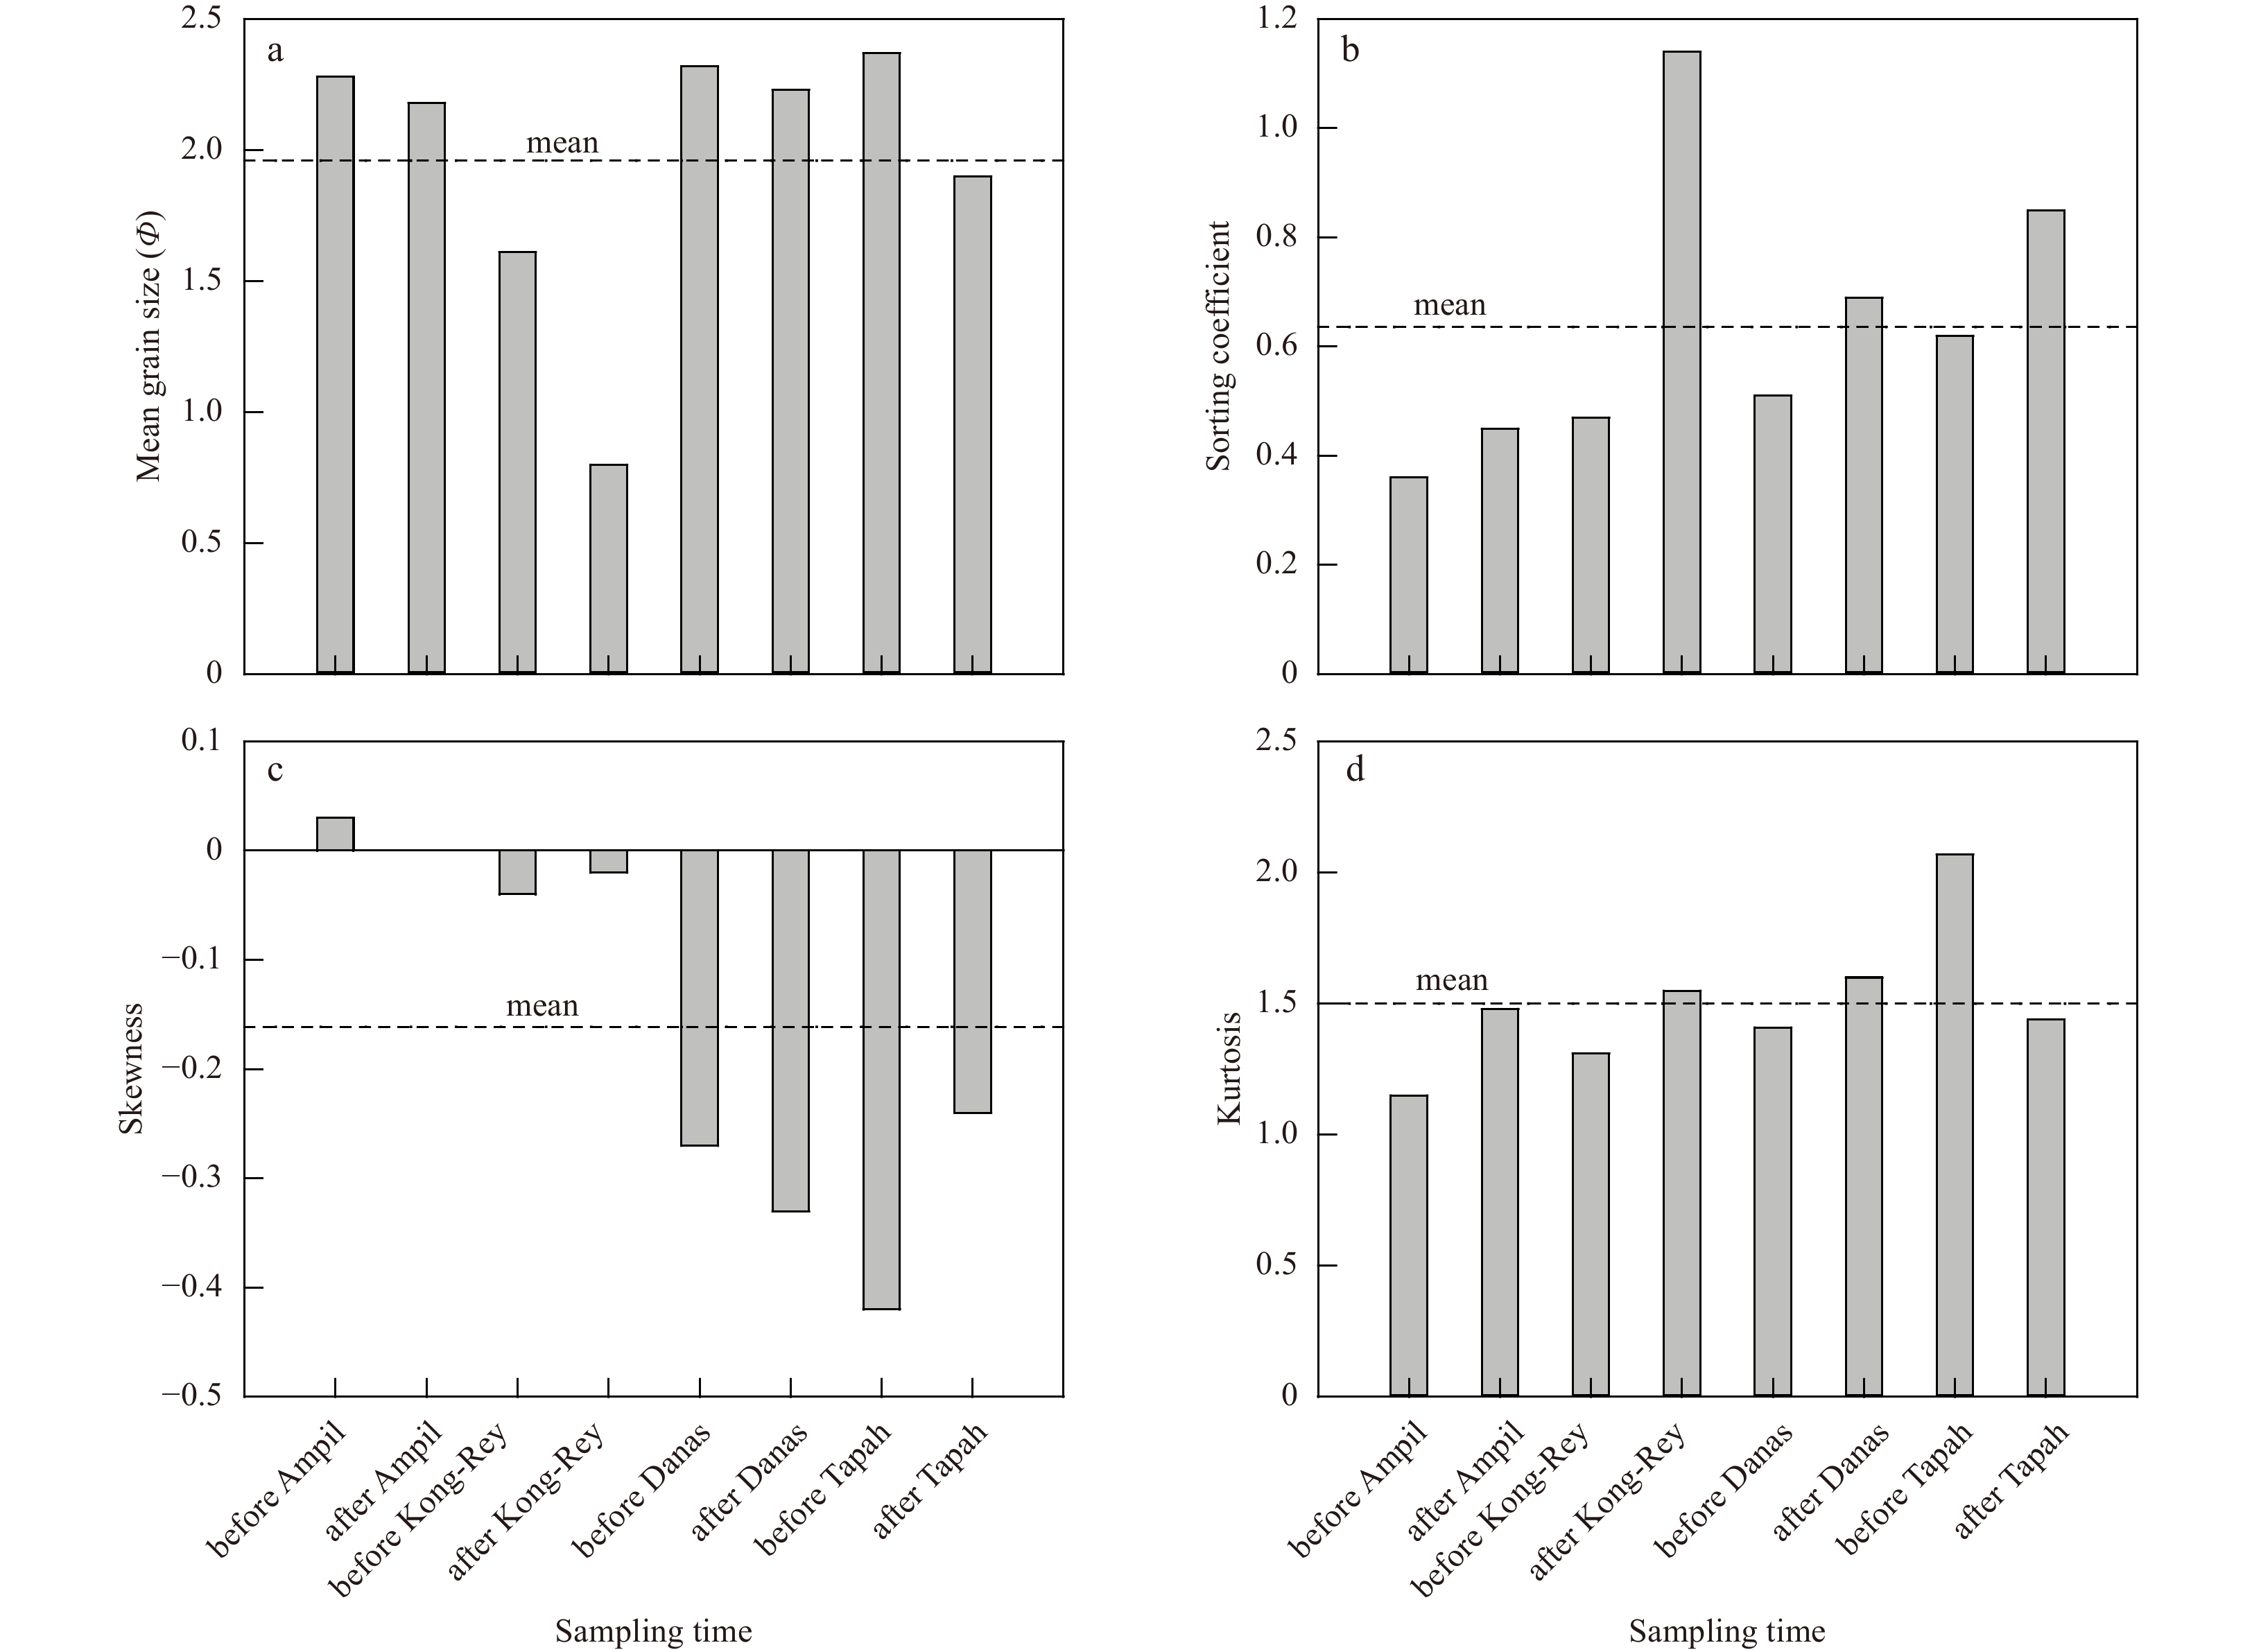
The surficial sediments of Dongsha beach primarily exhibited coarsening of the mean grain size under the influence of the four typhoon events (Fig. 6). Kong-Rey had the most considerable impact on the mean grain size, followed by Tapah, whereas those effects of Ampil and Danas on the mean grain size of beach sediments were small. In the variation of the sorting coefficient, the responses of the beach to the four typhoons were also relatively consistent, showing a worse sorting trend after each typhoon event. The skewness of the beach sediments showed a negative trend with different changes. The kurtosis of beach sediments changed from medium peak before the typhoons to narrow peak after the typhoons.
Figure
6.
Beach-averaged grain size parameters of surficial sediments on Dongsha before and after four typhoons in this study (the dashed lines show the mean values of data collected in eight field campaigns for each parameter).
In addition to the overall changes in grain size characteristics, we also analyzed sediment changes in the cross-shore and alongshore directions under the influence of the four typhoons, using the changes in mean grain size as an example. The results showed that no uniform pattern occurred in the cross-shore direction resulted from the four typhoons. Under the influence of Ampil and Danas, the variations in mean grain size in the cross-shore direction were relatively small, while those changes were larger after Kong-Rey and Tapah, with some gravel appearing on the beach (Fig. 7). In the alongshore direction, the mean grain size of the surficial sediments changed the most considerably on the southern beach, especially in profile DS11 (Fig. 8).
Figure
7.
Cross-shore mean grain size changes of surficial sediments on Dongsha beach before and after four typhoons: Ampil (a), Kong-Rey (b), Danas (c), and Tapah (d). The mean grain size values are the averaged values of each sampling position of Dongsha beach (P1, P2, P3, and P4, refer to Fig. 1d).
Figure
8.
Alongshore mean grain size changes of surficial sediments on Dongsha beach before and after four typhoons: Ampil (a), Kong-Rey (b), Danas (c), and Tapah (d). The mean grain size values are the averaged values of four samples on each typical profile of Dongsha beach (DS05, DS11, DS17, DS22, DS26, and DS30, refer to Fig. 1c).
3.3
Beach topographic response to different typhoon events
3.3.1
Accretion/erosion pattern
The pattern of beach accretion/erosion after the four typhoon events varied significantly. Dongsha beach suffered considerable erosion after typhoon Ampil, with a total beach volume change of −77 016.11 m3 (Fig. 9a). Typhoon Ampil caused the largest morphological change compared with the other three typhoon events. Erosion was the main pattern of the beach morphological response, with the largest erosion occurred at the central beach in the alongshore direction, while the two ends of the beach were relatively stable. In the cross-shore direction, the intertidal beach showed the largest erosion.
Figure
9.
Elevation changes of Dongsha beach after four typhoons: Ampil (a), Kong-Rey (b), Danas (c), and Tapah (d).
Figure 9b shows the pattern of erosion and accretion on Dongsha beach under the impact of Kong-Rey. The maximum vertical erosion and accretion of Dongsha beach were −1.30 m and 0.79 m, respectively, with a mean elevation change of −0.30 m. In total, the beach volume decreased by 70 095.04 m3 after typhoon Kong-Rey.
The total volume change of Dongsha caused by Danas was 9548.71 m3, with an average elevation change of only 0.04 m. The maximum elevation decrease and increase were 0.87 m and 0.94 m, respectively. The main cross-shore pattern of elevation change on the beach was the small erosion of the upper beach and accretion of the lower beach, while erosion occurred primarily in the southern and central beach in the alongshore direction.
Dongsha beach lost 19 979.95 m3 of sediments after typhoon Tapah. The elevation changes of Dongsha beach ranged from −0.58 m to 0.99 m, with an average of −0.09 m (Fig. 9d). No significant cross-shore pattern was found on the beach, whereas the southern and central beach exhibited more erosion than the northern part in the alongshore direction.
3.3.2
Typical profile morphology
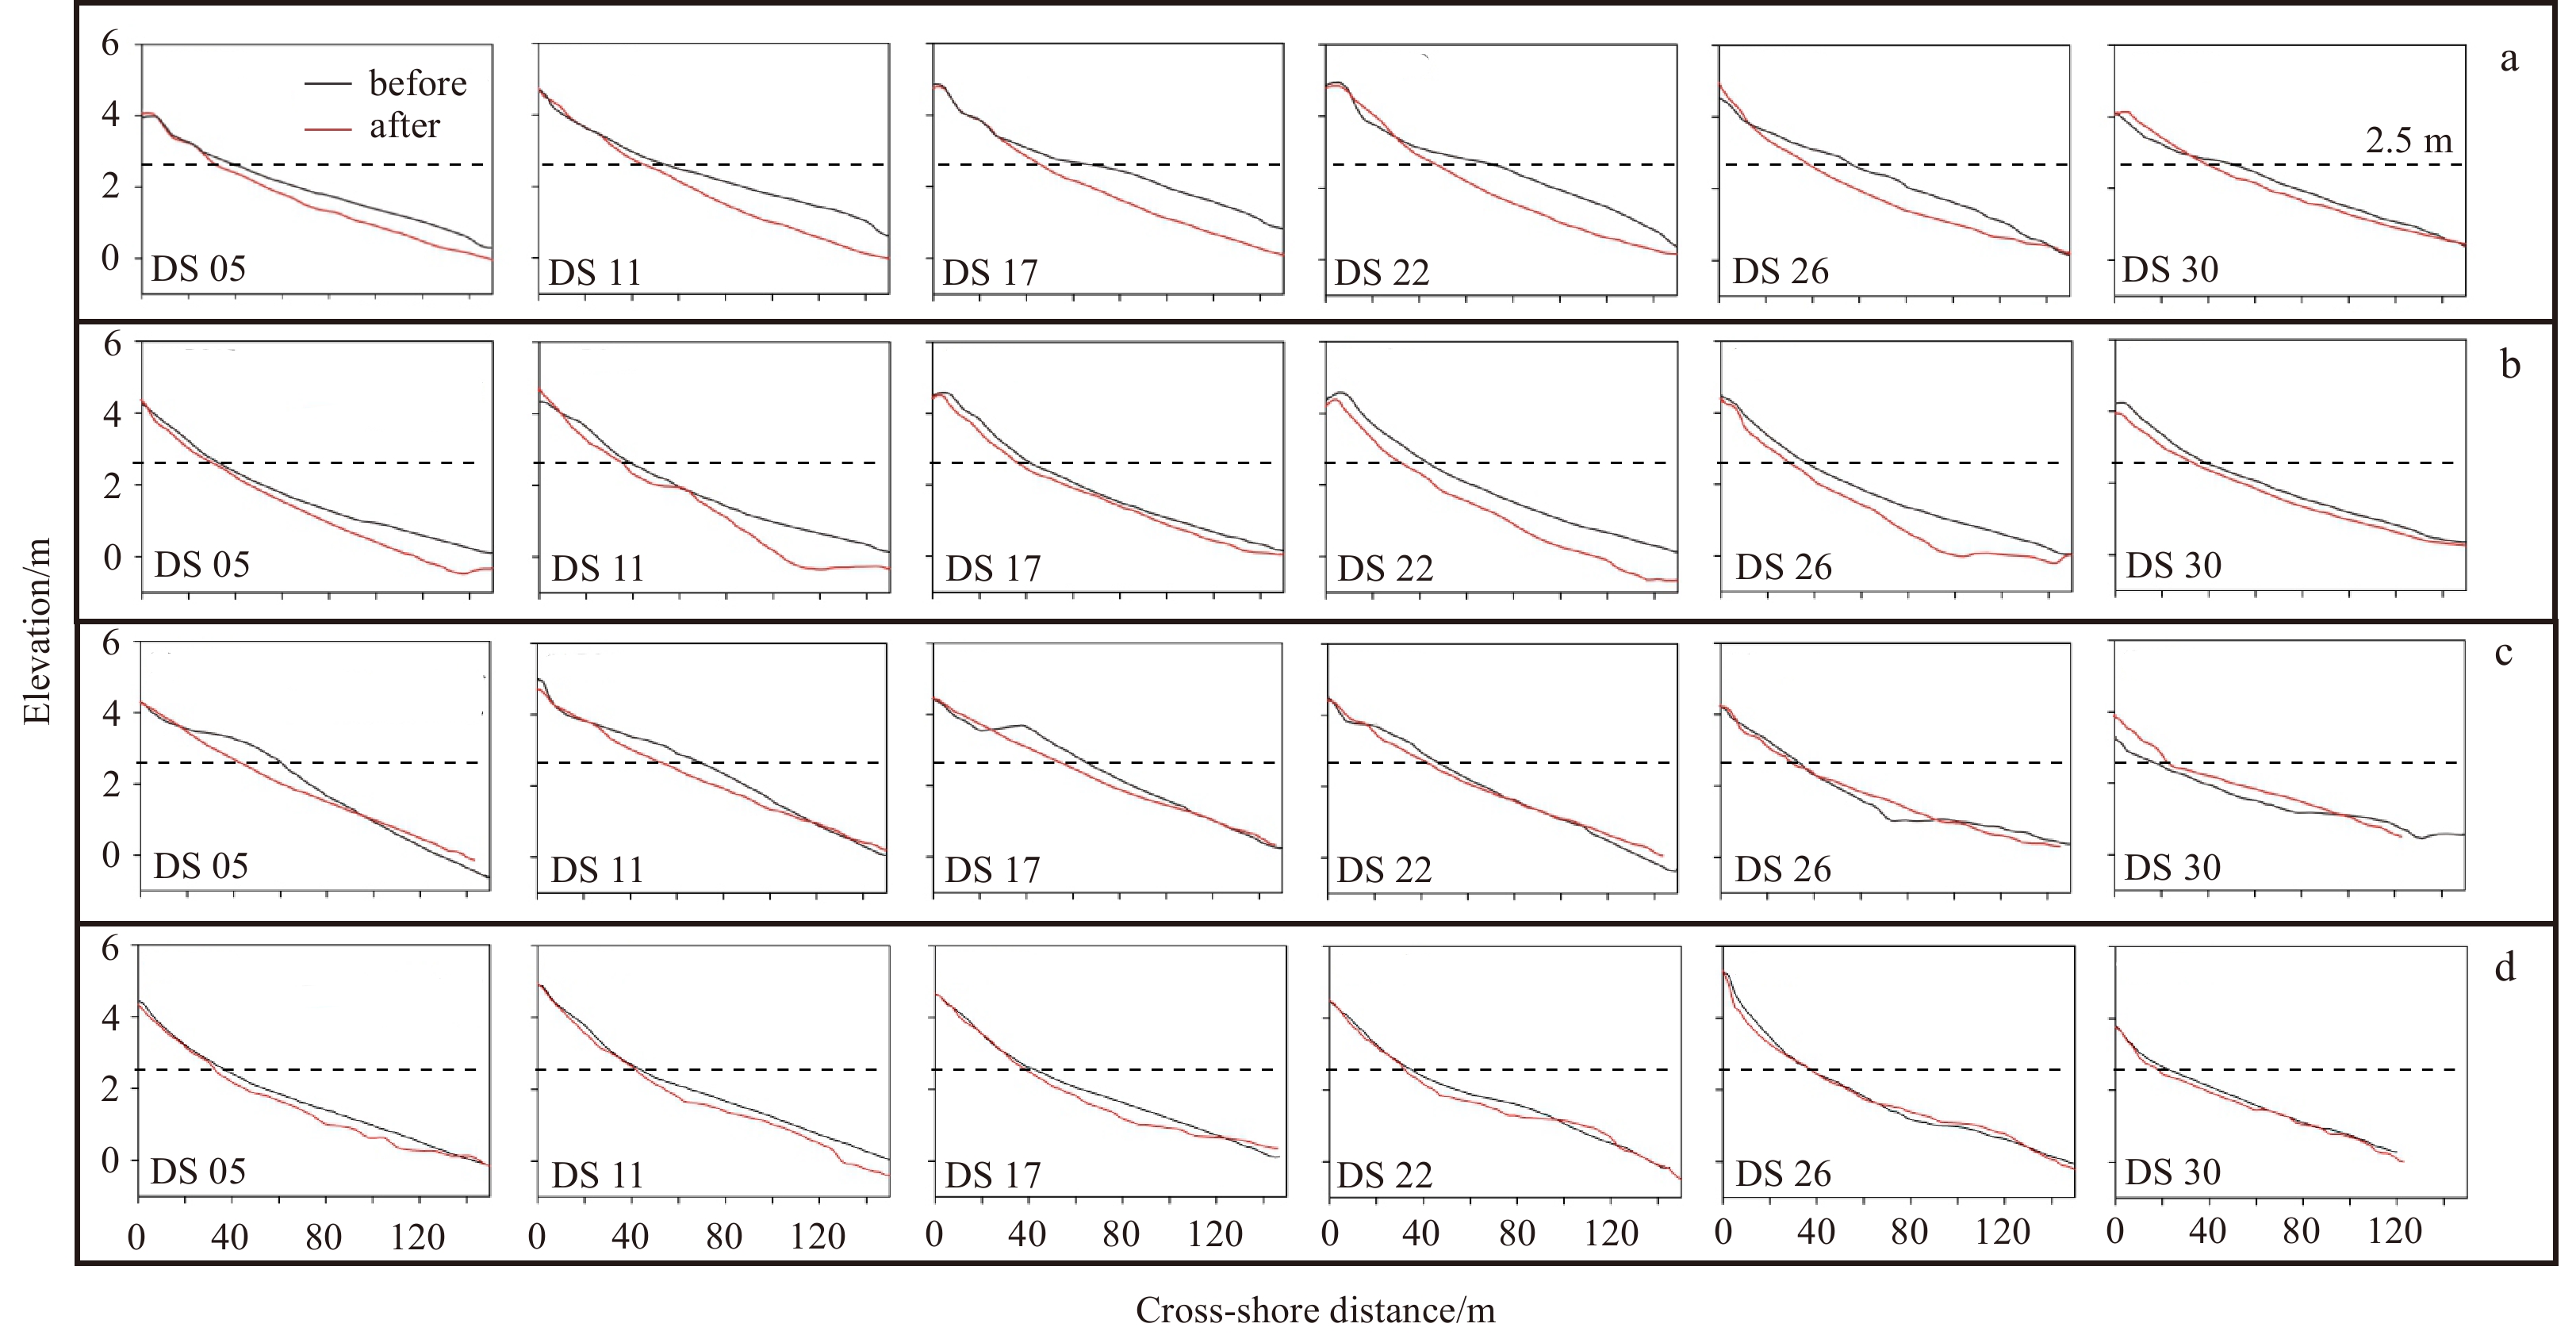
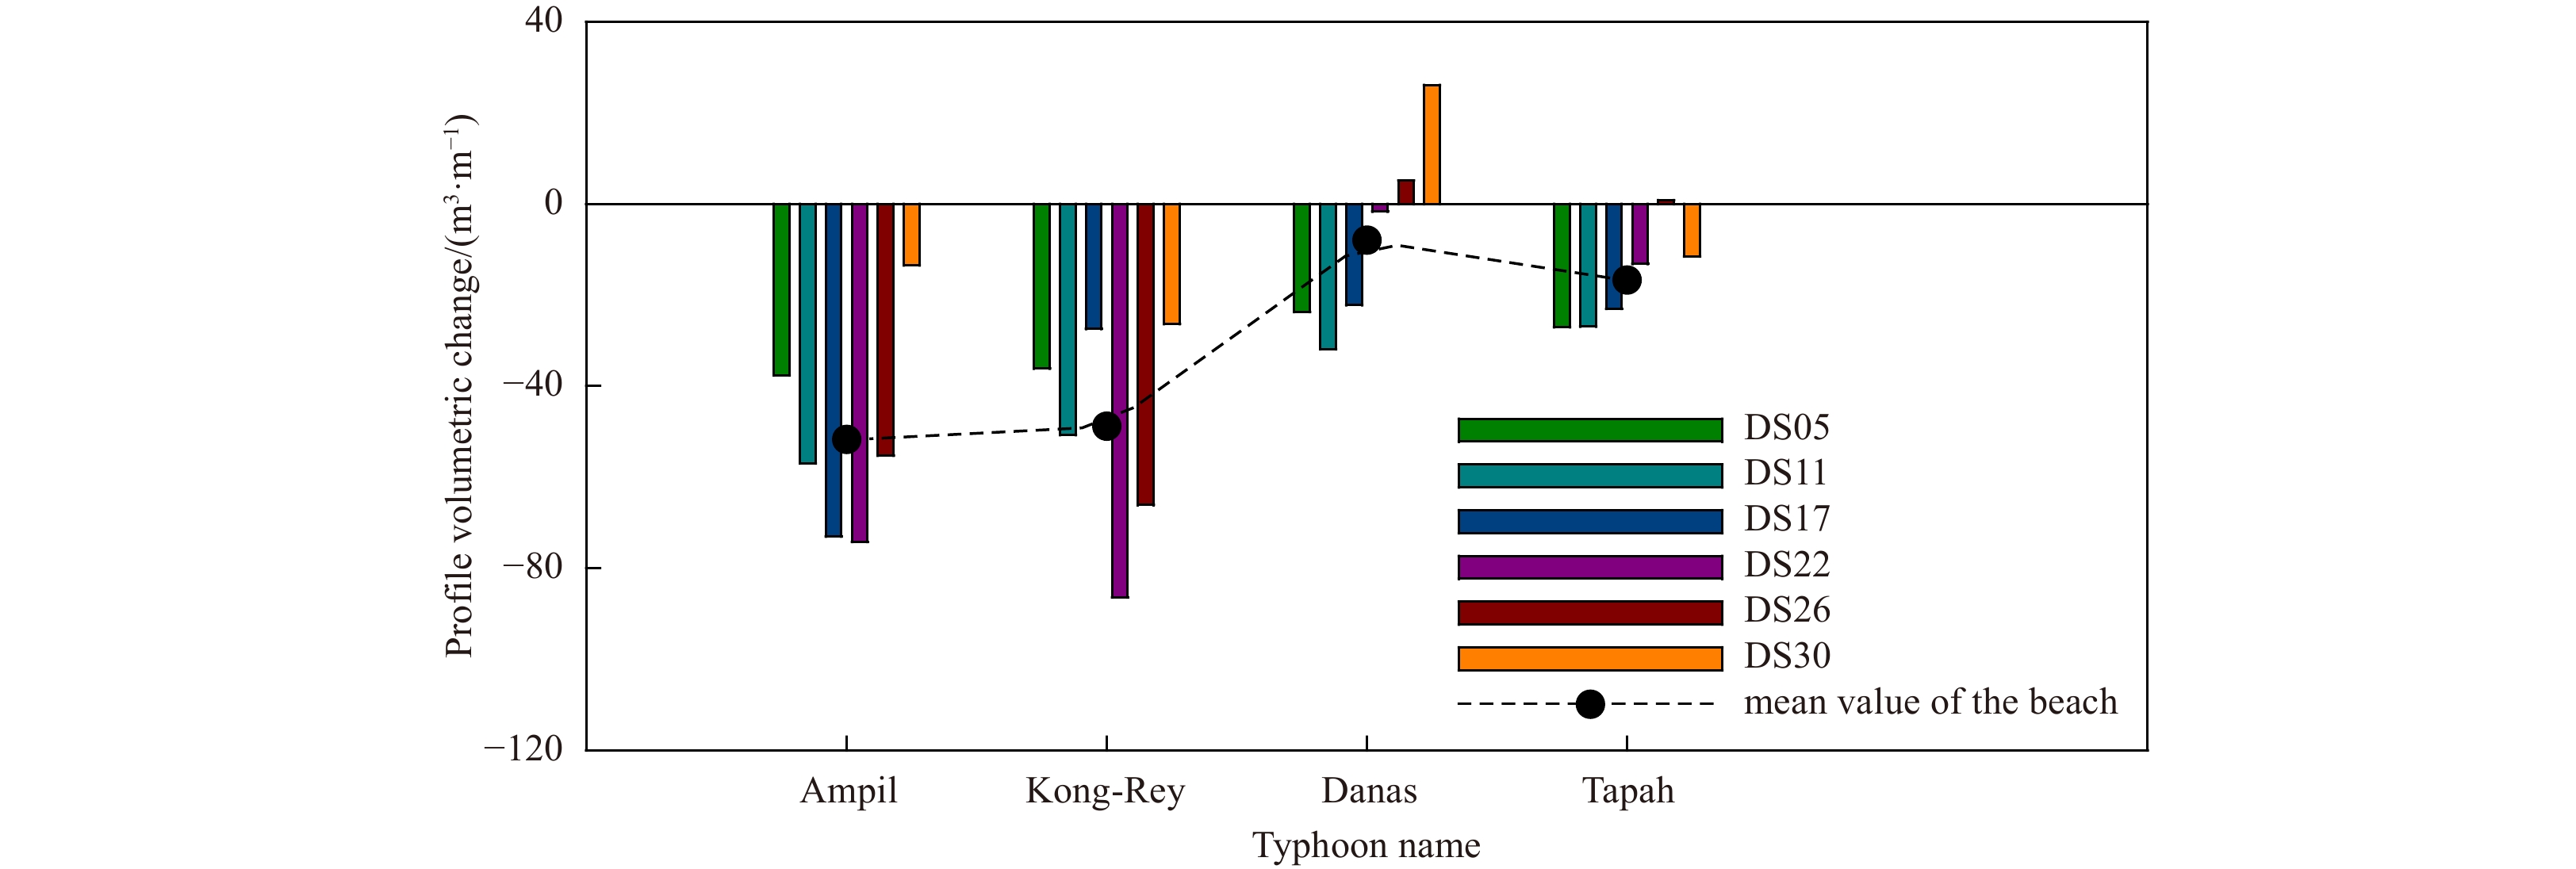
The profile morphologies of Dongsha beach before and after Ampil were similar, both profiles were flat with gentle slopes. Figure 10a shows six typical profiles before and after the impact of typhoon Ampil. DS11, DS17, DS22, and DS26 revealed severe erosion, while DS05 and DS30 (located at the shadow area of headland) had few changes. The volumetric changes of typical profiles at Dongsha beach under the influence of Ampil varied (Fig. 11). In the alongshore direction, erosion was largest in the central beach profiles and smallest in the profiles protected by headlands at both ends of the beach. In the cross-shore direction, erosion occurred primarily 30 m offshore along the profile.
Figure
10.
Typical profile morphology of Dongsha beach before and after four typhoon events: Ampil (a), Kong-Rey (b), Danas (c), and Tapah (d). The dashed lines show the 2.5 m elevation.
The profile of Dongsha beach before and after typhoon Kong-Rey contained a flat slope. The total subaerial beach profile showed erosion, with the maximum vertical erosion reaching −1.07 m (DS11). Figure 10b shows the six typical profile patterns before and after the impact of Kong-Rey. Beach profiles varied greatly under the influence of this typhoon, with no significant pattern, among which profiles DS11, DS22, and DS26 showed severe erosion.
The southern and central beach profiles had a beach berm before Danas, and then changed to a flat slope profile after Danas with the disappearance of the berm. Figure 10c shows the volumetric changes of six typical profiles of Dongsha beach. The southern (DS05, DS11) and central (DS17) profiles primarily showed flattening of the beach berm, while the remaining three typical profiles showed no erosion and few changes. Slight erosion in the southern and central parts of the beach and very little accretion in the north were the primary alongshore change patterns that occurred under the impact of Danas. In the cross-shore direction, the beach profiles showed a pattern of erosion at the upper beach and accretion at the lower beach, and most of the profiles showed accretion 120–150 m offshore.
Tapah occurred in the late 2019 typhoon season, and the beach profiles before and after this typhoon showed a gentle slope affected by the strong hydrodynamics of typhoon season (Fig. 10d). The averaged profile volumetric change of Dongsha beach was −18.58 m3/m, demonstrating that the subaerial beach showed an overall erosion. Figure 10d shows the morphological changes of six typical profiles before and after typhoon Tapah. The southern (DS05, DS11) and central (DS17, DS22) profiles of the beach primarily showed slight erosion or remained unchanged between 0–20 m offshore (above 2.5 m elevation) and eroded between 20–140 m offshore. With respect to the alongshore erosion characteristics, the southern and central parts of the beach eroded severely, while the northern part eroded slightly.
The comparison of beach profile volumetric changes after four typhoons showed that the largest erosion (−72.69 m3/m) was caused by typhoon Ampil, while the smallest erosion (−8.01 m3/m) was observed after typhoon Danas (Fig. 11). Similarly, the volumetric changes of the beach profiles under the influence of the four typhoons also had the significant alongshore divergence, with the larger erosion occurred at the southern (DS05, DS11) and central beach profiles (DS17, DS22), while the northern beach profiles were relatively stable. Further analysis of the beach profile volumetric changes before and after the four typhoons shows that the alongshore erosion locations were different, typhoons Danas and Tapah eroded the southern part of the beach most considerably, while erosion resulted from Ampil and Kong-Rey mainly occurred in the central part of the beach.
4.
Discussion
Waves, tides, storm surges, and winds may act on beaches and interact frequently to modify the geomorphology of the beach between extreme high and low tide levels (Masselink and Short, 1993). Beach morphology depends on the deposition, preservation, and transport of sediments under the combined effects of different wave conditions (e.g., wave height, wave length, and energy), tides, and currents (Jackson et al., 2017; Komar, 1983). In turn, the dynamics of beach micro-geomorphic features essentially depend on the breaking wave height, energy, incidence angle and setup, and the existing beach geomorphology (Ariffin et al., 2019). Tide is an important factor controlling the shift in the wave action location and the resulting geomorphological changes (Butt and Russell, 2000; Sreenivasulu et al., 2017; Wright and Short, 1984), and the maximum geomorphological changes in the surf zone are primarily caused by fluctuations in tidal levels (Masselink and Hegge, 1995; Mujal-Colilles et al., 2019) and wave dynamics (Brinkkemper et al., 2018). The period in which the storm peak is located within the tidal cycle also affects the impact of the storm on the beach (Anthony, 2013; Masselink et al., 2016). Dramatic topographic changes at the upper beach can enhance reflectivity in the surf zone, while only breaking waves act within the wider surf zone at low tide (Wright and Short, 1983). In addition to the aforementioned forces, there has been a remarkable increase in impacts of human activities on beaches in recent years (Guo et al., 2020; Kaczkowski et al., 2018; Seymour et al., 2005). The beach response to storm event is a result of a combination of factors, and it is difficult to screen or strip the influence of one factor (Coco et al., 2014). In this study, using the data from field campaigns and the collected typhoon characteristics, we focused on the influences of beach topographic state before the typhoon, the typhoon characteristics, and the tidal condition on the beach response to the typhoon events.
4.1
Impact of beach topographic state before typhoon event
The topographic state of beach before a storm affects the beach response to storms (Wright and Short, 1984). Waves are not the only controlling factor of beach response to storms, as the process of breaking and deformation of nearshore waves into shallow water works in conjunction with the beach topography before the storm (Coco et al., 2014). The state of beach topography varied before and after the four typhoons. Beach berm existed in the southern part before typhoons Danas and Tapah (Figs 10c, d), while the beach was flat without berm before typhoons Ampil and Kong-Rey (Figs 10c, d). Profiles with beach berms before typhoon events always showed the disappearance of berms, while those without beach berms showed a similar flat shape and lower elevation. The beach slope before typhoon had a tendency to gradually increase over the year, however, with the constant erosion under the influence of typhoon, the slope was getting steeper and steeper.
Beach nourishments can make large-scale nearshore disturbances that affect the sediment transport balance of the beach, and then influence the topographic state (Dean, 1983; Elko and Wang, 2007; Kaczkowski et al., 2018; Li et al., 2022; Seymour et al., 2005). Placing large volumes of sand on the subaerial beach can result in the unnaturally steep profile, causing large offshore transports and a rapid decrease of the beach width (de Schipper et al., 2021). The borrowed sediments may need time to adjust to the local environment and to be redistributed by the hydrodynamics. Moreover, the initial sand placement area may be eroded the fastest in the months after nourishment project, especially during the first few storms (Elko and Wang, 2007; Luijendijk et al., 2017). The last nourishment on Dongsha beach was implemented on May 18, 2017 (Guo et al., 2020), and the time interval from the last nourishment to the days right after the four typhoons were 429 d, 505 d, 792 d, and 856 d, respectively (Table 3). In general, super typhoons can cause stronger hydrodynamics than severe tropical storms, which in turn causes more severe beach erosion. However, tropical storm Ampil caused a similar erosion as super typhoon Kong-Rey, indicating that the time interval between the typhoon and the last beach nourishment may also affect the morphological changes of Dongsha beach.
Table
3.
Beach states before typhoons and the beach responses to typhoons
The four typhoons affected the study area with different durations, peak Hs, and main wave directions, which may be a primary reason for the difference captured in the beach responses to typhoons. Kong-Rey and Danas had the longest (21 h) and shortest (10 h) durations, respectively, showing that the longer the duration of the typhoon impact, the greater the beach erosion. The relationship between typhoon intensity and beach erosion was further analyzed by using the storm power index Ps (m2·h) (Dolan and Davis, 1992), which was calculated as: ${P}_{{\rm{s}}}= {H}_{{\rm{max}}}^{2}\cdot D$, in which Hmax represents the maximum (peak) storm significant wave height, and D is the duration of “storm conditions” in hours. The storm power indexes of Ampil, Kong-Rey, Danas, and Tapah are 254.60 m2·h, 399.20 m2·h, 219 m2·h, and 292 m2·h, respectively (Fig. 12a). Typhoon Ampil caused severe erosion despite its low storm intensity, which may be the result of the pre-typhoon beach topographic state.
Figure
12.
Correlation between typhoon storm power index and profile volumetric change (a), and correlation between typhoon induced surge and profile volumetric change (b).
The main wave directions (E, NE, SE, and E; Table 4) during the four typhoons were wave directions that could directly impact Dongsha beach, resulting in erosion on the subaerial beach after the four typhoons. Comparing the characteristics of Ampil and Kong-Rey and the induced profile volumetric changes, we found that similar wave directions, different impact durations, and different Hs can cause considerable beach erosion, indicating that typhoon characteristics are not the only influencing factors. In addition, the sediment data showed that the occurrence of successive typhoons had a cumulative effect on the sediment, especially on the mean grain size and sorting coefficient (Fig. 6). The analyses of Ampil and Kong-Rey in 2018 and Danas and Tapah in 2019 showed that a second typhoon occurring in the same year continued to enhance the effects of the previous typhoon on sediment coarsening and worsened sorting. However, no correlation was found between the effects of typhoons that occurred in different years (2018 and 2019) on sediment, which may be related to beach recovery.
Table
4.
Different typhoon characteristics and the beach response to typhoons
With respect to typhoon tracks, the four typhoons in this study all exhibited offshore steering according to the classification proposed by Wang et al. (2011) and can be classified as causing strong typhoon precipitation and catastrophic gales in the study area. Therefore, the difference in the impacts of typhoons with different tracks on Dongsha beach could not be determined based on the available data. Cai et al. (2004) found that typhoons had a more remarkable impact on the beach when the beach is located on the right side of the typhoon’s forward direction, causing drastic beach changes and erosion. Besides, air pressure and wind fields during the typhoon event can affect the storm surge (Kuang et al., 2020) and then further influence the morphological response of the beach (Han et al., 2022; Liu et al., 2022). More data need to be collected in future studies to further discuss the impact of different typhoon characteristics on the beach response.
4.3
Impact of tidal conditions
The tide is an important factor controlling the shift in the location of wave action and the resulting changes in beach geomorphology (Butt and Russell, 2000; Sreenivasulu et al., 2017; Wright and Short, 1984), and the different combination of high and low tide levels or spring and neap tides with a typhoon storm may have various effects on beach morphological changes. Danas affected the study area during high tide, whereas the other three typhoons affected the study area during low tide (Table 1). However, regardless of whether the typhoon occurred at high tide or low tide, the nearshore tidal level did not exceed 2.50 m during the four typhoons (Fig. 5), which may be the main reason for the small variation in the beach profile above the 2.50 m elevation (above the high tide level). Beach erosion is usually accompanied by lower elevation and flatter slope (Armaroli et al., 2013; Yin et al., 2019), while Dongsha beach showed a steeper slope for the subaerial beach year by year. This may be due to the fewer elevation changes of beach profiles above the high tide level and the continuous elevation decrease in the intertidal profiles. With respect to storm surge, the maximum storm surges caused by Ampil, Kong-Rey, Danas, and Tapah were 0.69 m, 0.85 m, 0.60 m, and 0.98 m, respectively, showing no significant correlation between storm surge and the changes in profile volume (Fig. 12b). In addition to the difference in tidal range and surge, the difference between high and low tide processes also has an impact on beach morphodynamics (Dan et al., 2020; Pang et al., 2019), and the acquisition of nearshore hydrodynamic data with higher temporal resolution is needed in subsequent studies.
5.
Conclusions
In this study, we focused on the typhoon storm response of an embayed sandy beach, using beach topographies and surficial sediment characteristics acquired before and after four typhoon events with varying intensities.
The four typhoons had different impacts on the topography and sediment characteristics of Dongsha beach. The profile morphologies varied before the four typhoon events, while they all changed with elevation decrease and steeper slope after the typhoon. Typhoons Ampil and Danas caused the largest (−51.72 m3/m) and the smallest erosion (−8.01 m3/m), respectively. Remarkable alongshore patterns of beach profile volumetric changes were found after the four typhoon events, with more erosion in the southern and central parts of the beach and few changes in the northern part. The grain size coarsening and poor sorting were the main sediment change patterns on Dongsha beach under the influence of different typhoons. Typhoons that occurred later in the same year would continue to enhance the effect of the previous typhoon on sediment coarsening and sorting variability, but this cumulative effect was not found between typhoons that occurred in different years.
A comparison of the collected data revealed that the beach topographic state before the typhoon, typhoon characteristics, and tidal conditions were possible reasons for the difference in the response of Dongsha beach to typhoon events. Generally, more severe beach erosion was caused by typhoons with higher intensity levels and longer durations, but human intervention may make a difference. High tide levels during typhoons can determine the upper limit of the beach profile erosion site. These results can help to improve beach management for storm prevention.
Acknowledgements:
The authors thank the National Meteorological Center of China for the open-source typhoon data and Google Earth for the open-source remote sensing data.
Aagaard T, Hughes M, Baldock T, et al. 2012. Sediment transport processes and morphodynamics on a reflective beach under storm and non-storm conditions. Marine Geology, 326–328: 154–165
Anthony E J. 2013. Storms, shoreface morphodynamics, sand supply, and the accretion and erosion of coastal dune barriers in the southern North Sea. Geomorphology, 199: 8–21. doi: 10.1016/j.geomorph.2012.06.007
Ariffin E H, Sedrati M, Akhir M F, et al. 2019. Short-term observations of beach morphodynamics during seasonal monsoons: two examples from Kuala Terengganu coast (Malaysia). Journal of Coastal Conservation, 23(6): 985–994. doi: 10.1007/s11852-019-00703-0
Armaroli C, Grottoli E, Harley M D, et al. 2013. Beach morphodynamics and types of foredune erosion generated by storms along the Emilia-Romagna coastline, Italy. Geomorphology, 199: 22–35. doi: 10.1016/j.geomorph.2013.04.034
Brinkkemper J A, Aagaard T, de Bakker A T M, et al. 2018. Shortwave sand transport in the shallow surf zone. Journal of Geophysical Research: Earth Surface, 123(5): 1145–1159. doi: 10.1029/2017JF004425
Burvingt O, Masselink G, Russell P, et al. 2017. Classification of beach response to extreme storms. Geomorphology, 295: 722–737. doi: 10.1016/j.geomorph.2017.07.022
Burvingt O, Masselink G, Scott T, et al. 2018. Climate forcing of regionally-coherent extreme storm impact and recovery on embayed beaches. Marine Geology, 401: 112–128. doi: 10.1016/j.margeo.2018.04.004
Butt T, Russell P. 2000. Hydrodynamics and cross-shore sediment transport in the swash-zone of natural beaches: a review. Journal of Coastal Research, 16(2): 255–268
Cai Feng. 2019. Brief Introduction of Chinese Beach Resources (in Chinese). Beijing: Ocean Press, 1–395
Cai Feng, Lei Gang, Su Xianze, et al. 2006. Study on process response of Fujian beach geomorphology to typhoon aere. The Ocean Engineering (in Chinese), 24(1): 98–109
Cai Feng, Su Xianze, Xia Dongxing. 2004. Study on the difference between storm effects of beaches on two sides of the tropical cyclone track—Taking the responses of beaches to No. 0307 typhoon Imbudo as an example. Advances in Marine Science (in Chinese), 22(4): 436–445
Carver R E. 1971. Procedures in Sedimentary Petrology. New York, NY: Wiley-Interscience
Castelle B, Marieu V, Bujan S, et al. 2015. Impact of the winter 2013–2014 series of severe western Europe storms on a double-barred sandy coast: Beach and dune erosion and megacusp embayments. Geomorphology, 238: 135–148. doi: 10.1016/j.geomorph.2015.03.006
Cheng Lin, Shi Lianqiang, Xia Xiaoming, et al. 2014. Sedimentation and recent morphological changes at Dongsha beach, Zhujiajian Island, Zhejiang Province. Marine Geology & Quaternary Geology (in Chinese), 34(1): 37–44
Coco G, Senechal N, Rejas A, et al. 2014. Beach response to a sequence of extreme storms. Geomorphology, 204: 493–501. doi: 10.1016/j.geomorph.2013.08.028
Cooper J A G, Jackson D W T, Navas F, et al. 2004. Identifying storm impacts on an embayed, high-energy coastline: examples from western Ireland. Marine Geology, 210(1–4): 261–280
Dan S, Vandenabeele S, Verwaest T, et al. 2020. Hydrodynamics versus sediment concentration at the Belgian coast. Journal of Coastal Research, 95(sp1): 632–636. doi: 10.2112/SI95-123.1
de Schipper M A, Ludka B C, Raubenheimer B, et al. 2021. Beach nourishment has complex implications for the future of sandy shores. Nature Reviews Earth & Environment, 2(1): 70–84
Dean R G. 1983. Principles of Beach Nourishment. In: Komar P D, ed. Handbook of Coastal Processes and Erosion. Boca Raton: CRC Press, 217–232
Dolan R, Davis R E. 1992. An intensity scale for Atlantic coast northeast storms. Journal of Coastal Research, 8(4): 840–853
Elko N A, Wang Ping. 2007. Immediate profile and planform evolution of a beach nourishment project with hurricane influences. Coastal Engineering, 54(1): 49–66. doi: 10.1016/j.coastaleng.2006.08.001
Folk R L, Ward X C. 1957. Brazos river bar: a study in the significance of grain size parameters. Journal of Sedimentary Research, 27(1): 3–26. doi: 10.1306/74D70646-2B21-11D7-8648000102C1865D
Forbes D L, Parkes G S, Manson G K, et al. 2004. Storms and shoreline retreat in the southern Gulf of St. Lawrence. Marine Geology, 210(1–4): 169–204
Guo Junli, Shi Lianqiang, Chen Shenliang, et al. 2019. Response of Dongsha beach in Zhoushan to continuous storms based on Argus images. Oceanologia et Limnologia Sinica (in Chinese), 50(4): 728–739
Guo Junli, Shi Lianqiang, Pan Shunqi, et al. 2020. Monitoring and evaluation of sand nourishments on an embayed beach exposed to frequent storms in eastern China. Ocean & Coastal Management, 195: 105284
Guo Junli, Shi Lianqiang, Tong Xiaoling, et al. 2018. The response to tropical storm Nakri and the restoration of Dongsha Beach in Zhujiajian Island, Zhejiang Province. Haiyang Xuebao (in Chinese), 40(9): 137–147
Haerens P, Bolle A, Trouw K, et al. 2012. Definition of storm thresholds for significant morphological change of the sandy beaches along the Belgian coastline. Geomorphology, 143–144: 104–117
Han Xuejian, Kuang Cuiping, Zhu Lei, et al. 2022. Hydrodynamical and morphological patterns of a sandy coast with a beach nourishment suffering from a storm surge. Coastal Engineering Journal, 64(1): 83–99. doi: 10.1080/21664250.2021.1992997
Jackson N L, Nordstrom K F, Farrell E J. 2017. Longshore sediment transport and foreshore change in the swash zone of an estuarine beach. Marine Geology, 386: 88–97. doi: 10.1016/j.margeo.2017.02.017
Kaczkowski H L, Kana T W, Traynum S B, et al. 2018. Beach-fill equilibration and dune growth at two large-scale nourishment sites. Ocean Dynamics, 68(9): 1191–1206. doi: 10.1007/s10236-018-1176-2
Karunarathna H, Pender D, Ranasinghe R, et al. 2014. The effects of storm clustering on beach profile variability. Marine Geology, 348: 103–112. doi: 10.1016/j.margeo.2013.12.007
Komar P D. 1983. Beach processes and erosion-an introduction. In: Komar P D, ed. Handbook of Coastal Processes and Erosion. Boca Raton: CRC Press, 1–20
Kuang Cuiping, Liang Huidi, Gu Jie, et al. 2020. Morphological responses of unsheltered channel-shoal system to a major storm: the combined effects of surges, wind-driven currents and waves. Marine Geology, 427: 106245. doi: 10.1016/j.margeo.2020.106245
Li Yuan, Zhang Chi, Dai Weiqi, et al. 2022. Laboratory investigation on morphology response of submerged artificial sandbar and its impact on beach evolution under storm wave condition. Marine Geology, 443: 106668. doi: 10.1016/j.margeo.2021.106668
Liu Xu, Kuang Cuiping, Huang Shichang, et al. 2022. Modelling morphodynamic responses of a natural embayed beach to Typhoon Lekima encountering different tide types. Anthropocene Coasts, 5(1): 4. doi: 10.1007/s44218-022-00004-4
Loureiro C, Ferreira Ó, Cooper J A G. 2012. Geologically constrained morphological variability and boundary effects on embayed beaches. Marine Geology, 329–331: 1–15
Luijendijk A, Hagenaars G, Ranasinghe R, et al. 2018. The State of the World’s Beaches. Scientific Reports, 8(1): 6641. doi: 10.1038/s41598-018-24630-6
Luijendijk A P, Ranasinghe R, de Schipper M A, et al. 2017. The initial morphological response of the Sand Engine: a process-based modelling study. Coastal Engineering, 119: 1–14. doi: 10.1016/j.coastaleng.2016.09.005
Masselink G, Hegge B. 1995. Morphodynamics of meso- and macrotidal beaches: examples from central Queensland, Australia. Marine Geology, 129(1–2): 1–23
Masselink G, Scott T, Poate T, et al. 2016. The extreme 2013/2014 winter storms: hydrodynamic forcing and coastal response along the southwest coast of England. Earth Surface Processes and Landforms, 41(3): 378–391. doi: 10.1002/esp.3836
Masselink G, Short A D. 1993. The effect of tide range on beach morphodynamics and morphology: a conceptual beach model. Journal of Coastal Research, 9(3): 785–800
Mujal-Colilles A, Grifoll M, Falqués A. 2019. Rhythmic morphology in a microtidal low-energy beach. Geomorphology, 334: 151–164. doi: 10.1016/j.geomorph.2019.02.037
Pang Wenhong, Dai Zhijun, Ge Zhenpeng, et al. 2019. Near-bed cross-shore suspended sediment transport over a meso-macro tidal beach under varied wave conditions. Estuarine, Coastal and Shelf Science, 217: 69–80
Prodger S, Russell P, Davidson M, et al. 2016. Understanding and predicting the temporal variability of sediment grain size characteristics on high-energy beaches. Marine Geology, 376: 109–117. doi: 10.1016/j.margeo.2016.04.003
Qi Hongshuai, Cai Feng, Lei Gang, et al. 2010. The response of three main beach types to tropical storms in South China. Marine Geology, 275(1–4): 244–254
Sancho-García A, Guillén J, Ojeda E. 2013. Storm-induced readjustment of an embayed beach after modification by protection works. Geo-Marine Letters, 33(2–3): 159–172
Second Institute of Oceanography. 2012. Integrated Report on the Results of the Coastal Zone Survey of Zhejiang’s Islands (in Chinese). Hangzhou: Second Institute of Oceanography
Senechal N, Coco G, Castelle B, et al. 2015. Storm impact on the seasonal shoreline dynamics of a meso- to macrotidal open sandy beach (Biscarrosse, France). Geomorphology, 228: 448–461. doi: 10.1016/j.geomorph.2014.09.025
Seymour R, Guza R T, O’Reilly W, et al. 2005. Rapid erosion of a small southern California beach fill. Coastal Engineering, 52(2): 151–158. doi: 10.1016/j.coastaleng.2004.10.003
Shepard D. 1968. A two-dimensional interpolation function for irregularly-spaced data. In: Proceedings of the 1968 23rd ACM National Conference. New York, NY: ACM, 517–524
Sreenivasulu G, Jayaraju N, Reddy B C S R, et al. 2017. Coastal morphodynamics of Tupilipalem coast, Andhra Pradesh, southeast coast of India. Current Science, 112(4): 823–829. doi: 10.18520/cs/v112/i04/823-829
Third Institute of Oceanography. 2010. Coast erosion assessment and control: The final investigation and assessment (in Chinese). In: Research Report on Marine Erosion in Fujian Province. Xiamen: Third Institute of Oceanography, 39−59
Vousdoukas M I, Ranasinghe R, Mentaschi L, et al. 2020. Sandy coastlines under threat of erosion. Nature Climate Change, 10(3): 260–263. doi: 10.1038/s41558-020-0697-0
Wang Lei, Li Xiaoli, Xu Zheyong. 2011. Analysis on climatic characteristics of typhoon over the past 50 years at Zhoushan. Marine Forecasts (in Chinese), 28(5): 36–43
Wright L D, Short A D. 1983. Morphodynamics of beaches and surf zones in Australia. In: Komar P D, ed. Handbook of Coastal Processes and Erosion. Boca Raton: CRC Press, 35–64
Wright L D, Short A D. 1984. Morphodynamic variability of surf zones and beaches: a synthesis. Marine Geology, 56(1–4): 93–118
Xia Xiaoming. 2014. China’s Islands: Zhejiang (Volume II: Zhoushan Archipelago) (in Chinese). Beijing: China Ocean Press
Yin Kai, Xu Sudong, Huang Wenrui, et al. 2019. Modeling beach profile changes by typhoon impacts at Xiamen coast. Natural Hazards, 95(3): 783–804. doi: 10.1007/s11069-018-3520-8
Qiujia Lei, Xinkai Wang, Yifei Liu, et al. Monitoring Change and Recovery of an Embayed Beach in Response to Typhoon Storms Using UAV LiDAR. Drones, 2024, 8(5): 172. doi:10.3390/drones8050172
Table
1.
Information of four typhoon events affecting the study area in this study during 2018 and 2019
Typhoon
Classification
Affecting time span
Affecting duration/h
Ampil
severe tropical storm
2018/07/21 20:00 – 2018/07/22 13:00
17
Kong-Rey
super typhoon
2018/10/05 02:00 – 2018/10/05 23:00
21
Danas
severe tropical storm
2019/07/19 07:00 – 2019/07/19 17:00
10
Tapah
typhoon
2019/09/21 11:00 – 2019/09/22 05:00
18
Note: Affecting time span was detected according to the data collected from the typhoon website of National Meteorological Center of China (http://typhoon.nmc.cn/).
Figure 1. Sketch of study area, topography and sediment measurement settings: location of Zhuajiajian Island (a), locations of tidal gauge and wave buoy (b), typical profiles setting on Dongsha beach (c) and the sampling sites (green rectangles) on each profile (d). DS05, DS11, DS17, DS22, DS26, and DS30 in c are the typical profiles set on Dongsha, while P1, P2, P3, and P4 are the cross-shore sampling sites on each typical profile with a space interval of 50 m. The satellite images were downloaded from Google Earth.
Figure 2. Moving tracks of four typhoon events affecting Zhujiajian Island during the study period.
Figure 3. The wind speed and atmospheric pressure at the centers of the four typhoon events: wind speed of Ampil (a), atmospheric pressure of Ampil (b), wind speed of Kong-Rey (c), atmospheric pressure of Kong-Rey (d), wind speed of Danas (e), atmospheric pressure of Danas (f), wind speed of Tapah (g), and atmospheric pressure of Tapah (h).
Figure 4. Significant wave heights and mean wave directions during four typhoon events.
Figure 5. Tidal levels and surge levels during four typhoon events: Ampil (a), Kong-Rey (b), Danas (c), and Tapah (d).
Figure 6. Beach-averaged grain size parameters of surficial sediments on Dongsha before and after four typhoons in this study (the dashed lines show the mean values of data collected in eight field campaigns for each parameter).
Figure 7. Cross-shore mean grain size changes of surficial sediments on Dongsha beach before and after four typhoons: Ampil (a), Kong-Rey (b), Danas (c), and Tapah (d). The mean grain size values are the averaged values of each sampling position of Dongsha beach (P1, P2, P3, and P4, refer to Fig. 1d).
Figure 8. Alongshore mean grain size changes of surficial sediments on Dongsha beach before and after four typhoons: Ampil (a), Kong-Rey (b), Danas (c), and Tapah (d). The mean grain size values are the averaged values of four samples on each typical profile of Dongsha beach (DS05, DS11, DS17, DS22, DS26, and DS30, refer to Fig. 1c).
Figure 9. Elevation changes of Dongsha beach after four typhoons: Ampil (a), Kong-Rey (b), Danas (c), and Tapah (d).
Figure 10. Typical profile morphology of Dongsha beach before and after four typhoon events: Ampil (a), Kong-Rey (b), Danas (c), and Tapah (d). The dashed lines show the 2.5 m elevation.
Figure 11. Profile volumetric changes of Dongsha beach caused by four typhoons in this study.
Figure 12. Correlation between typhoon storm power index and profile volumetric change (a), and correlation between typhoon induced surge and profile volumetric change (b).


 DownLoad:


 DownLoad:


 DownLoad: