Hequan Gu, Feng Zhao, Zhixin Ni, Meigui Wu, Li Zhao, Aicui Dang, Dongmei Li, Minxia Zhang, Qin Hu. Using radium isotopes to evaluate the uncertainty of submarine groundwater discharge in the northeast and entirety of Daya Bay[J]. Acta Oceanologica Sinica, 2023, 42(8): 24-31. doi: 10.1007/s13131-023-2181-y
Citation:
Hequan Gu, Feng Zhao, Zhixin Ni, Meigui Wu, Li Zhao, Aicui Dang, Dongmei Li, Minxia Zhang, Qin Hu. Using radium isotopes to evaluate the uncertainty of submarine groundwater discharge in the northeast and entirety of Daya Bay[J]. Acta Oceanologica Sinica, 2023, 42(8): 24-31. doi: 10.1007/s13131-023-2181-y
Hequan Gu, Feng Zhao, Zhixin Ni, Meigui Wu, Li Zhao, Aicui Dang, Dongmei Li, Minxia Zhang, Qin Hu. Using radium isotopes to evaluate the uncertainty of submarine groundwater discharge in the northeast and entirety of Daya Bay[J]. Acta Oceanologica Sinica, 2023, 42(8): 24-31. doi: 10.1007/s13131-023-2181-y
Citation:
Hequan Gu, Feng Zhao, Zhixin Ni, Meigui Wu, Li Zhao, Aicui Dang, Dongmei Li, Minxia Zhang, Qin Hu. Using radium isotopes to evaluate the uncertainty of submarine groundwater discharge in the northeast and entirety of Daya Bay[J]. Acta Oceanologica Sinica, 2023, 42(8): 24-31. doi: 10.1007/s13131-023-2181-y
South China Sea Environment Monitoring Center, State Oceanic Administration, Guangzhou 510300, China
2.
Nansha Islands Coral Reef Ecosystem National Observation and Research Station, Guangzhou 510300, China
3.
Key Laboratory of Marine Environmental Survey Technology and Application, Ministry of Natural Resources, Guangzhou 510300, China
4.
CNOOC Research Institute Co., Ltd., Beijing 100028, China
Funds:
The Project of Key Laboratory of Marine Environmental Survey Technology and Application, Ministry of Natural Resources under contract No. MESTA-2021-D006; the China Ocean Development Foundation under contract No. CODF-002-ZX-2021; the Science and Technology Plan Projects of Guangdong Province under contract No. 2021B1212050025; the Director’s Foundation of South China Sea Bureau of Ministry of Natural Resources under contract No. 230201; the Research Fund Program of Guangdong Provincial Key Laboratory of Applied Marine Biology under contract No. LAMB20221007; the Natural Science Foundation of Guangdong Province of China under contract No. 2017A030310592; the Key Program of Bureau Director of State Oceanic Administration under contract No. 180104; the Open Project of State Key Laboratory of Tropical Oceanography, South China Sea Institute of Oceanology, Chinese Academy of Sciences under contract No. LTO1709.
Submarine groundwater discharge (SGD), which can be traced using naturally occurring radium isotopes, has been recognized as a significant nutrient source and land-ocean interaction passage for the coastal waters of the Daya Bay, China. However, uncertainties in assessing SGD fluxes must still be discussed in detail. In this study, we attempted to utilize the Monte Carlo method to evaluate the uncertainties of radium-derived SGD flux in the northeast and entirety of the Daya Bay. The results show that the uncertainties of the SGD estimate in the northeast bay are very sensitive to variations in excess radium inventories as well as radium inputs from bottom sediments, while the uncertainties of the SGD estimate for the entire bay are strongly affected by fluctuations in radium inputs from bottom sediments and radium end-members of SGD. This study will help to distinguish the key factors controlling the accuracy of SGD estimates in similar coastal waters.
Submarine groundwater discharge (SGD) has received widespread attention because even small amounts of SGD can provide important material fluxes (e.g., nutrients) to coastal waters, thus significantly impacting coastal ecosystems (Wang et al., 2018; Gu et al., 2012; Moore, 2010; Burnett et al., 2003; Charette et al., 2001). SGD is not necessarily a freshwater flow but can be composed of fresh groundwater and seawater that has infiltrated coastal aquifers or permeable sediments along the shoreline (Moore, 2010). Naturally occurring radium isotopes, which have district timescales of half-lives, can help identify and assess the flux of SGD flowing into coastal waters because their supply and loss are constrained by radioactive decay (Rodellas et al., 2017; Moore et al., 2006; Rama and Moore, 1996).
The Daya Bay is one of the largest and most important gulfs in the South China Sea. Several researchers have reported that SGD is an important nutrient source that influences the nutrient structure and coastal primary production in the Daya Bay (Zhang et al., 2020; Wang et al., 2018; Gao et al., 2018). However, considering the variation in sampled radium data and the complexity of the constructed radium mass balance models, the SGD estimate uncertainties in the Daya Bay must still need be discussed in detail. The Monte Carlo method, which is a class of computational algorithms, can generate random numbers by relying on probability distributions of inputs, perform thousands of simulations with specific mathematical models, and help obtain the uncertainties of the final output results. The objective of this study is to utilize the Monte Carlo method to evaluate the uncertainty of radium-derived SGD in the northeast and entirety of the Daya Bay. This study will help to identify the important factors affecting the accuracy of SGD estimates in coastal bays.
2.
Study area
The Daya Bay (22.45°–22.83°N, 114.50°–114.89°E) is a semi-closed subtropical bay located east of the Zhujiang River Estuary, China. The annual average temperature in the Daya Bay is 22℃ and the annual precipitation mainly concentrated in the summer, with an average of 1700 mm. There are some small islands in the bay and the surrounding mountains are composed of various metamorphic rocks, purple sandstones, tuffs, and granites that were formed during the Paleozoic and Mesozoic periods (Cheng, 2000). The water depth in the Daya Bay gradually increases from north to south, with an average value of 11 m. The bottom sediments are mainly composed of silt and clay. There is no large river inflow along the coast, that can carry small amounts of riverine particulates (Han, 1995). The tide in the Daya Bay is irregular semi-diurnal, with an average tidal range of 0.49 m and a maximum tidal range of 2.5 m. As one of the three major economic development areas in Guangdong Province, the economy around the Daya Bay has rapidly developed since the 1980s. Large numbers of anthropogenic pollutants and maricultural activities have led to an increasingly serious environmental pollution problem in the Daya Bay (Li et al., 2015).
3.
Sample collection and analysis
3.1
Field sampling
In September 2019 and August 2015, two voyages were conducted to investigate the 224Ra, 223Ra, 228Ra activities in the surface waters of the northeast and entirety of the Daya Bay. Additionally, 11 coastal groundwater samples were collected separately at five stations along the shoreline in April 13–14 and July 25–26, 2018. The sampling stations for surface seawater and pore water are shown in Fig. 1.
Figure
1.
Sampling stations in the northeast and entirety of the Daya Bay. The red dots indicate the radium sampling sites in the northeast bay during September 2019; the black dots show the radium sampling sites in the entire bay during August 2015; pore water samples are noted with red pins.
Surface seawater samples were pumped using a submerged pump with a 60 L sampling volume, then stored in plastic PP buckets. For the collection of pore water samples from beaches along the coastline, we followed the procedures of Hancock and Murray (1996). Briefly, when the beach was exposed to air during low tide, 25–45 cm deep holes with different offshore distances were created to extract intersitial water from the surrounding sediments; after the intersitial water was evacuated twice, and one pore-water sample (i.e., ~10 L) was finally collected from the supernatant of each hole.
All the water samples were immediately filtered using filtration cartridges (pore size: 0.5 μm) to remove suspended particulates. The filtered water was passed through a column filled with 15 g of MnO2-impregnated acrylic fiber at a flow rate of approximately 0.5 L/min to ensure quantitative radium adsorption (Moore, 1976). Subsequently, the residual water of the Mn-fibers was extracted using a vacuum pump, and the fibers were washed 1–2 times with deionized water to remove the salt covering. The humidity of the fibers was controlled at approximately 0.75 (water/manganese fiber mass ratio) (Garcia-Solsona et al., 2008).
3.2
Analysis method
The amount of 224Ra, 223Ra, 228Ra collected on the Mn fibers was measured using a radium delayed coincidence counter (Moore and Arnold, 1996). After the on-site sample collection, 224Ra was determined as soon as possible to avoid significant decay. Based on the design principles of RaDeCC, high 224Ra activity would interfere with the 223Ra measurement; therefore, 223Ra counts were determined within 7–12 d after sample collection (approximately three 224Ra half-life periods). The Mn-fibers were then stored for six weeks and measured again to obtain the supported 224Ra from its parent, 228Th. Here the 224Ra data are given as excess 224Ra since they are obtained by subtracting supported 224Ra from the total 224Ra. After the fibers were stored for more than half a year, the fourth sample measurement was carried out to obtain 228Ra activities, which were dependent on measuring 228Th ingrown from 228Ra. Most of the uncertainties of the 224Ra, 223Ra, and 228Ra activities were estimated to be 4%–16%, 7%–23% and 6%–30%, respectively, using the equations derived by Garcia-Solsona et al. (2008).
3.3
Radium mass balance model
Zhang et al. (2020) further improved the radium mass balance model to estimate the residence time and SGD flux in the Daya Bay. The principle of the model is as follows: assuming that the system is in a steady state, the radium sources, such as river input, atmospheric deposition, external input, release from intertidal and bottom sediments, and SGD contribution, should equal the radium losses, which include radioactive decay, net tidal export from the bay, and losses in seawater caused by recirculated SGD. Here, we employ the improved model and utilize our data to assess the residence time and SGD flux in the northeast and the entirety of the Daya Bay. Based on previous conclusions (Wang et al., 2018; Zhang et al., 2020), riverine input and atmospheric deposition are omitted from the improved model. When 224Ra and 228Ra are used as tracer nuclides, the residence time (τ, d) can be expressed as follows (Zhang et al., 2020):
where I224 and I228 are the 224Ra and 228Ra inventories (Bq) in the study area, respectively; V is the water volume (m3); 224Raop and 228Raop are the end-member activity concentration (Bq/m3) of 224Ra and 228Ra in open sea water; 224FBS is the 224Ra input from bottom sediments (Bq/d); λ224 is the decay constant of 224Ra (d−1); and k is referred to as the 224Ra/228Ra activity ratio difference between groundwater and near-shore seawater, that is,
where 224Ragw and 228Ragw are the end-member activity concentrations (Bq/m3) of 224Ra and 228Ra in groundwater, 224Rans and 228Rans are the end-member activity concentrations (Bq/m3) of 224Ra and 228Ra in near-shore seawater, and RF is the ratio of the fresh SGD flux to the SGD flux. Combined with the obtained residence time, the SGD flux (QSGD, m3/d) calculated by the activity of 224/223Ra or 228Ra can be expressed as Eq. (3) and Eq. (4), respectively.
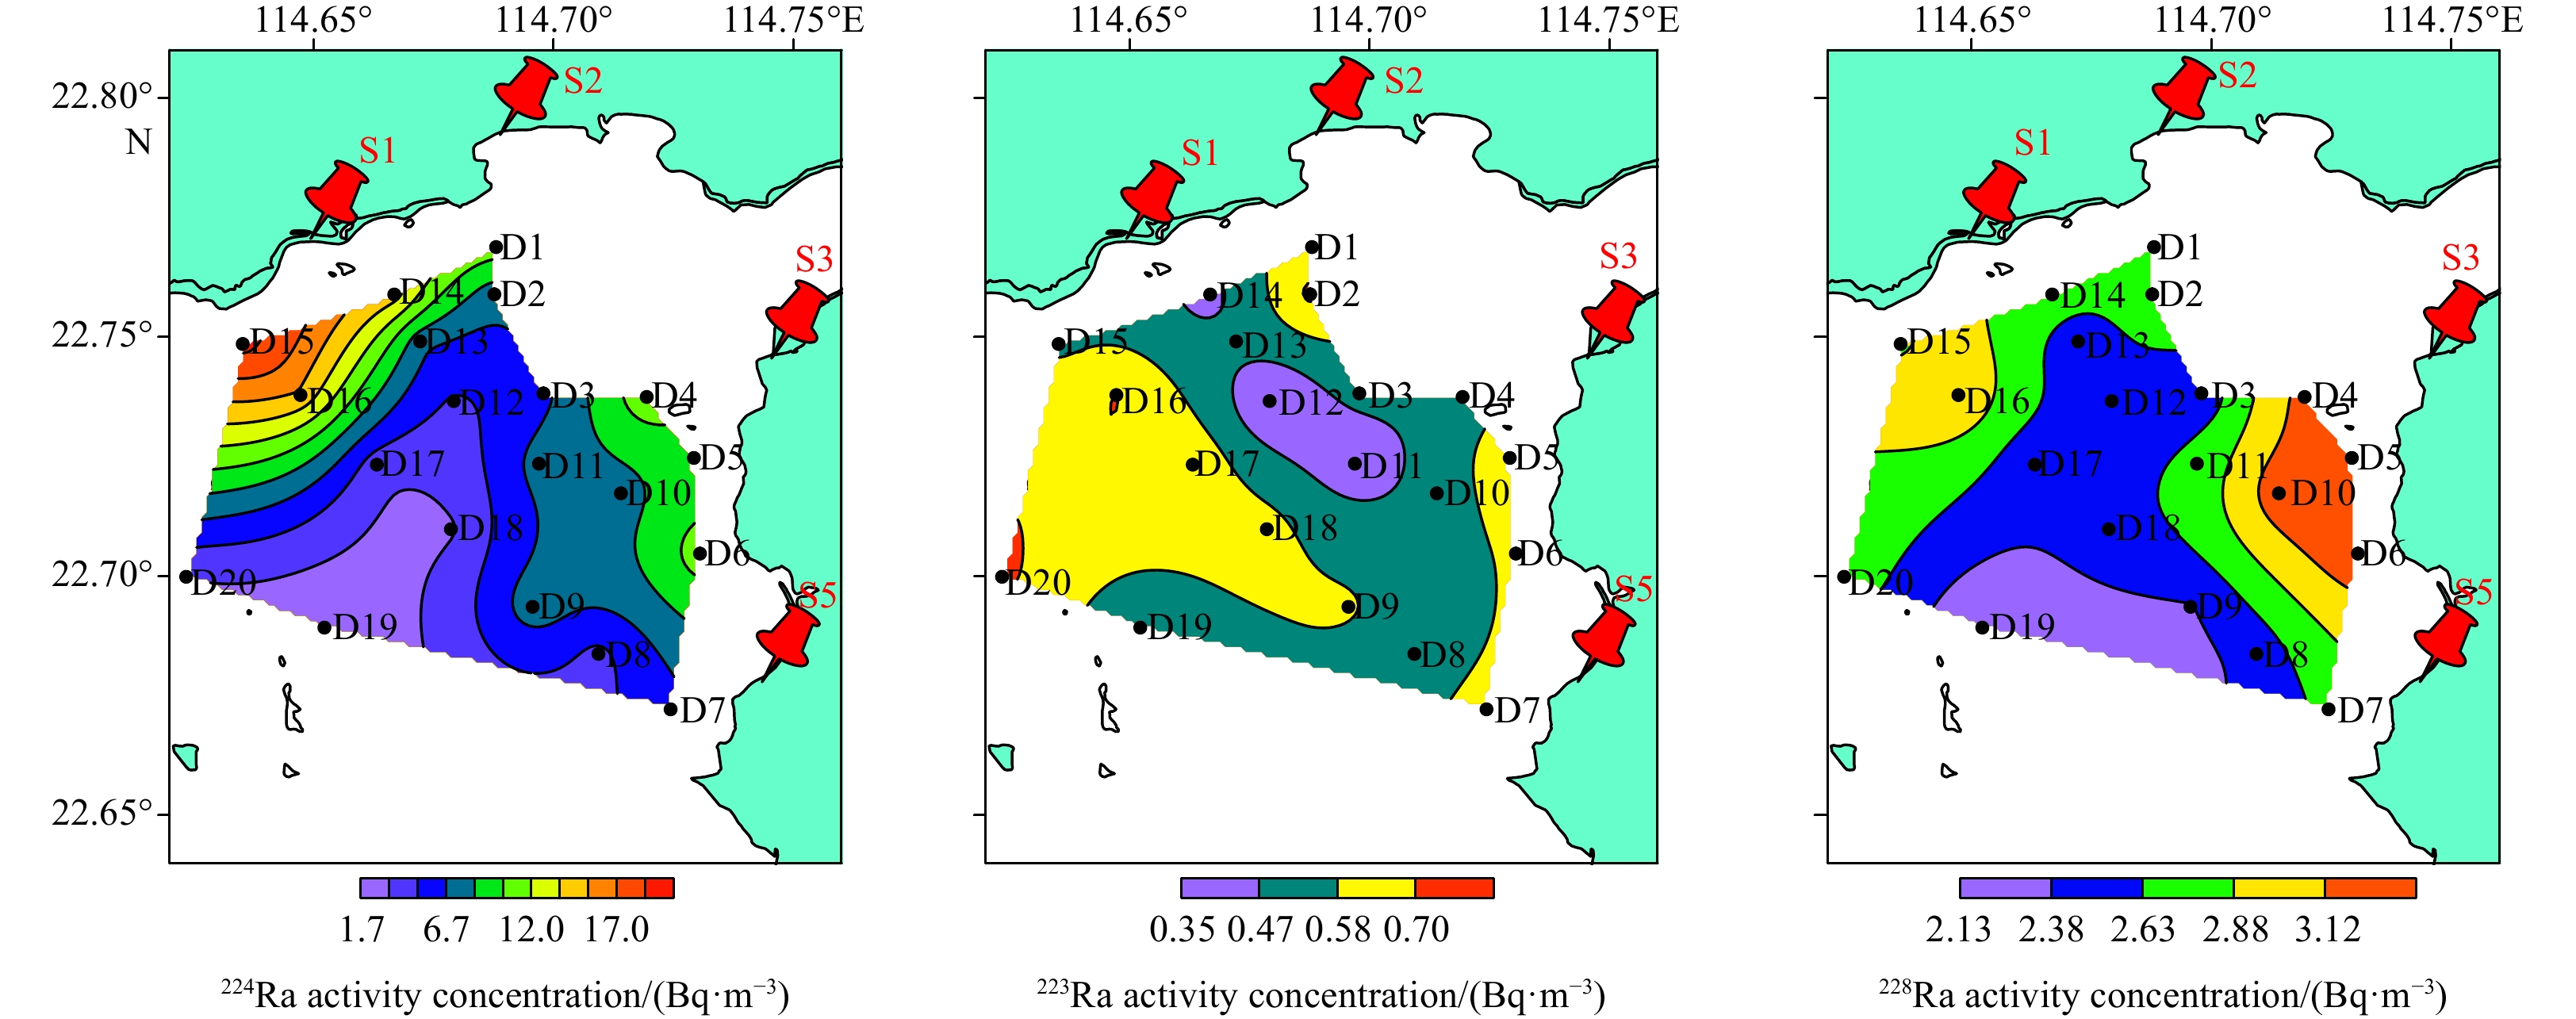
The results of the survey conducted in the northeast Daya Bay in September 2019 are shown in Table S1. The surface salinity exhibited insignificant variations among the stations, with an average of 31.4. However, surface seawater samples showed drastic changes in 224Ra activity concentration, ranging from 2.1 Bq/m3 to 18.8 Bq/m3, with an average of (8.1 ± 4.3) Bq/m3. Meanwhile, those of 223Ra and 228Ra had less obvious changes ranging from 0.35 Bq/m3 to 0.73 Bq/m3 and from 2.1 Bq/m3 to 3.3 Bq/m3, with averages of (0.57 ± 0.11) Bq/m3 and (2.8 ± 0.3) Bq/m3, respectively.
The horizontal distributions of 224Ra, 223Ra, and 228Ra in the northeast bay surface water are shown in Fig. 2. The highest values of the isotopes that appeared in the study area were all located in the near-shore areas, such as the northwest and east coastlines, while the lowest values appeared in the center of the bay. This typical distribution characteristic of radium isotopes, especially 224Ra, indicated that coastal groundwater, diluted by tidal water, gradually spread into the inner part of the bay.
Figure
2.
Horizontal distributions of 224Ra, 223Ra, 228Ra in the surface water of the northeast bay during the September 2019 cruise.
During the cruise in August 2015, we investigated the activity levels of radium isotopes in the entirety of the Daya Bay; the results are listed in Table S1. Unlike previous observations by Zhang et al. (2020), there was less significant spatial variation in surface salinity from the north coast to the mouth of the bay, which ranged from 30.7 to 34.2. The activities of short half-life isotopes ranged from 0.6 Bq/m3 to 12.8 Bq/m3 for 224Ra and 0.16 Bq/m3 to 1.25 Bq/m3 for 223Ra, with averages of (6.1 ± 3.8) Bq/m3 and (0.59 ± 0.30) Bq/m3, respectively. The corresponding values for 228Ra ranged from 0.4 Bq/m3 to 3.0 Bq/m3, with an average of (1.8 ± 0.7) Bq/m3.
As is shown in Fig. 3, the highest 224Ra activity occurred in the area near the northern coastline of the bay (i.e., Station W4), followed by that near the western coastline (i.e., Station W2). Similar features were observed for the 228Ra distribution trend. The maximum 223Ra activity value was observed at the Station W2 near the western coast, but contrary to what one might suppose, no obvious high values were observed at the site near the northern coast. The lowest values of the three isotopes were observed at the Station W10, far from the mouth of the bay.
Figure
3.
Horizontal distributions of 224Ra, 223Ra, 228Ra in the surface water of the entire bay during the August 2015 cruise.
The activities of radium isotopes in the surface seawater of the Daya Bay have been investigated during distinct sampling periods by many researchers, such as Wang et al. (2018), Gao et al. (2018), and Zhang et al. (2020). Compared to previous studies, this study used fewer sampling stations. As is shown in Table 1, a comparison of the mean values showed that the radium activity levels in this study were lower than those reported by Zhang et al. (2020). We can briefly explain that the variations of radium activities in water depend more on the control of water mixing process; the water sampling of this study happened to be conducted during the flood tide, and thus the salinities were generally larger than those reported by Zhang et al. (2020). The flood water carried offshore water with low radium level into the bay, which might make the radium activities collected in this study lower than their results.
Table
1.
Comparison of radium isotope activity concentrations (Bq/m3) in the surface water and coastal pore water of the Daya Bay
The 224Ra, 223Ra, 228Ra activities for coastal pore water samples in the Daya Bay exhibited significant variations among stations, as listed in Table S2. The activities of short-lived radium isotopes ranged from 3.0 Bq/m3 to 105.5 Bq/m3 with an average of (48.5 ± 31.8) Bq/m3 for 224Ra, and from 0.08 Bq/m3 to 6.20 Bq/m3 with an average of (1.4 ± 2.0) Bq/m3 for 223Ra, respectively. The corresponding values for 228Ra ranged from 0.9 Bq/m3 to 18.0 Bq/m3, with an average of (6.9 ± 4.8) Bq/m3. According to the comparison of averages, the radium activities in groundwater were lower in this study than those reported by previous authors (Table 1). It can be explained that our samples collected on the beach are the mixed pore-waters from surface layer to the depth of 25−45 cm, and near-shore seawater with low radium activities is more likely to remain in the surface of beach sediment, making the radium activities reported in this study lower than the previous ones.
4.3
Residence time and SGD estimation
The topography of the northeast bay and the location of the sampling stations are converted to plane coordinates using the Universal Transverse Mercator Projection method. An orthogonal horizontal linear grid is designed to map the two zones at a spatial scale of 100 m×100 m. Since the water depth of the northeast bay is smaller than 20 m (the average: 7.5 m), we consider that the water column is not stratified. Then the radium activities and water depth at each station are interpolated to grid cells using the Kriging method. The 224Ra, 228Ra inventories (I224, I228) are the sums of the activities multiplied by the water depth in each grid cell; the results are shown in Table 2. The I224, I228 of the entire bay is calculated in the same way.
Table
2.
Values used for radium mass balance to estimate submarine groundwater discharge (SGD) flux to the northeast and the entirety of the Daya Bay
Parameter
224Ra
223Ra
228Ra
Northeast bay
Entire bay
Northeast bay
Entire bay
Northeast bay
Entire bay
I/Bq
3.75 × 10⁹
3.15 × 10¹⁰
3.18 × 10⁸
3.07 × 10⁹
1.51 × 10⁹
1.03 × 10¹⁰
(I − 10VRaop)/Bq
2.58 × 10⁹
2.78 × 10¹⁰
5.32 × 10⁷
2.15 × 10⁹
3.12 × 10⁸
7.92 × 10⁹
FBS/(Bq·d−1)
1.03 × 10¹⁰
4.92 × 10⁸
3.37 × 10⁹
7.03 × 10⁶
−
−
$({\text{λ}}I )$/(Bq·d−1)
7.92 × 10⁹
7.02 × 10⁸
5.90 × 10⁹
1.93 × 10⁷
−
−
(Ragw − (1 − RF)Rans)/(Bq·m−3)
6.15
5.8
0.48
0.48
0.56
0.59
QSGD/(m3·d−1)
1.30 × 10⁷
6.63 × 10⁷
5.06 × 10⁶
5.03 × 10⁷
1.27 × 10⁷
6.37 × 10⁷
−
3.05 × 10⁷a
−
2.89 × 10⁷a
−
−
−
(0.28−1.03) × 107b
−
−
−
−
−
(1.97−6.49) × 107c
−
(1.51−4.79) × 107c
−
(3.33−5.51) × 107c
Note: Supscripts a, b, and c of QSGD data were from Gao et al., (2018), Wang et al., (2018), and Zhang et al., (2020), respectively. I: the radium isotope inventory in the study area; V: the water volume (m3); Raop: the end-member activity concentrations (Bq/m3) of radium isotopes in open sea water; FBS: the radium isotope input from bottom sediments (Bq/d); ${\text{λ}} $: the decay constant of radium isotope (d−1); ${\rm{Ra}}_{{\rm{gw}}}$ and Rans are the end-member activity concentrations (Bq/m3) of radium in groundwater and near-shore seawater; RF is the ratio of the fresh SGD flux to the SGD flux; QSGD: SGD flux (m3/d) calculated by the radium activity. − represents no data.
Considering that the northeast bay is located in the inner part of the bay, the external input refers to its most fringe station, closest to the center of the bay. As shown in Fig. 2, the activities of radium isotopes observed at Station D19 are supplied as the conservative end-members of the external input, that is, 224Raop = 2.1 Bq/m3, 223Raop = 0.47 Bq/m3 and 228Raop = 2.1 Bq/m3, respectively. For the entire bay, the activities of radium isotopes obtained at Station W10 located at the outside of the bay are used as conservative end-members of open seawater inputs, i.e., 224Raop = 0.6 Bq/m3, 223Raop = 0.16 Bq/m3, and 228Raop = 0.4 Bq/m3, respectively. Then, the conservative fractions of inventories are estimated by the product of the radium end-members of offshore inputs times the water volume (V = 5.61 × 10⁸ m3 for the northeast bay or V = 5.62 × 10⁹ m3 for the whole bay). The excess inventories are finally evaluated by deducting the conservative fractions from the total inventories. Then, the non-conservative inventory ratio of 224Ra to 228Ra, i.e., (I224−10V224Raop)/(I228−10V228Raop) was determined, 8.3 for the northeast bay and 3.5 for the entire bay.
The 224Ra and 223Ra inputs from bottom sediments in the Daya Bay are estimated by previous authors and ranged from 3.97 Bq/(m2·d) to 9.70 Bq/(m2·d) and 0.04 Bq/(m2·d) to 0.15 Bq/(m2·d), respectively (Wang et al., 2018; Gao et al., 2018; Zhang et al., 2020). Based on previous results, we calculate average values of 6.58 Bq/(m2·d) for 224Ra and 0.09 Bq/(m2·d) 223Ra, respectively. Combined with the study area (7.47 × 10⁷ m2 for the northeast bay or 5.11 × 10⁸ m2 for the entire bay), the 224Ra, 223Ra inputs from the bottom sediments are obtained as 224FBS = 4.92 × 10⁸ Bq/d and 223FBS = 7.03 × 10⁶ Bq/d for the northeast bay and 224FBS = 3.37 × 10⁹ Bq/d and 223FBS = 4.80 × 10⁷ Bq/d for the entire bay, respectively. The 228Ra input from the bottom sediments is omitted because of its long 5.7 a half-life. The radioactive decay losses of 224Ra, 223Ra in the water column are estimated by multiplying the radium inventories by the decay constants; the results are shown in Table 2. Clearly, the 224Ra, 223Ra decay losses are much larger than the 224Ra, 223Ra inputs from bottom sediments, regardless of whether they are in the northeast bay or the entire bay.
Zhang et al. (2020) believed that when radium losses caused by recirculated SGD flowing through coastal aquifers were neglected, the water age would be underestimated to a certain extent. Based on their suggestion, we choose the average activities obtained at near-shore stations as representative values of the recirculated SGD. Assuming that the ratio of fresh SGD flux to SGD flux (i.e., RF) would be considered as 10% (Moore, 1996), the corrected groundwater 224Ra and 228Ra activities of each station are calculated, as shown in Table S2.
The radium inputs released from bottom sediments are much lower than the radium decay losses; in principle, the residence time must be positive. Thus, the k value should be larger than the non-conservative ratio of 224Ra to 228Ra inventory, which is 8.3 for the northeast bay or 3.5 for the entire bay. Therefore, some groundwater radium activities, the corrected 224Ra/228Ra activity ratio (AR) of which are lower than the non-conservative inventory ratio of 224Ra to 228Ra, would not represent the SGD end-members. Therefore, the above data are removed and then the remaining data are used to calculate the k value by the least squares method, which is k = 11.3 (R2 = 0.83, n = 5, p < 0.05) for the northeast bay and k = 10.3 (R2 = 0.74, n = 6, p < 0.05) for the entire bay. It can be concluded that k of the entire bay is quite consistent with that of the northeast bay.
Using Eq. (1), the residence time is estimated to be 4.4 d for the northeast bay and 21.4 d for the entire bay. The radium fluxes through SGD are also evaluated using Eqs (3) and (4). Similarly, the activities of radium in groundwater with corrected 224Ra/228Ra AR larger than the non-conservative ratio of 224Ra to 228Ra inventory are averaged as the corresponding end-members of SGD (Table 2). The radium fluxes from SGD are converted to a total SGD flux by dividing by the radium end-members in the local groundwater; and the results are shown in Table 2.
Regarding the entire bay, the SGD flux estimated by the 223Ra tracer is consistent with those estimated by 224Ra and 228Ra, but the flux obtained by 223Ra is much lower in the northeast bay. As a member of the naturally occurring decay series of 235U, 223Ra normally has a low level of activity and dramatic variation in the marine environment; thus, the SGD flux estimated by the 223Ra tracer would probably show significant uncertainty. Compared with previous studies, our SGD estimates for the entire bay fall within the ranges evaluated by Zhang et al. (2020), but slightly exceed those estimated by Wang et al. (2018) and Gao et al. (2018). Considering that SGD flux is strongly related to local rainfall (Chen et al., 2018), the surveys conducted in both this study and Zhang et al. (2020) were conducted during flood season; thus, the SGD estimates are also quite consistent. When the results estimated by 224Ra, 228Ra are adopted, the SGD flux of the northeast bay accounts for approximately 20% of the entire bay.
4.4
Uncertainty analyses
Four factors mainly affect the uncertainties in estimating the SGD flux in the Daya Bay, including the excess radium inventories, radium fluxes released from bottom sediments, corrected groundwater 224Ra/228Ra AR, and radium end-members of SGD. Each of the above factors is evaluated using the Monte Carlo method on a MATLAB platform (version MATLAB R2016a). Specifically, it is divided into the following steps: (1) the above four factors are all assumed to conform to a normal distribution, then four groups of random numbers are generated; (2) judge whether each random number of each group falls within the actual measuring range of the corresponding factor; if it exceeds the range, it will be regenerated until the number of random numbers per group is 10 000; (3) assuming that the other three factors remain invariant, each random number in one group is substituted into Eqs (1)−(4) to calculate the values of residence time and SGD flux, and then all the results are separately counted for the corresponding mean and standard deviation; (4) rotate the next group and repeat step (3).
4.4.1
Excess radium inventories
Here, we ignore the bathymetric surveying errors (i.e., <1%) in the Daya Bay, so that the radium inventory uncertainty is only contributed by the radium activity error in the measurement. For convenience, the maximum radium activity errors are separately selected to represent uncertainties of radium activities at each sampling station, which are 16% for 224Ra, 23% for 223Ra, and 30% for 228Ra. Therefore, the variations in the radium inventories in the water column are calculated to be I224Ra 0.35%, I223Ra 0.22%, and I228Ra 0.52% for the northeast bay, and I224Ra 0.13%, I223Ra 0.09%, and I228Ra 0.20% for the entire bay. It can be concluded that the measurement errors of radium activities have little influence on radium inventories.
However, the uncertainties of excess radium inventories depend not only on the variation of radium inventories but also on the fluctuation of external inputs of radium isotopes. The conservative end-members of external radium inputs for the northeast bay and entire bay specifically reference the radium activities observed at Stations D19 and W10, where the uncertainties were 224Ra: 16%, 223Ra: 16%, and 228Ra: 9% (northeast bay), and 224Ra: 15%, 223Ra: 15%, and 228Ra: 22% (entire bay), respectively. Based on the error propagation theory, the uncertainties of excess radium inventories in the two regions are calculated to be (I224−10V224Raop) 7%, (I223−10V223Raop) 82%, and (I228−10V228Raop) 33% for the northeast bay and (I224−10V224Raop) 2.0%, (I223−10V223Raop) 6.2%, and (I228−10V228Raop) 6.4% for the entire bay. Apparently, for some small regions, the uncertainties of excess radium inventories are mainly controlled by the fluctuation of radium external inputs.
As Table 3 shows, the uncertainties of the residence times are up to 126% for the northeast bay, but only 9.9% for the entire bay. Furthermore, the uncertainties of the SGD fluxes are estimated to be 78%–94% for the northeast bay and 3.6%–5.1% for the entire bay. Clearly, the smaller the study area, the greater the variation in SGD estimates caused by the uncertainty of excess radium inventories, which are quite sensitive to the fluctuation of radium external inputs.
Table
3.
Four factors affecting residence time and submarine groundwater discharge (SGD) flux in the Daya Bay
Note: I: the radium isotope inventory in the study area; V: the water volume (m3); Raop: the end-member activity concentrations of radium isotopes in open sea water (Bq/m3); k: 224Ra/228Ra activity ratio difference between groundwater and near-shore seawater; FBS: the radium isotope input from bottom sediments; RF: the ratio of the fresh SGD flux to the SGD flux; Ragw and Rans are the end-member activity concentrations of radium in groundwater and near-shore seawater.
The k uncertainties are mainly constituted by the analysis errors of the groundwater 224Ra, 228Ra activities. In this section, 10 000 random digits are generated from each groundwater sampling data point in the form of a normal distribution, then combined into 10 000 sets of groundwater random data at all sampling sites. The least-squares method is used to calculate the corresponding linear regression coefficient for each set, producing 10 000 results. Finally, the standard deviation counted from these 10 000 coefficients is regarded as the uncertainty of k in groundwater, that is, 6.1% for the northeast bay and 5.4% for the entire bay.
The effect of the uncertainty of k in the groundwater on the estimates of residence time and SGD flux in the Daya Bay is shown in Table 3. When k fluctuates by approximately 6%, an uncertainty of 30% is generated in the residence time estimated for the northeast bay and the impact on the entire bay is only 8.2%. The uncertainties of the SGD estimated by distinct radium tracers are up to 41%–76% in the northeast bay, whereas the uncertainties of the SGD estimates range only 6.5%–14.8% in the entire bay. By comparison, it can be concluded that the k fluctuation in groundwater has a significant impact on the estimates of residence time or SGD flux for small regions; in other words, when the study area is relatively large, the assessments of residence time and SGD flux are less sensitive to the k uncertainty in groundwater.
Zhang et al. (2020) reported that k in groundwater ranged from 4.78 to 20.4 in the Daya Bay, with a median of 17.1, which is approximately 50% higher than our estimates. Assuming that the k value given by Zhang et al. (2020) is used to evaluate the residence time and SGD flux for the entire bay, we can predict that the residence time would increase to 42.5 d, while the SGD fluxes would be reduced by 17% for 224Ra, 21% for 223Ra, and 50% for 228Ra.
4.4.3
Radium input from bottom sediments
Based on previous estimates for the radium fluxes released from bottom sediments (i.e., FBS) in the Daya Bay (Wang et al., 2018; Gao et al., 2018; Zhang et al., 2020), we further calculate their standard deviations to be regarded as the FBS uncertainty, which is 44% for 224Ra and 82% for 223Ra. Then, the influence of FBS fluctuation on the residence time and SGD flux for the two regions is inferred by the Monte Carlo method. The results are shown in Table 3. We can conclude that estimates for the residence time and SGD flux are quite sensitive to FBS fluctuations, especially in some small regions. Specifically, the uncertainty of the residence time in the northeast bay is as high as 95%, whereas that of the entire bay is estimated to be 55%. In terms of the SGD estimates, the FBS fluctuation has an impact of 54%–95% for the northeast bay and 29%–55% for the entire bay.
4.4.4
Radium end-members of SGD
Radium end-members of coastal groundwater have no effect on the evaluation of residence time but play a major role in determining SGD flux; that is, the greater the fluctuation of the end-members, the greater the fluctuation of the estimated SGD fluxes. The groundwater radium activities corrected by the near-shore radium loss are selected as the SGD end-members, and their standard deviations are calculated to be [224Ragw−(1−RF)224Rans] 50%, [223Ragw−(1−RF)223Rans] 25%, and [228Ragw−(1−RF)228Rans] 37% in the northeast bay, and [224Ragw−(1−RF)224Rans] 54%, [223Ragw−(1−RF)223Rans] 25%, and [228Ragw−(1−RF)228Rans] 33% in the entire bay. The uncertainties of the SGD fluxes caused by fluctuating radium end-members ranged from 10% to 29% in the northeast bay and 10% to 33% in the entire bay.
Zhang et al. (2020) also used the corrected radium activities of groundwater as the SGD end-members in the Daya Day, of which the median values were counted as [224Ragw−(1−RF)224Rans]=163 Bq/m3, [223Ragw−(1−RF)223Rans]=5.3 Bq/m3, and [228Ragw−(1−RF)228Rans]=11 Bq/m3, respectively. Their 224Ra, 228Ra end-members are more than twice our values, and the 223Ra end-member is almost similar to ours. When the SGD fluxes in our study were estimated by the groundwater end-members evaluated by Zhang et al. (2020), the SGD fluxes estimated by 224Ra, 228Ra decrease by approximately 50%, while that of 223Ra remains fairly consistent with our result.
5.
Conclusions
This study utilizes an improved radium mass balance model to evaluate radium-derived SGD fluxes in the northeast and the entirety of the Daya Bay. The results show that the estimated SGD flux in the northeast bay is equivalent to approximately 20% of that in the entire bay during the flood season. The SGD estimate uncertainties, which are mainly controlled by the fluctuations of four factors including excess radium inventories, radium fluxes released from bottom sediments, corrected groundwater 224Ra/228Ra AR, and SGD radium end-members, are separately evaluated using the Monte Carlo method. Except for the SGD radium end-members, the fluctuations in the other three factors affecting the estimated SGD fluxes are all related to the size of the study area. Especially for small regions, such as the northeast bay, the uncertainty for estimating SGD flux is very sensitive to variations in excess radium inventories and radium inputs from bottom sediments. Regarding large regions, such as the entire bay, variations in radium inputs from bottom sediments and radium end-members of SGD have the greatest impact on the uncertainties of SGD estimates. Evaluating SGD fluxes for small areas is considered more difficult and thus future research should be strengthened to improve the accuracy of estimating excess radium inventories and radium inputs from bottom sediments. For larger areas, it is critical to promote the evaluation accuracy of radium inputs from bottom sediments and radium end-members of SGD.
Acknowledgements:
We thank Willard S Moore give us useful comments to improve this manuscript. We thank laboratory colleague for their help during the expeditions and two anonymous reviewers for very constructive and detailed comments.
Burnett W C, Bokuniewicz H, Huettel M, et al. 2003. Groundwater and pore water inputs to the coastal zone. Biogeochemistry, 66(1–2): 3–33
Charette M A, Buesseler K O, Andrews J E. 2001. Utility of radium isotopes for evaluating the input and transport of groundwater-derived nitrogen to a Cape Cod estuary. Limnology and Oceanography, 46(2): 465–470. doi: 10.4319/lo.2001.46.2.0465
Chen Xiaogang, Lao Yanling, Wang Jinlong, et al. 2018. Submarine groundwater-borne nutrients in a tropical bay (Maowei Sea, China) and their impacts on the oyster aquaculture. Geochemistry, Geophysics, Geosystems, 19(3): 932–951
Cheng Qingxian. 2000. Guangdong Province Chronicle-Ocean and Island Chronicles (in Chinese). Guangzhou: Guangdong Peoples Publishing House, 79–80
Gao Jingyan, Wang Xuejing, Zhang Yan, et al. 2018. Estimating submarine groundwater discharge and associated nutrient inputs into Daya Bay during spring using radium isotopes. Water Science and Engineering, 11(2): 120–130. doi: 10.1016/j.wse.2018.06.002
Garcia-Solsona E, Garcia-Orellana J, Masqué P, et al. 2008. Uncertainties associated with 223Ra and 224Ra measurements in water via a Delayed Coincidence Counter (RaDeCC). Marine Chemistry, 109(3–4): 198–219
Gu Hequan, Moore W S, Zhang Lei, et al. 2012. Using radium isotopes to estimate the residence time and the contribution of submarine groundwater discharge (SGD) in the Changjiang effluent plume, East China Sea. Continental Shelf Research, 35: 95–107. doi: 10.1016/j.csr.2012.01.002
Han Wuying. 1995. Chemistry in Daya Bay, in Marine Chemistry of the Nansha Islands and South China Sea (in Chinese). Beijing: China Ocean Press, 60–103
Hancock G J, Murray A S. 1996. Source and distribution of dissolved radium in the Bega River estuary, southeastern Australia. Earth and Planetary Science Letters, 138(1–4): 145–155
Li Chunhou, Xu Shannan, Du Feiyan, et al. 2015. Responses of the Daya Bay ecosystem to human activities and health assessment. Chinese Fishery Quality and Standards (in Chinese), 5(1): 1–10
Moore W S. 1976. Sampling 228Ra in the deep ocean. Deep Sea Research and Oceanographic Abstracts, 23(7): 647–651. doi: 10.1016/0011-7471(76)90007-3
Moore W S. 1996. Large groundwater inputs to coastal waters revealed by 226Ra enrichment. Nature, 380(6575): 612–614. doi: 10.1038/380612a0
Moore W S. 2010. The effect of submarine groundwater discharge on the ocean. Annual Review of Marine Science, 2: 59–88. doi: 10.1146/annurev-marine-120308-081019
Moore W S, Arnold R. 1996. Measurement of 223Ra and 224Ra in coastal waters using a delayed coincidence counter. Journal of Geophysical Research, 101(C1): 1321–1329. doi: 10.1029/95JC03139
Moore W S, Blanton J O, Joye S B. 2006. Estimates of flushing times, submarine groundwater discharge, and nutrient fluxes to Okatee Estuary, South Carolina. Journal of Geophysical Research: Oceans, 111(C9): C09006. doi: 10.1029/2005JC003041
Rama, Moore W S. 1996. Using the radium quartet for evaluating groundwater input and water exchange in salt marshes. Geochimica et Cosmochimica Acta, 60(23): 4645–4652. doi: 10.1016/S0016-7037(96)00289-X
Rodellas V, Garcia-Orellana J, Trezzi G, et al. 2017. Using the radium quartet to quantify submarine groundwater discharge and porewater exchange. Geochimica et Cosmochimica Acta, 196: 58–73. doi: 10.1016/j.gca.2016.09.016
Wang Xuejing, Li Hailong, Zheng Chunmiao, et al. 2018. Submarine groundwater discharge as an important nutrient source influencing nutrient structure in coastal water of Daya Bay, China. Geochimica et Cosmochimica Acta, 225: 52–65. doi: 10.1016/j.gca.2018.01.029
Zhang Yan, Li Hailong, Guo Huaming, et al. 2020. Improvement of evaluation of water age and submarine groundwater discharge: a case study in Daya Bay, China. Journal of Hydrology, 586: 124775. doi: 10.1016/j.jhydrol.2020.124775
Zhenyan Wang, Clare E. Robinson, Xiaolong Geng, et al. Field and numerical investigation of groundwater flow and dissolved inorganic nitrogen (DIN) dynamics in a sandy nearshore aquifer. Journal of Hydrology, 2025, 646: 132330. doi:10.1016/j.jhydrol.2024.132330
Hequan Gu, Feng Zhao, Zhixin Ni, Meigui Wu, Li Zhao, Aicui Dang, Dongmei Li, Minxia Zhang, Qin Hu. Using radium isotopes to evaluate the uncertainty of submarine groundwater discharge in the northeast and entirety of Daya Bay[J]. Acta Oceanologica Sinica, 2023, 42(8): 24-31. doi: 10.1007/s13131-023-2181-y
Hequan Gu, Feng Zhao, Zhixin Ni, Meigui Wu, Li Zhao, Aicui Dang, Dongmei Li, Minxia Zhang, Qin Hu. Using radium isotopes to evaluate the uncertainty of submarine groundwater discharge in the northeast and entirety of Daya Bay[J]. Acta Oceanologica Sinica, 2023, 42(8): 24-31. doi: 10.1007/s13131-023-2181-y
Table
2.
Values used for radium mass balance to estimate submarine groundwater discharge (SGD) flux to the northeast and the entirety of the Daya Bay
Parameter
224Ra
223Ra
228Ra
Northeast bay
Entire bay
Northeast bay
Entire bay
Northeast bay
Entire bay
I/Bq
3.75 × 10⁹
3.15 × 10¹⁰
3.18 × 10⁸
3.07 × 10⁹
1.51 × 10⁹
1.03 × 10¹⁰
(I − 10VRaop)/Bq
2.58 × 10⁹
2.78 × 10¹⁰
5.32 × 10⁷
2.15 × 10⁹
3.12 × 10⁸
7.92 × 10⁹
FBS/(Bq·d−1)
1.03 × 10¹⁰
4.92 × 10⁸
3.37 × 10⁹
7.03 × 10⁶
−
−
$({\text{λ}}I )$/(Bq·d−1)
7.92 × 10⁹
7.02 × 10⁸
5.90 × 10⁹
1.93 × 10⁷
−
−
(Ragw − (1 − RF)Rans)/(Bq·m−3)
6.15
5.8
0.48
0.48
0.56
0.59
QSGD/(m3·d−1)
1.30 × 10⁷
6.63 × 10⁷
5.06 × 10⁶
5.03 × 10⁷
1.27 × 10⁷
6.37 × 10⁷
−
3.05 × 10⁷a
−
2.89 × 10⁷a
−
−
−
(0.28−1.03) × 107b
−
−
−
−
−
(1.97−6.49) × 107c
−
(1.51−4.79) × 107c
−
(3.33−5.51) × 107c
Note: Supscripts a, b, and c of QSGD data were from Gao et al., (2018), Wang et al., (2018), and Zhang et al., (2020), respectively. I: the radium isotope inventory in the study area; V: the water volume (m3); Raop: the end-member activity concentrations (Bq/m3) of radium isotopes in open sea water; FBS: the radium isotope input from bottom sediments (Bq/d); ${\text{λ}} $: the decay constant of radium isotope (d−1); ${\rm{Ra}}_{{\rm{gw}}}$ and Rans are the end-member activity concentrations (Bq/m3) of radium in groundwater and near-shore seawater; RF is the ratio of the fresh SGD flux to the SGD flux; QSGD: SGD flux (m3/d) calculated by the radium activity. − represents no data.
Note: I: the radium isotope inventory in the study area; V: the water volume (m3); Raop: the end-member activity concentrations of radium isotopes in open sea water (Bq/m3); k: 224Ra/228Ra activity ratio difference between groundwater and near-shore seawater; FBS: the radium isotope input from bottom sediments; RF: the ratio of the fresh SGD flux to the SGD flux; Ragw and Rans are the end-member activity concentrations of radium in groundwater and near-shore seawater.
Note: Supscripts a, b, and c of QSGD data were from Gao et al., (2018), Wang et al., (2018), and Zhang et al., (2020), respectively. I: the radium isotope inventory in the study area; V: the water volume (m3); Raop: the end-member activity concentrations (Bq/m3) of radium isotopes in open sea water; FBS: the radium isotope input from bottom sediments (Bq/d); ${\text{λ}} $: the decay constant of radium isotope (d−1); ${\rm{Ra}}_{{\rm{gw}}}$ and Rans are the end-member activity concentrations (Bq/m3) of radium in groundwater and near-shore seawater; RF is the ratio of the fresh SGD flux to the SGD flux; QSGD: SGD flux (m3/d) calculated by the radium activity. − represents no data.
Figure 1. Sampling stations in the northeast and entirety of the Daya Bay. The red dots indicate the radium sampling sites in the northeast bay during September 2019; the black dots show the radium sampling sites in the entire bay during August 2015; pore water samples are noted with red pins.
Figure 2. Horizontal distributions of 224Ra, 223Ra, 228Ra in the surface water of the northeast bay during the September 2019 cruise.
Figure 3. Horizontal distributions of 224Ra, 223Ra, 228Ra in the surface water of the entire bay during the August 2015 cruise.


 DownLoad:


 DownLoad:


 DownLoad: