Zhigang Zhao, Wu Tang, Shixiang Liu, Huafeng Tang, Pujun Wang, Zhiwen Tian. U-Pb zircon ages and petrogeochemistry and tectonic implications of gabbro and granite in southwest Lahad Datu area of Sabah, Malaysia[J]. Acta Oceanologica Sinica, 2024, 43(2): 94-110. doi: 10.1007/s13131-023-2218-2
Citation:
Zhigang Zhao, Wu Tang, Shixiang Liu, Huafeng Tang, Pujun Wang, Zhiwen Tian. U-Pb zircon ages and petrogeochemistry and tectonic implications of gabbro and granite in southwest Lahad Datu area of Sabah, Malaysia[J]. Acta Oceanologica Sinica, 2024, 43(2): 94-110. doi: 10.1007/s13131-023-2218-2
Zhigang Zhao, Wu Tang, Shixiang Liu, Huafeng Tang, Pujun Wang, Zhiwen Tian. U-Pb zircon ages and petrogeochemistry and tectonic implications of gabbro and granite in southwest Lahad Datu area of Sabah, Malaysia[J]. Acta Oceanologica Sinica, 2024, 43(2): 94-110. doi: 10.1007/s13131-023-2218-2
Citation:
Zhigang Zhao, Wu Tang, Shixiang Liu, Huafeng Tang, Pujun Wang, Zhiwen Tian. U-Pb zircon ages and petrogeochemistry and tectonic implications of gabbro and granite in southwest Lahad Datu area of Sabah, Malaysia[J]. Acta Oceanologica Sinica, 2024, 43(2): 94-110. doi: 10.1007/s13131-023-2218-2
China National Offshore Oil Corporation (CNOOC) Research Institute Co., Ltd., Beijing 100028, China
2.
College of Earth Sciences, Jilin University, Changchun 130061, China
Funds:
The National Science and Technology Major Project under contract No. 2016ZX05026-004; the National Key R&D Program of China under contract No. 2019YFC0605402; the National Natural Science Foundation of China under contract No. 41790453.
The southwest Lahad Datu felsic rocks were previously thought to have formed in the late Triassic as part of the microcontinental crystalline basement. Based on U-Pb ages, geochemistry, and the Hf isotopes of zircon from the southeastern Sabah gabbro and granite, in this study, the tectonic properties of the Sabah area during the Triassic were investigated. The weighted average U-Pb zircon ages of the gabbro and granite samples were determined to be (230.9 ± 2.5)Ma and (207.1 ± 3.3)Ma, respectively. The granite had SiO2 contents of 66.54%–79.47%, low TiO2 contents of 0.08%–0.3%, Al2O3 contents of 10.97%–16.22%, Na2O contents of 5.91%–6.39%, and low K2O contents of 0.15%–0.65%. The chondrite-normalized rare earth element (REE) patterns exhibit light REE enrichment, with right-sloping curves. The primitive mantle-normalized trace element spider diagrams exhibit Th, U, La, Sr, and Zr enrichment and Nb, Ta, P and Ti depletions, i.e., the geochemical characteristics of typical island arc igneous rocks. The tectonic discriminant diagram indicates that the granite is a volcanic arc granite. The Hf isotopic analysis of gabbro zircon revealed that the zircons have εHf(t) values of 12.08–16.24 (mean of 14.32) and two-stage model ages (tDM2) of 223–491 Ma (mean of 347 Ma). This indicates that the diagenetic magma of the gabbro was mainly derived from melting of newly formed crustal materials. The ophiolite in southeast Sabah has existed since the early Late Triassic. The crystalline basement granite in southeastern Sabah was emplaced lasted from late Triassic to early Cretaceous. Based on previous studies and global plate reconstruction models, it is speculated that the southeastern Sabah granite may have been formed in an island arc setting, i.e., where the oceanic crust of the Paleo-Tethys Ocean collided with the oceanic crust of the Panthalassa Ocean.
Ophiolite is considered to be oceanic crust fragments emplaced on continental margins or island arcs (Gass, 1982; Moores, 1982; Dilek and Furnes, 2011), which is of great significance for tectonic evolution research. During the Meso-Cenozoic, was multiple tectonic blocks coalesced to form Borneo (Hutchison, 1989; Hall, 2012; Metcalfe, 2013). Therefore, some suture zones and ophiolites are distributed, such as Boyan, Lubok Antu, Kapuas, Meratus, and the Sabah ophiolitic melange (Hutchison, 1975, 1978, 1989). The ophiolitic melange along the western Borneo Lupar line is believed to have been formed by the Proto-South China Sea subduction in the Late Cretaceous (Hutchison, 1989, 1996; Zahirovic et al., 2014). The Meratus suture is believed to have been formed by the collision between the Southwest Borneo block and the East Java-West Sulawesi block during the late Jurassic period (Yuwono et al., 1988; Wakita et al., 1998; Setiawan et al., 2015). However, the age and tectonic evolution of the Sabah ophiolites are controversial.
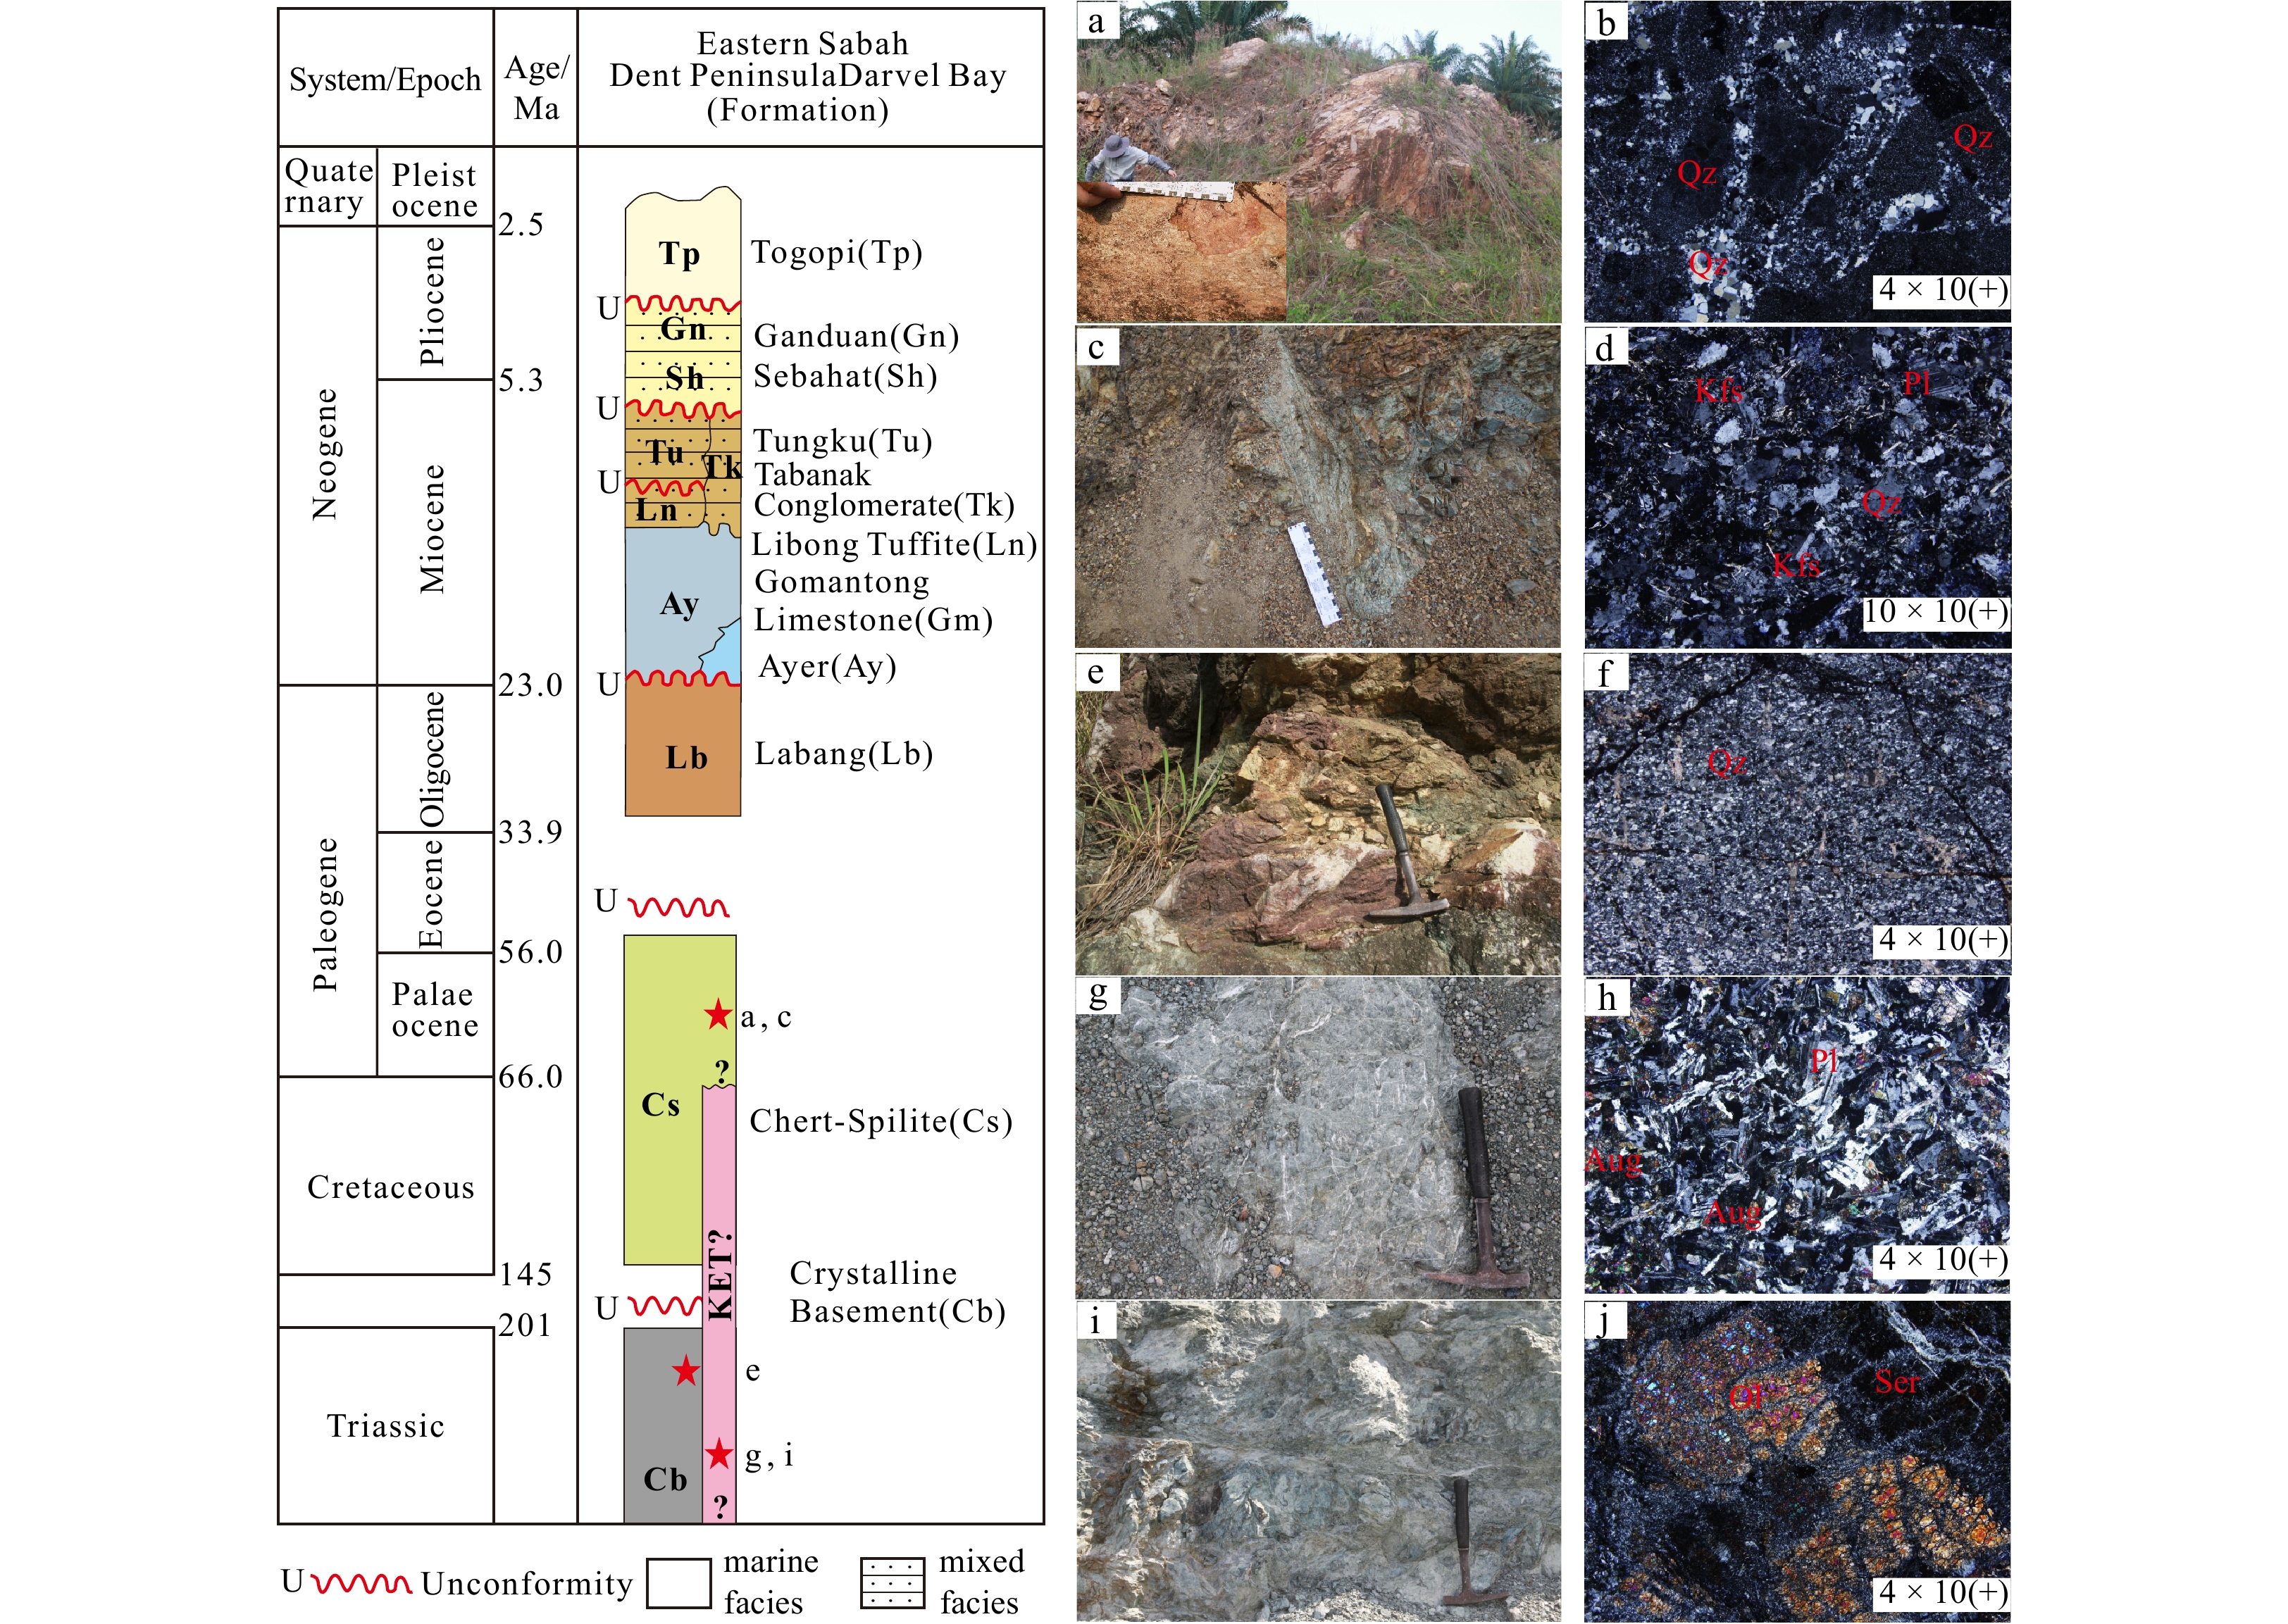
Sabah is located in the southern South China Sea (Fig. 1a), and it consists of Triassic basement, Mesozoic ophiolite, and Cenozoic sedimentary and igneous rocks (Fig. 1b). The Triassic Crystalline Basement (Cb) is mainly exposed near the Segama Highlands and in Darvel Bay, and it is mainly composed of schist, gneiss, amphibole, granite, granodiorite, and quartz diorite (Tjia, 1988). These metamorphic and felsic rocks have long been considered to be microcontinental crystalline basement and to have formed in the late late Triassic (Leong, 1998, 2017). The crystalline basement was intermixed with the late Jurassic–late Cretaceous ophiolites during the drifting and collision of blocks (Leong, 1971, 1974, 1977, 1998; Jasin, 1992; Jasin et al., 1985; Asis and Jasin, 2012). The age assignment of the felsic rocks as Triassic crystalline basement is mostly based on biotite K-Ar isotopic analysis (Leong, 1974; Graves et al., 2000).
Figure
1.
Regional map: the DEM and tectonic setting (modified from Hall (2012) and Zheng et al. (2019)) (a), geological map (modified from Jasin and Tongkul (2013), Wang et al. (2023)) of Sabah (b) , and cross section across Sabah (modified from Hall (2013)) (c). Cb, Triassic crystalline basement; KET, Cretaceous–early Tertiary igneous groups; Cs, Cretaceous–Eocene Chert–Spilite Formation; Mb, early Cretaceous Madai-Baturong limestone Formation; Lb, Oligocene Labang Formation; Ay, Oligocene–middle Miocene Ayer Formation; Km, middle Miocene Kuamut Formation; Tj, early Miocen–Middle Miocen Tanjong Formation; Tk, middle Miocen Tabanak Conglomerate Formation. DEM from http://www.ngdc.noaa.gov/mgg/image/2minrelief.html.
The Mesozoic ophiolites are mainly distributed in the Segama Highlands, Darvel Bay, Telupid, Kinabalu, and Banggi area (Hutchison, 1975, 1978; Imai and Ozawa, 1991), and the igneous groups (KET) and Chert-Spilite (Cs) Formation are considered to be important components of the ophiolite suite. The KET are Cretaceous-Paleogene igneous rocks dominated by ultramafic and mafic rocks. The ultramafic rocks are mainly serpentinite, peridotite, dunite, and pyroxenite. The mafic rocks are mainly gabbro and diabase. The Cs Formation consists of Cretaceous–Eocene sedimentary rocks, including sandstone, chert, conglomerate, volcanic breccia, agglomerate, basalt, and spilite. The Cs Formation is considered to be a remnant of the oceanic crust (Jasin and Tongkul, 2013). The Cenozoic sedimentary rocks are mainly marine and marine-continental mixed facies (Swauger et al., 1995). Under the influence of the subduction of the Proto-South China Sea, some of the strata in western and central Sabah were compressed and deformed (Fig. 1c). Some of the strata, such as the Crocker, Temburong, Kulapis, and Labang formations, exhibit the characteristics of a subduction zone prearc accretionary wedge (Tjia, 1988; Xu, 2019; Tian et al., 2021a). In the Early Miocene, the collision between the Dangerous Grounds and Sabah triggered the Sabah orogeny, which uplifted the strata in the western and central areas (Hutchison, 1989; Hall, 2011, 2012; Wang et al., 2016).
Thick-bedded grayish-white and red chert rocks of the Cs formation can be seen in southeastern Sabah, Malaysia (Figs 2a, b). The chert rock was broken into breccia under the influence of extrusion movement, showing the characteristics of a cataclastic structure. The Cs formation sandstone and dark mudstone are interbedded, showing a mixed accumulation lineation, with siliceous vein filling (Fig. 2c), and basaltic peperite (Fig. 2d). The crystalline basement granites have been fractured by tectonic movements and filled with calcite (Figs 2e, f). The KET group reports gabbro (Figs 2g, h) and serpentinized peridotite (Figs 2i, j).
Figure
2.
Light red siliceous rock of Cs Formation (4°49′48.7″N, 118°05′52.8″E) (a); chert (b); sandstone and dark mudstone interbedded of Cs Formation (4°57′46.6″N, 118°12′03.8″E) (c); basaltic peperite (d); cataclastic granite in tectonic zone (5°00′15.9″N, 118°14′07.8″E) (e) ; cataclastic granite (f); gabbro of KET group (5°03′40.6″N, 118°14′25.5″E) (g); gabbro (h) ; serpentinized peridotite of KET group (5°03′40.6″N, 118°14′25.5″E) (i); serpentinized peridotite (j). Aug, Augite; Kfs, K-feldspar; Ol, Olivine; Pl, Plagioclase; Qz, Quartz; Ser, Serpentine.
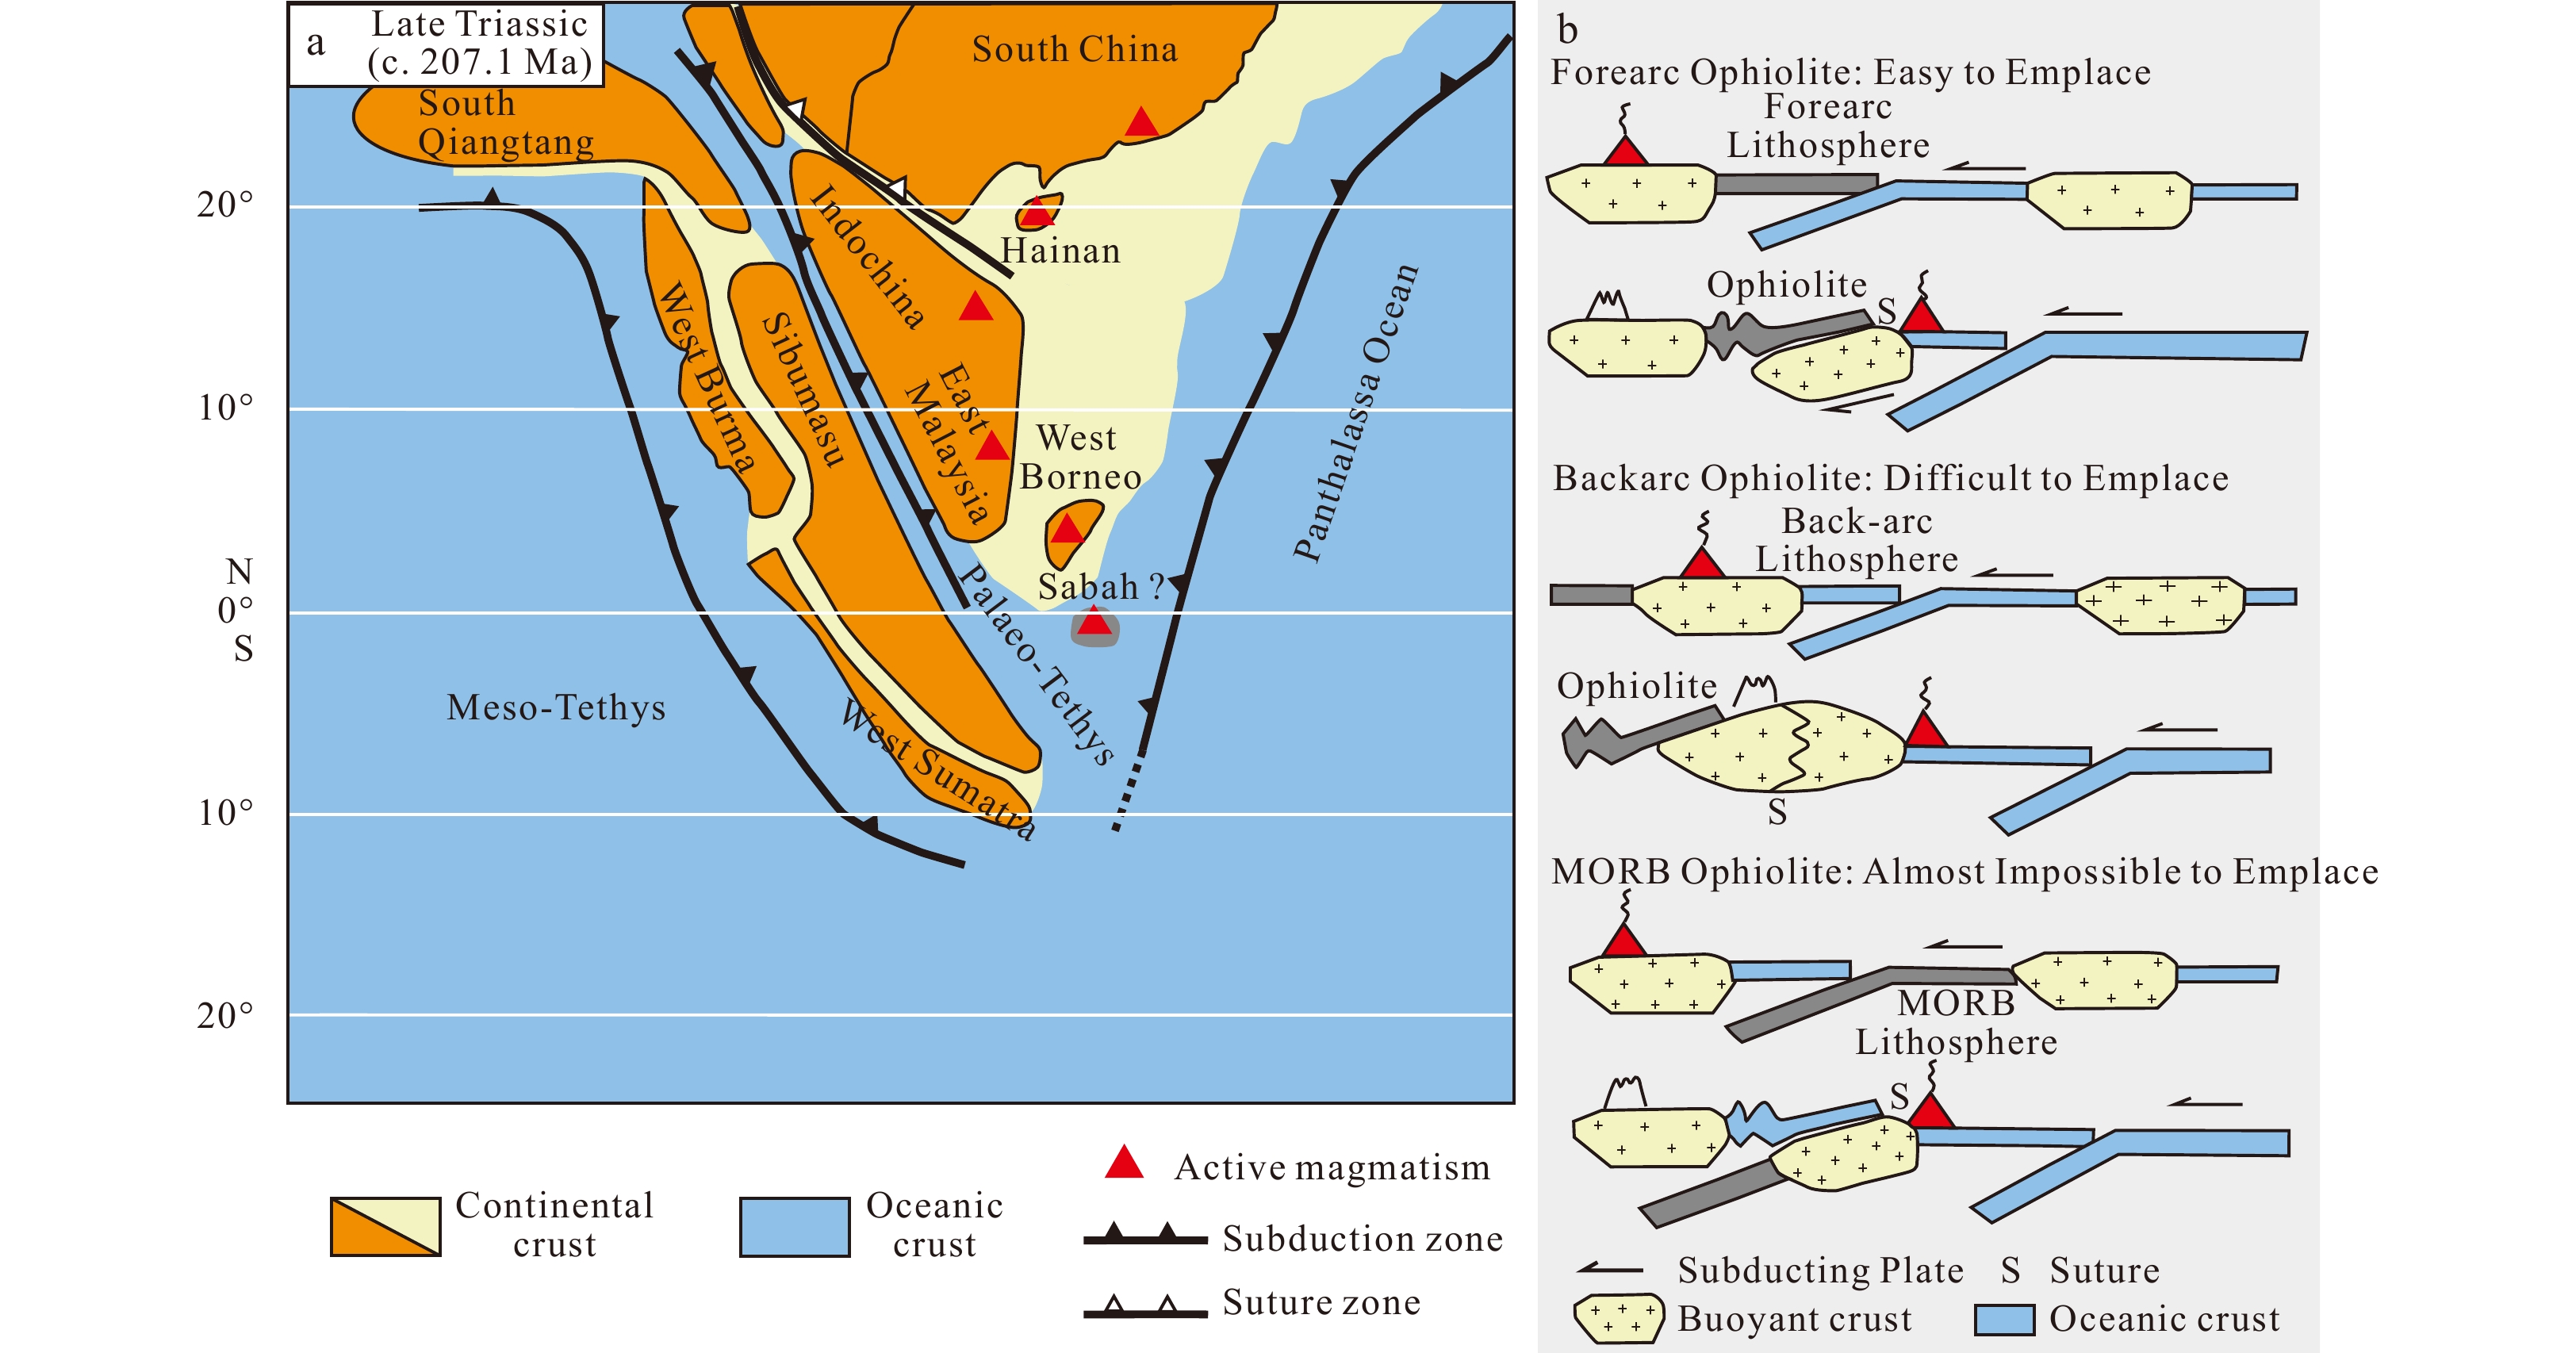
The formation of Southeast Asia is the result of the northward drift, convergence, and collision of Gondwana fragments, as well as the accretion of Paleo-Pacific rim material. In the Early-Middle Triassic, the Indochina, Sibumasu, East Malay, West Borneo, Sumatra, and North Qiangtang blocks separate from Gondwanaland and drift northward in the Paleo-Tethys Ocean (Metcalfe, 1998, 2011). In the Late Triassic, the Indochina, Sibumasu, East Malay, and Sumatra blocks collide and coales, creating the Bentong-Raub, Chiang Mai-Inthanon, Song Ma, Longmucuo-Shuanghu, Lancangjiang, Changning-Menglian, and Wendong sutured zones (Li et al., 2007; Hall, 2012; Metcalfe, 2013, 2021; Liu et al., 2015), and the Paleo-Tethys Ocean basically closes (Fig. 3a). Southwest Borneo, Northwest Sulawesi, and East Java-West Sulawesi drifted northward from the Australian plate during the Late Jurassic (Hall, 2012; Metcalfe, 2013) (Fig. 3b). Early Cretaceous Southwest Borneo block collided with the Sunda continental margin and merged with West Borneo (Hall, 2012), and the East Java–West Sulawesi block collided with the Sunda continental margin, forming the Meratus and Luk Ulo sutures (Advokaat et al., 2018) (Fig. 3c). Proto-South China Sea subducted southward to form the Lupar line during the Late Cretaceous (Hutchison, 1989). During the Cenozoic, Borneo undergoes counterclockwise rotation (Fuller et al., 1999), the Proto-South China Sea subduction and extinction (Hutchison, 1989; Hall and Breitfeld, 2017; Tian et al., 2021b), South China Sea expansion (Holloway, 1981; Hall, 1996), Sulu Sea expansion, and other events (Hutchison, 1989, 2010; Bol and Van Hoorn, 1980; Tongkul, 1990, 1991, 1994; Omang and Tahir, 1995). Therefore, Borneo can be divided into the Southwest Borneo, East Borneo, Kuching zone, Sibu zone, Miri zone, and Sabah tectonic units.
Fresh zircon samples were collected in the field, and the sorting was conducted in the Hebei Institute of the Regional Geological Survey. The zircon targets, transmission images, reflection images, and cathodoluminescence (CL) images were acquired at the Hebei Institute of the Regional Geological Survey. In addition, fissure-free and inclusion-free regions were delineated on the zircon cathode luminescence images to ensure the reliability of the data. The laser ablation inductively coupled plasma mass spectrometry (LA-ICP-MS) U-Pb isotope analysis of the zircon grains was conducted in the Laboratory of Basic Geology, College of Earth Sciences, Jilin University. The laser ablation system (GeoLasPro 193 nm ArF excimer laser, COMPEx, Germany) was combined with an Agilent 7900 ICP-MS instrument. During the laser denudation experiment, high purity helium (He) was used as the carrier gas. A laser beam spot with a diameter of 32 μm and a frequency of 7 Hz was used for the sample analysis. For the ordinary lead correction, the harmonic diagram and weighted average age results were calculated using the Isoplot4.15 macro program (Ludwig, 2003). For the age results, the 207Pb/206Pb age data were used for the ages of greater than 1 000 Ma, and the 206Pb/238U age data were used for the ages of less than 1000 Ma. The age data with a degree of concordance of less than 90% were excluded.
The major and trace element compositions of the samples were analyzed in the Basic Geology Laboratory of the College of Earth Sciences, Jilin University. After crushing to a coarse grain size, fresh samples were selected for acid treatment, cleaning, and drying, and then, the samples were ground to 200 mesh. The major element analysis was conducted via X-ray fluorescence spectrometry (XRF) (ZSX PrimusⅡ) and the Borry frit method. The trace elements were analyzed via inductively coupled plasma-mass spectrometry (Agilent 7 500a mass spectrometer).
The Lu-Hf isotopic analysis of the zircons was performed at the State Key Laboratory of Geological Processes and Mineral Resources, China University of Geosciences (Wuhan). The Lu-Hf isotope analysis was carried out based on the LA-ICP-MS zircon dating and the CL images of the zircons. The instrument used was a laser ablation multi-receiver plasma mass spectrometer (GeoLas 2005 and Neptune Plus), and the spot beam size was 44 μm. The 176Lu decay constant used to calculate the εHf(t) values was 1.867 × 10⁻¹¹ a−1. The Chondrite values were 176Hf/177Hf = 0.282 785 and 176Lu/177Hf = 0.033 6 (Blichert-Toft et al., 1997). The Hf depleted mantle model ages (TDM1) were calculated using the current values of 176Hf/177Hf = 0.283 25 and 176Lu/177Hf = 0.038 4 (Griffin et al., 2000). The two-stage Hf model ages (TDM2) were calculated using the value for mean continental crust (176Lu/177Hf = 0.015) (Griffin et al., 2002).
4.
Results
4.1
Zircon U-Pb dating
4.1.1
ND-KET-1
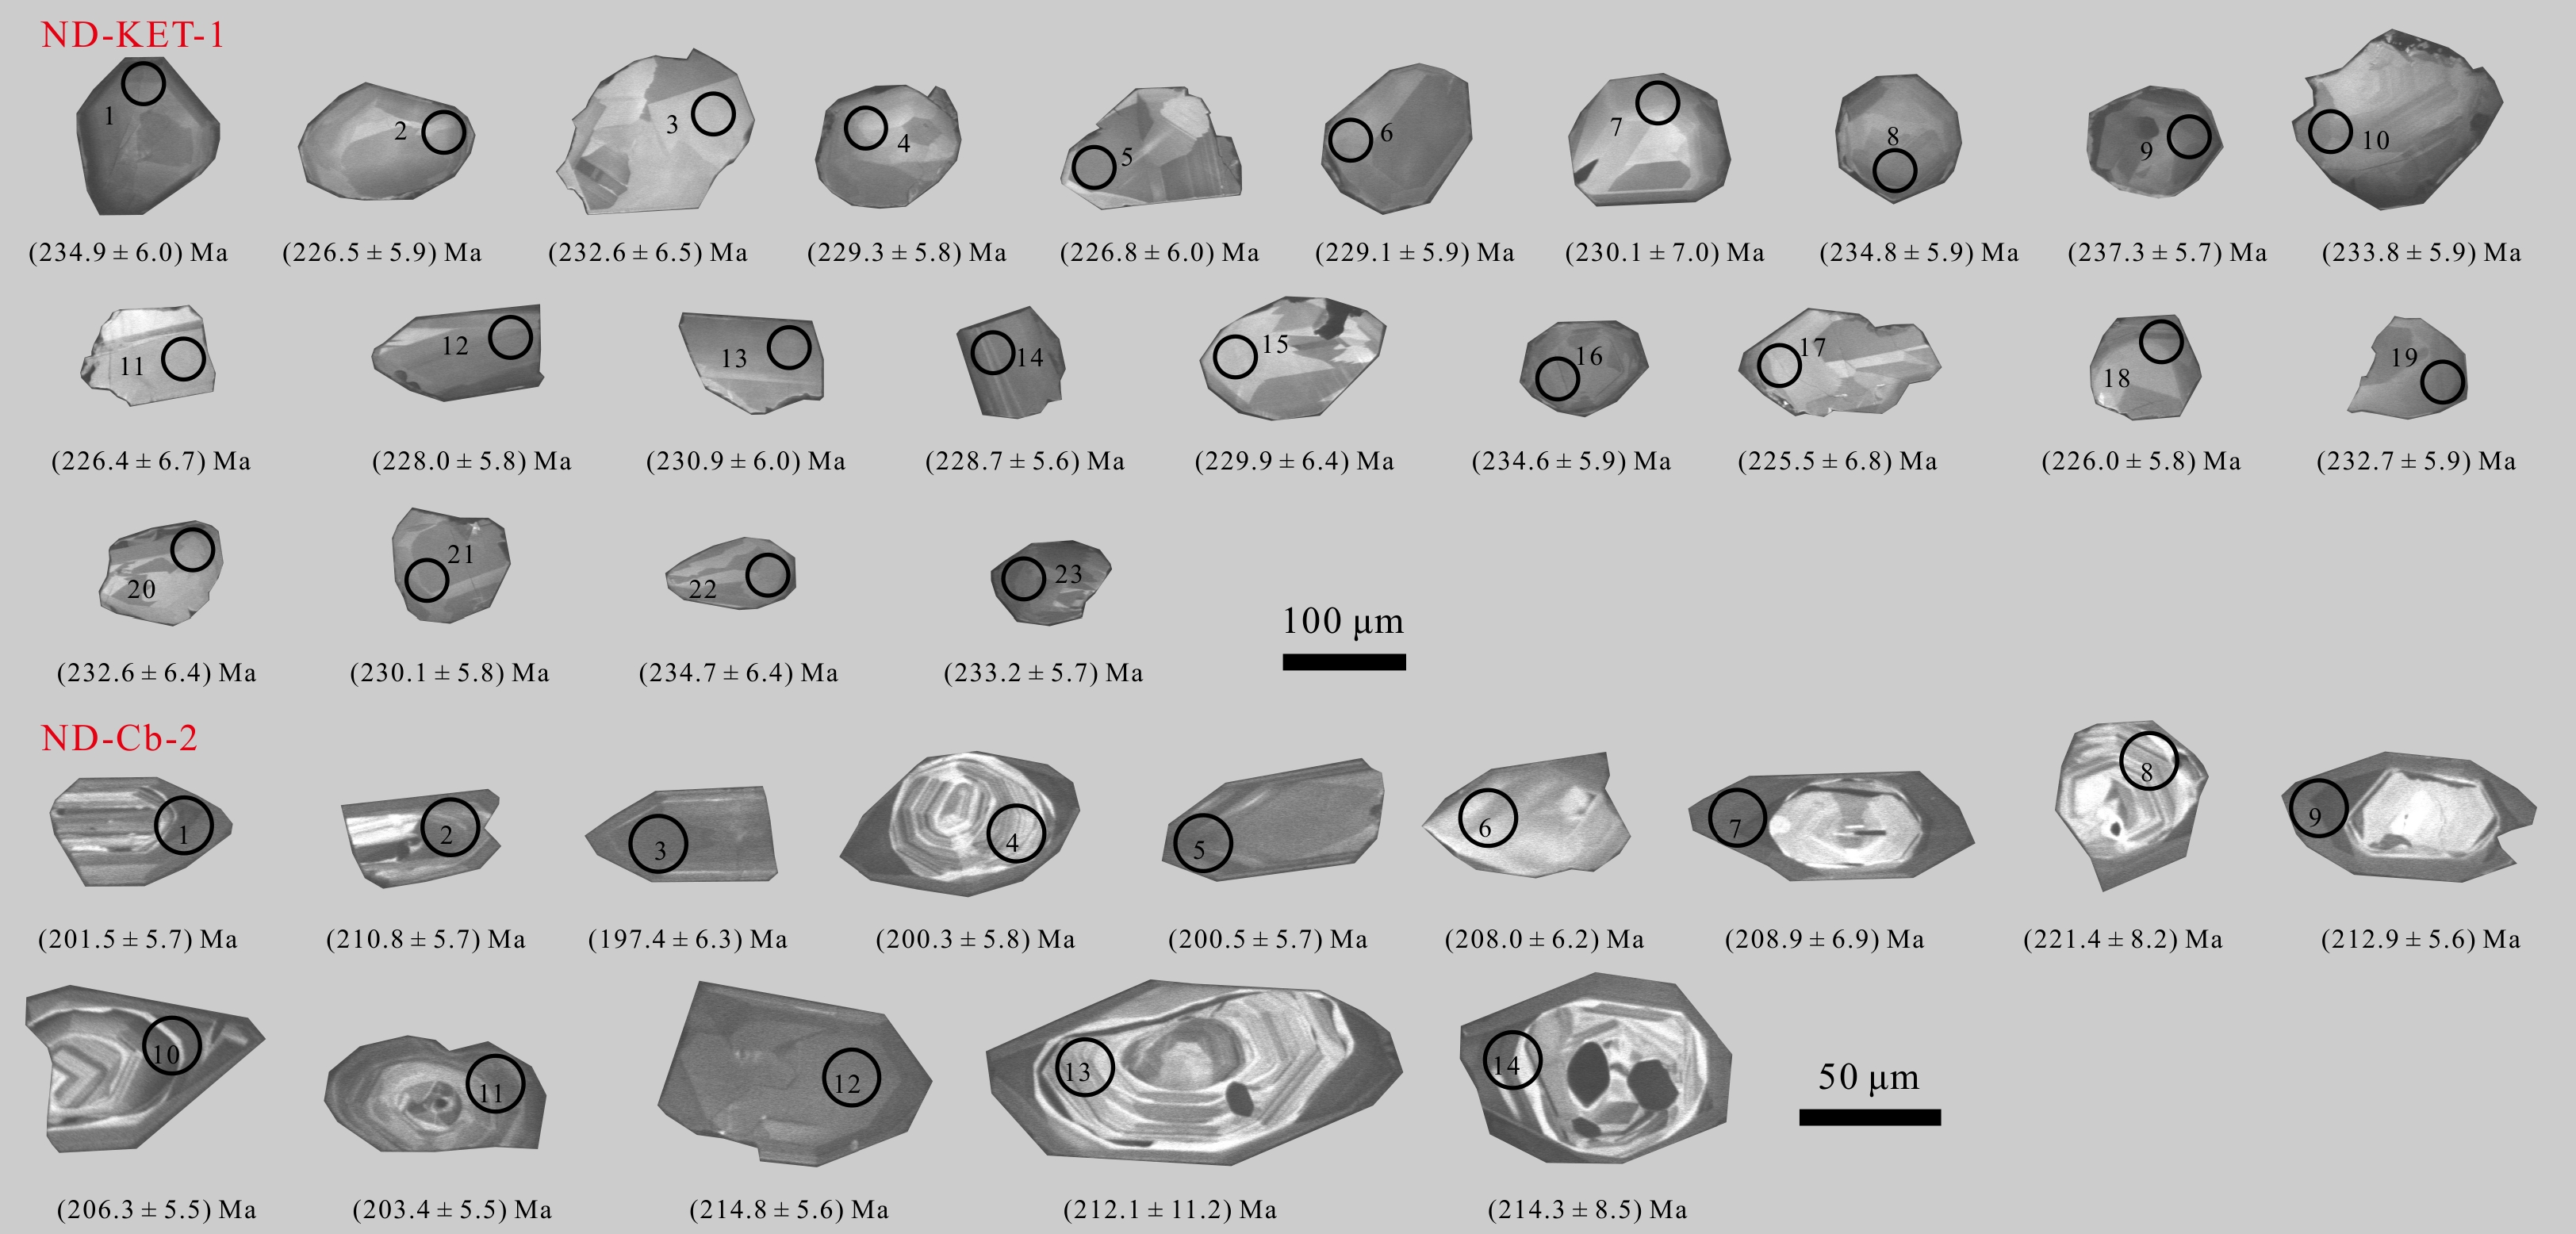
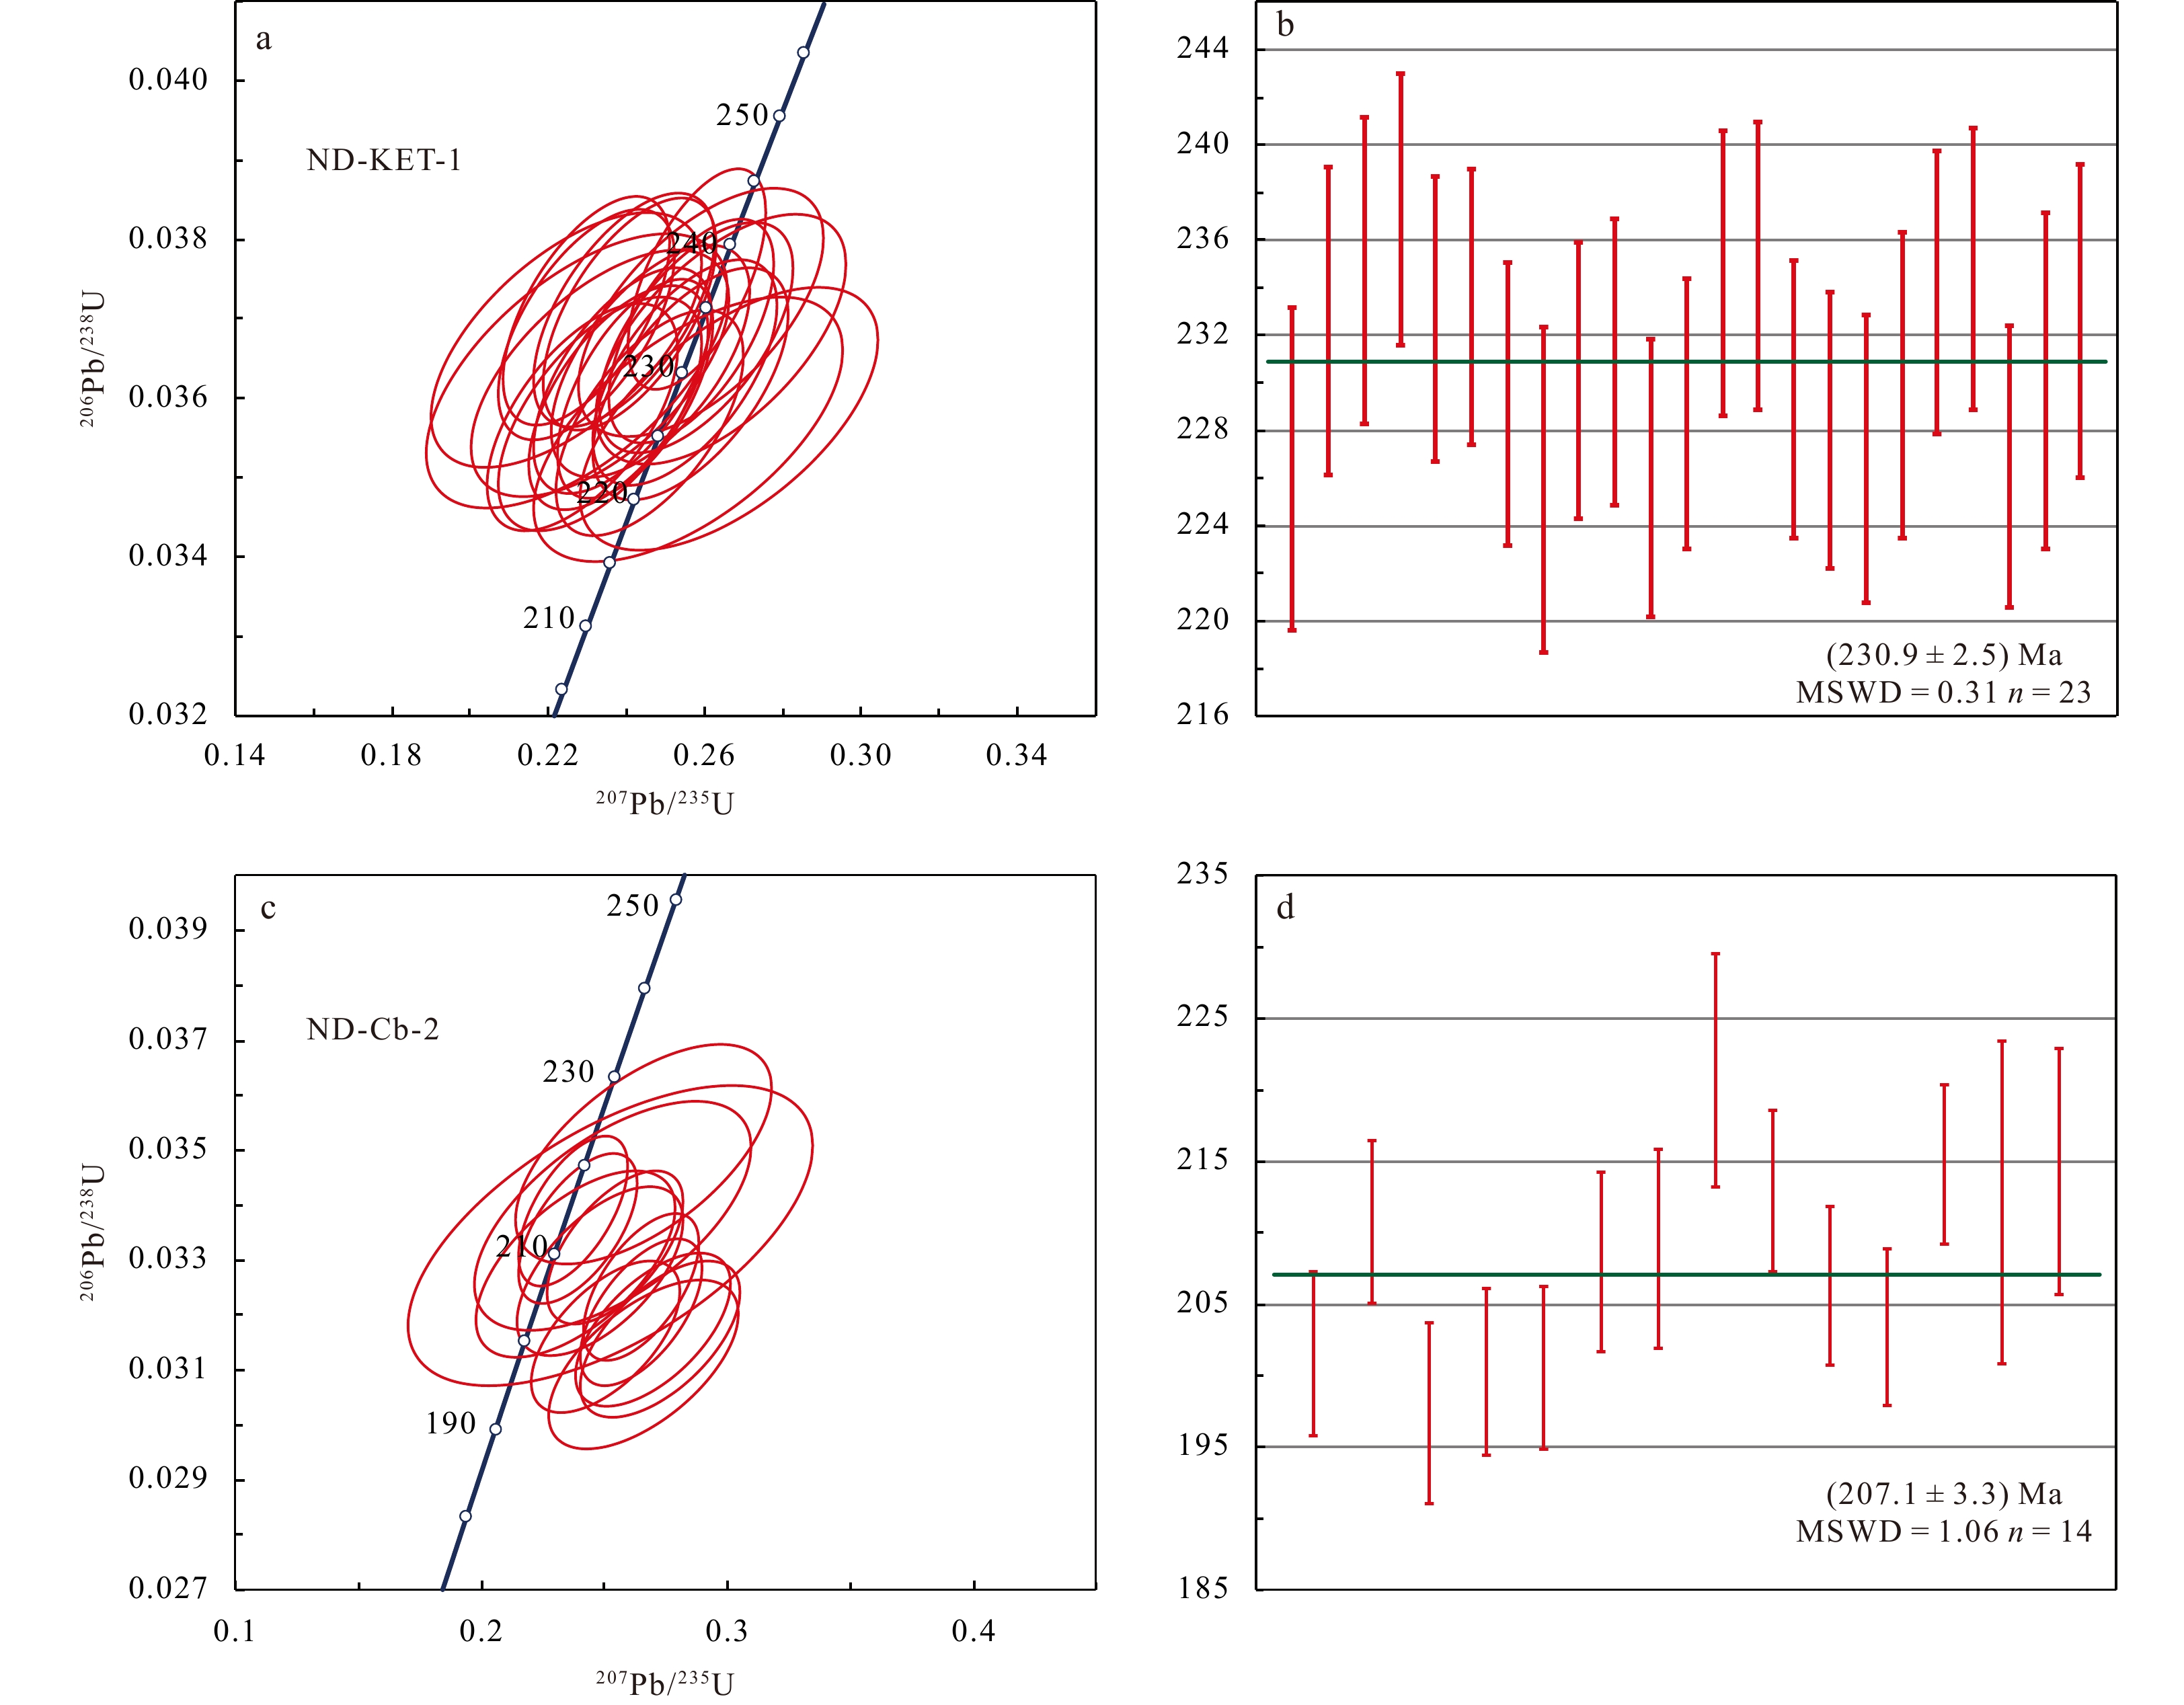
Sample ND-KET-1 was obtained from gabbro (Fig. 2g). The CL images of the ND-KET-1 zircons show that most of the zircons are subhedral columnar crystals, the crystal surfaces are clean, the aspect ratios are about 2:1 to 1:1. Most zircon has patchy, wide, and slow zonal zones in the CL images (Fig. 4), which is clearly different from the oscillating ring of medium-acid magmatic zircon. These zircons are mafic magmatic zircons. The Th/U ratios of these zircon grains range from 0.36 to 0.97, and these zircons are concluded to be typical magmatic zircons. The zircon U-Pb data are presented in Table 1, and 23 reliable zircon ages were obtained. On the U-Pb age concordia diagram, the zircon ages are concentrated on the concordia line (Fig. 5a). The weighted mean 206Pb/238U age is (230.9 ± 2.5) Ma (MSWD = 0.31, n = 23) (Fig. 5b), i.e., early Late Triassic. This age is earlier than the previously reported K-Ar age of (210 ± 3) Ma measured for the ophiolite rocks (Leong, 1974).
Figure
4.
Cathodoluminescence images of zircons from samples ND-KET-1 and ND-Cb-2.
Sample ND-Cb-2 was obtained from cataclastic granite (Fig. 2c). The CL images of the ND-Cb-2 zircons show that they are euhedral to subhedral columnar crystals. Their aspect ratios are about 2:1 to 1:1, and those of individual zircons reach 3:1 (Fig. 4). The Th/U ratios of these zircon grains range from 0.21 to 0.80, and these zircons are concluded to be typical magmatic zircon. The zircon U-Pb analysis data are presented in Table 1, and 14 reliable zircon ages were obtained. On the U-Pb age concordia diagram, the zircon ages are concentrated on the concordia line (Fig. 5c). The weighted mean 206Pb/238U age is (207.1 ± 3.3) Ma (MSWD = 1.06, n = 14) (Fig. 5d), i.e., the late Late Triassic.
4.2
Geochemical characteristics
4.2.1
Major elements
Table 2 presents the major, trace, and rare earth element compositions of the granite and gabbro samples. The loss on ignition values of the granite (ND-KET-a-1~5 and ND-KET-b-1~5) samples range from 0.52% to 2.55%. The samples have SiO2, Fe2O3, MgO, TiO2, Al2O3, Na2O, and K2O contents of 66.54%–79.47%, 0.62%–1.72%, 0.01%–1.09%, 0.08%–0.30%, 10.97%–16.22%, 5.91%–6.39%, and 0.15%–0.65%, respectively. The loss on ignition values of the gabbro (ND-KET-a-1~2) samples range from 3.83% to 3.87%. The samples have SiO2, Fe2O3, MgO, TiO2, Al2O3, Na2O, and K2O contents of 46.69%–46.70%, 5.95%–6.05%, 4.36%–4.37%, 1.40%, 15.29%–15.32%, 2.43%, and 0.03%, respectively. On the total alkali-silica (TAS) diagram (Fig. 6a), six samples plot in the granite region, four samples plot in the granodiorite region, and two samples plot in the gabbro region. On the SiO2-K2O diagram, all of the samples plot in the low potassium series region (Fig. 6b). The A/CNK-A/NK diagram shows that the granite is peraluminous (Fig. 6c).
Table
2.
Contents of oxides (wt%) and REE and trace elements (×10–6) of the samples
Sample
SiO2
Al2O3
Fe2O3
FeO
CaO
MgO
K2O
Na2O
TiO2
P2O5
MnO
Total
LOI
Cs
Rb
ND-Cb-a-1
72.93
13.32
0.80
0.91
3.10
0.02
0.24
6.15
0.09
0.04
0.09
99.55
1.85
0.21
4.00
ND-Cb-a-2
72.68
13.58
0.79
0.88
3.08
0.01
0.25
6.39
0.09
0.04
0.09
99.71
1.83
0.23
3.12
ND-Cb-a-3
72.39
12.94
0.80
0.73
3.79
0.13
0.29
6.12
0.10
0.05
0.08
99.93
2.52
0.26
3.78
ND-Cb-a-4
72.33
12.89
0.68
0.83
3.79
0.12
0.29
6.00
0.09
0.05
0.08
99.71
2.55
0.24
2.46
ND-Cb-a-5
79.47
10.97
0.62
0.82
1.15
0.19
0.15
5.91
0.08
0.04
0.10
100.01
0.52
0.32
3.44
ND-Cb-b-1
66.63
15.91
1.66
1.39
3.76
1.02
0.65
5.71
0.29
0.08
0.09
99.74
2.54
0.39
7.53
ND-Cb-b-2
66.54
15.88
1.72
1.36
3.76
1.01
0.64
5.76
0.28
0.09
0.09
99.58
2.45
0.39
12.77
ND-Cb-b-3
67.45
16.10
1.40
1.53
3.00
1.09
0.62
6.11
0.29
0.07
0.08
99.75
2.01
0.36
11.73
ND-Cb-b-4
67.49
16.22
1.32
1.60
3.00
1.08
0.61
6.12
0.30
0.07
0.08
99.96
2.07
0.33
10.56
ND-Cb-b-5
70.63
14.62
1.19
1.45
2.52
1.08
0.53
5.96
0.29
0.05
0.08
99.76
1.37
0.27
11.74
ND-KET-a-1
46.70
15.32
5.95
4.49
14.37
4.37
0.03
2.43
1.40
0.15
0.24
99.77
3.83
0.28
1.70
ND-KET-a-2
46.69
15.29
6.05
4.39
14.38
4.36
0.03
2.43
1.40
0.15
0.24
99.76
3.87
0.27
1.19
Sample
Ba
Th
U
Ta
Nb
La
Ce
Pr
Sr
Nd
Zr
Hf
Sm
Eu
Gd
ND-Cb-a-1
52.03
2.20
0.71
0.12
2.72
24.41
40.88
4.64
496.20
17.27
73.80
1.41
2.61
0.72
2.23
ND-Cb-a-2
56.14
2.37
0.76
0.13
2.95
26.01
43.07
5.03
529.40
18.55
80.13
1.52
2.80
0.79
2.42
ND-Cb-a-3
59.73
2.36
0.75
0.13
2.92
24.87
40.56
4.69
478.20
17.67
81.00
1.56
2.70
0.72
2.28
ND-Cb-a-4
62.31
2.20
0.69
0.12
2.75
23.18
36.79
4.41
442.50
16.68
76.93
1.44
2.55
0.69
2.14
ND-Cb-a-5
30.06
2.05
0.71
0.22
2.17
14.16
25.62
2.92
286.90
10.64
67.95
2.81
1.67
0.46
1.31
ND-Cb-b-1
179.50
3.19
0.86
0.13
2.97
19.15
40.15
4.93
776.00
18.81
145.20
2.33
3.19
1.01
2.77
ND-Cb-b-2
184.30
3.20
0.86
0.13
3.05
19.03
41.75
4.95
820.00
18.99
149.00
2.30
3.11
1.01
2.73
ND-Cb-b-3
175.40
3.41
0.85
0.13
3.11
20.45
43.61
5.24
808.70
19.81
152.90
2.41
3.21
0.99
2.77
ND-Cb-b-4
163.70
3.23
0.79
0.12
2.90
19.09
40.59
4.88
752.70
18.51
142.10
2.33
3.03
0.91
2.62
ND-Cb-b-5
81.03
3.54
0.83
0.21
2.01
12.23
28.41
3.08
543.70
11.55
108.30
3.85
1.94
0.65
1.69
ND-KET-a-1
44.76
0.39
0.15
1.10
2.79
5.64
16.34
2.13
1227.60
11.74
103.17
3.30
3.46
1.49
3.64
ND-KET-a-2
49.18
0.43
0.16
0.95
2.71
5.91
16.65
2.19
1200.52
11.65
101.24
3.27
3.45
1.50
3.67
Sample
Tb
Dy
Y
Ho
Er
Tm
Yb
Lu
$\Sigma $REE
LREE
HREE
LREE/HREE
LaN/YbN
${\text{δ}} $Eu
${\text{δ}} $Ce
ND-Cb-a-1
0.26
1.37
7.69
0.27
0.76
0.12
0.82
0.14
96.48
90.53
5.95
15.21
21.39
0.92
0.94
ND-Cb-a-2
0.29
1.47
8.24
0.28
0.84
0.13
0.87
0.15
102.70
96.25
6.45
14.92
21.40
0.93
0.92
ND-Cb-a-3
0.27
1.45
8.11
0.28
0.81
0.13
0.86
0.14
97.43
91.21
6.22
14.65
20.63
0.89
0.92
ND-Cb-a-4
0.26
1.37
7.57
0.26
0.76
0.12
0.83
0.14
90.18
84.31
5.87
14.36
20.06
0.91
0.89
ND-Cb-a-5
0.17
0.89
4.55
0.18
0.51
0.08
0.56
0.10
63.38
57.86
5.52
10.48
9.68
1.11
1.14
ND-Cb-b-1
0.36
2.04
11.39
0.42
1.25
0.19
1.34
0.22
95.83
87.24
8.59
10.15
10.29
1.03
1.01
ND-Cb-b-2
0.36
2.03
11.75
0.42
1.26
0.19
1.33
0.22
97.38
88.84
8.54
10.40
10.25
1.06
1.05
ND-Cb-b-3
0.35
2.05
11.70
0.42
1.27
0.20
1.36
0.23
101.95
93.30
8.65
10.79
10.82
1.01
1.03
ND-Cb-b-4
0.34
1.94
10.84
0.39
1.21
0.19
1.28
0.21
95.18
87.01
8.17
10.65
10.72
0.98
1.03
ND-Cb-b-5
0.24
1.28
7.52
0.28
0.85
0.13
0.91
0.15
59.27
55.46
3.81
14.57
18.19
0.95
0.98
ND-KET-a-1
0.82
5.04
28.32
0.95
2.80
0.48
3.22
0.49
58.23
40.80
17.44
2.34
1.26
1.28
1.16
ND-KET-a-2
0.83
5.00
28.41
0.96
2.79
0.47
3.27
0.47
58.80
41.35
17.45
2.37
1.30
1.29
1.13
ND-Cb-a and ND-Cb-b are granite, ND-KET-a is gabbro.
The total rare earth element (∑REE) values of the granite samples range from 59.27 μg/g to 102.7 μg/g, the light rare earth element/heavy rare earth element (LREE/HREE) values range from 10.15 to 15.21, and the LaN/YbN ratios range from 9.68 to 21.40. This shows that the degree of light versus heavy rare earth element fractionation is high, and the light rare earth elements are enriched. The δEu values range from 0.89 to 1.11, and the Eu anomalies are not obvious. According to the Chondrite-normalized REE patterns (Fig. 7a), the distribution patterns of granite samples are right-sloping curves. On the primitive mantle-normalized trace element spider diagrams, these samples exhibit pronounced Th, U, La, Sr, and Zr enrichment and Nb, Ta, P and Ti depletions (Fig. 7b). According to the Chondrite-normalized REE patterns (Fig. 7a), the distribution patterns of gabbro samples are flat type curves. On the primitive mantle-normalized trace element spider diagrams, gabbro samples exhibit pronounced Ta, Sr, and Hf enrichment and Rb, K and Nb depletions (Fig. 7b).
Figure
7.
Chondrite-normalized REE patterns (a) and primitive mantle-normalized trace element spider diagrams for the granite and gabbro in southwest Lahad Datu, Sabah. The Chondrite and primitive mantle values are from Sun and McDonough (1989) (b). ND-Cb-a and ND-Cb-b are the granite samples, ND-KET-a are gabbro samples.
The Lu-Hf isotope analysis was carried out on the dated micro-regions of the zircons from sample ND-KET-1, and a total of 23 points were analyzed. The results are presented in Table 3. The 176Lu/177Hf ratios of the 23 analysis points range from 0.000318 to 0.001462, with an average value of 0.000655, and all of the values are less than 0.002. The 176Hf/177Hf ratios range from 0.282972 to 0.283094, with an average value of 0.283036. The εHf(t) values range from 12.08 to 16.24, with an average of 14.32. The tDM1 values range from 226 Ma to 391 Ma, with an average of 302 Ma. The tDM2 values range from 223 Ma to 491 Ma, with an average of 347 Ma. The fLu/Hf values range from −0.99 to −0.96, with an average value of −0.98, which is significantly lower than the values for mafic crust (−0.34) and silicaluminous crust (−0.72). Therefore, the two-stage Hf model ages reflect the time when the source material was extracted from the depleted mantle or the average age of the source material in the crust.
Table
3.
Lu-Hf isotopic compositions of zircons of sample ND-KET-1
5.1
Ophiolite and crystalline basement chronological sequences in Southeast Sabah
The ages of ophiolite and crystalline basement felsic rocks in southeastern Sabah have been dated (Table 4). Gabbro zircon U-Pb dating obtained (230.9 ± 2.5)Ma, which is earlier than the previously reported K-Ar age of (217 ± 17)Ma measured for Metagabbro. Basic zircon ages indicate that gabbro existed in the early Late Triassic, which indirectly indicates that ophiolite in southeastern Sabah has existed since the early Late Triassic. Burton-Johnson et al. (2020) identified an intrusive contact relationship between the felsic rocks and mafic rocks in Segama Valley, Sabah. This contact indicates that the mafic rocks were formed earlier than the felsic rocks. Therefore, the Segama Valley ophiolite has existed since at least the early Late Triassic. Previous studies conducted on the Sabah ophiolite used K-Ar isotope dating, and they reported that the ophiolite is 179–33.4 Ma (Leong, 1977; Rangin et al., 1990; Omang, 1993; Omang and Barber, 1996; Swauger et al., 1995). However, K-Ar isotope dating has certain limitations for the Sabah ophiolite suites because the K contents of the ophiolite suites are low and the Ar content of the atmosphere is high (Graves et al., 2000). In addition, radiolarian dating has been used to estimate the ages of the ophiolite rocks ages (135–127 Ma) (Jasin, 2000). The geological map of Sabah shows that the KET groups were formed later than the Cb (Razak, 2015). The basalt and gabbro in the ophiolite suites in the Labuk and Segama areas exhibit the geochemical characteristics of mid-ocean ridge rocks. Graves et al. (2000) suggested that these rocks formed at a mid-ocean ridge spreading center. Therefore, in the early Late Triassic, the southeast Sabah ophiolite suites may have existed as part of the oceanic crust of the Paleo-Tethys or Panthalassa oceans. The formation of the Cb occurred later than the formation of the ophiolite suite in the southeast Sabah area. The crystalline basement granites may have been continuously emplaced from early Late Triassic to Early Cretaceous.
Table
4.
Age data of the crystalline basement and ophiolite suite in eastern Sabah area
5.2
Origin and genesis of the ophiolite gabbro and crystalline basement granite
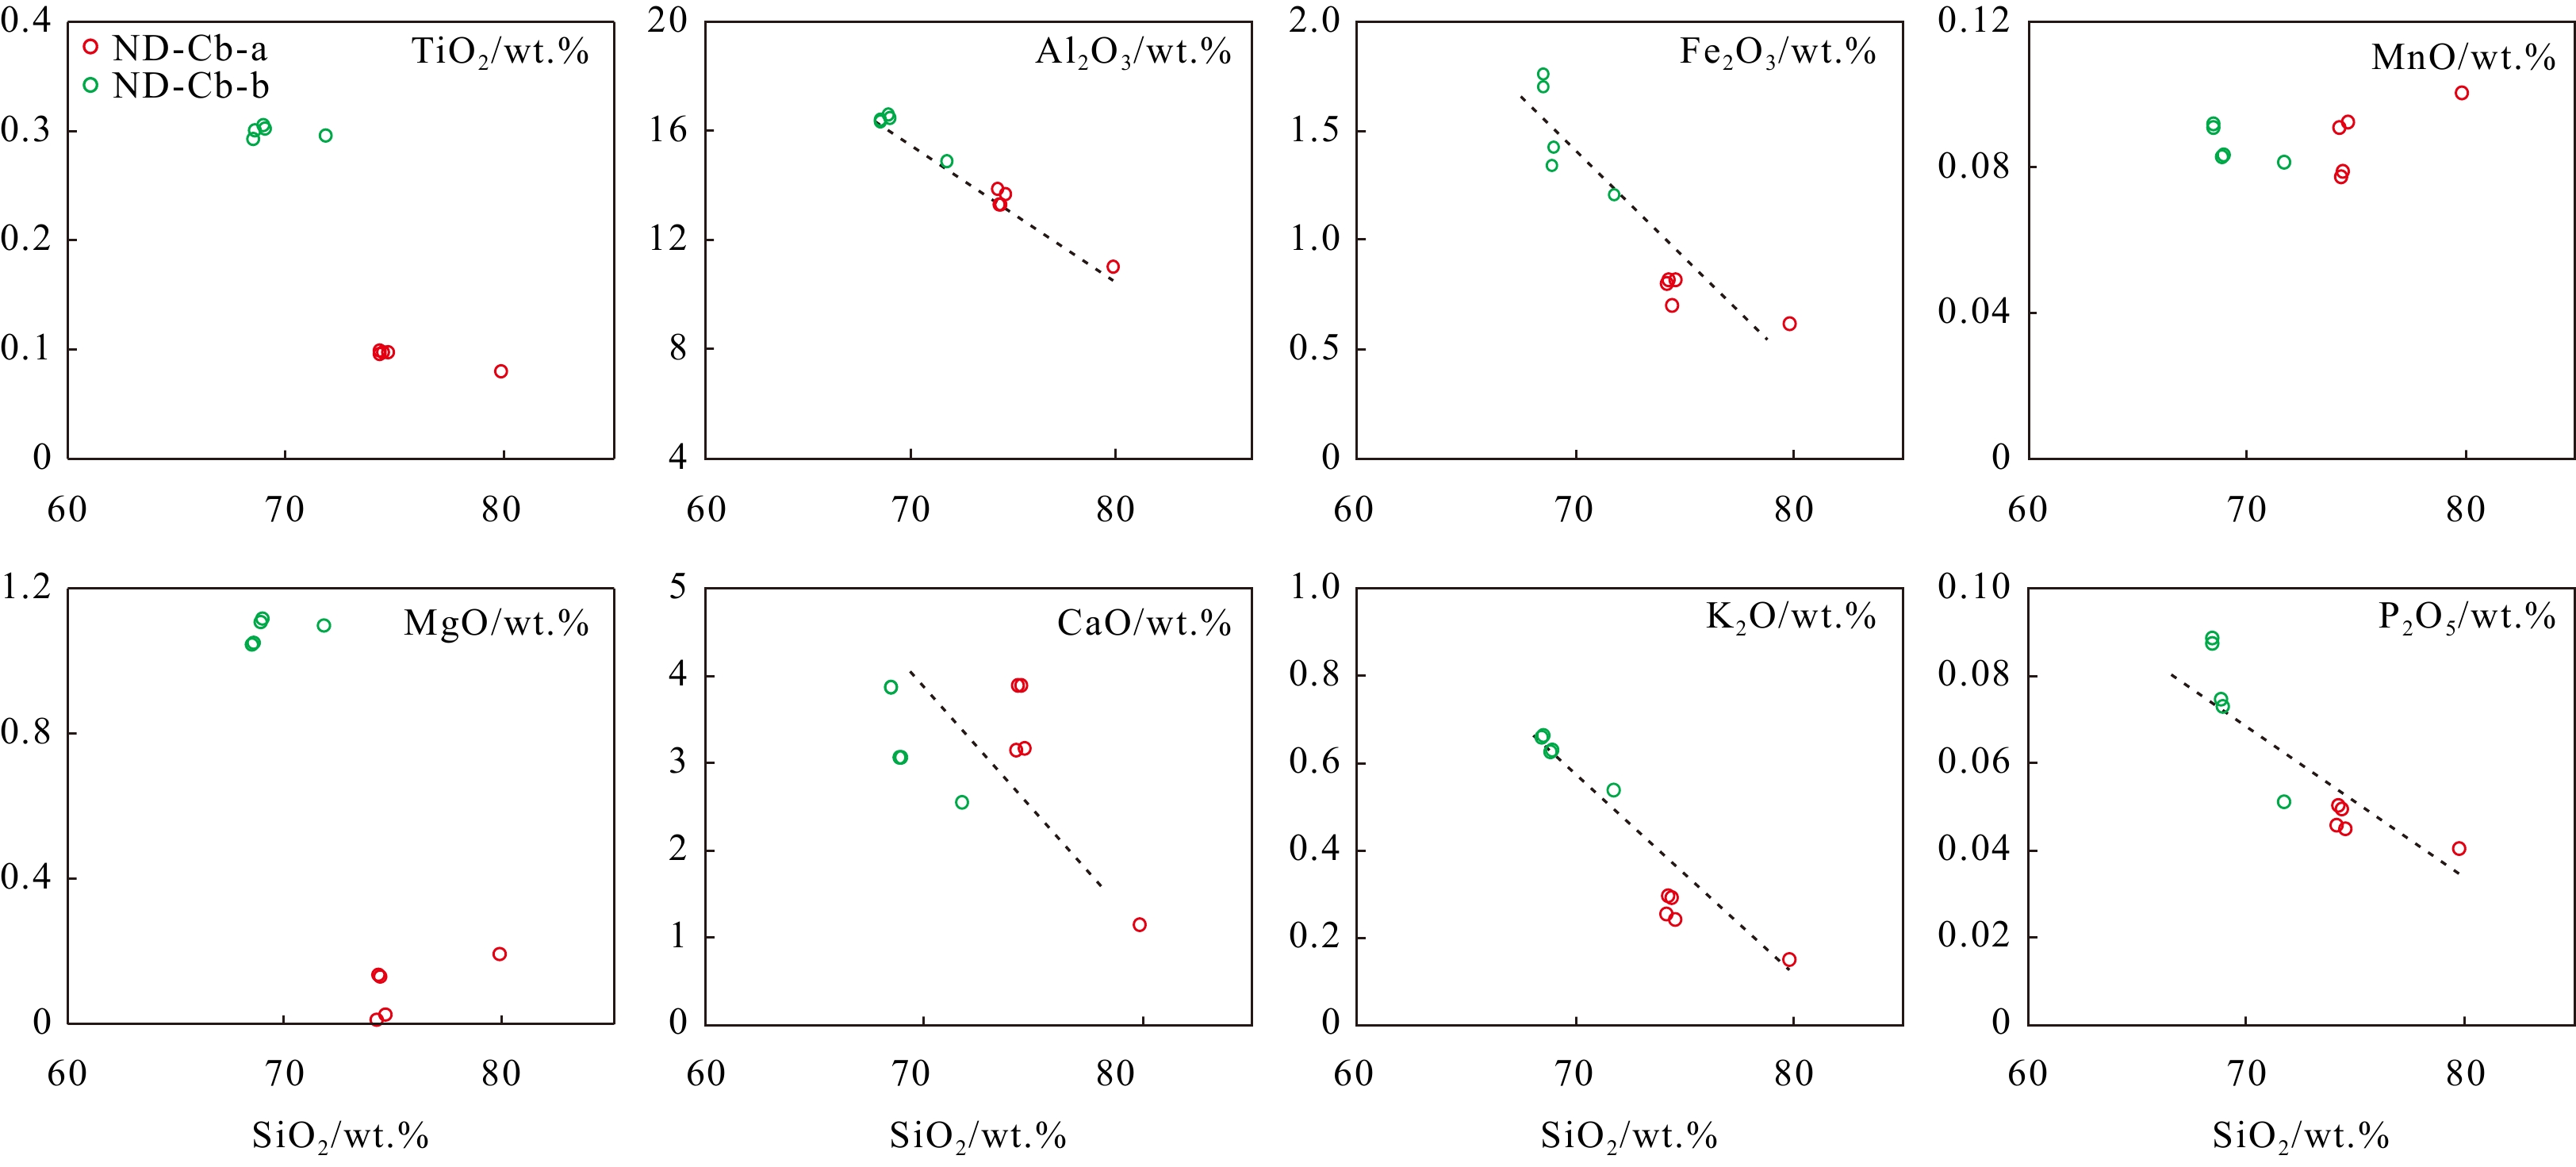
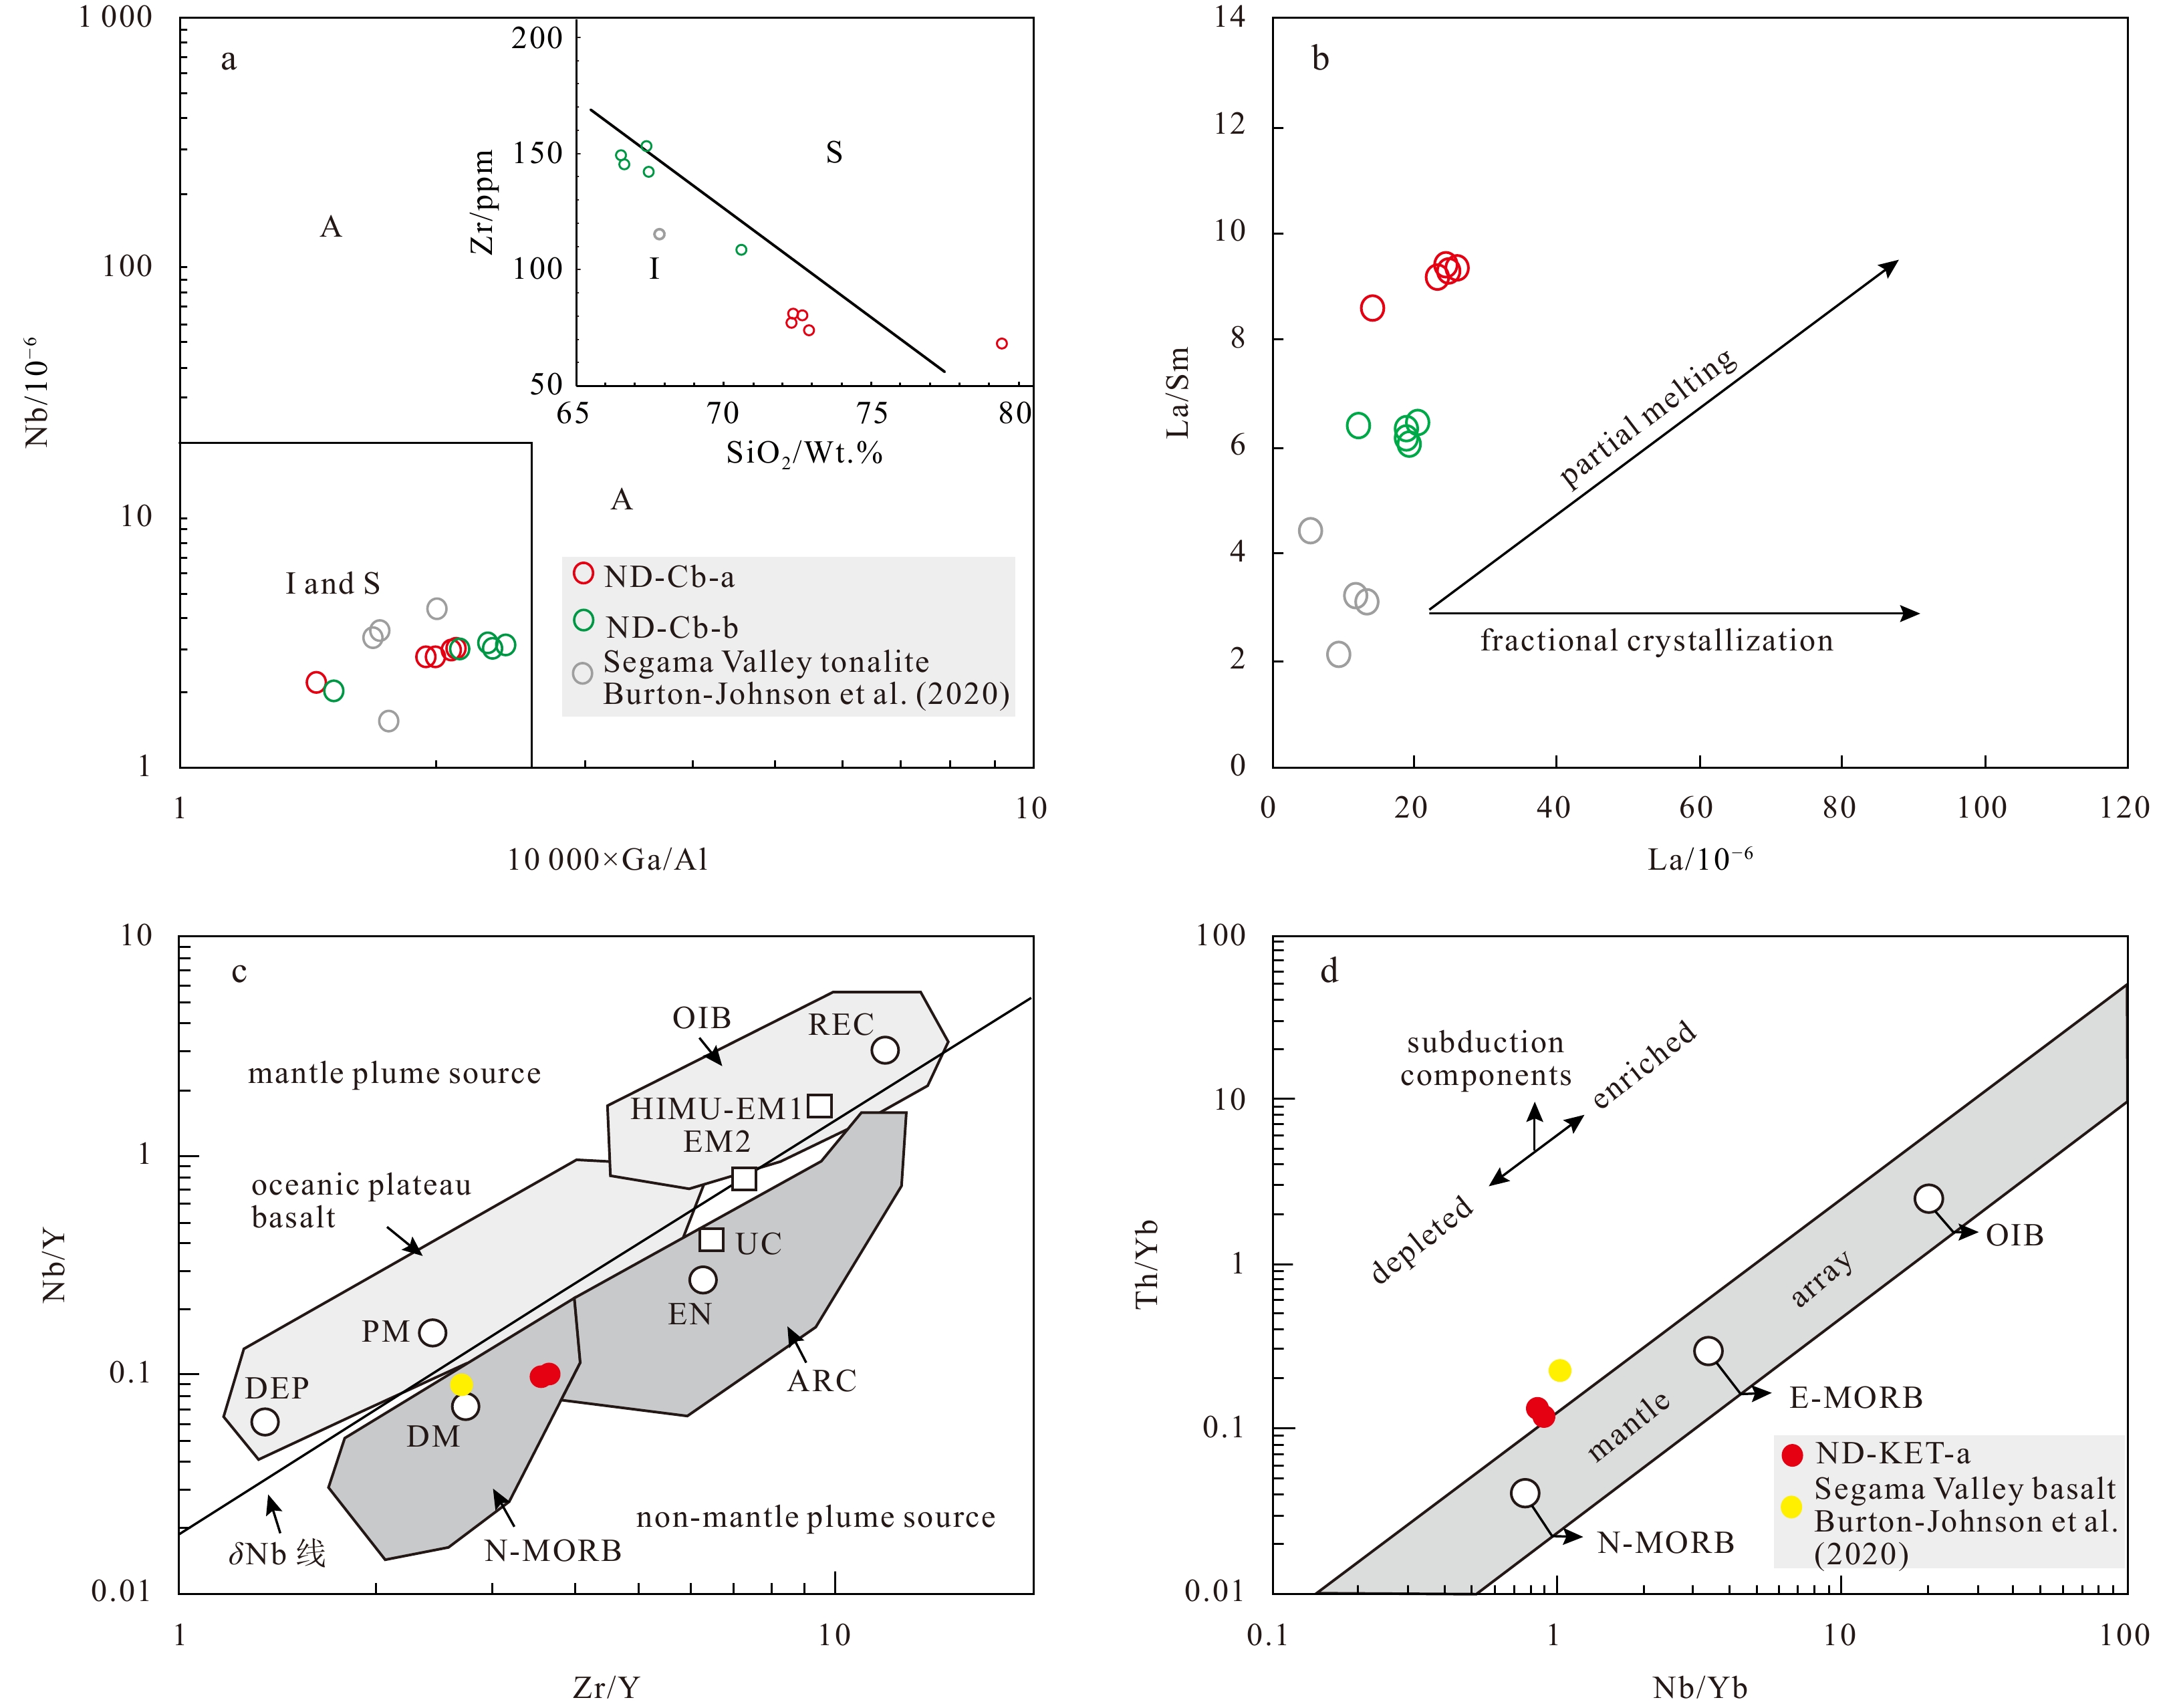
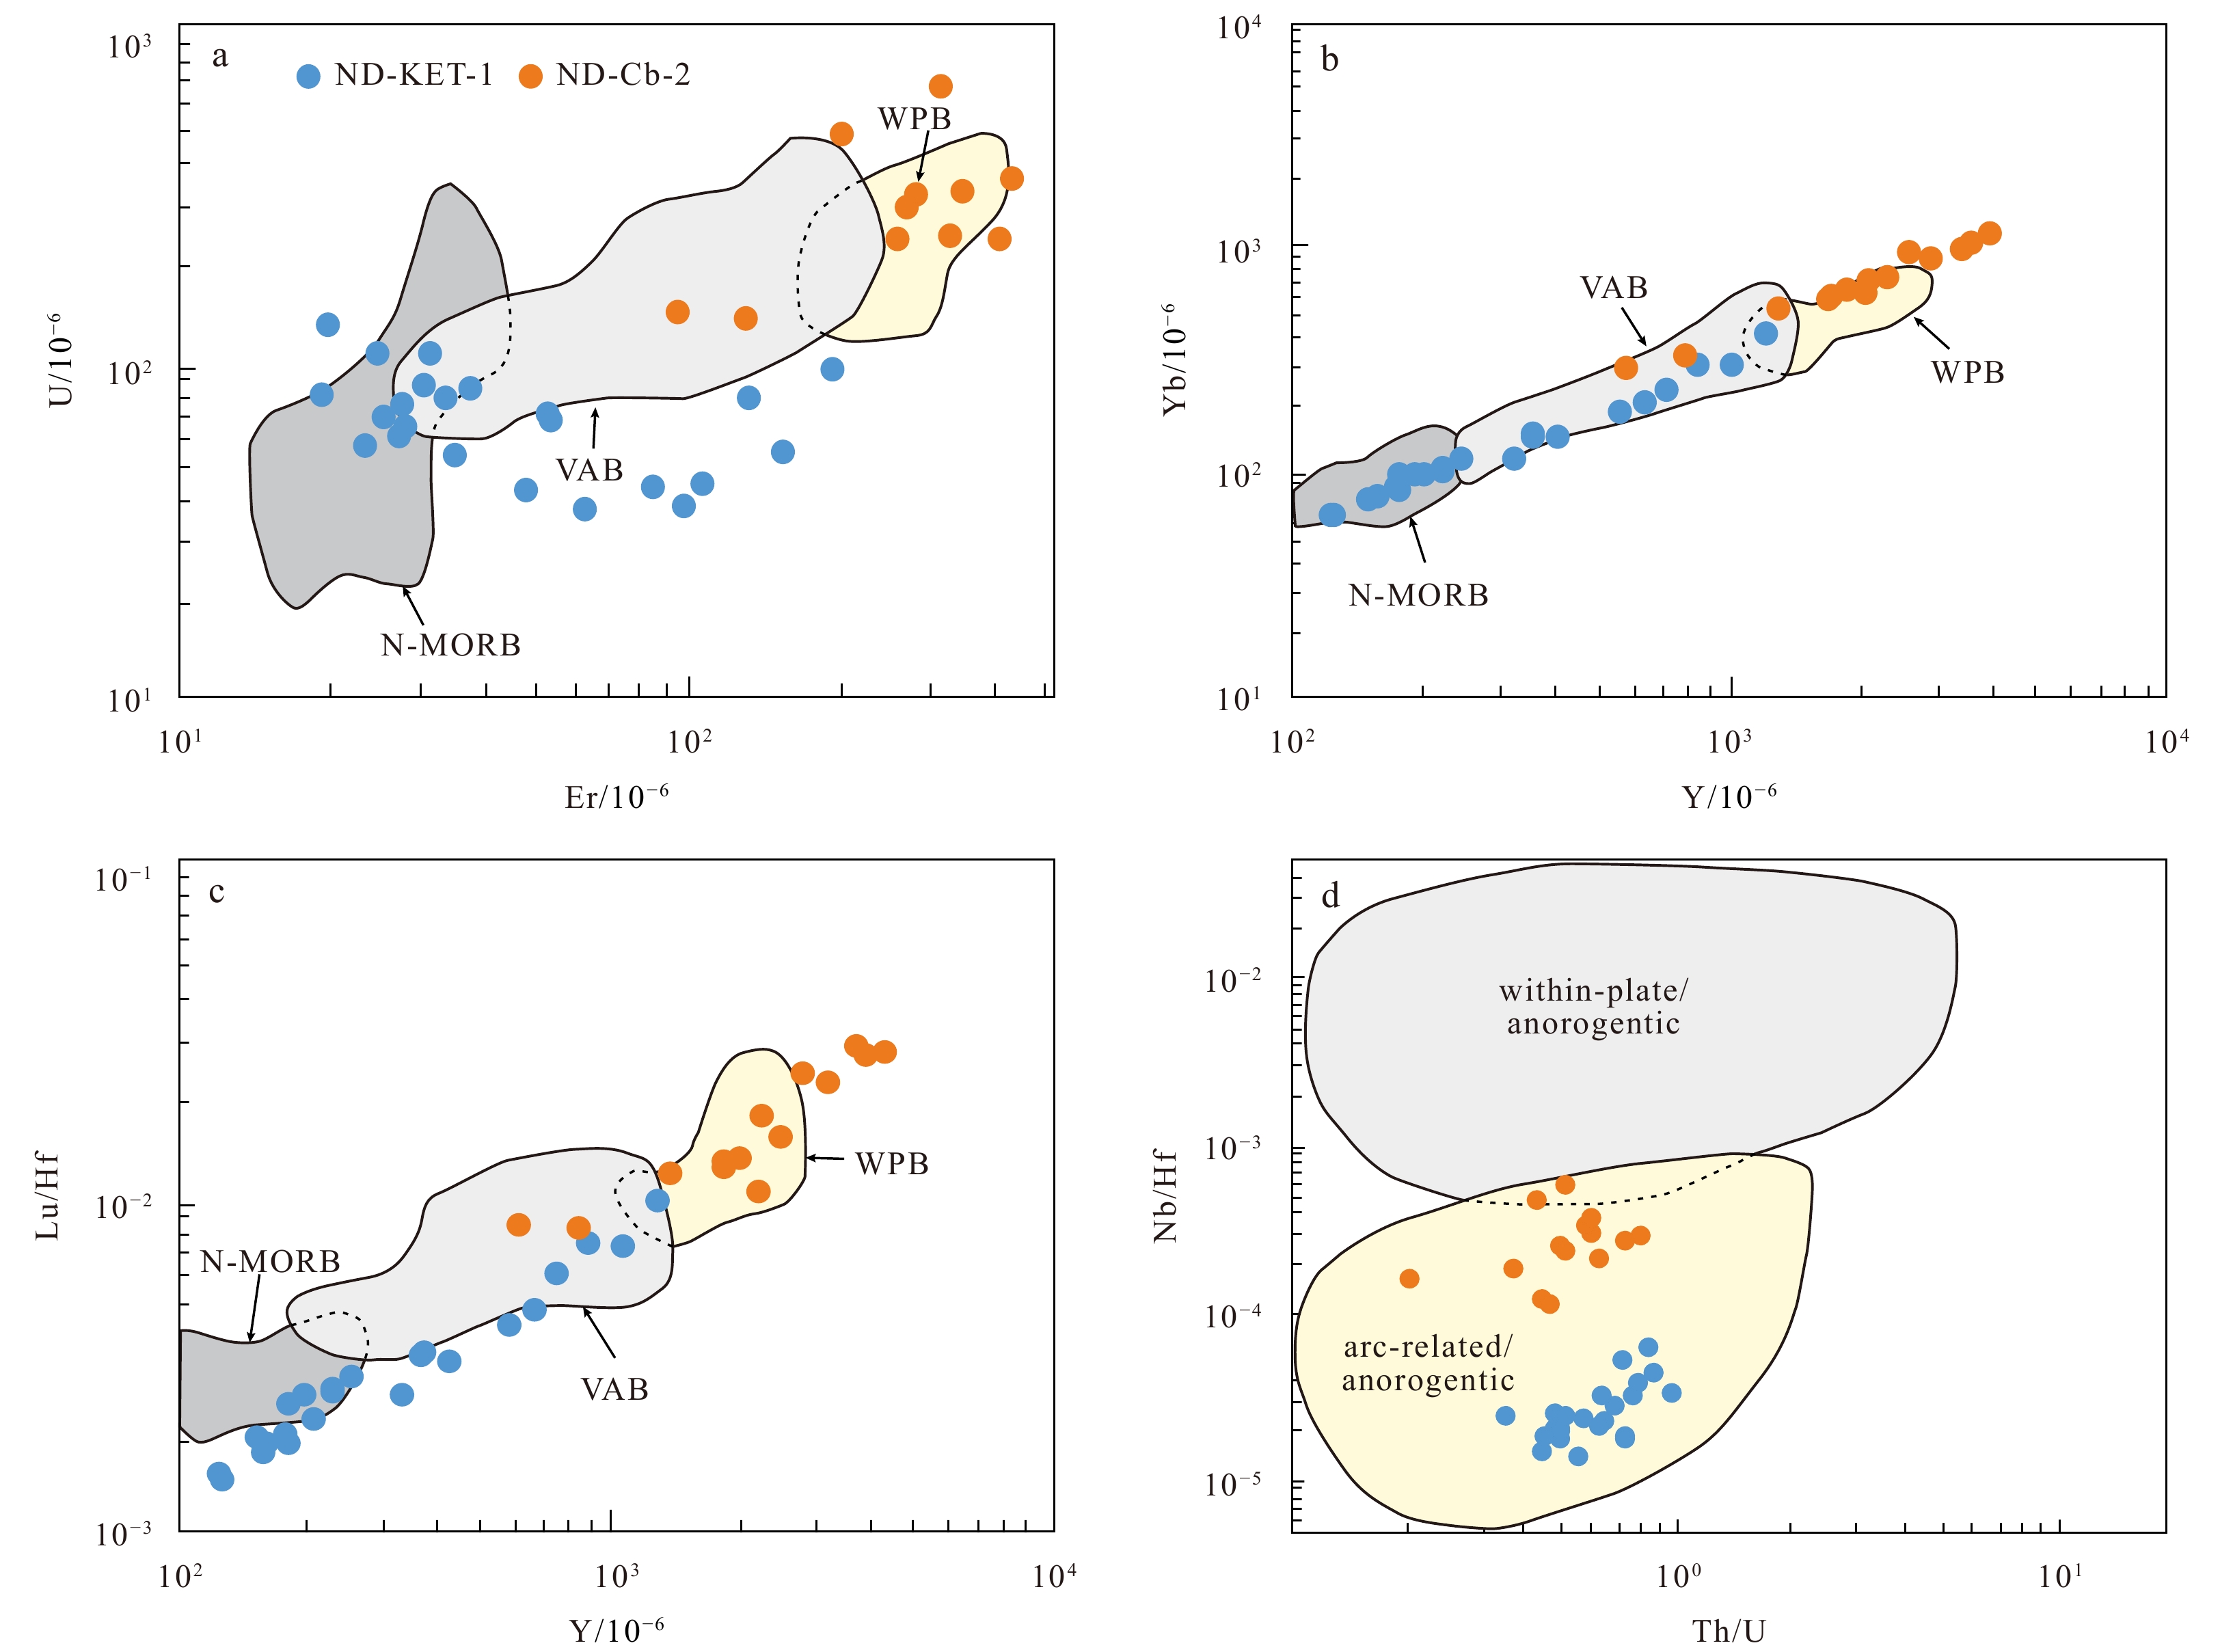
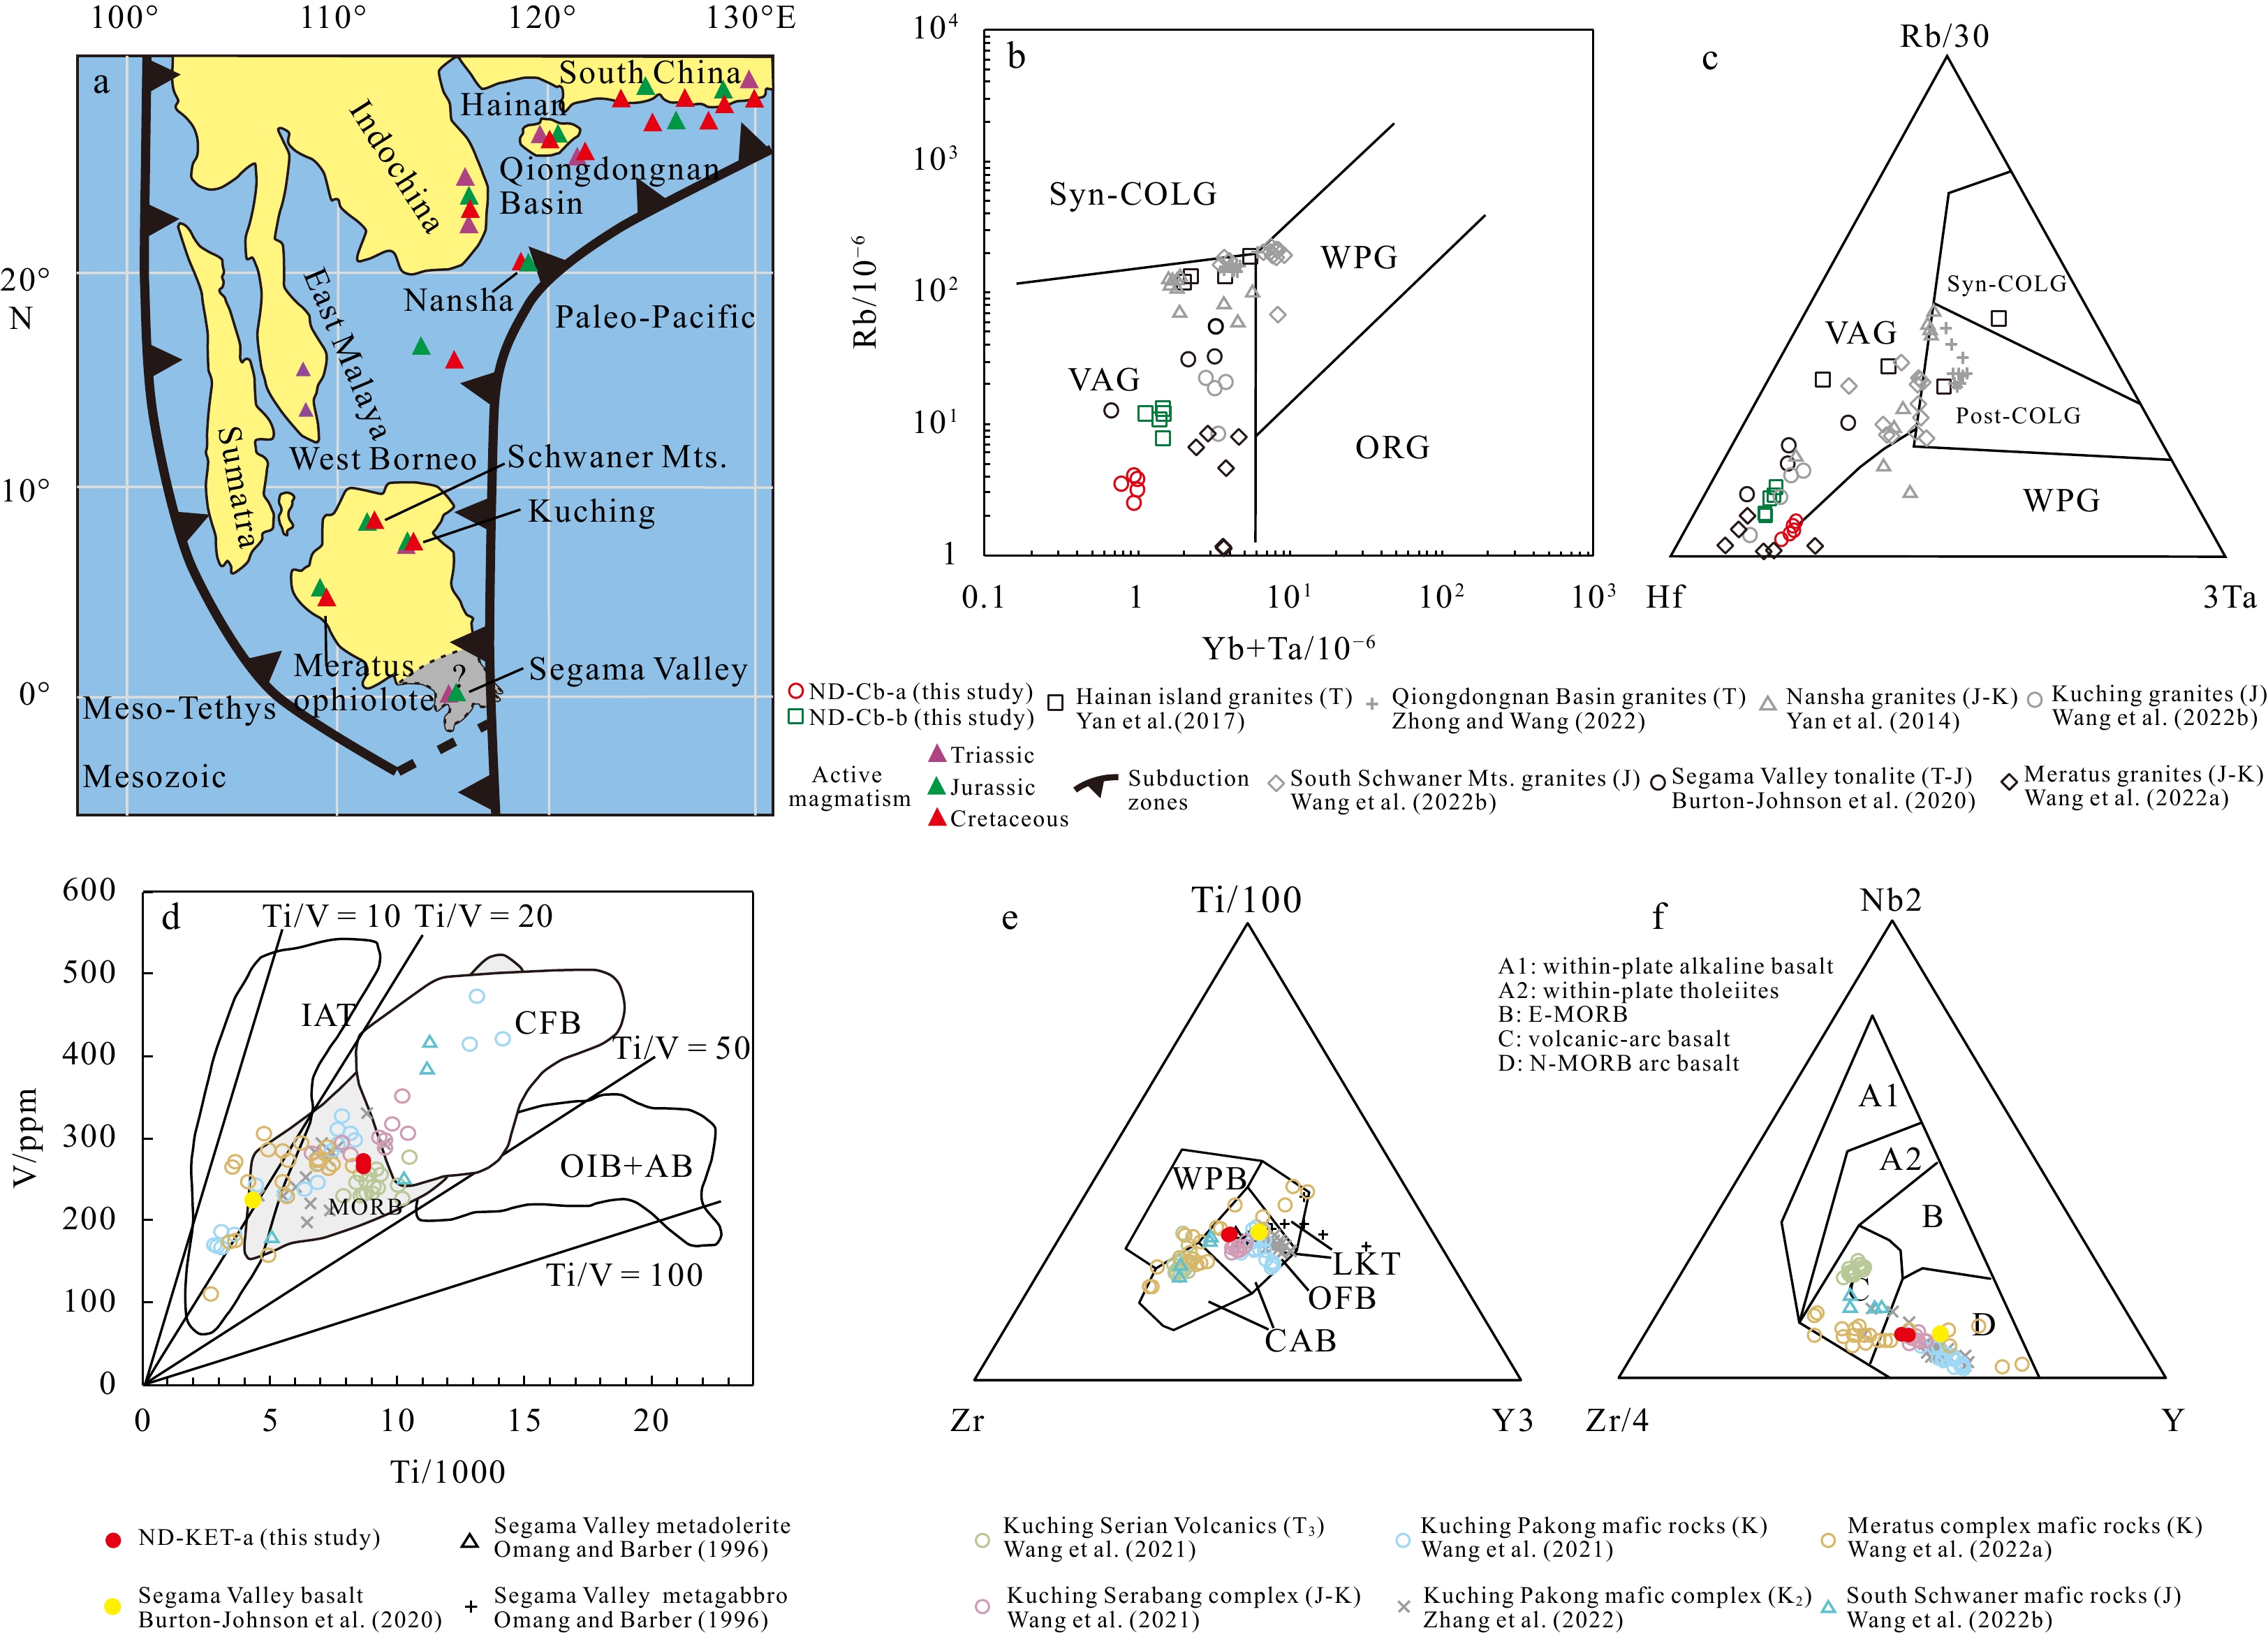
The granite and gabbro in southeastern Sabah belongs to the low-K tholeiite series (Fig. 6b). On the primitive mantle-normalized trace element spider diagrams, there is a deficit of Nb, Ta, P, and Ti elements (Fig. 7b). In the Harker diagram (Fig. 8), the major elements Al2O3, Fe2O3, CaO, K2O, and P2O5 are negatively correlated with SiO2, indicating that there may be crystal separation of apatite and potassium feldspar. The data of Nb-10000Ga/Al and Zr-SiO2 indicate that the granites are I-type granites (Fig. 9a), and a partial melting trend is evident in Fig. 9b. This indicates that the formation of the granite was related to the subduction of the oceanic crust. This may be the product of mixing between crust and mantle source magma. There are some differences in zircon trace elements in different tectonic setting. Therefore, zircon trace elements can discriminate the formation environment of host rocks (Schulz et al., 2006). The U-Er, Yb-Y, and Lu/Hf-Y diagrams show that granitic zircons fall in the plate basalt region (Figs 10a-c), indicating that the zircons crystallize due to mixing of continental crust materials. Also, the Nb/Hf-Th/U diagram indicates that the data fall into the arc/orogenic belt region (Fig. 10d), indicating that the tectonic setting of the formation is characterized by a volcanic arc. Zircon-Ti thermometers limit the temperatures of magma crystallization (Watson and Harrison, 2005; Ferry and Watson, 2007). The crystallization temperature values of the 14 zircons ranged from 646℃ to 812℃, with an average value of 723℃ (data see Table S1). On the genetic type diagram for the granite (Figs 11b, c), ten samples plot in the volcanic arc granitoids.
Figure
10.
Discrimination diagrams for tectonic setting of the host rocks of zircon. (a–c. modified from Schulz et al., 2006; d. modified from Yang et al., 2012; data see Table S1). VAB, Volcanic arc basalt; WPB, Within plate basalt.
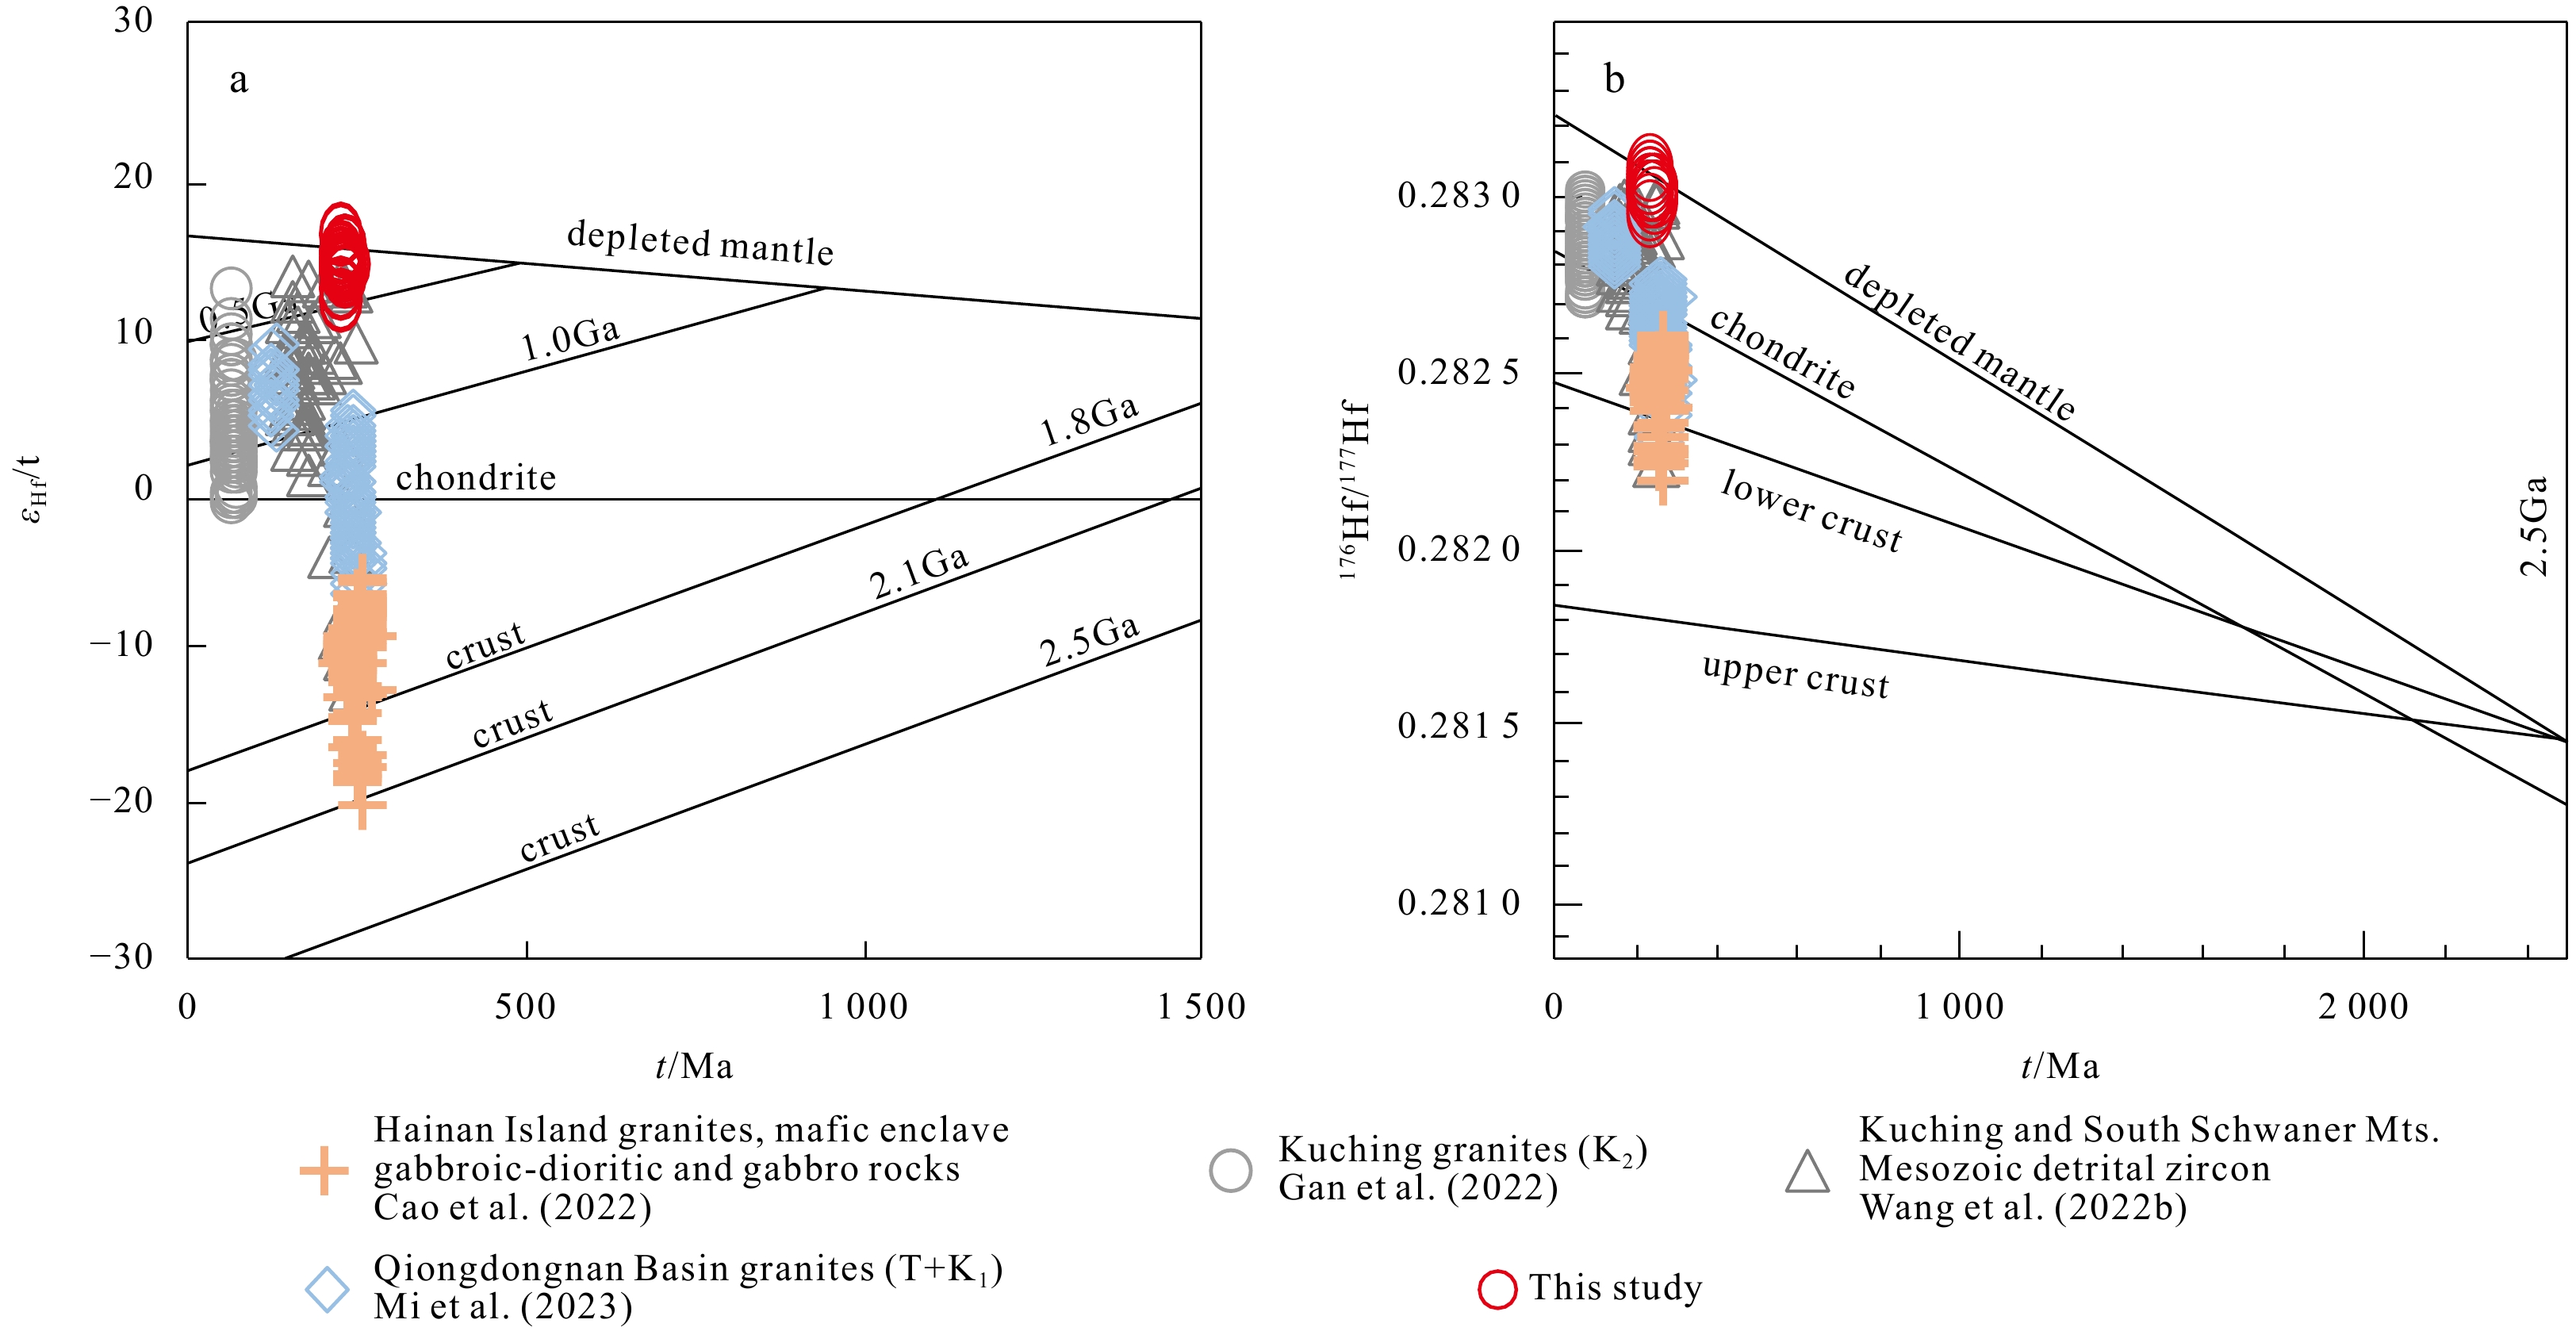
The chondrite-normalized REE patterns of the gabbro are flat type curves, and the primitive mantle-normalized trace element spider diagrams shows depletion of Rb, K and Nb elements (Fig. 6). The Zr/Y-Nb/Y and Nb/ Yb-Th/Yb diagrams show that the magma source is from the shallow depleted mantle (Figs 9c, d). Moreover, the U-Er, Yb-Y, and Lu/Hf-Y diagrams reveal that the gabbro zircons fall near mid-ocean ridges and volcanic arc regions (Figs 10a–c). The crystallization temperatures of the 23 zircons ranged from 639℃ to 756℃, with an average value of 692℃. The lower crystallization temperature may be related to fluid addition. On the genetic type diagram for the gabbro (Figs 11d–f), two samples plot in the MORB and ocean floor basalt field. The εHf(t) and εHf(0) values of the zircons from the gabbro are both positive, with small variation ranges. The two-stage Hf model ages (tDM2) range from 223 Ma to 491 Ma, with an average of 347 Ma. Most of the test points plot between the depleted mantle line and the 0.5 Ga crustal evolution line on the εHf(t)-t diagram (Fig. 12a). Most of the test points between chondrite and depleted mantle evolution lines on the 176Hf/177Hf-t diagram (Fig. 12b). This indicates that the diagenetic magma of the gabbro was mainly derived from the melting of newly formed crustal materials.
5.3
Tectonic significance of ophiolite and crystalline basement
Based on research on the ophiolite and the Proto-South China Sea, several scholars have proposed ideas regarding the Mesozoic tectonic activity and evolution of Sabah. Hutchison (1978) and Tongkul (1991) suggested that the ultramafic rocks of the ophiolite suites in southeastern Sabah intruded into the old oceanic crustal basement during the Early Mesozoic. Tjia (1988) proposed that the entirety of East Sabah, including the crystalline basement, drifted from another location. Schlüter et al. (1996) proposed that East Sabah may have split from the Southern Australia Plate. Graves et al. (2000) suggested that the Sabah ophiolite may have been part of the Western Pacific Plate or the eastern Indian Ocean Plate. Zheng et al. (2019) concluded that the South China Sea was located between the Tethys Ocean and the Paleo-Pacific transition zone during the Triassic based on the characteristics of radiolarians. Burton-Johnson et al. (2020) proposed that the emplacement of the felsic intrusive rocks and ophiolite in Sabah continued into the Cretaceous over a protracted period in an extensional supra-subduction zone setting. Tian et al. (2021b) suggested that Sabah may have drifted from the southern hemisphere in the Mesozoic based on paleomagnetic evidence. According to global plate reconstruction models (Arias, 2008; Metcalfe, 2011; Zi et al., 2012; Matthews et al., 2016; Huang et al., 2018; Young et al., 2019; Zheng et al., 2019), Sabah may have been part of the oceanic crust of the Paleo-Tethys Ocean or the Panthalassa Ocean during the Triassic. In the Early Triassic, the Paleo-Tethys Ocean was subducting toward the northeast, while the Panthalassa Ocean was subducting toward the west.
During the Triassic, southern China (Mao et al., 2014; Xu et al., 2016), Hainan (Yan et al., 2014, 2017), Vietnam (Thuy et al., 2004), Singapore (Oliver et al., 2014), and western Borneo experienced the emplacement of igneous rocks (Setiawan et al., 2013; Breitfeld et al., 2017; Hennig et al., 2017) (Fig. 11a). The ages of these intrusive rocks are similar to the age of the granite in southeastern Sabah. The Sabah crystalline basement granites, along with the Hainan Island, Qiongdongnan Basin, Nansha, Kuching zone, and Schwana Mountain Mesozoic granites, all belong to the volcanic arc background (Figs 11a, b, c). The Hainan Island and Qiongdongnan Basin Triassic granites formations are influenced by Paleo-Tethys subduction (Zhou et al., 2020; Mi et al., 2023), while the Kuching zone Triassic granites are influenced by Paleo-Pacific subduction (Breitfeld et al., 2017; Hennig et al., 2017). These southeastern Sabah granites may have been produced by the subduction of the oceanic crust of the Panthalassa Ocean under the oceanic crust of the Paleo-Tethys Ocean (Fig. 13a). The Lu-Hf isotopes of Mesozoic ophiolite, granites and detrital zircons from Hainan Island, Qiongdongnan Basin, and Kuching zone indicated that the Triassic magmatic composition in the northern to southern South China Sea gradually changed from ancient to young crustal material (Fig. 12). Parkinson et al. (1998) found eclogite and amphibole-bearing rocks in the Dent Peninsula, to the southeast of Sabah, and these rocks and the metamorphic rocks of the Cb are typical orogenic metamorphic rocks. This indicates that an orogeny may have occurred in the Sabah area during the early Late Triassic due to ocean-ocean subduction. Based on the characteristics of the sedimentary formation, there are no Late Triassic and Jurassic sedimentary formations in the Sabah area. Because of the subduction of the oceanic crust, the Sabah area was uplifted during the Late Triassic. It was not until the Early Cretaceous that the limestone of the Madai-Baturong Formation was deposited. Therefore, it is speculated that the Sabah area was part of the oceanic crust of the Paleo-Tethys Ocean during the early Late Triassic. Since the ocean-ocean collision led to uplift of the oceanic crust, followed by intrusion of volcanic arc-related granite.
What is the emplacement mechanism of ophiolite in southeastern Sabah? The emplacement mechanism of ophiolite may play an important role in controlling the exposure of different types of ophiolite (Stern, 2004). For example, the emplacement of ophiolite produced in the forearc basin, backarc basin, and mid-ocean ridge is different (Fig. 13b). Forearc ophiolite is easily emplaced due to high buoyancy in the forearc environment. The backarc environment is not conducive to ophiolite emplacement due to island arc uplift caused by extrusion. The mid-ocean ridge lithosphere tends to subduction, making it difficult to form mid-ocean ridge ophiolite. Gravity data revealed widespread low-gravity anomalies in most parts of Sabah, interpreted to be caused by the subduction of low-density continental crust (Holt, 1998; Milsom et al., 2001). The crystalline basement granite in southeastern Sabah was formed under the tectonic background of a volcanic arc. In the Mesozoic, the South China Sea area experienced the Paleo-Tethys and Panthalassa ocean subduction and the convergence of the Borneo plate. Therefore, the ophiolite in southeastern Sabah may be a remnant of the Paleo-Tethys oceanic crust and formed forearc ophiolite by Panthalassa subduction.
6.
Conclusions
Through analysis of the gabbro and granite in southeastern Sabah, the weighted average U-Pb ages of the zircons from samples ND-KET-1 and ND-Cb-2 were determined to be (230.9 ± 2.5)Ma and (207.1 ± 3.3)Ma. Zircon U-Pb dating of gabbro shows that the southeastern Sabah ophiolite was formed earlier than the early Late Triassic. The crystalline basement granites may have been continuously emplaced from the Late Triassic to Early Cretaceous. Based on previous studies and global plate reconstruction models, it is speculated that the granite in southeastern Sabah may have formed in an island arc environment, i.e., where the oceanic crust of the Paleo-Tethys Ocean collided with the oceanic crust of the Panthalassa Ocean.
Acknowledgments:
We thank Shao Lei, Thian Lai Goh, and Robert Simon for the field work.
Advokaat E L, Bongers M L M, Rudyawan A, et al. 2018. Early cretaceous origin of the Woyla Arc (Sumatra, Indonesia) on the Australian plate. Earth and Planetary Science Letters, 498: 348–361, doi: 10.1016/j.jpgl.2018.07.001
Arias C. 2008. Palaeoceanography and biogeography in the Early Jurassic Panthalassa and Tethys oceans. Gondwana Research, 14(3): 306–315, doi: 10.1016/j.gr.2008.03.004
Asis J, Jasin B. 2012. Aptian to Turonian Radiolaria from the Darvel Bay ophiolite complex, Kunak, Sabah. Bulletin of the Geological Society of Malaysia, 58: 89–96, doi: 10.7186/bgsm58201213
Blichert-Toft J, Albarède F. 1997. The Lu-Hf isotope geochemistry of chondrites and the evolution of the mantle-crust system. Earth and Planetary Science Letters, 148(1-2): 243–258, doi: 10.1016/s0012-821x(97)00040-x
Blichert-Toft J, Chauvel C, Albarède F. 1997. Separation of Hf and Lu for high-precision isotope analysis of rock samples by magnetic sector-multiple collector ICP-MS. Contributions to Mineralogy and Petrology, 127(3): 248–260, doi: 10.1007/s004100050278
Bol A J, Van Hoorn B. 1980. Structural styles in western Sabah offshore. Bulletin of the Geological Society of Malaysia, 12: 1–16, doi: 10.7186/bgsm12198001
Breitfeld H T, Hall R, Galin T, et al. 2017. A Triassic to cretaceous Sundaland-Pacific subduction margin in west Sarawak, Borneo. Tectonophysics, 694: 35–56, doi: 10.1016/j.tecto.2016.11.034
Burton-Johnson A, Macpherson C G, Millar I L, et al. 2020. A Triassic to Jurassic arc in north Borneo: geochronology, geochemistry, and genesis of the Segama Valley felsic intrusions and the Sabah ophiolite. Gondwana Research, 84: 229–244, doi: 10.1016/j.gr.2020.03.006
Cao Guangyue, Li Xiang, Xie Guogang, et al. 2022. Petrogenesis of late Permian to Middle Triassic magmatic rocks on northern Hainan Island, South China: Implications for crust–mantle interaction and the tectonic evolution of the Paleo-Tethys. Journal of Asian Earth Sciences, 234: 105238, doi: 10.1016/j.jseaes.2022.105238
Condie K C. 2005. High field strength element ratios in Archean basalts: a window to evolving sources of mantle plumes? Lithos, 79(3–4): 491–504,doi: 10.1016/j.lithos.2004.09.014
Dilek Y, Furnes H. 2011. Ophiolite genesis and global tectonics: geochemical and tectonic fingerprinting of ancient oceanic lithosphere. GSA Bulletin, 123(3-4): 387–411, doi: 10.1130/B30446.1
Ferry J M, Watson E B. 2007. New thermodynamic models and revised calibrations for the Ti-in-zircon and Zr-in-rutile thermometers. Contributions to Mineralogy and Petrology, 154(4): 429–437, doi: 10.1007/s00410-007-0201-0
Fuller M, Ali J R, Moss S J, et al. 1999. Paleomagnetism of borneo. Journal of Asian Earth Sciences, 17(1-2): 3–24, doi: 10.1016/S0743-9547(98)00057-9
Gan Chengshi, Qian Xin, Wang Yuejun, et al. 2022. Late cretaceous Granitoids along the northern Kuching zone: implications for the Paleo-Pacific subduction in Borneo. Lithosphere, 2022(1): 3310613, doi: 10.2113/2022/3310613
Graves J E, Hutchison C S, Bergman S C, et al. 2000. Age and MORB geochemistry of the Sabah ophiolite basement. Bulletin of the Geological Society of Malaysia, 44: 151–158, doi: 10.7186/bgsm44200019
Grieco G, Ferrario A, Von Quadt A, et al. 2001. The zircon-bearing Chromitites of the Phlogopite peridotite of Finero (Ivrea Zone, Southern Alps): evidence and geochronology of a Metasomatized mantle slab. Journal of Petrology, 42(1): 89–101, doi: 10.1093/petrology/42.1.89
Griffin W L, Graham S, O’Reilly S Y, et al. 2004. Lithosphere evolution beneath the Kaapvaal Craton: Re-Os systematics of sulfides in mantle-derived peridotites. Chemical Geology, 208(1-4): 89–118, doi: 10.1016/j.chemgeo.2004.04.007
Griffin W L, Pearson N J, Belousova E, et al. 2000. The Hf isotope composition of cratonic mantle: LAM-MC-ICPMS analysis of zircon megacrysts in kimberlites. Geochimica et Cosmochimica Acta, 64(1): 133–147, doi: 10.1016/s0016-7037(99)00343-9
Griffin W L, Wang Xiang, Jackson S E, et al. 2002. Zircon chemistry and magma mixing, SE China: in-situ analysis of Hf isotopes, Tonglu and Pingtan igneous complexes. Lithos, 61(3-4): 237–269, doi: 10.1016/S0024-4937(02)00082-8
Hall R. 1996. Reconstructing Cenozoic SE Asia. Tectonic Evolution of Southeast Asia, 126: 153–184.
Hall R. 2011. Australia–SE Asia collision: plate tectonics and crustal flow. Geological Society, London, Special Publications, 355(1): 75–109,doi: 10.1144/SP355.5
Hall R. 2012. Late Jurassic–Cenozoic reconstructions of the Indonesian region and the Indian Ocean. Tectonophysics, 570–571: 1–41,doi: 10.1016/j.tecto.2012.04.021
Hall R. 2013. Contraction and extension in northern Borneo driven by subduction rollback. Journal of Asian Earth Sciences, 76: 399–411, doi: 10.1016/j.jseaes.2013.04.010
Hall R, Breitfeld H T. 2017. Nature and demise of the Proto-South China Sea. Bulletin of the Geological Society of Malaysia, 63: 61–76, doi: 10.7186/bgsm63201703
Harris N B W, Pearce J A, Tindle A G. 1986. Geochemical characteristics of collision-zone magmatism. Geological Society, London, Special Publications, 19(1): 67–81,doi: 10.1144/GSL.SP.1986.019.01.04
Hennig J, Breitfeld H T, Hall R, et al. 2017. The Mesozoic tectono-magmatic evolution at the Paleo-Pacific subduction zone in West Borneo. Gondwana Research, 48: 292–310, doi: 10.1016/j.gr.2017.05.001
Hermann J, Rubatto D, Trommsdorff V. 2006. Sub-solidus Oligocene zircon formation in garnet peridotite during fast decompression and fluid infiltration (Duria, Central Alps). Mineralogy and Petrology, 88(1-2): 181–206, doi: 10.1007/s00710-006-0155-3
Holloway N H. 1981. The North Palawan block, Philippines: its relation to the Asian mainland and its role in the evolution of the South China Sea. Bulletin of the Geological Society of Malaysia, 14: 19–58, doi: 10.7186/bgsm14198102
Holt R A. 1998. The gravity field of sundaland: acquisition, assessment and interpretation [dissertation]. London: University of London.
Huang Baochun, Yan Yonggang, Piper J D A, et al. 2018. Paleomagnetic constraints on the paleogeography of the East Asian blocks during Late Paleozoic and Early Mesozoic times. Earth-Science Reviews, 186: 8–36, doi: 10.1016/j.earscirev.2018.02.004
Hutchison C S. 1975. Ophiolite in southeast Asia. GSA Bulletin, 86(6): 797–806., doi: 10.1130/0016-7606(1975)86<797:OISA>2.0.CO;2
Hutchison C S. 1978. Ophiolite metamorphism in Northeast Borneo. Lithos, 11(3): 195–208., doi: 10.1016/0024-4937(78)90020-8
Hutchison C S. 1989. Geological Evolution of South-east Asia. Oxford: Clarendon Press, 1–368.
Hutchison C S. 1996. The ‘Rajang accretionary prism’ and ‘Lupar Line’ problem of Borneo. Geological Society, London, Special Publications, 106(1): 247–261, doi: 10.1144/GSL.SP.1996.106.01.16
Hutchison C S. 2010. Oroclines and paleomagnetism in Borneo and South-East Asia. Tectonophysics, 496(1-4): 53–67, doi: 10.1016/j.tecto.2010.10.008
Imai A, Ozawa K. 1991. Tectonic implications of the hydrated garnet peridotites near Mt Kinabalu, Sabah, East Malaysia. Journal of Southeast Asian Earth Sciences, 6(3-4): 431–445, doi: 10.1016/0743-9547(91)90086-d
Jasin B. 1992. Significance of radiolarian cherts from the Chert-Spilite Formation, Telupid, Sabah. Bulletin of the Geological Society of Malaysia, 31: 67–83., doi: 10.7186/bgsm31199205
Jasin B. 2000. Geological significance of radiolarian chert in Sabah. Bulletin of the Geological Society of Malaysia, 44: 35–43., doi: 10.7186/bgsm44200005
Jasin B, Tahir S, Samsuddin A R. 1985. Lower cretaceous radiolaria from the chert-spilite formation, kudat, Sabah. Warta Geologi, 11(4): 161–162.
Jasin B, Tongkul F. 2013. Cretaceous radiolarians from Baliojong ophiolite sequence, Sabah, Malaysia. Journal of Asian Earth Sciences, 76: 258–265, doi: 10.1016/j.jseaes.2012.10.038
Katayama I, Muko A, Iizuka T, et al. 2003. Dating of zircon from Ti-clinohumite-bearing garnet peridotite: implication for timing of mantle metasomatism. Geology, 31(8): 713–716, doi: 10.1130/G19525.1
Kirk H J C. 1968. The Igneous Rocks of Sarawak and Sabah. Washington: U. S. Government Printing Office.
Leong K M. 1971. Peridotite-gabbro problems, with special reference to the Segama Valley and Darvel Bay area, Sabah, East Malaysia. Geological Society of Malaysia, Newsletter, 28: 4–13.
Leong K M. 1974. The Geology and Mineral Resources of the Upper Segama Valley and Darvel Bay Area, Sabah, Malaysia. Washington: U. S. Government Printing Office, 354.
Leong K M. 1977. New ages from radiolarian cherts of the Chert-Spilite Formation, Sabah. Bulletin of the Geological Society of Malaysia, 8: 109–111, doi: 10.7186/bgsm08197707
Leong K M. 1998. Sabah crystalline basement: "Spurious" radiometric ages? Continental? Warta Geologi, 24: 5–8.
Leong K M. 2017. Review of 50-years (1966-2016) debate on age of Sabah crystalline basement granitic rocks: are the granitic rocks in upper Segama Sabah fragments of supercontinent pangaea? Warta Geologi, 43: 223–224.
Li Haiyong, Chen Renxu, Zheng Yongfei, et al. 2016. The crust-mantle interaction in continental subduction channels: Zircon evidence from orogenic peridotite in the Sulu orogen. Journal of Geophysical Research:Solid Earth, 121(2): 687–712, doi: 10.1002/2015jb012231
Li Cai, Zhai Qingguo, Dong Yongsheng, et al. 2007. Lungmu Co-Shanghu plate suture in the Qinghai-Tibet Plateau and records of the evolution of the Paleo-Tethys Ocean in the Qiangtang area, Tibet, China. Geological Bulletin of China (in Chinese), 26(1): 13–21
Liu Han, Wang Baodi, Chen Li, et al. 2015. Early carboniferous subduction of Lungmu Co-Shuanghu Paleo-Tethys Ocean: Evidence from island arc volcanic rocks in Riwanchaka, Central Qiangtang. Geological Bulletin of China (in Chinese), 34(2-3): 274–282
Ludwig K R. 2003. User’s manual for Isoplot 3.00: A geochronological toolkit for Microsoft Excel. Berkeley: Kenneth R. Ludwig, 4: 70.
Maniar P D, Piccoli P M. 1989. Tectonic discrimination of granitoids. GSA Bulletin, 101(5): 635–643, doi: 10.1130/0016-7606(1989)101<0635:TDOG>2.3.CO;2
Mao Jianren, Li Zilong, Ye Haimin. 2014. Mesozoic tectono-magmatic activities in South China: retrospect and prospect. Science China Earth Sciences, 57(12): 2853–2877, doi: 10.1007/s11430-014-5006-1
Matthews K J, Maloney K T, Zahirovic S, et al. 2016. Global plate boundary evolution and kinematics since the late Paleozoic. Global and Planetary Change, 146: 226–250, doi: 10.1016/j.gloplacha.2016.10.002
Metcalfe I. 1998. Palaeozoic and Mesozoic geological evolution of the SE Asian region: Multidisciplinary constraints and implications for biogeography. In: Hall R, Holloway J D, eds. Biogeography and Geological Evolution of SE Asia. Leiden: Backhuys Publishers, 25–41
Metcalfe I. 2011. Tectonic framework and Phanerozoic evolution of Sundaland. Gondwana Research, 19(1): 3–21, doi: 10.1016/j.gr.2010.02.016
Metcalfe I. 2013. Gondwana dispersion and Asian accretion: tectonic and palaeogeographic evolution of eastern Tethys. Journal of Asian Earth Sciences, 66: 1–33, doi: 10.1016/j.jseaes.2012.12.020
Metcalfe I. 2021. Multiple Tethyan ocean basins and orogenic belts in Asia. Gondwana Research, 100: 87–130, doi: 10.1016/j.gr.2021.01.012
Mi Lijun, Tang Xiaoyin, Yang Haizhang, et al. 2023. Zircon U-Pb geochronology, Hf isotopes, and geochemistry constraints on the age and tectonic affinity of the basement granitoids from the Qiongdongnan Basin, northern South China Sea. Acta Oceanologica Sinica, 42(3): 19–30, doi: 10.1007/s13131-022-2078-1
Middlemost E A K. 1994. Naming materials in the magma/igneous rock system. Earth-Science Reviews, 37(3-4): 215–224, doi: 10.1016/0012-8252(94)90029-9
Milsom J, Holt R, Hutchison C S, et al. 2001. Discussion of a Miocene collisional belt in north Borneo: uplift mechanism and isostatic adjustment quantified by thermochronology: Journal, Vol. 157, 2000, 783–793. Journal of the Geological Society, 158(2): 396–400, doi: 10.1144/jgs.158.2.396
Moores E M. 1982. Origin and emplacement of ophiolites. Reviews of Geophysics, 20(4): 735–760, doi: 10.1029/RG020i004p00735
Oliver G, Zaw K, Hotson M, et al. 2014. U–Pb zircon geochronology of Early Permian to Late Triassic rocks from Singapore and Johor: a plate tectonic reinterpretation. Gondwana Research, 26(1): 132–143, doi: 10.1016/j.gr.2013.03.019
Omang S A K. 1993. Petrology, geochemistry and structural geology of the Darvel Bay ophiolite, Sabah [dissertation]. London: University of London.
Omang S A K, Barber A J. 1996. Origin and tectonic significance of the metamorphic rocks associated with the Darvel Bay Ophiolite, Sabah, Malaysia. Geological Society, London, Special Publication, 106: 263–279, doi: 10.1144/gsl.sp.1996.106.01.17
Omang S A K, Tahir S H. 1995. Cretaceous and Neogene lavas of Sabah-origin and tectonic significance. Bulletin of the Geological Society of Malaysia, 38: 21–30, doi: 10.7186/bgsm38199503
Parkinson C D, Miyazaki K, Wakita K, et al. 1998. An overview and tectonic synthesis of the pre-Tertiary very-high-pressure metamorphic and associated rocks of Java, Sulawesi and Kalimantan, Indonesia. Island Arc, 7(1-2): 184–200., doi: 10.1046/j.1440-1738.1998.00184.x
Pearce J A, Cann J R. 1973. Tectonic setting of basic volcanic rocks determined using trace element analyses. Earth and Planetary Science Letters, 19(2): 290–300., doi: 10.1016/0012-821X(73)90129-5
Pearce J A, Harris N B W, Tindle A G. 1984. Trace element discrimination diagrams for the tectonic interpretation of granitic rocks. Journal of Petrology, 25(4): 956–983, doi: 10.1093/petrology/25.4.956
Pearce J A, Peate D W. 1995. Tectonic implications of the composition of volcanic arc magmas. Annual Review of Earth and Planetary Sciences, 23(1): 251–285, doi: 10.1146/annurev.ea.23.050195.001343
Rickwood P C. 1989. Boundary lines within petrologic diagrams which use oxides of major and minor elements. Lithos, 22(4): 247–263, doi: 10.1016/0024-4937(89)90028-5
Robinson P T, Trumbull R B, Schmitt A, et al. 2015. The origin and significance of crustal minerals in ophiolitic chromitites and peridotites. Gondwana Research, 27(2): 486–506, doi: 10.1016/j.gr.2014.06.003
Schlüter H U, Hinz K, Block M. 1996. Tectono-stratigraphic terranes and detachment faulting of the South China Sea and Sulu Sea. Marine Geology, 130(1-2): 39–78., doi: 10.1016/0025-3227(95)00137-9
Schulz B, Klemd R, Brätz H. 2006. Host rock compositional controls on zircon trace element signatures in metabasites from the Austroalpine basement. Geochimica et Cosmochimica Acta, 70(3): 697–710, doi: 10.1016/j.gca.2005.10.001
Setiawan N I, Osanai Y, Nakano N, et al. 2013. Late Triassic metatonalite from the Schwaner Mountains in West Kalimantan and its contribution to sedimentary provenance in the Sundaland. Berita Sedimentologi, 28(1): 5–13.
Setiawan N I, Osanai Y, Nakano N, et al. 2015. Metamorphic evolution of garnet-bearing epidote-barroisite schist from the Meratus Complex in South Kalimantan, Indonesia. Indonesian Journal on Geoscience, 2(3): 139–156, doi: 10.17014/ijog.2.3.139-156
Sevastjanova I, Hall R, Rittner M, et al. 2016. Myanmar and Asia united, Australia left behind long ago. Gondwana Research, 32: 24–40, doi: 10.1016/j.gr.2015.02.001
Shervais J W. 1982. Ti-V plots and the petrogenesis of modern and ophiolitic lavas. Earth and Planetary Science Letters, 59(1): 101–118., doi: 10.1016/0012-821X(82)90120-0
Smith D, Griffin W L. 2005. Garnetite xenoliths and mantle-water interactions below the Colorado Plateau, Southwestern United States. Journal of Petrology, 46(9): 1901–1924, doi: 10.1093/petrology/egi042
Stern R J. 2004. Subduction initiation: spontaneous and induced. Earth and Planetary Science Letters, 226(3-4): 275–292., doi: 10.1016/S0012-821X(04)00498-4
Sun S S, McDonough W F. 1989. Chemical and isotopic systematics of oceanic basalts: Implications for mantle composition and processes. Geological Society, London, Special Publications, 42: 313–345, doi: 10.1144/gsl.sp.1989.042.01.19
Swauger D A, Bergman S C, Graves J E, et al. 1995. Tertiary stratigraphic, tectonic, and thermal history of Sabah, Malaysia: results of a 10 day reconnaissance field study and laboratory analyses. ARCO International Oil and Gas Company, TRS 95-0036, 1–61 (unpublished report).
Thuy N T B, Satir M, Siebel W, et al. 2004. Geochemical and isotopic constraints on the petrogenesis of granitoids from the Dalat zone, southern Vietnam. Journal of Asian Earth Sciences, 23(4): 467–482, doi: 10.1016/j.jseaes.2003.06.001
Tian Zhiwen, Tang Wu, Wang Pujun, et al. 2021b. Tectonic evolution and key geological issues of the Proto-South China Sea. Acta Geologica Sinica (English Edition), 95(1): 77–90, doi: 10.1111/1755-6724.14644
Tian Zhiwen, Tang Huafeng, Zhao Zhigang, et al. 2021a. U-Pb dating of sandstone detrital zircons from Chert-Spilite Formation in Sabah, Malaysia and its geological significance. Global Geology (in Chinese), 40(1): 52–64, doi: 10.3969/j.issn.1004-5589.2021.01.006
Tjia H D. 1988. Accretion tectonics in Sabah: Kinabalu suture and East Sabah accreted terrane. Bulletin of the Geological Society of Malaysia, 22: 237–251., doi: 10.7186/bgsm22198812
Tongkul F. 1990. Structural style and tectonics of western and northern Sabah. Bulletin of the Geological Society of Malaysia, 27: 227–239., doi: 10.7186/bgsm27199011
Tongkul F. 1991. Tectonic evolution of Sabah, Malaysia. Journal of Southeast Asian Earth Sciences, 6(3-4): 395–405, doi: 10.1016/0743-9547(91)90084-b
Tongkul F. 1994. The geology of Northern Sabah, Malaysia: its relationship to the opening of the South China Sea Basin. Tectonophysics, 235(1-2): 131–147, doi: 10.1016/0040-1951(94)90021-3
Wakita K, Miyazaki K, Zulkarnain I, et al. 1998. Tectonic implications of new age data for the Meratus complex of South Kalimantan, Indonesia. Island Arc, 7(1-2): 202–222, doi: 10.1046/j.1440-1738.1998.00163.x
Wang Pengcheng, Li Sanzhong, Guo Lingli, et al. 2016. Mesozoic and Cenozoic accretionary orogenic processes in Borneo and their mechanisms. Geological Journal, 51(S1): 464–489, doi: 10.1002/gj.2835
Wang Yuejun, Liu Zi, Murtadha S, et al. 2022b. Jurassic subduction of the Paleo-Pacific plate in Southeast Asia: new insights from the igneous and sedimentary rocks in West Borneo. Journal of Asian Earth Sciences, 232: 105111, doi: 10.1016/j.jseaes.2022.105111
Wang Yuejun, Qian Xin, Asis J B, et al. 2023. “Where, when and why” for the arc-trench gap from Mesozoic Paleo-Pacific subduction zone: Sabah Triassic-Cretaceous igneous records in East Borneo. Gondwana Research, 117: 117–138, doi: 10.1016/j.gr2023.01.008
Wang Yuejun, Qian Xin, Cawood P A, et al. 2022a. Cretaceous Tethyan subduction in SE Borneo: Geochronological and geochemical constraints from the igneous rocks in the Meratus Complex. Journal of Asian Earth Sciences, 226: 105084, doi: 10.1016/j.jseaes.2022.105084
Wang Yuejun, Zhang Aimei, Qian Xin, et al. 2021. Cretaceous Kuching accretionary orogenesis in Malaysia Sarawak: Geochronological and geochemical constraints from mafic and sedimentary rocks. Lithos, 400–401: 106425, doi: 10.1016/j.lithos.2021.106425
Watson E B, Harrison T M. 2005. Zircon thermometer reveals minimum melting conditions on earliest earth. Science, 308(5723): 841–844, doi: 10.1126/science.1110873
Whalen J B, Currie K L, Chappell B W. 1987. A-type granites: geochemical characteristics, discrimination and petrogenesis. Contributions to Mineralogy and Petrology, 95(4): 407–419, doi: 10.1007/BF00402202
Xu Junjie. 2019. The tectono-stratigraphic framework and geodynamics of the Zengmu Basin, southern South China Sea (in Chinese)[dissertation]. Wuhan: China University of Geosciences.
Xu Changhai, Shi Hesheng, Barnes C G, et al. 2016. Tracing a late Mesozoic magmatic arc along the Southeast Asian margin from the granitoids drilled from the northern South China Sea. International Geology Review, 58(1): 71–94, doi: 10.1080/00206814.2015.1056256
Yamamoto S, Komiya T, Yamamoto H, et al. 2013. Recycled crustal zircons from podiform chromitites in the Luobusa ophiolite, southern Tibet. Island Arc, 22(1): 89–103, doi: 10.1111/iar.12011
Yan Quanshu, Metcalfe I, Shi Xuefa. 2017. U-Pb isotope geochronology and geochemistry of granites from Hainan Island (northern South China Sea margin): Constraints on late Paleozoic-Mesozoic tectonic evolution. Gondwana Research, 49: 333–349, doi: 10.1016/j.gr.2017.06.007
Yan Quanshu, Shi Xuefa, Castillo P R. 2014. The late Mesozoic-Cenozoic tectonic evolution of the South China Sea: a petrologic perspective. Journal of Asian Earth Sciences, 85: 178–201, doi: 10.1016/j.jseaes.2014.02.005
Yang Jianghai, Cawood P A, Du Yuansheng, et al. 2012. Large Igneous Province and magmatic arc sourced Permian-Triassic volcanogenic sediments in China. Sedimentary Geology, 261–262: 120–131, doi: 10.1016/j.sedgeo.2012.03.018.
Young A, Flament N, Maloney K, et al. 2019. Global kinematics of tectonic plates and subduction zones since the late Paleozoic Era. Geoscience Frontiers, 10(3): 989–1013, doi: 10.1016/j.gsf.2018.05.011
Yuwono Y S, Priyomarsono S, Maury R C, et al. 1988. Petrology of the Cretaceous magmatic rocks from Meratus Range, southeast Kalimantan. Journal of Southeast Asian Earth Sciences, 2(1): 15–22, doi: 10.1016/0743-9547(88)90017-7
Zahirovic S, Seton M, Müller R D. 2014. The Cretaceous and Cenozoic tectonic evolution of Southeast Asia. Solid Earth, 5(1): 227–273, doi: 10.5194/se-5-227-2014
Zhang Aimei, Asis J B, Fang Xudong, et al. 2022. Late Cretaceous fore–arc spreading in the northern Kuching Zone of West Borneo, SE Asia: Constraints from the Pakong Mafic Complex. Journal of Asian Earth Sciences, 230: 105189, doi: 10.1016/j.jseaes.2022.105189
Zheng Han, Sun Xiaomeng, Wang Pujun, et al. 2019. Mesozoic tectonic evolution of the Proto-South China Sea: a perspective from radiolarian paleobiogeography. Journal of Asian Earth Sciences, 179: 37–55, doi: 10.1016/j.jseaes.2019.04.009
Zhou Yang, Yan Yi, Liu Hailing, et al. 2020. U-Pb isotope geochronology of Syntectonic granites from Hainan Island, South China: constraints on tectonic evolution of the eastern Paleo-Tethys Ocean. Journal of Ocean University of China, 19(6): 1315–1330, doi: 10.1007/s11802-020-4352-1
Zi Jianwei, Cawood P A, Fan Weiming, et al. 2012. Triassic collision in the Paleo-Tethys Ocean constrained by volcanic activity in SW China. Lithos, 144–145: 145–160, doi: 10.1016/j.lithos.2012.04.020
Zhigang Zhao, Wu Tang, Shixiang Liu, Huafeng Tang, Pujun Wang, Zhiwen Tian. U-Pb zircon ages and petrogeochemistry and tectonic implications of gabbro and granite in southwest Lahad Datu area of Sabah, Malaysia[J]. Acta Oceanologica Sinica, 2024, 43(2): 94-110. doi: 10.1007/s13131-023-2218-2
Zhigang Zhao, Wu Tang, Shixiang Liu, Huafeng Tang, Pujun Wang, Zhiwen Tian. U-Pb zircon ages and petrogeochemistry and tectonic implications of gabbro and granite in southwest Lahad Datu area of Sabah, Malaysia[J]. Acta Oceanologica Sinica, 2024, 43(2): 94-110. doi: 10.1007/s13131-023-2218-2
Figure 1. Regional map: the DEM and tectonic setting (modified from Hall (2012) and Zheng et al. (2019)) (a), geological map (modified from Jasin and Tongkul (2013), Wang et al. (2023)) of Sabah (b) , and cross section across Sabah (modified from Hall (2013)) (c). Cb, Triassic crystalline basement; KET, Cretaceous–early Tertiary igneous groups; Cs, Cretaceous–Eocene Chert–Spilite Formation; Mb, early Cretaceous Madai-Baturong limestone Formation; Lb, Oligocene Labang Formation; Ay, Oligocene–middle Miocene Ayer Formation; Km, middle Miocene Kuamut Formation; Tj, early Miocen–Middle Miocen Tanjong Formation; Tk, middle Miocen Tabanak Conglomerate Formation. DEM from http://www.ngdc.noaa.gov/mgg/image/2minrelief.html.
Figure 2. Light red siliceous rock of Cs Formation (4°49′48.7″N, 118°05′52.8″E) (a); chert (b); sandstone and dark mudstone interbedded of Cs Formation (4°57′46.6″N, 118°12′03.8″E) (c); basaltic peperite (d); cataclastic granite in tectonic zone (5°00′15.9″N, 118°14′07.8″E) (e) ; cataclastic granite (f); gabbro of KET group (5°03′40.6″N, 118°14′25.5″E) (g); gabbro (h) ; serpentinized peridotite of KET group (5°03′40.6″N, 118°14′25.5″E) (i); serpentinized peridotite (j). Aug, Augite; Kfs, K-feldspar; Ol, Olivine; Pl, Plagioclase; Qz, Quartz; Ser, Serpentine.
Figure 7. Chondrite-normalized REE patterns (a) and primitive mantle-normalized trace element spider diagrams for the granite and gabbro in southwest Lahad Datu, Sabah. The Chondrite and primitive mantle values are from Sun and McDonough (1989) (b). ND-Cb-a and ND-Cb-b are the granite samples, ND-KET-a are gabbro samples.
Figure 8. Harker diagrams of ND-Cb-a and ND-Cb-b.
Figure 9. Discrimination diagrams for magmatic origin and sources of gabbro and granites. a. Nb-1000 × Ga/Al (Whalen et al., 1987); b. La/Sm-La; c. Nb/Y-Zr/Y (Condie, 2005); d. Th/Yb-Nb/Yb (Pearce and Peate, 1995). DEP, deep depleted mantle; DM, shallow depleted mantle; EM1 and EM2, enriched mantle sources; EN, Enriched component; PM, primitive mantle; REC, recycled component; UC, average component upper continental crust; MORB, mid-ocean ridge basalts.
Figure 10. Discrimination diagrams for tectonic setting of the host rocks of zircon. (a–c. modified from Schulz et al., 2006; d. modified from Yang et al., 2012; data see Table S1). VAB, Volcanic arc basalt; WPB, Within plate basalt.


 DownLoad:


 DownLoad:


 DownLoad: