The cross-shore variation in wind speeds influenced by beach nourishment, especially the dramatic changes at the nourished berm, is important for understanding the aeolian sand transport processes that occur after beach nourishment, which will contribute to better beach nourishment project design on windy coasts. In this paper, the influencing factors and potential mechanism of wind speed variation at the edge of a nourished berm were studied. Field observations, together with the Duna model, were used to study the cross-shore wind speed distribution for different nourishment schemes. The results show that the nourished berm elevation and beachface slope are the main factors controlling the increase in wind speed at the berm edge. When the upper beach slope is constant, the wind speed at the berm edge has a positive linear correlation with the berm elevation. When the berm elevation remains constant, the wind speed at the berm edge is also proportional to the upper beach slope. Considering the coupling effects of nourished berm elevation and beachface slope, a model for predicting the wind speed amplification rate at the nourished berm edge was established, and the underlying coupling mechanism was illustrated.
Beach nourishment is an engineering and technical means for rapidly widening beaches and stabilizing shorelines through artificial sand filling (Finkl and Walker, 2002; Hu et al., 2008; Zhuang et al., 2009, 2011; Cai, 2015). Beach nourishment changes the original beach topography significantly and rapidly; for example, after sand filling, beaches are elevated with rising berms and slopes, and foredunes are restored (Qi et al., 2021). On windy coasts, the beach topography change by beach nourishment will significantly alter the wind field above the beach (van der Wal, 1998; Jackson and Nordstrom, 2011). The near-shore wind affects the aeolian sand transport process, which is an important factor that should be considered in beach nourishment. Understanding the characteristics of the cross-shore wind speed distribution will benefit the design of beach nourishment projects in windy areas and the efficiency of sand filling (Cai, 2015; Peterson and Bishop, 2005). The cross-shore wind speed after beach nourishment may vary significantly, especially at the edge of the beach berm, which is mainly affected by two factors: the nourished berm height (NBH) and the nourished beach slope (NBS) (Nordstrom et al., 2006; Sloss et al., 2012; Pupienis et al., 2014; Liu et al., 2016; Kaczkowski et al., 2018; Hojan et al., 2019). They influence each other naturally, but there are few studies on their relative importance and their influence on wind speed at the edge of a nourished beach berm. A number of simulations and measurements have been carried out on wind field variations caused by topography changes in inland hills, desert dunes and natural beaches (Jackson and Hunt, 1975; Neuman et al., 1997; Miller and Davenport, 1998; Bauer et al., 2009); however, there is little research to compare the wind fields before and after beach nourishment.
Numerical simulation is an important tool for studying the effects of topography on wind fields. It was initially based on the use of two-dimensional computational fluid dynamics (CFD) models (Abe et al., 1993; Byrne and Holdø, 1998; Nicholas, 2001; Safarzadeh et al., 2009) but was later extended to three-dimensional numerical simulations to simulate the distribution of wind fields over complex terrain and to obtain and analyze complex environments, such as the relationship between dunes and airflow fields on their surface (Lane et al., 2002; Lee et al., 2002; Lun et al., 2003; Stangroom, 2004; Nguyen and Nestmann, 2004; Inkratas et al., 2009; Feng and Ning, 2010; Jackson and Nordstrom, 2011). However, this method cannot address dynamic landscapes with strong interactions between processes and landforms, such as beach-dune systems. More recently, a series of wind-sand-topography coupling models, such as AEOLIS (Hoonhout and Vries, 2016), CS (Hallin et al., 2019), and Duna (Roelvink and Costas, 2019), have been developed to resolve this problem. Among them, Duna is a comprehensive open-source model based on the process of aeolian sand transport and morphodynamics. It also has high computational efficiency; therefore, based on field observations, Duna is used to simulate the wind fields for different nourishing scenarios, with a focus on the wind speed variation at the nourished berm edge.
2.
Study area
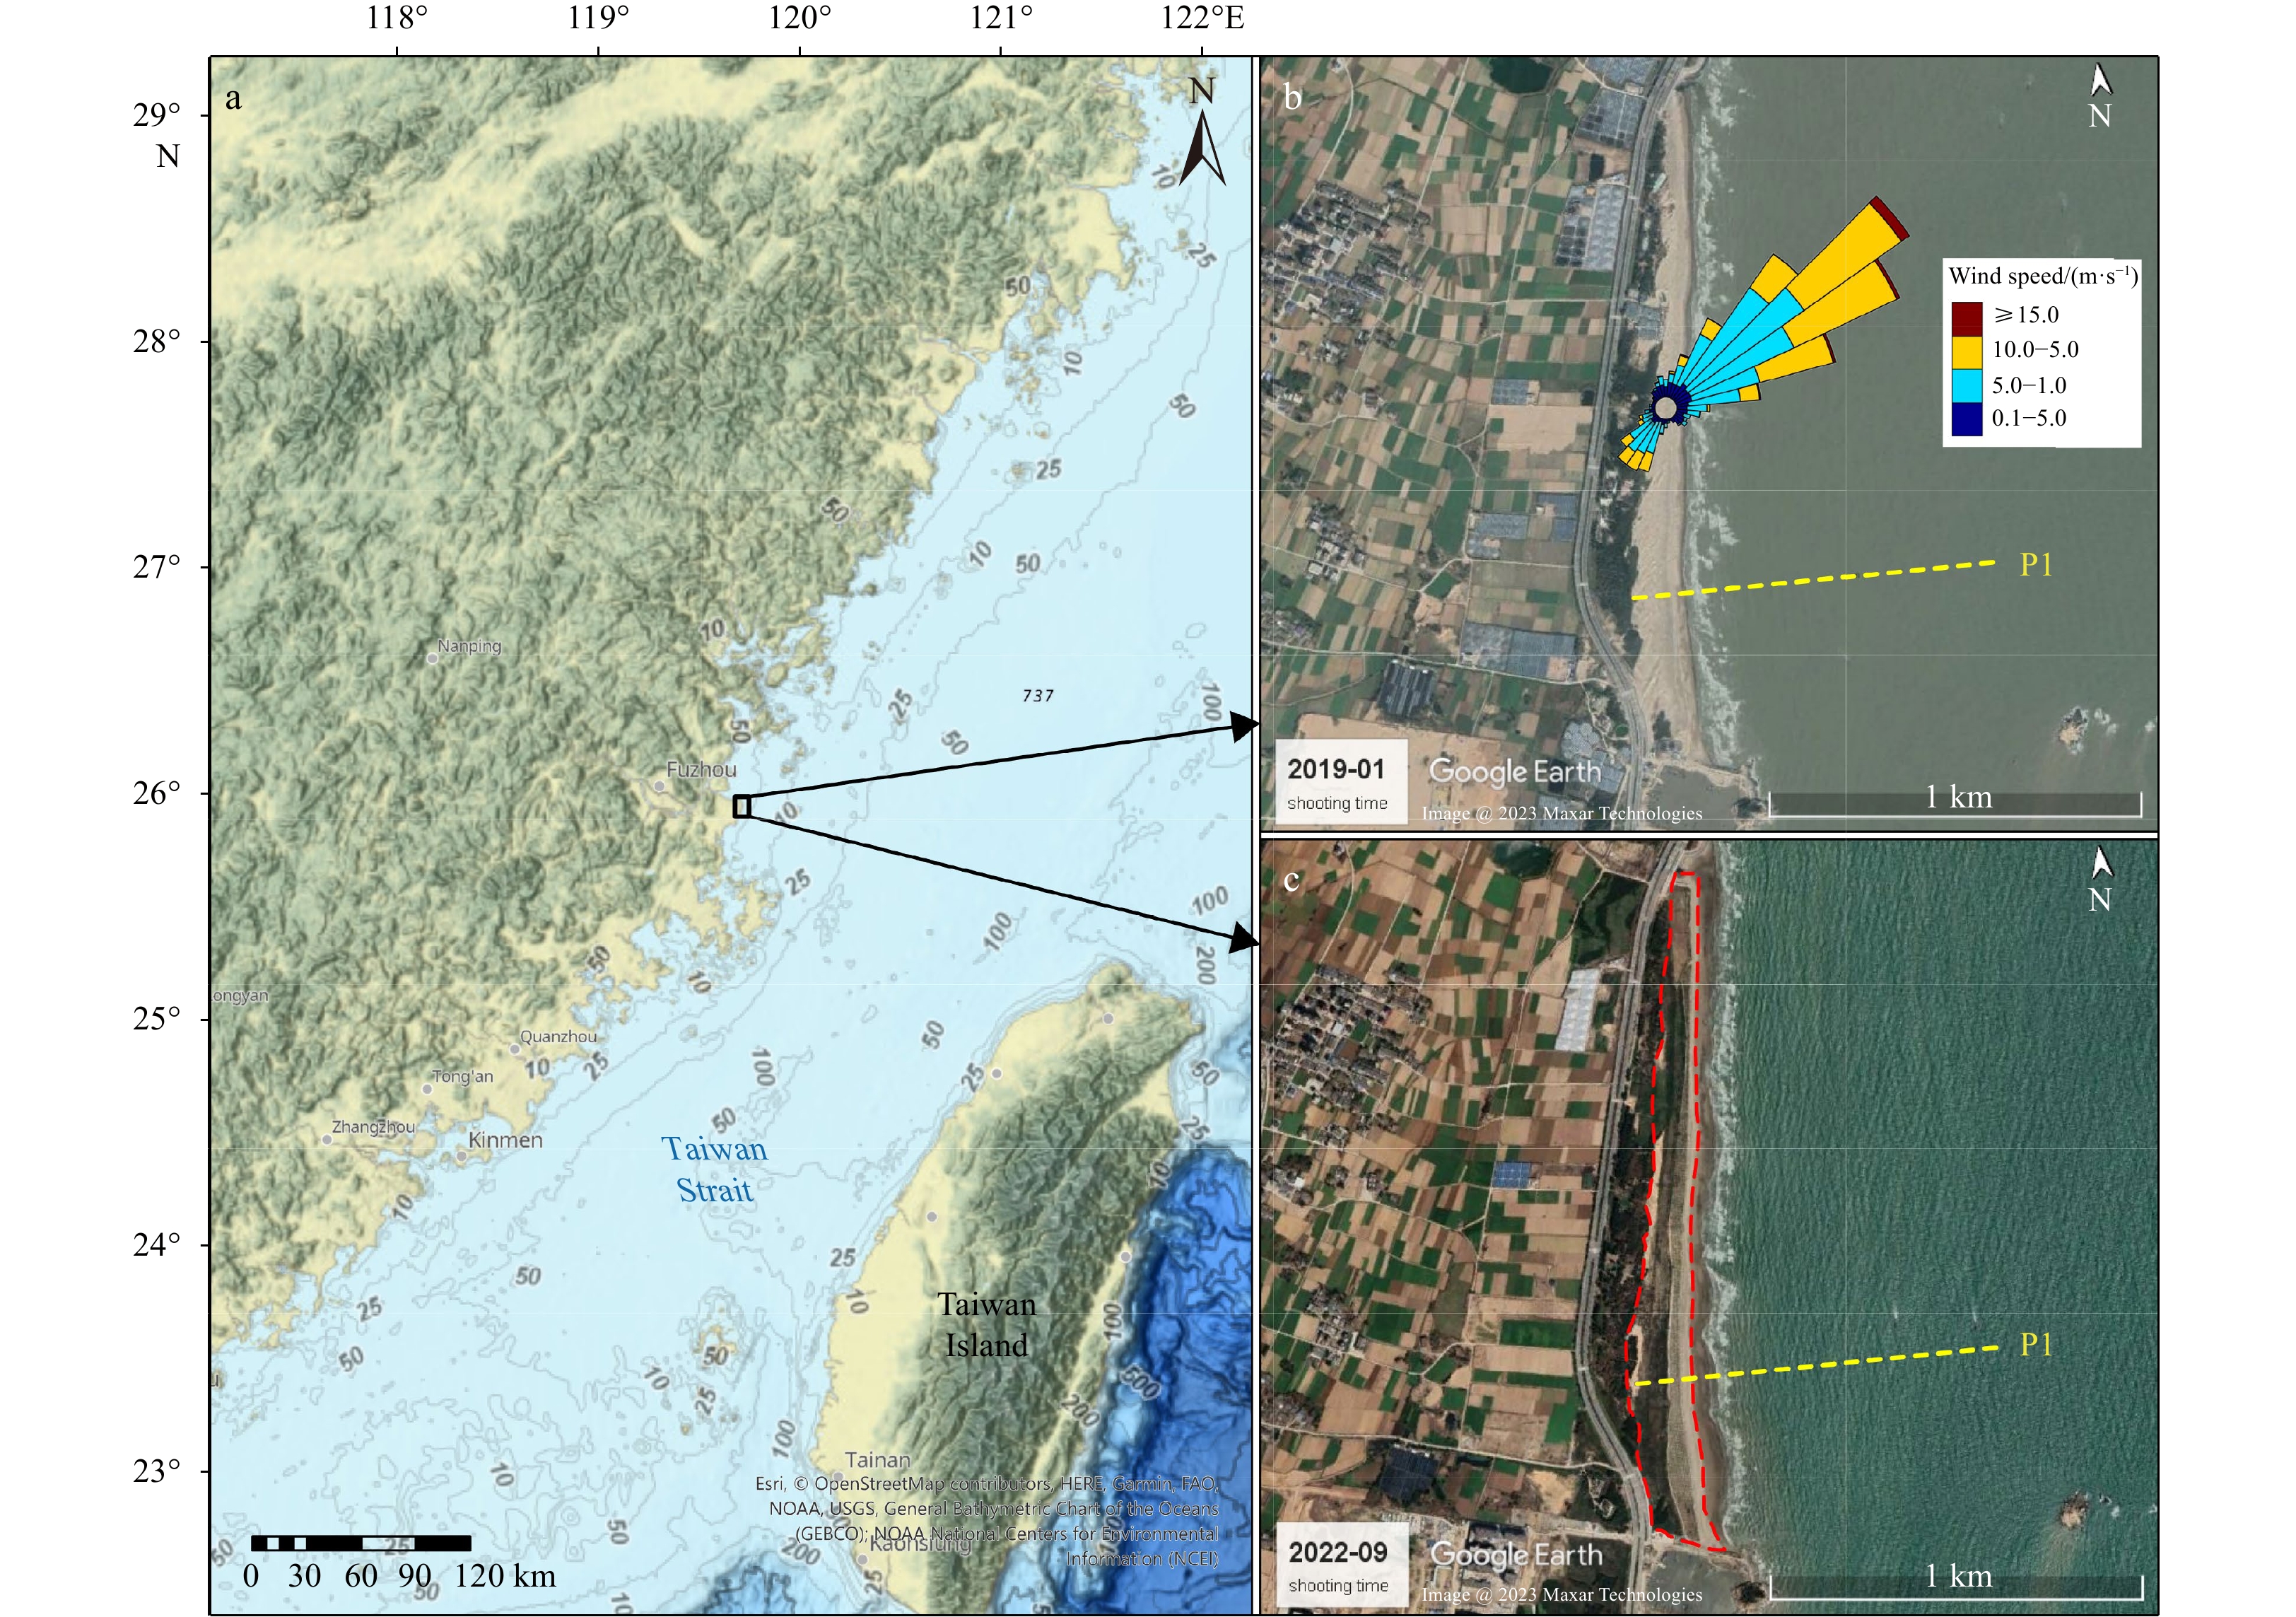
The study area is located on the northeastern coast of Changle, Fujian Province (Fig. 1a), where the wind is strong due to the monsoon climate and “narrow valley effect” of the Taiwan Strait. The strait is narrow in the north and wide in the south, with an average width of 180 km and an average depth of 60 m. Most of the mountains on both sides of the strait are over 1 500 m above sea level, forming the pronounced “narrow valley” topography of the Taiwan Strait (Pan and Lin, 2019). Dominated by the East Asian monsoon climate system, the strong, northeast monsoon prevails from October to April of the following year and the coastal aeolian activity is intense, while the weak, southwest monsoon is dominant from June to August (Fujian Provincial Meteorological Bureau, 1981a; Kuang et al., 2015; Hong et al., 2017). Throughout the year, the NE wind prevails, with an average wind speed of up to 8 m/s and an average of up to 45 days of strong winds per year (Fig. 1b). It is an ideal, experimental area for coastal aeolian research in windy areas in China. The region is a subtropical ocean monsoon with an average annual precipitation of 1 382.3 mm from March to September and a dry season from October to February of the next year (Fujian Provincial Meteorological Bureau, 1981b; Zhang and Li, 1995). In addition, the coastal terrain is flat, and the tidal range is large, with an average spring tidal range of up to 5.4 m (He et al., 2022). After the tide ebbs, a wide, sandy beach forms.
Figure
1.
Location of the study area (a), the field observation profile before beach nourishment (b) and the profile after nourishment (c). The year-round data of wind rose for the study area in b is sourced from He et al. (2022); the red dashed box in c represents the nourished beach.
In July 2021, sand filled this area, constructing a nourished beach with a berm width of approximately 50 m and an elevation range from 4.2 m to 5.2 m (Third Institute of Oceanography, Ministry of Natural Resources, 2020). After nourishment, the beach profile was adjusted adaptively under the combined actions of coastal wind and water, leading to corresponding changes in the NBH and NBS.
3.
Methods
3.1
Synchronous observation of cross-shore wind speed
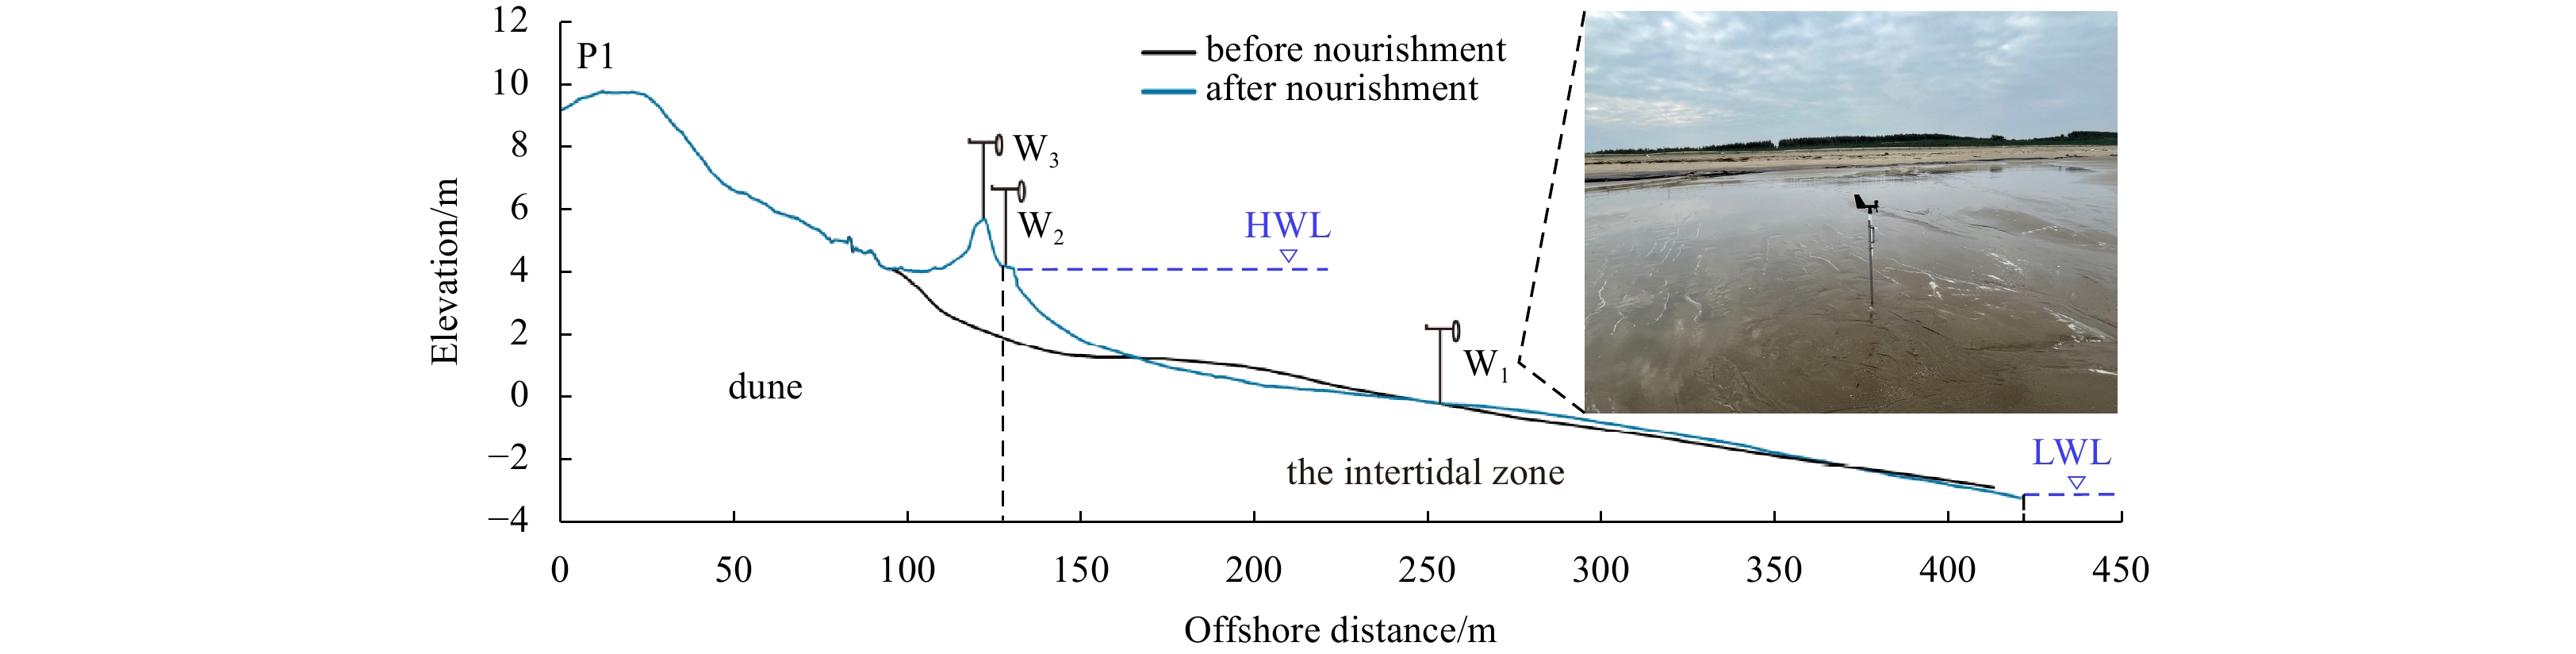
Strong northeasterly winds and strong waves in the winter resulted in severe erosion of the beach berm in the northern and central sections of the nourished beach, while the berm formed and widened due to aeolian sand accumulation in the southern section. Considering that the topography of the south section is more intact than that of the other parts, profile 1 (P1) with approximately the berm height of 4.18 m and the nourished slope of 1:10 was selected to observe the cross-shore wind speed change (Fig. 1c). The wind speeds at the tidal flat, foredune toe, and foredune crest were observed by three portable anemometers (RainWise Windlog) at a sampling rate of per min, represented as W1, W2 and W3, respectively (Fig. 2). The anemometers were installed at a height of 1 m above the ground, and the observation period was from 14:20 to 19:37 on April 16, 2022, according to the exposure period in the intertidal zone. A handheld RTK (STONEX S9Ⅱ GPS-RTK) was used with horizontal and elevation errors of ±0.5 cm and ±2 cm, respectively. A survey was conducted along transect P1 from the lee slope of the foredune to the low tide waterline.
Figure
2.
Geomorphology of P1 before and after nourishment and location of anemometers on P1 in nourished beach. The photo is the W1 anemometer. HWL: high water level; LWL: low water level.
The Duna model is an open-source model that simulates the process of aeolian sand transport and landform evolution, incorporating several components, such as the wind model based on Kroy et al. (2002), the sediment transport model based on Bagnold (1936) and Sauermann et al. (2001), and the vegetation growth model based on Durán and Herrmann (2006). Duna also considers limiting factors for sediment transport, such as grain size, vegetation, slope and moisture. To simulate wind field for different nourishment scenarios, the effect of topography on the wind field in the model is described as follows:
where $\dfrac{\tau \left(x\right)}{{\tau }_{0}}$ is the beach surface shear stress, $ {\tau }_{0} $ represents the average surface shear stress (far away from any obstacle), $ {{x}} $ is the onshore distance of the profile, $ {{z_b}} $ is the elevation of the section, $ \xi $ is described the ratio of $ {{x}} $ to the characteristic length of the foredune, and $ \alpha $ and $ \beta $ are the wind speed calibration parameters related to the geomorphology. The larger the values of $ \alpha $ and $ \beta $ are the greater the variation range of surface shear stress increases with topographic fluctuation changes (Kroy et al., 2002). The effect of wind direction on wind speed is calculated as
where $ {u}_{x} $ is the horizontal component of the wind speed, that is, wind parallel to the dune, $ {v}_{x} $ is the vertical component of the wind speed, that is, wind perpendicular to the dune, ${u}_{{\rm{w}}}$ is the actual simulated wind speed, $ {u}_{\infty } $ is the incident wind speed, and ${\varphi }_{{\rm{wind}}}$ is the angle of the wind relative to the beach normal.
3.2.2
Model calibration
The three portable anemometers ran synchronously for a total of 318 min. The same wind speed and wind direction recorded by the W1 anemometer in the mid-intertidal zone were merged into one wind event, and 61 wind events were determined after amalgamation (Table 1).
To calibrate the model, the W1 wind speed and orientation with respect to the beach normal are used as the incoming wind speed (u0) and the incidence angle (φ0), respectively. The topographic profile (x0, zb0) of P1 is used as the topography setting in the model. The wind speeds observed at the foredune toe (W2) and the foredune crest (W3) are taken as the model validation data.
3.2.3
Simulation scheme
The average wind speed recorded by the W1 anemometer is approximately 8 m/s during the exposure period in the mid-intertidal zone, which is consistent with the local annual average wind speed (Fujian Provincial Meteorological Bureau, 1981a). In this paper, several incident wind regimes (Table 2) were used for scenario simulation.
Table
2.
Incident wind regimes at the model boundary
Previous studies have shown that the variation in wind speed at the edge of the nourished beach berm is affected by two main factors, namely, NBH and NBS (Nordstrom et al., 2006; Pupienis et al., 2014; Liu et al., 2016; Kaczkowski et al., 2018; Hojan et al., 2019). This paper refers to the profile shapes of beach nourishment on the west coast of the Taiwan Strait (Lei et al., 2013; Liu et al., 2016; Third Institute of Oceanography, Ministry of Natural Resources, 2020), combined with the practical experience of predecessors who studied beach nourishment (US Army Corps of Engineer, 2002; Dean, 2003; Cai, 2015), and the position of the nourished berm edge remains unchanged. The shape of the beach berm can be reasonably generalized from the NBH and NBS (Table 3). Here, NBH is defined as the elevation of the edge of the nourished beach berm relative to the mean sea level (MSL), and NBS is defined as the ratio of the elevation difference between the nourished berm edge and the slope break to the horizontal distance between them. In the case of the NBH design, the corresponding NBS adopts the common value of a similar beach nourishment project, that is, 1:10. The elevation value at the mean high water level of spring tide (MHWS) in the study area is 3.28 m. In the case of slope variation and extreme hydrodynamics, the design value of the NBH is usually 1–2 m higher than that of the MHWS, which is set at 4.28 m in the model. The boundary conditions and ideal beach profile information are input into the Duna model to simulate the variation in cross-shore wind speed caused by different shapes of nourished beach profiles.
Table
3.
Experimental schemes of beach nourishment
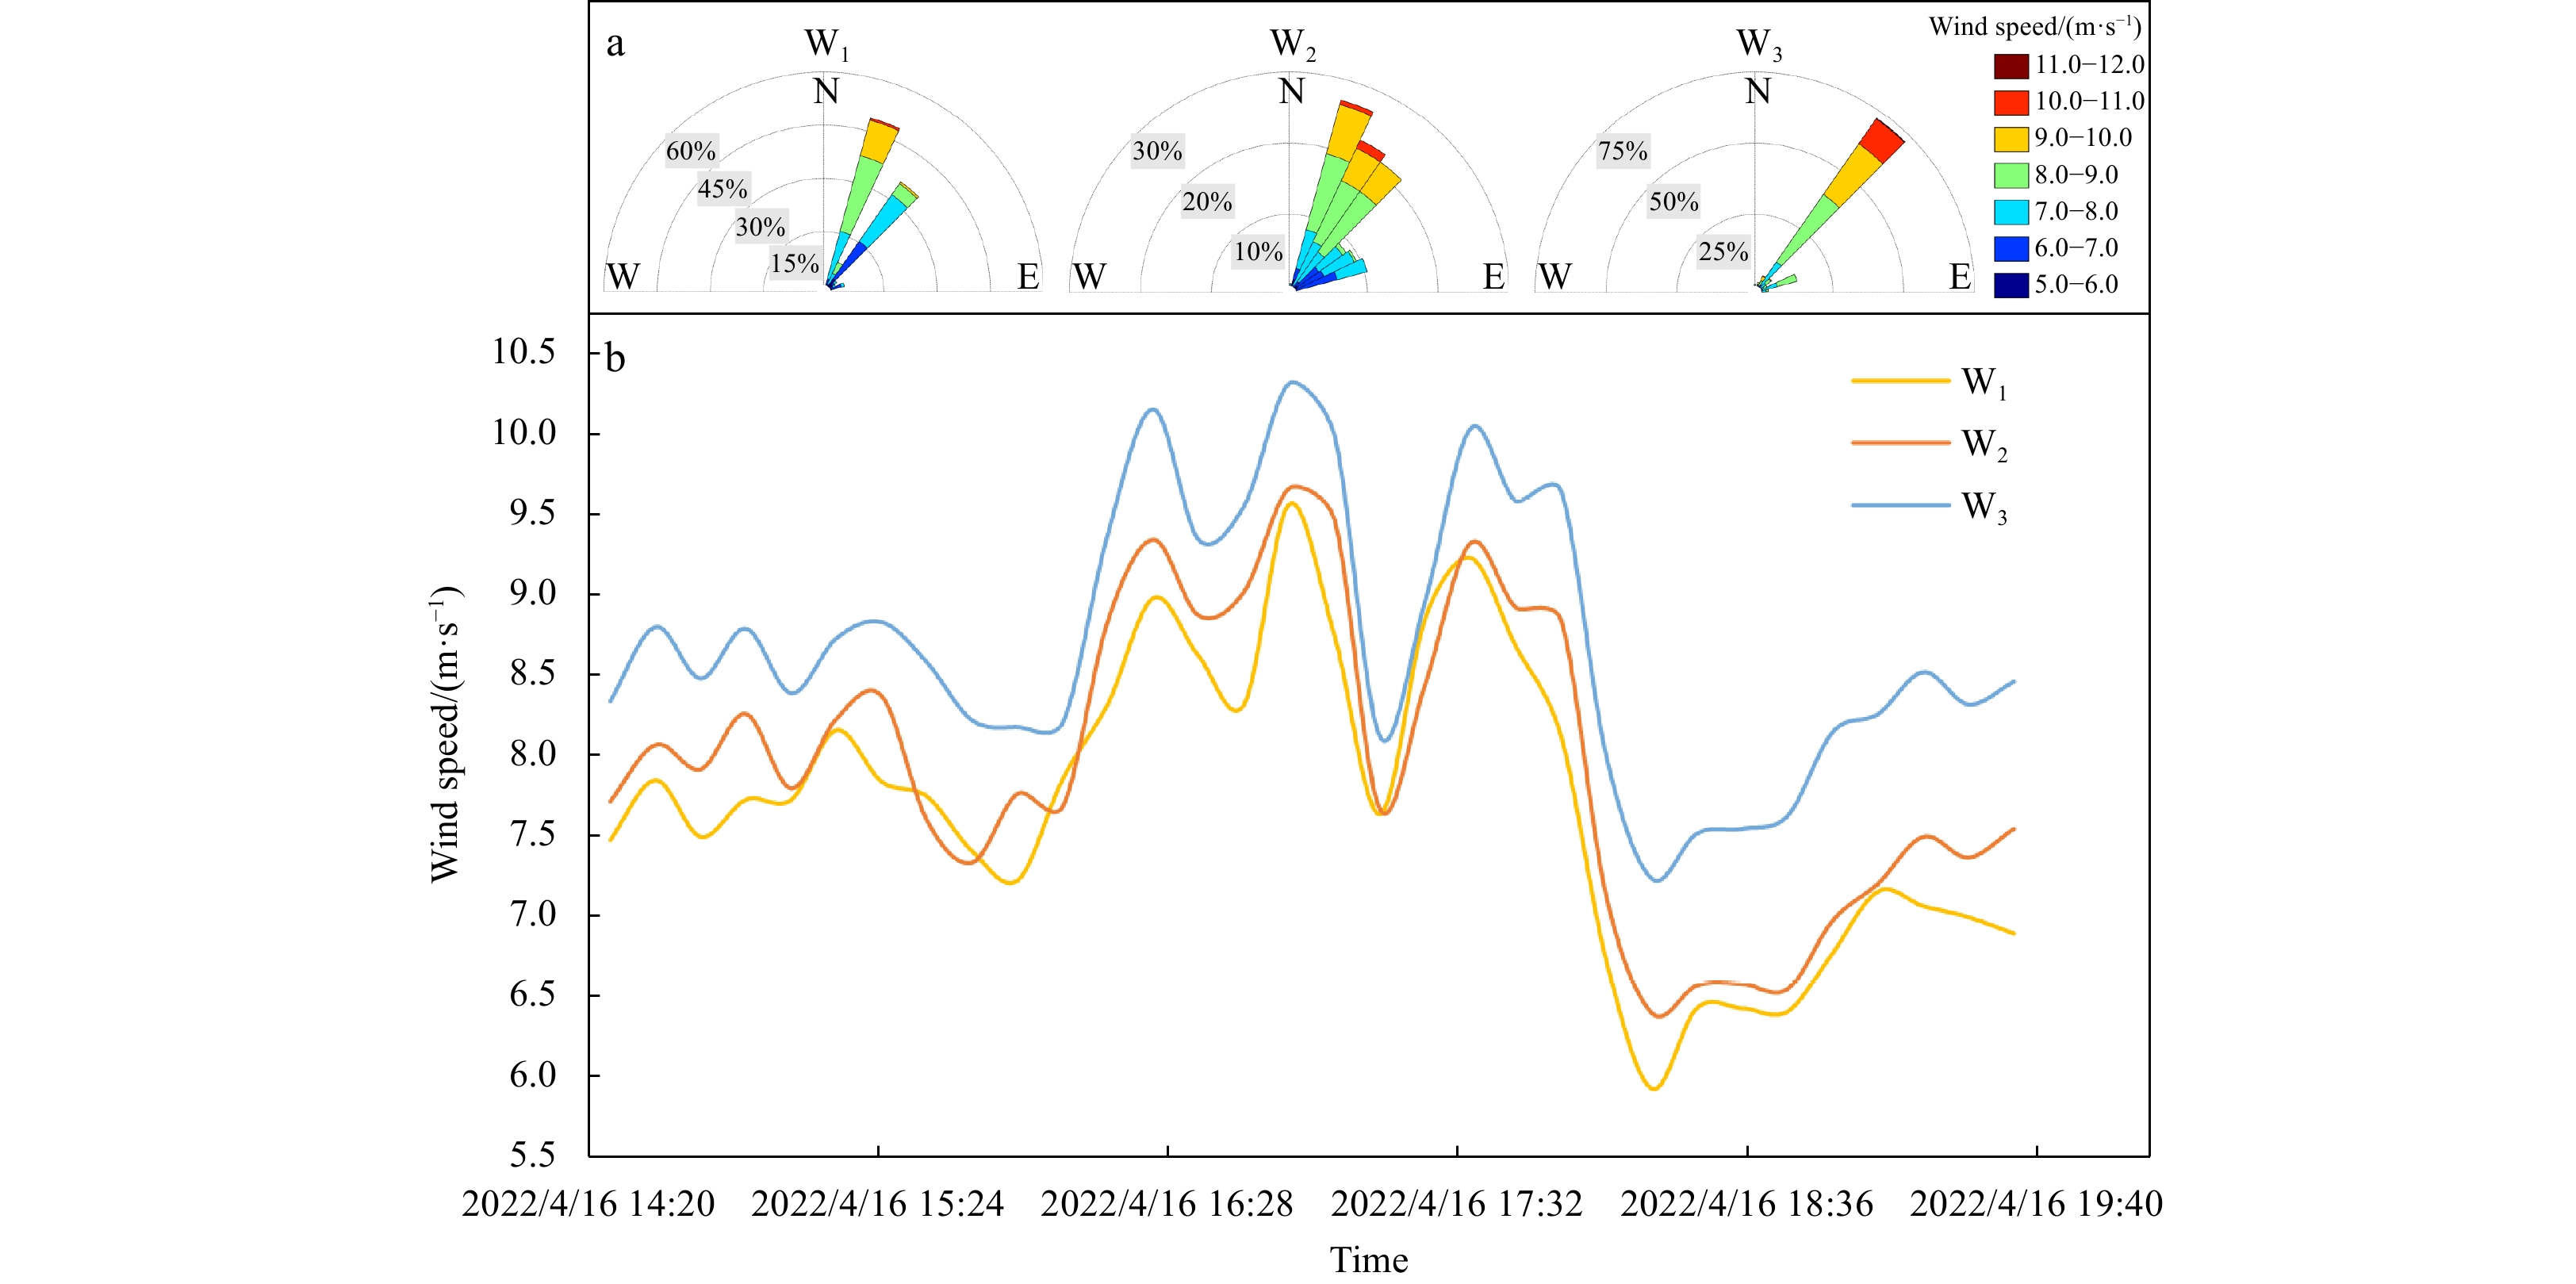
During the observation period, the wind speed range in the study area is approximately 5–12 m/s, with the prevailing wind direction being NE (Fig. 3a). To quantify the wind speed at the sites, the average wind speeds recorded by the three portable anemometers during this period are 7.71 m/s, 7.97 m/s and 8.70 m/s from the intertidal zone to the foredune crest. The general trend in the data are that the wind speed recorded by the W3 anemometer at the foredune crest is the highest, the wind speed recorded by the W2 anemometer at the foredune toe is in the middle, and the wind speed recorded by the W1 anemometer in the mid-intertidal zone is the lowest (Fig. 3b).
Figure
3.
The wind roses of the three geomorphic feature sites (a) and observed value of cross-shore wind speeds along the beach profile (average wind speed per 10 min) (b).
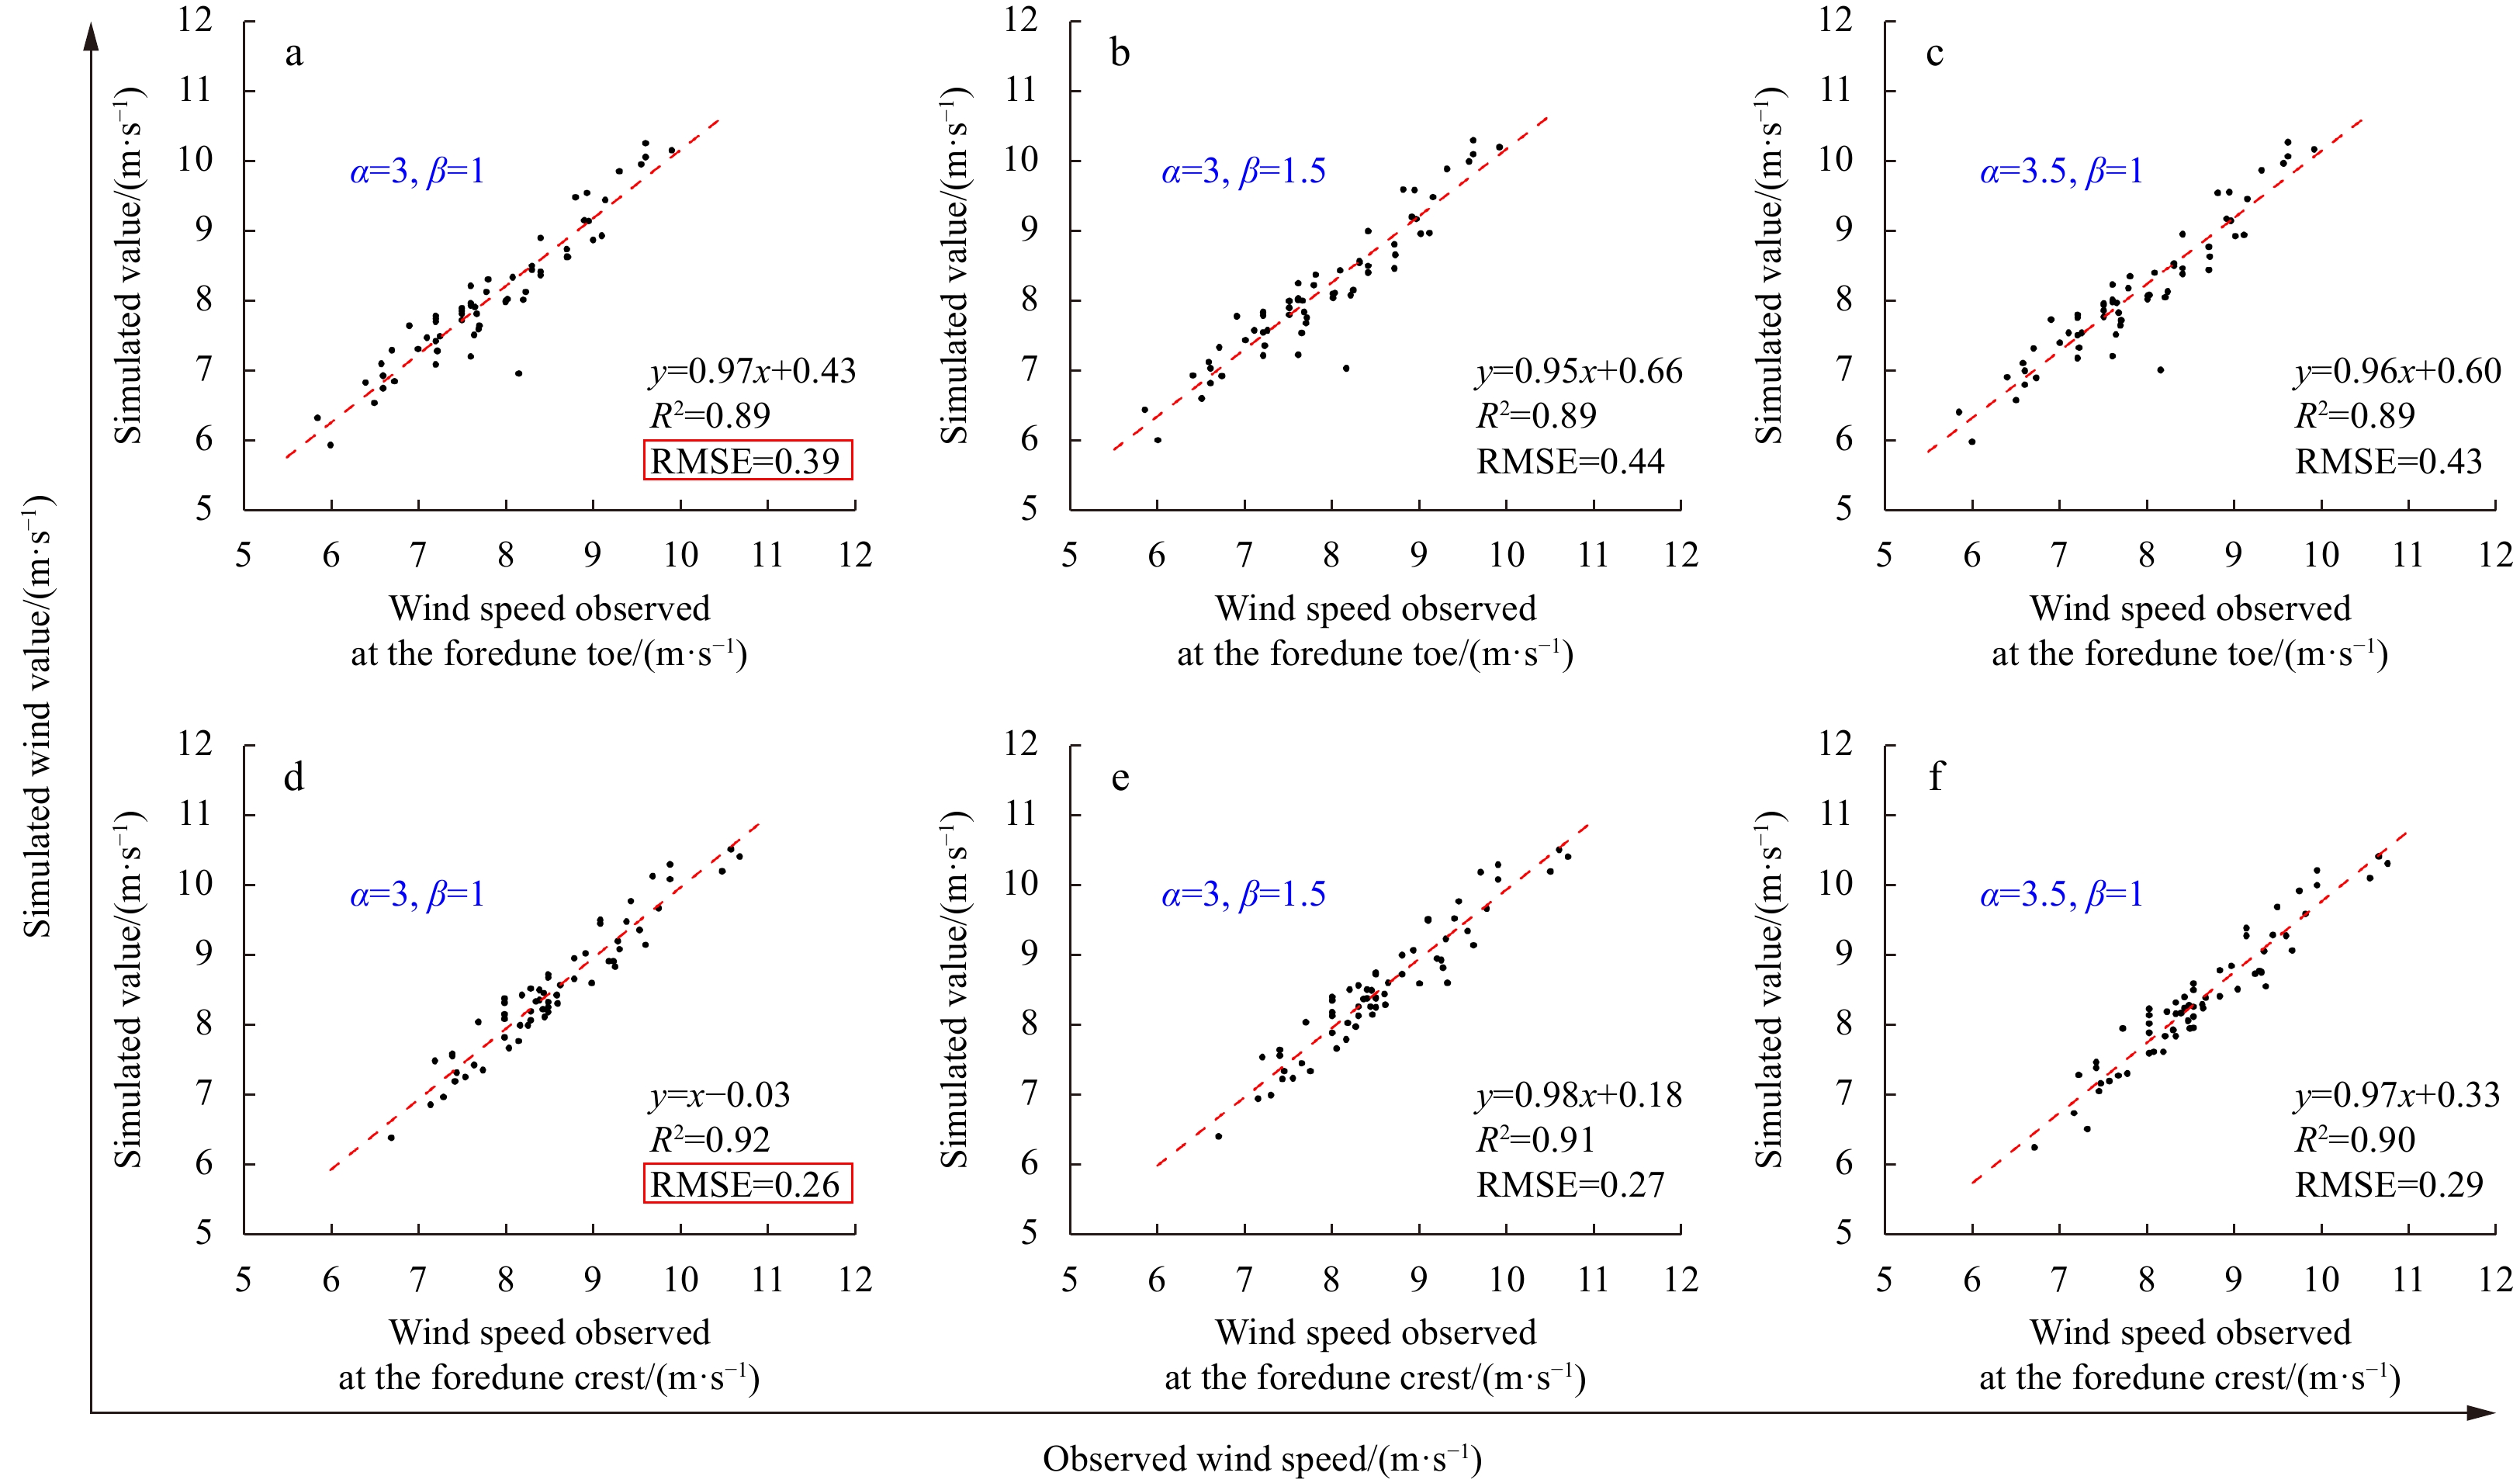
With the incident wind and topography settings mentioned in Section 3.2.2, wind speeds at W2 and W3 for the 61 wind events were simulated with different combinations of α and β parameters. In this paper, the coefficient of determination (R2) and root mean square error (RMSE) are used to express the difference between the simulated wind speed and the observed wind speed. The results show that compared with other parameter combinations, when α is 3 and β is 1, the simulated wind speed of the foredune toe agrees with the observed value, the fitting R2 is 0.89, and the RMSE is the lowest, namely, 0.39 m/s. The observed and simulated wind speeds at the dune crest are basically consistent, with R2 values as high as 0.92 and RMSE values as low as 0.26 m/s (Fig. 4). Overall, when α is 3 and β is 1, the simulated results are highly consistent with the observed results, ensuring the applicability of this model to our study site.
Figure
4.
Comparison of observed and simulated wind speeds at the foredune toe (a–c) and foredune crest (d–f) under different parameter combinations of α and β.
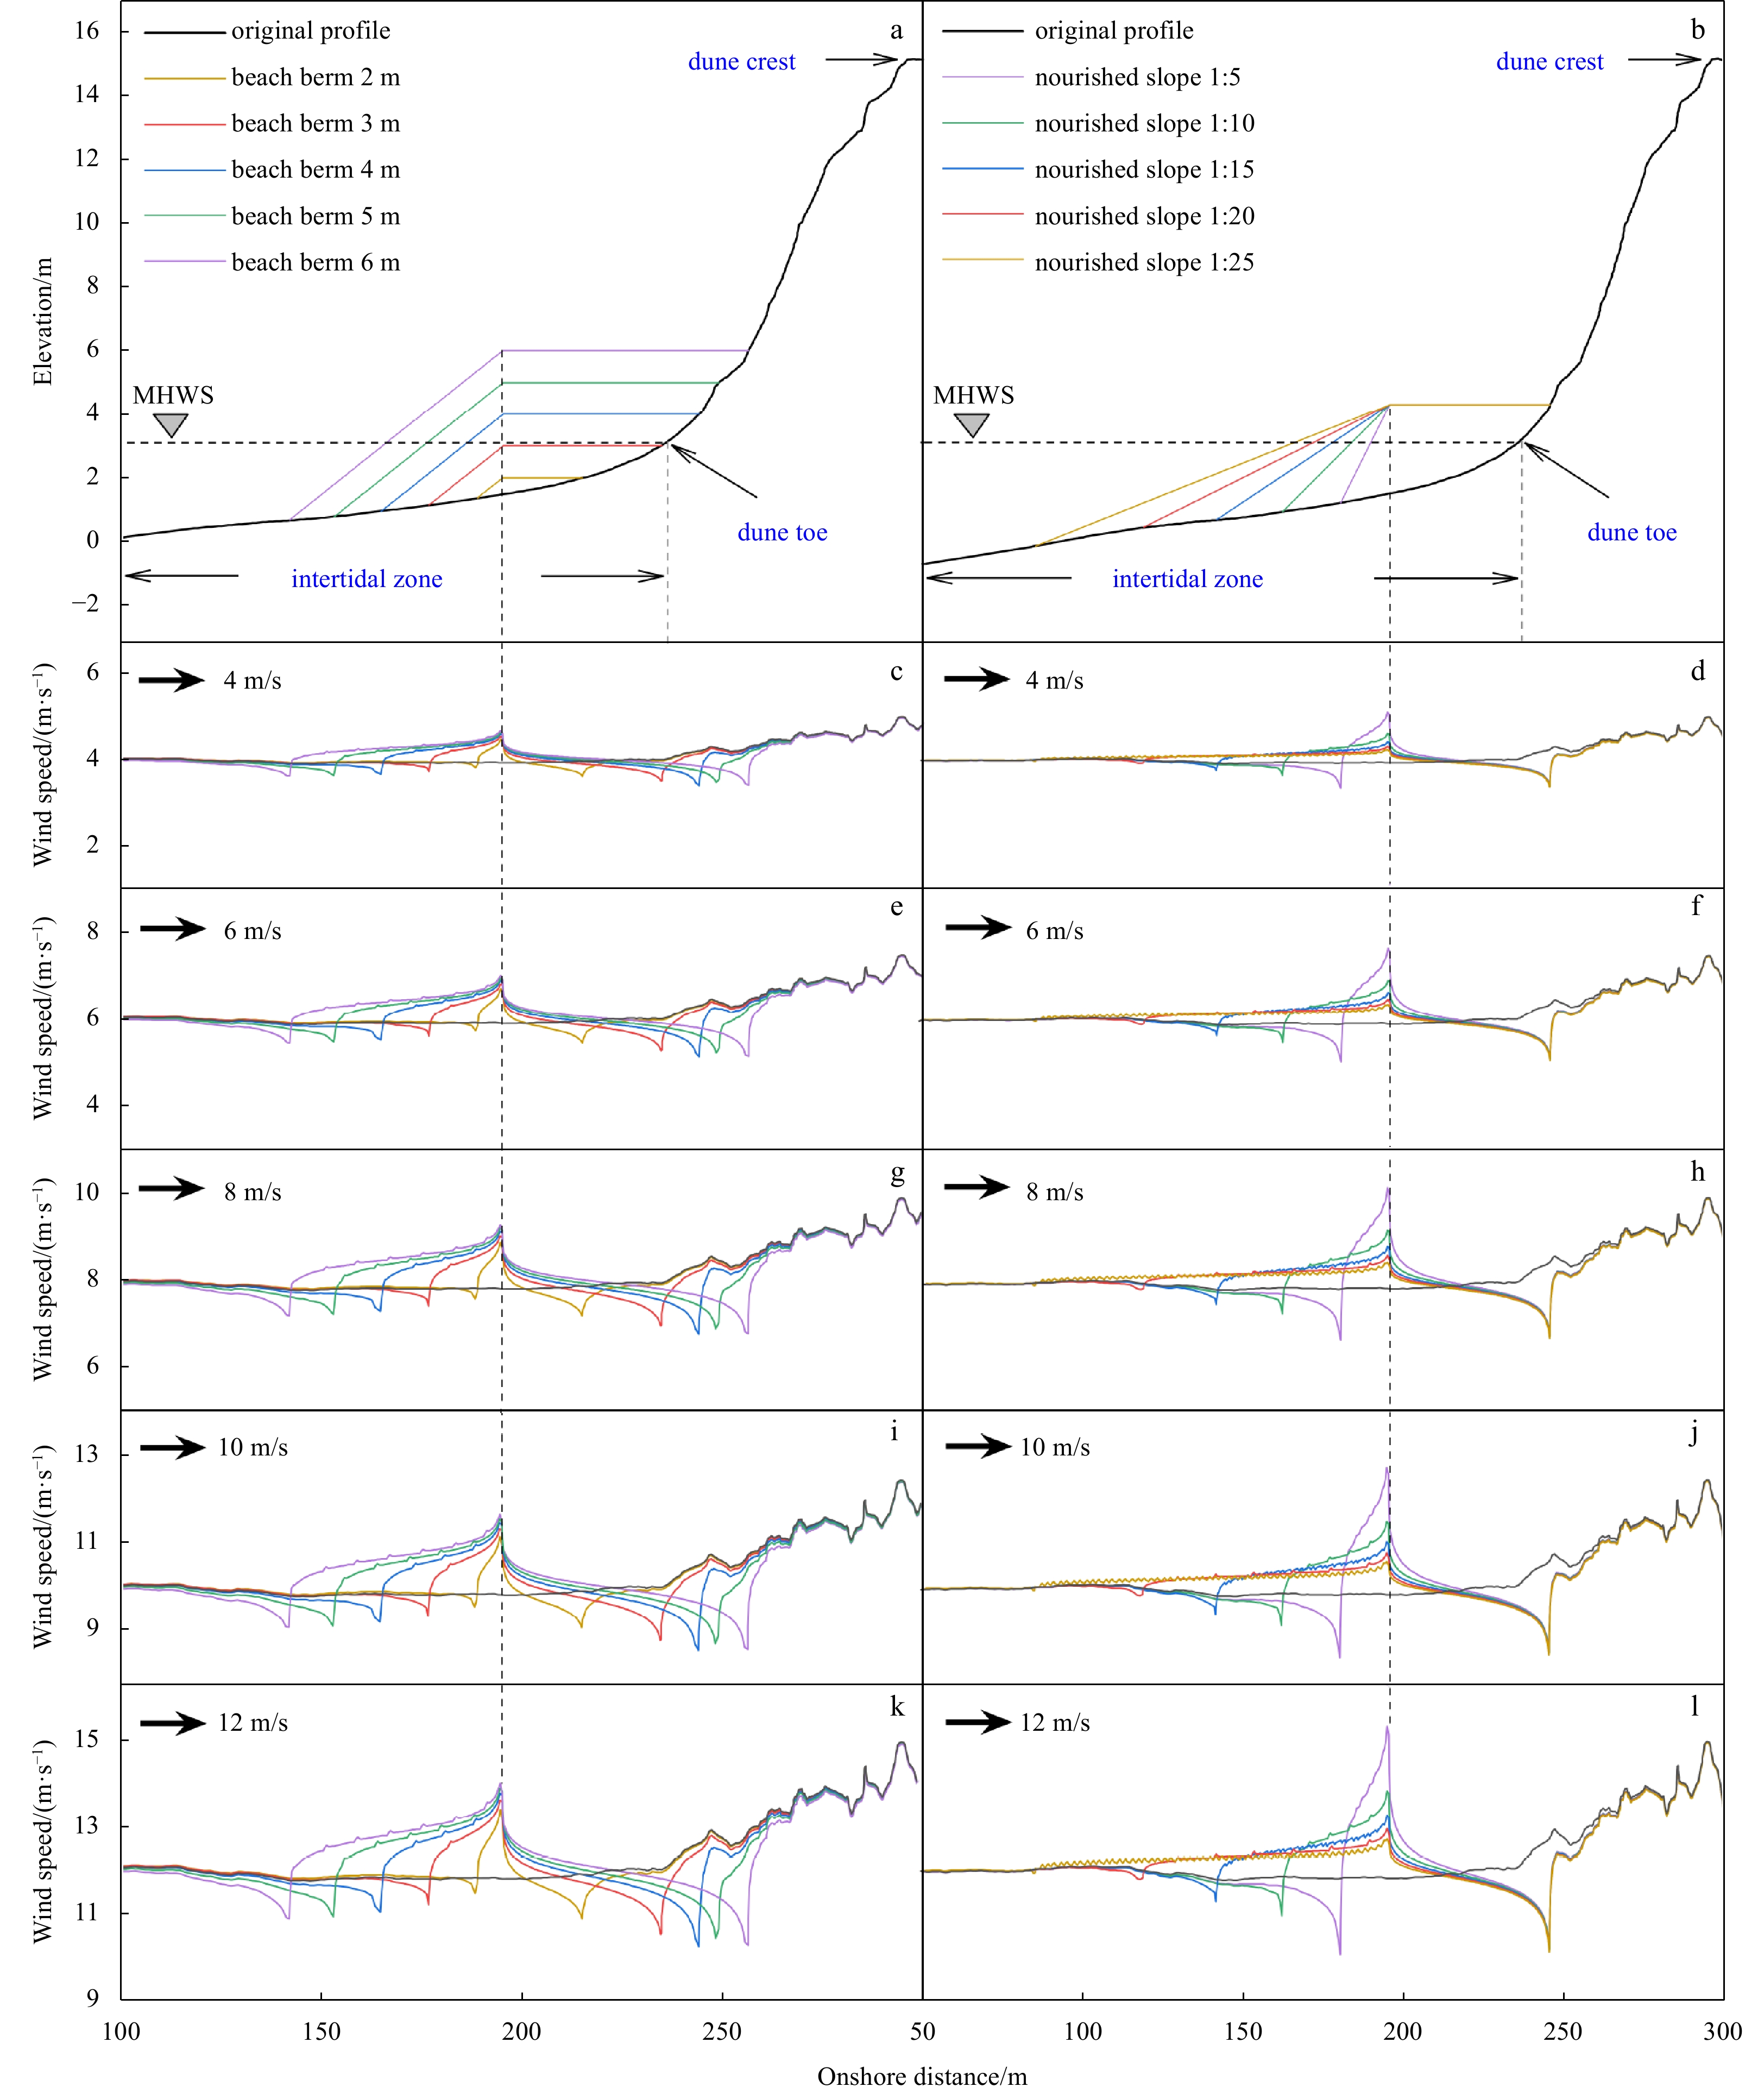
A total of 215 cases were simulated using the calibrated model. To better show the variation in the cross-shore wind speed, only 55 representative cases were selected in Fig. 5. There are three types: (1) when NBH is 2 m, 3 m, 4 m, 5 m and 6 m, respectively, and the other conditions remain unchanged, the variation in cross-shore wind speed on the nourished beach surface corresponds to the different incidence wind speeds (4 m/s, 6 m/s, 8 m/s, 10 m/s, 12 m/s) that are perpendicular to the shoreline (25 cases); (2) when NBS is 1:5, 1:10, 1:15, 1:20 and 1:25, and the other conditions remain unchanged, the variation in cross-shore wind speed corresponds to the different shoreline-normal incidence wind speeds (4 m/s, 6 m/s, 8 m/s, 10 m/s, 12 m/s), namely, 25 cases, and (3) the variation in cross-shore wind speed on the natural beach surface corresponds to the different shoreline-normal incidence wind speeds (4 m/s, 6 m/s, 8 m/s, 10 m/s, and 12 m/s), namely, 5 cases.
Figure
5.
The shapes of different nourished beach profiles are designed when nourished berm height changes (a) or nourished beach slope changes (b) and other conditions remain unchanged; the distribution of cross-shore wind speed with shoreline-normal incidence wind speed of 4 m/s (c), 6 m/s (e), 8 m/s (g), 10 m/s (i) and 12 m/s (k) corresponding to the shapes of different nourished beach profiles in a; the distribution of cross-shore wind speed with shoreline-normal incidence wind speed of 4 m/s (d), 6 m/s (f), 8 m/s (h), 10 m/s (j) and 12 m/s (l) corresponding to the shapes of different nourished beach profiles in b. MHWS: mean high water level of spring tide.
The simulation results show that the cross-shore wind speed is almost unchanged from the mid-intertidal zone to the dune toe before beach nourishment. As there are many abrupt terrains from the dune toe to the dune crest, and the cross-shore wind speed on the dune changes violently, but with a general increase trend. The wind speed at the three geomorphic feature sites (the dune crest, the dune toe, and the mid-intertidal zone) shows significant differences, with the maximum wind speed at the dune crest, followed by the dune toe, and the minimum wind speed in the mid-intertidal zone (Figs 5c- l). After beach nourishment, the wind speed at the nourished berm increased rapidly, while the wind speed at the break point decreased sharply (Figs 5c-l).
When NBH changes, other conditions remain unchanged and the shoreline-normal incidence wind speed is constant; higher beach berm can lead to greater wind reduction at the slope break, greater wind increase at the berm edge. When NBH is constant, larger wind speed can cause more sudden decrease in wind speed at the slope break, and more obvious wind speed increase at the berm edge (Figs 5c, e, g, i, k).
When NBS changes, other conditions remain unchanged and the shoreline-normal incidence wind speed is constant; the steeper the NBS is, the greater the wind speed reduction is at the slope break, and the greater the wind speed increase is at the berm edge. When NBS is constant, larger wind speed can result in greater the wind speed at the berm edge, but smaller wind speed at the slope break (Figs 5d, f, h, j, l). Compared with NBH, the wind speed at the berm edge is more affected by NBS.
5.
Discussion
The evolution of beach morphology is a complex process, which is constantly influenced by various driving forces such as tide, waves and wind. Moreover, through the coupling effect of various coastal forces, its evolution process is really difficult to predict, and it has also attracted a large number of coastal researchers and engineers to carry out a lot of exploratory research (Bauer et al., 2009; Qi et al., 2010; Liu et al., 2011, 2017; Walker et al., 2017; Bauer and Wakes, 2022). On the other hand, beach morphology also acts on various coastal forces. The underwater topography significantly affects the wave and flow field, and the topography of the dry beach surface has an important influence on the wind regime directly (Walker et al., 2017). Therefore, this study mainly focuses on the cross-shore wind speeds response to different nourished beach morphologies. Based on the result of the rapid change in wind speed at the nourished berm edge, the key elements of beach topography such as NBH and NBS, and their relationship with wind speed variation at the berm edge will be explored.
5.1
Variation characteristics of wind speed influenced by different factors
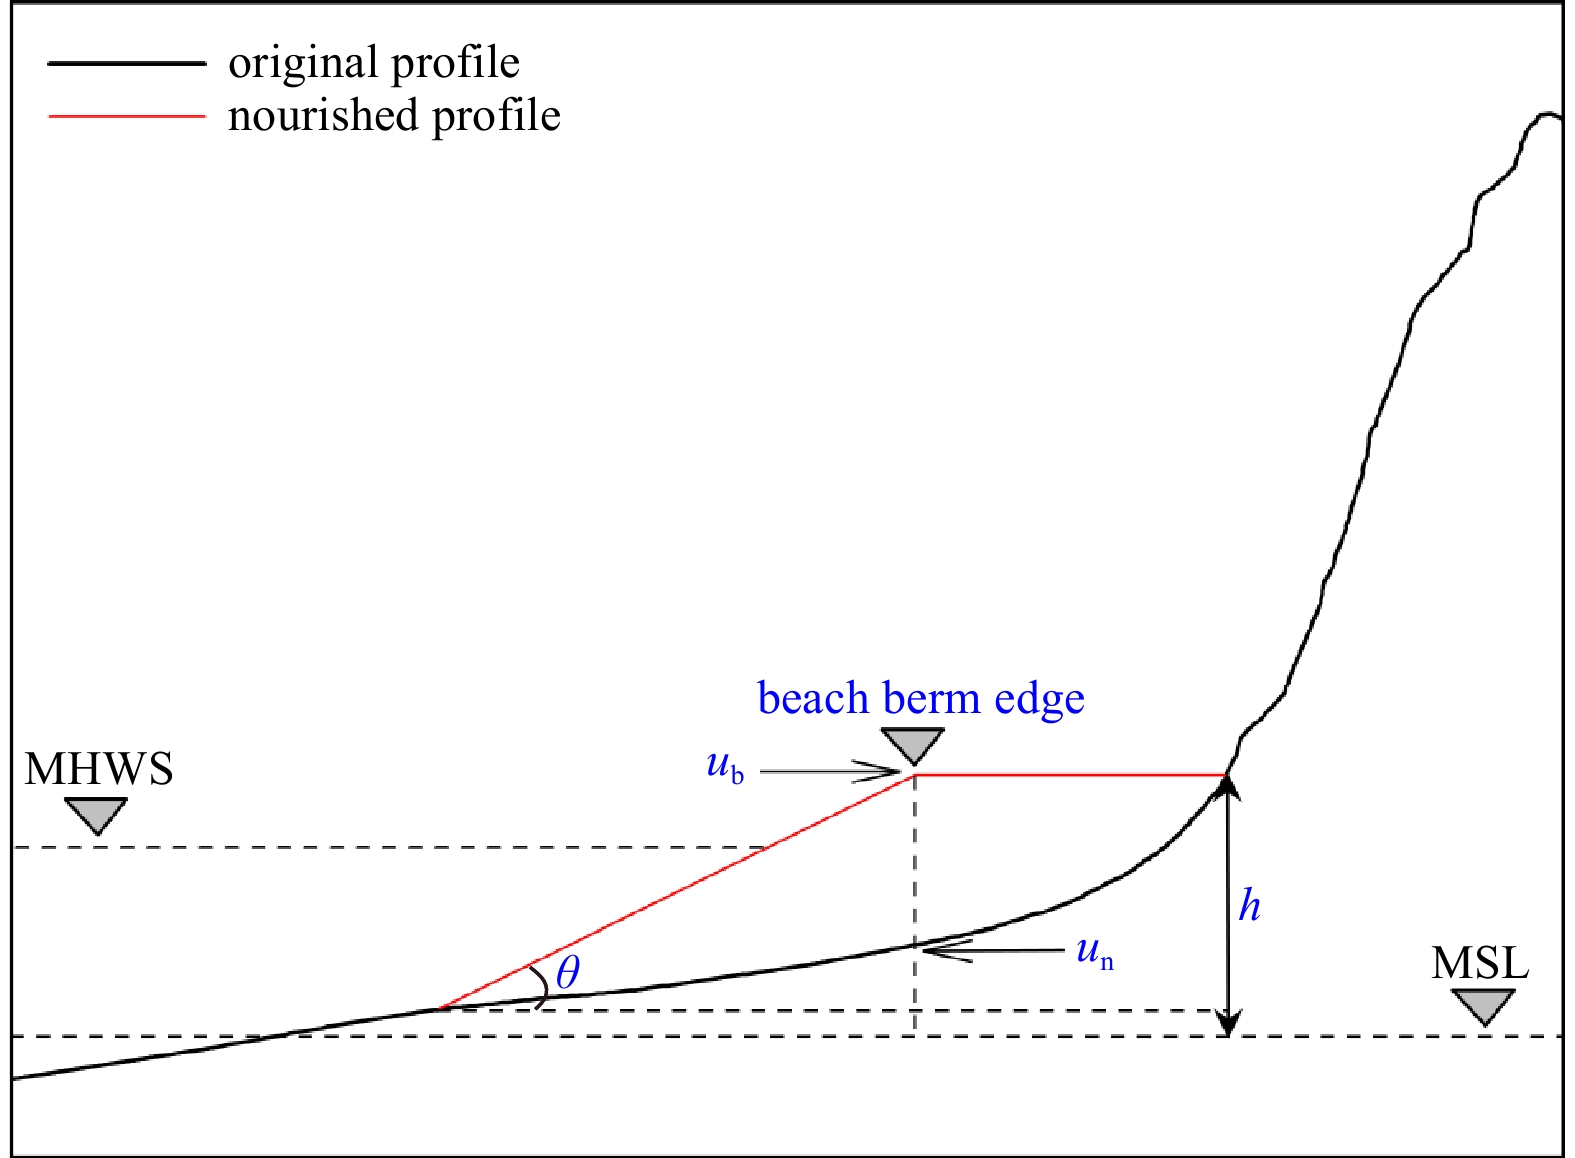
The wind speed at the nourished berm edge and the wind speed at the same horizontal position before beach nourishment are used as the calculation parameters to quantify the effect of beach nourishment on the cross-shore wind speed in this paper, and the wind speed amplification index of beach nourishment is defined below:
where $ {S}_{{\rm{a}}} $ is the wind speed amplification rate at the nourished berm edge, $ {u}_{{\rm{b}}} $ is the wind speed there, and $ {u}_{{\rm{n}}} $ is the wind speed corresponding to the same horizontal position before beach nourishment (Fig. 6).
Figure
6.
Schematic profile after beach nourishment and the wind speed parameters related to the geomorphology. h stands for the elevation at the nourished berm edge relative to mean sea level (MSL), and θ represents the angle of the nourished beachface. MHWS: mean high water level of spring tide.
5.1.1
Direct effect of NBH on near-surface wind speed
In beach nourishment, the beach berm height is usually designed according to local hydrodynamic conditions (such as tides and waves under normal meteorological conditions) or local coastal infrastructure. However, under windy conditions, due to the change in coastal cross-shore topography, NBH directly affects the response of the beach profile to wind speed, especially the drastic change in the foreshore wind speed.
The variation trend of the wind speed amplification rate with the NBH is shown in Fig. 7. Higher NBH of windy areas produces greater wind power. By keeping the nourished berm position and NBS unchanged within the range of the reasonable design of the NBH (2–6 m), there is generally a positive correlation between the wind speed at the berm edge and the NBH, and the wind speed increases linearly with increasing NBH. This phenomenon is related to the airflow field and the surface shear stress near the nourished berm edge.
Figure
7.
Variation trend of wind speed amplification rate with nourished berm height.
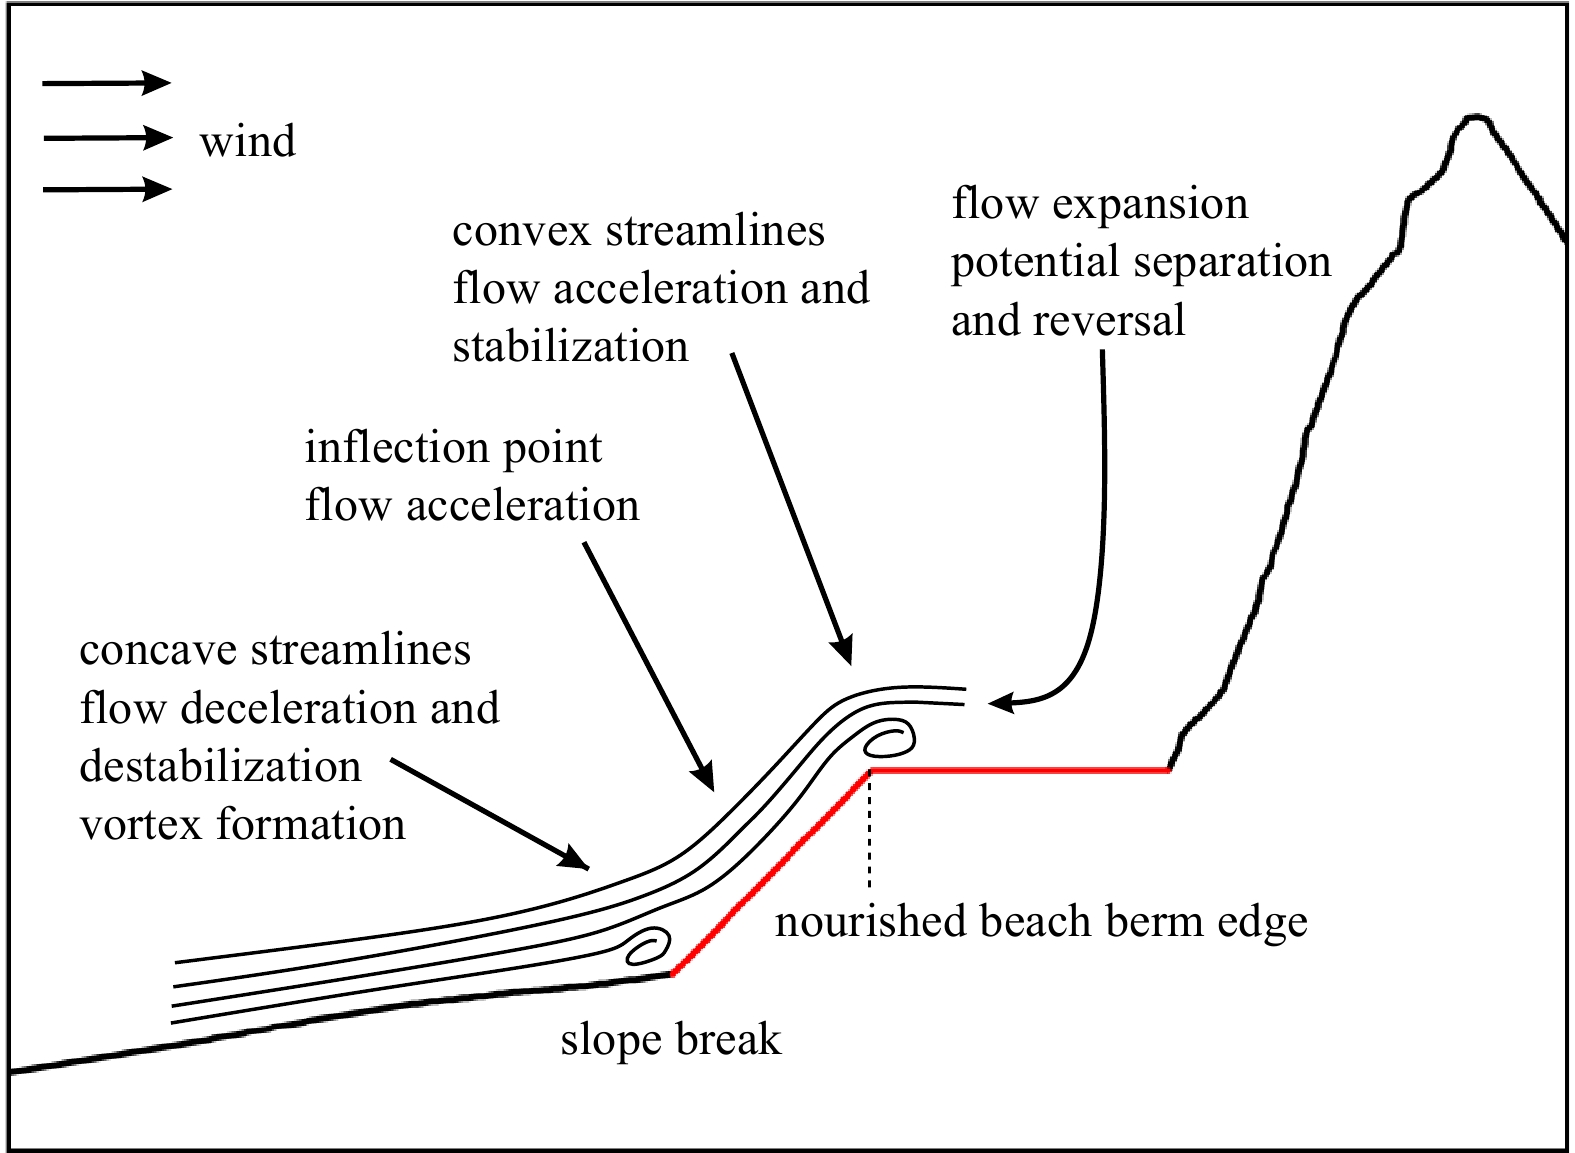
The variation characteristics of the airflow field on the dune surface have been studied extensively by predecessors. When the airflow approaches the dune, the positive pressure gradient decreases, and the airflow stagnates, resulting in a decrease in the shear stress and wind speed near the dune toe. Along the stoss slope, the airflow reaches the dune crest. As streamline compression produces a negative pressure gradient, the airflow accelerates near the dune crest surface, where the surface shear stress increases, as does the wind speed (Taylor and Gent, 1974; Jackson and Hunt, 1975; Mason and Sykes, 1979; Mason and King, 1985; Walmsley and Howard, 1985; Taylor et al., 1987; Wiggs et al., 1996; Neuman et al., 1997; Walker and Nickling, 2002, 2003; Parsons et al., 2004; Baddock et al., 2011; Weaver and Wiggs, 2011; Walker et al., 2017). The variation characteristics of the airflow field near the scarp are similar to those of the dune, but the difference is that when the airflow approaches the bottom of the scarp, the airflow separates and creates a vortex, and the negative pressure gradient at the bottom of the scarp is more obvious than that at the dune toe, which also makes the upward airflow from the bottom of the scarp more obvious (Bowen and Lindley, 1977; Pearson et al., 2013). The topography after beach nourishment is somewhat similar to that of scarps and dunes. The variation in the airflow field is shown in Fig. 8. The aerodynamics show that the distance from the slope break to the dune toe with a higher nourished beach berm (solid red line in Fig. 9b) is longer than that with a lower berm (solid red line in Fig. 9a); thus, the airflow across the former is faster. According to the Bernoulli equation,
Figure
8.
Variation characteristics of the airflow field from the slope break to the nourished berm edge (drawing based on Walker et al. (2017) and Bauer and Wakes (2022)).
where $ p $ is the pressure at a point in the fluid, $ v $ is the velocity of the fluid at that point, $ \rho $ is the density of the fluid, $ g $ is the gravitational acceleration, $ h $ is the height at that point, and $ C $ is a constant (Li et al., 2015). The density of the air flow at a certain point on the beachface can be seen as close to infinitesimal, hence the gravitational potential energy of the air flow within the reasonable variation range of NBH is also close to zero in this study. According to this equation, there is a negative relationship between the velocity of the fluid and pressure. When other conditions remain unchanged, higher nourished berm makes faster airflow, which leads to deceasing local pressure and increasing shear stress. Bauer and Wakes (2022) used a CFD model to study the surface shear stress distribution of beach-dune systems with or without scarps, the results show that the surface shear stress on the top of the 2 m scarp is greater than that on the top of the 1 m scarp, and the surface shear stress at the dune toe is minimal. Similar to Jackson and Hunt (JH)’s results, the JH model shows that for hills or dunes with a gentler slope, the surface shear stress doubles with increasing crest height (Jackson and Hunt, 1975; Walker and Hesp, 2013).
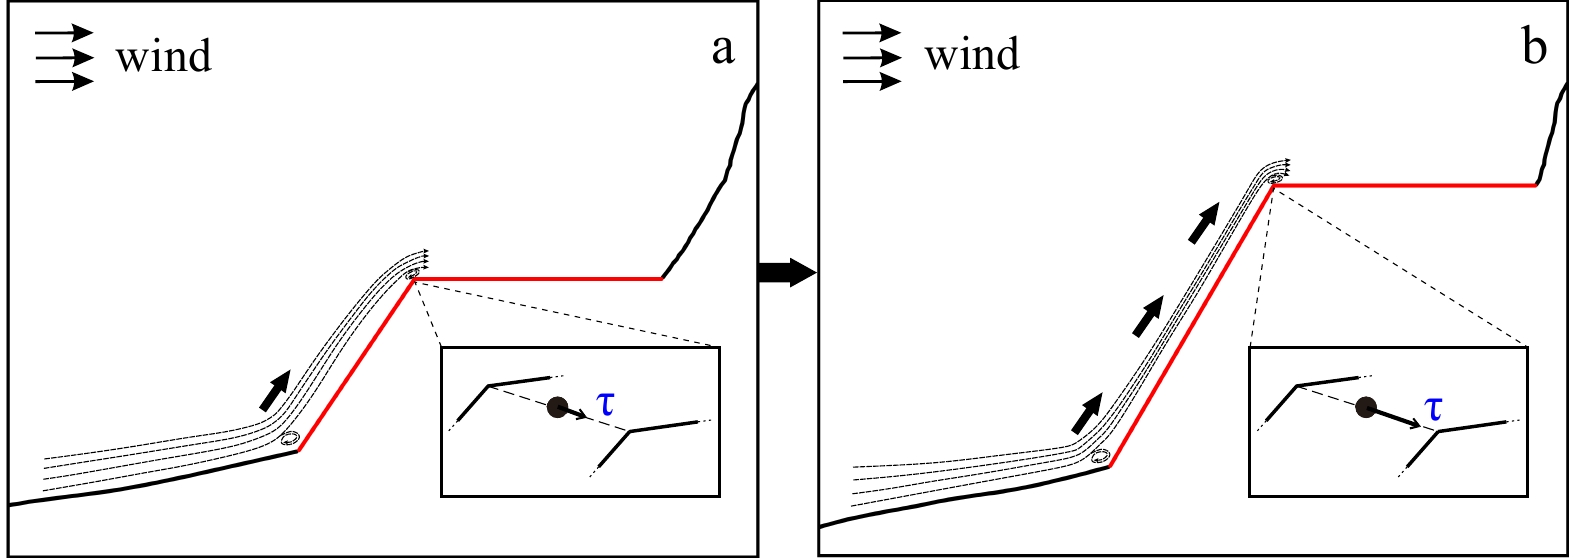
In summary, under the condition that the wind speed is perpendicular to the coastline and the nourished slope remains unchanged, with higher nourished beach berm, airflow at the slope break has more obvious upward trend and surface shear stress at the nourished berm edge is greater, which results in a larger wind speed there (Fig. 9). In addition, previous studies of inland hills, ridges, and desert dunes show that the wind speed amplification rate is usually between 1.02 and 3.19 (Jackson and Hunt, 1975; Neuman et al., 1997; Miller and Davenport, 1998; Ha et al., 1999; Yang et al., 2006). In this paper, when the NBH changes while other conditions remain unchanged, the range of the wind speed amplification rate is 1.14 to 1.19 at the nourished berm edge, which is not affected by the incidence wind speed (Fig. 7).
Figure
9.
Conceptual pattern of the airflow field from the slope break to the berm edge and surface shear stress at the berm edge during the evolution of the nourished berm height. The more arrows there are between the slope break and the berm edge, the greater the upward airflow trend is from the slope break; in the local enlarged diagram, $\tau $ represents shear stress, and longer arrow indicates larger shear stress.
5.1.2
Effect of NBS on jet flow at the edge of the beach berm
Beach slopes are usually designed according to local wave conditions and the sediment grain size on beach surfaces. From the equilibrium profile model proposed by Dean (1977) to the equilibrium beach slope method defined by Pilarczyk et al. (1986), both methods suggest that the profile slope plays an important role in the reconstruction of the active profile for beach nourishment. This study has been carried out based on the above methods, and the results show that the variation in NBS greatly influences the increase in cross-shore wind speed (Figs 5d, f, h, j, l). Therefore, the rational design of NBSs can effectively use wind to reshape the active profile for beach nourishment.
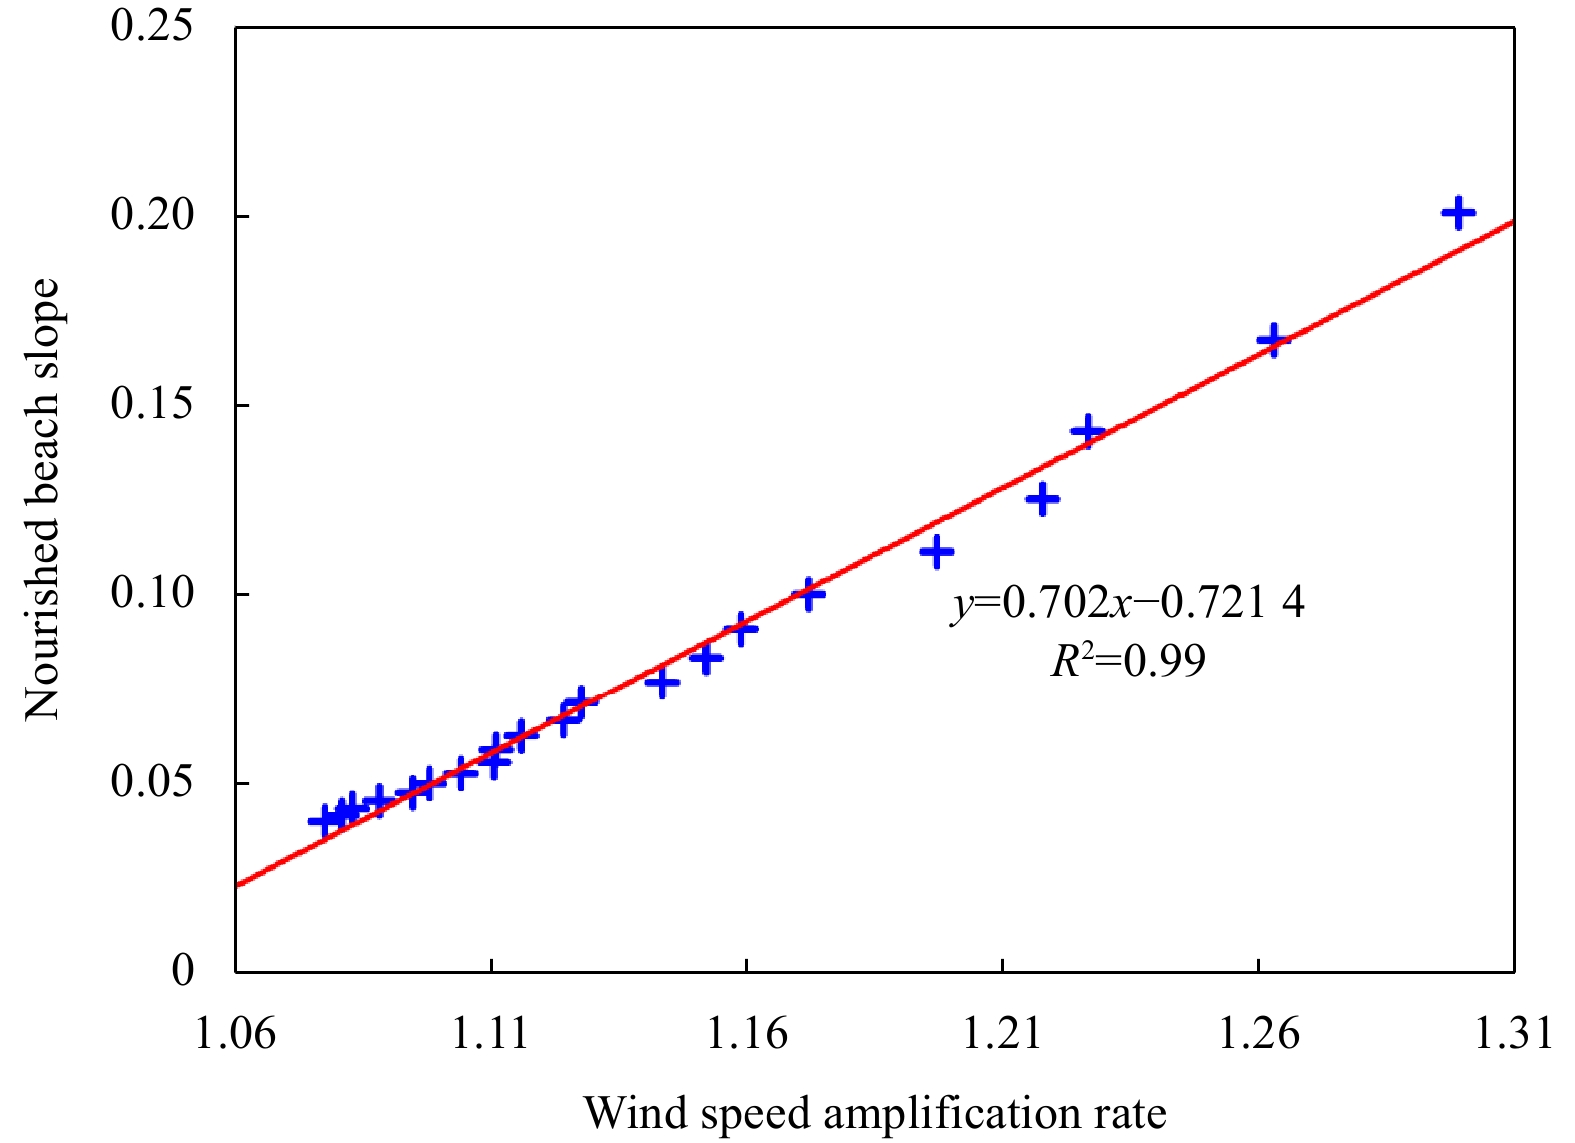
Figure 10 illustrates the variations of the wind speed amplification rate of the nourished beach berm with different NBSs. Keeping the width and height of the nourished berm unchanged, the wind speed at the berm edge has a positive correlation with NBS and shows a linear increasing trend within the reasonable design range of the beach slope (1:25–1:5). This phenomenon is related to the jet flow formed at the nourished berm edge. The angle of incidence and the stoss slope have a significant influence on the formation of surface jets, which are local flows showing the maximum velocity. Jets usually occur in places where the stoss slope is steeper (Walker and Hesp, 2013). Similarly, jets can be generated at the nourished berm edge.
Figure
10.
Variation trend of wind speed amplification rate with nourished beach slope.
The variation characteristics of the airflow field between the slope break and the nourished berm edge are shown in Fig. 8. When the airflow approaches the slope break, the airflow is separated, a vortex is generated, and the wind speed decreases slightly. At this time, the streamlines are compressed along the nourished slope surface and the airflow is accelerated. Subsequently, the airflow at the nourished berm edge is accelerated to the maximum and expands, that is, the jet is generated, and the wind speed is also increased to the maximum here. The steeper the slope of airflow passing through the nourished beach is, the larger the jet flow is at the berm edge, and the larger the wind speed is here. This phenomenon is consistent with the research results of Hesp et al. (2013) and Hesp and Smyth (2016). A CFD model is used, and when the angle of the incidence wind is more than 55°, a jet will not develop. As the smaller the angle of the incidence wind is, the steeper the wind slope is across the hill or dune, and the larger the jet is.
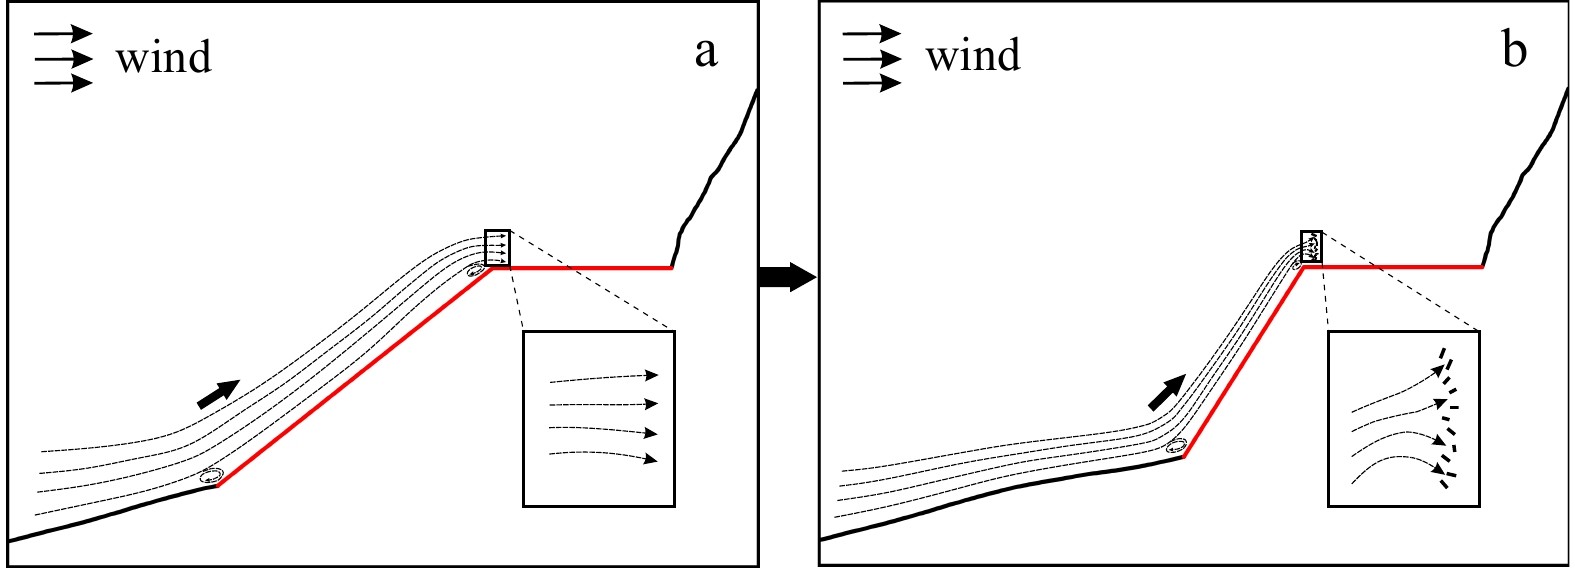
In summary, when the wind speed is perpendicular to the coastline and the width and height of the nourished berm are constant, steeper slopes can cause stronger jet flows at the berm edge, which results in a larger wind speed at this location (Fig. 11). Furthermore, when the nourished slope changes while other conditions remain unchanged, the wind speed amplification rate at the nourished berm edge is 1.08 to 1.30, which is not affected by the incidence wind speed (Fig. 10).
Figure
11.
Conceptual airflow field from the slope break to the berm edge during the evolution of nourished beach slope. Greater curvature of the arrows in the locally enlarged image indicates stronger jets.
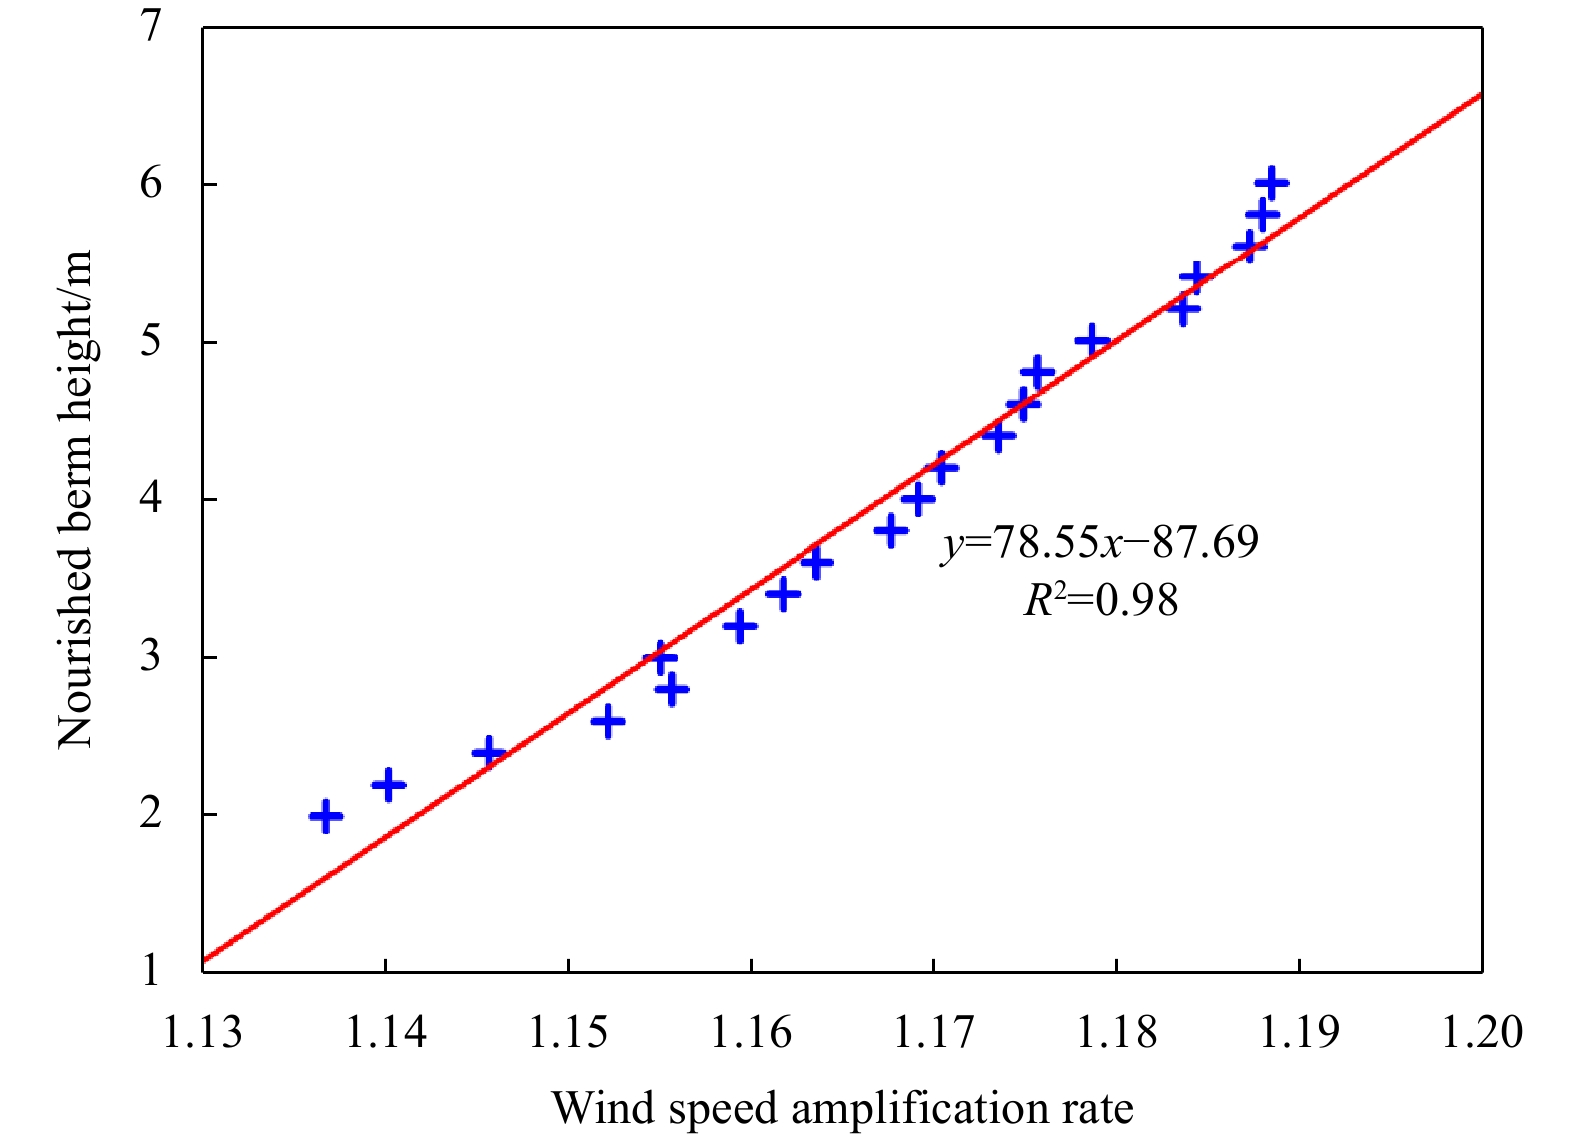
The above information indicates that the NBH and NBS dominate the variation degree of the wind speed at the edge of the beach berm. In this paper, a multiple linear regression (MLR) model is used to analyze the synergistic effect and relative importance of each factor on the variation in the wind speed at the edge of the beach berm. A multivariate linear regression model describing the wind speed amplification rate at the berm edge as a function of NBH and NBS is established,
where $ {S}_{{\rm{a}}} $ is the wind speed amplification rate at the nourished berm edge, $ {\alpha }_{1} $, $ {\alpha }_{2} $, and $ {\alpha }_{3} $ are undetermined coefficients, $ h $ is the NBH, and tan θ is the NBS. Duna was used to simulate the wind speed at the nourished berm edge for 99 scenarios, i.e., 9 berm heights (2.0 m, 2.5 m, 3.0 m, 3.5 m, 4.0 m, 4.5 m, 5.0 m, 5.5 m, and 6.0 m) by 11 beach slopes (1:25, 1:23, 1:21, 1:19, 1:17, 1:15, 1:13, 1:11, 1:9, 1:7, and 1:5). The results of regression analysis showed that the regressed Sa values were in good agreement with the original values, with R2 = 0.977. The variance inflation factors (VIF) of NBH and NBS were less than 10, indicating that there was no multicollinearity between the two variables (Akinwande et al., 2015). The values of t ratio indicated the significance test values of the regression parameters, which tested the degree of influence of each independent variable on the dependent variable. The larger the absolute value of the t ratio was, the smaller the p value was, and the more significant the influence of the independent variable on the dependent variable was. The significance levels of the two factors (p values) were 0.000, lower than 0.05 (Table 4), which indicated that the two factors had a significant influence on the wind speed of the nourished beach berm. In addition, the standardized coefficients in Table 4 represent the weights of the influencing factors; the larger the coefficient is, the greater the impact is (Schroeder et al., 1986). Obviously, compared with the NBH, NBS has a greater impact on the wind speed at the berm edge.
Table
4.
Multiple linear regression analysis (99 samples)
As inferred from the prediction model, the NBH and the steeper NBS can contribute to the larger wind speed amplification rate at the berm edge. Airflows with higher NBH or steeper NBS are more compressed from the upper beach slope to the berm edge and thus have greater tendency to be pushed upward. Larger surface shear stress of the nourished berm edge can generate larger jets, which promote the sharp increase in wind speed there. Therefore, beach nourishment projects carried out by beach berm sand-filling on windy coasts are strongly recommended for the design of gentle beach slopes at reasonable berm heights to decrease aeolian sand transport.
6.
Conclusions
The difference in wind speed distribution and its intensity variation on the beach surface caused by the topography before and after beach nourishment is revealed in this paper, which can provide a reference for clarifying the driving mechanism of the variation in aeolian sand transport in nourished beaches. Based on the field observations of different wind characteristics at typical sites of the beach surface, including the mid-intertidal zone, the foredune toe, and the foredune crest, the Duna model was used to simulate the cross-shore wind speed distribution influenced by the topography of the natural beach and nourished beach. In addition, the influencing factors and potential mechanisms of the variation in wind speed at the edge of the nourished beach berm were discussed, and the main conclusions are described as follows:
(1) The wind speed increases at the berm edge after beach nourishment by berm sand filling. NBH and NBS are the main factors controlling the increase in wind speed near the beach berm. When the position of the beach berm and the nourished slope are constant, the wind speed at the edge of the beach berm has a positive correlation with the elevation of the beach berm and increases linearly with elevation. When the elevation of the beach berm remains unchanged, the wind speed at the edge of the beach berm is positively correlated with the nourished slope and increases linearly with the latter.
(2) A coupling relationship between the wind speed amplification rate at the nourished berm edge and the two main influencing factors (NBH and NBS) was established based on MLR analysis. The coupling effect of NBH and NBS on wind speed was illustrated, and the results show that a higher beach berm and steeper slope will generate a larger wind speed amplification rate for beach nourishment. However, compared with the NBH, NBS has a greater impact on the variation in wind speed at the nourished berm edge. Therefore, it is better to design beach berms with a gentle slope in the reasonable elevation range of nourished beach berms when beach nourishment is carried out by beach berm sand-filling on windy coasts.
Abe K, Nagano Y, Kondoh T. 1993. Numerical prediction of separating and reattaching flows with a modified low-Reynolds-number k-ε model. Journal of Wind Engineering and Industrial Aerodynamics, 46–47: 85–94,
Akinwande M O, Dikko H G, Samson A. 2015. Variance inflation factor: As a condition for the inclusion of suppressor variable(s) in regression analysis. Open Journal of Statistics, 5(7): 754–767. doi: 10.4236/ojs.2015.57075
Baddock M C, Wiggs G F S, Livingstone I. 2011. A field study of mean and turbulent flow characteristics upwind, over and downwind of barchan dunes. Earth Surface Processes and Landforms, 36(11): 1435–1448. doi: 10.1002/esp.2161
Bagnold R A. 1936. The movement of desert sand. Proceedings of the Royal Society A: Mathematical Physical & Engineering Sciences, 157(892): 594–620. doi: 10.1098/rspa.1936.0218
Bauer B O, Davidson-Arnott R G D, Hesp P A, et al. 2009. Aeolian sediment transport on a beach: Surface moisture, wind fetch, and mean transport. Geomorphology, 105(1–2): 106–116,
Bauer B O, Wakes S J. 2022. CFD simulations of wind flow across scarped foredunes: Implications for sediment pathways and beach–dune recovery after storms. Earth Surface Processes and Landforms, 47(12): 2989–3015. doi: 10.1002/esp.5439
Bowen A J, Lindley D. 1977. A wind-tunnel investigation of the wind speed and turbulence characteristics close to the ground over various escarpment shapes. Boundary-Layer Meteorology, 12(3): 259–271. doi: 10.1007/bf00121466
Byrne C E I, Holdø A E. 1998. Effects of increased geometric complexity on the comparison between computational and experimental simulations. Journal of Wind Engineering and Industrial Aerodynamics, 73(2): 159–179. doi: 10.1016/S0167-6105(97)00284-5
Cai Feng. 2015. Chinese Beach Nourishment Manual (in Chinese). Beijing: China Ocean Press, 252na O
Dean R G. 1977. Equilibrium beach profiles: U. S. Atlantic and Gulf coasts. Newark: Department of Civil Engineering and College of Marine Studies, University of Delaware, 4–11
Dean R G. 2003. Beach Nourishment: Theory and Practice. Singapore: World Scientific Publishing, 21–37
Durán O, Herrmann H. 2006. Vegetation against dune mobility. Physical Review Letters, 97(18): 188001,
Feng Shi, Ning Huang. 2010. Computational simulations of blown sand fluxes over the surfaces of complex microtopography. Environmental Modelling & Software, 25(3): 362–367. doi: 10.1016/j.envsoft.2009.09.002
Finkl C W, Walker H J. 2002. Beach nourishment. In: Chen J Y, Eisma D, Hotta K, et al. , eds. Engineered Coasts. Dordrecht: Springer, 1–22
Fujian Provincial Meteorological Bureau (FPMB). 1981a. Climatological data of Beijiao, Fujian (1951–1980) (in Chinese). Fuzhou: Fujian Provincial Meteorological Bureau
Fujian Provincial Meteorological Bureau (FPMB). 1981b. Climatological data of Changle, Fujian (1951–1980) (in Chinese). Fuzhou: Fujian Provincial Meteorological Bureau
Ha Si, Dong Guangrong, Wang Guiyong. 1999. Near-surface airflow and slop morphology of dunes in southeastern Tengger desert. Journal of Desert Research (in Chinese), 19(1): 1–5
Hallin C, Huisman B J A, Larson M, et al. 2019. Impact of sediment supply on decadal-scale dune evolution—Analysis and modelling of the Kennemer dunes in the Netherlands. Geomorphology, 337: 94–110. doi: 10.1016/j.geomorph.2019.04.003
He Yanyu, Cai Feng, Liu Jianhui, et al. 2022. Foredune height variations along the western coast of Taiwan Strait. Earth Surface Processes and Landforms, 47(11): 2765–2778. doi: 10.1002/esp.5422
Hesp P A, Smyth T A G. 2016. Jet flow over foredunes. Earth Surface Processes and Landforms, 41(12): 1727–1735. doi: 10.1002/esp.3945
Hesp P A, Walker I J, Chapman C, et al. 2013. Aeolian dynamics over a coastal foredune, Prince Edward Island, Canada. Earth Surface Processes and Landforms, 38(13): 1566–1575. doi: 10.1002/esp.3444
Hojan M, Rurek M, Krupa A. 2019. The impact of sea shore protection on aeolian processes using the example of the beach in Rowy, N Poland. Geosciences, 9(4): 179. doi: 10.3390/geosciences9040179
Hong Dongming, Deng Tao, Li Zhizhong, et al. 2017. The evolution of coastal environment recorded by sedimentary sequences of coastal dune in Changle City, Fujian Province. Journal of Hebei Normal University (Natural Science Edition) (in Chinese), 41(2): 172–179
Hoonhout B M, Vries S D. 2016. A process-based model for Aeolian sediment transport and spatiotemporal varying sediment availability. Journal of Geophysical Research: Earth Surface, 121(8): 1555–1575. doi: 10.1002/2015jf003692
Hu Guangyuan, Zhuang Zhenye, Gao Wei. 2008. Overview and enlightenment of beach nourishment in Europe. Marine Geology Letters (in Chinese), 24(12): 29–33
Inkratas C, Gharabaghi B, Beltaos S, et al. 2009. 3D modelling of ice-covered flows in the vicinity of a deep hole in the East Channel of the Mackenzie Delta, N. W. T. Canadian Journal of Civil Engineering, 36(5): 791–800. doi: 10.1139/L09-031
Jackson P S, Hunt J C R. 1975. Turbulent wind flow over a low hill. Quarterly Journal of the Royal Meteorological Society, 101(430): 929–955. doi: 10.1002/qj.49710143015
Jackson N L, Nordstrom K F. 2011. Aeolian sediment transport and landforms in managed coastal systems: A review. Aeolian Research, 3(2): 181–196. doi: 10.1016/j.aeolia.2011.03.011
Kaczkowski H L, Kana T W, Traynum S B, et al. 2018. Beach-fill equilibration and dune growth at two large-scale nourishment sites. Ocean Dynamics, 68(9): 1191–1206. doi: 10.1007/s10236-018-1176-2
Kroy K, Sauermann G, Herrmann H J. 2002. Minimal model for sand dunes. Physical Review Letters, 88(5): 054301. doi: 10.1103/physrevlett.88.054301
Kuang Fangfang, Zhang Youquan, Zhang Junpeng, et al. 2015. Comparison and evaluation of three sea surface wind products in Taiwan Strait. Haiyang Xuebao (in Chinese), 37(5): 44–53
Lane S N, Hardy R J, Elliott L, et al. 2002. High-resolution numerical modelling of three-dimensional flows over complex river bed topography. Hydrological Processes, 16(11): 2261–2272. doi: 10.1002/hyp.5034
Lee S J, Lim H C, Park K C. 2002. Wind flow over sinusoidal hilly obstacles located in a uniform flow. Wind and Structures, 5(6): 515–526. doi: 10.12989/was.2002.5.6.515
Lei Gang, Liu Gen, Cai Feng. 2013. Enlightenment to China’s coastal protection from the coast beach nourishment at Huizhan Zhongxin of Xiamen Island. Journal of Applied Oceanography (in Chinese), 32(3): 305Chin
Li Haibao, Jiang Hongxi, Zhang Lin, et al. 2015. A teaching case for the knowledge point of the Bernoulli equation. Physics and Engineering (in Chinese), 25(1): 61–64
Liu Jianhui, Cai Feng, Li Bailiang, et al. 2016. Effect of beach nourishment on the coastal aeolian sand accumulation: a case study in Pingtan, Fujian, China. Journal of Desert Research (in Chinese), 36(3): 565–574
Liu Jianhui, Cai Feng, Qi Hongshuai, et al. 2011. Coastal erosion along the west coast of the Taiwan Strait and it’s influencing factors. Journal of Ocean University of China, 10(1): 23–34. doi: 10.1007/s11802-011-1745-1
Liu Jianhui, Cai Feng, Zhang Zhenwei, et al. 2017. Early stage evolution of nourished beach under high-energy, Macro-tidal environment. IOP Conference Series: Earth and Environmental Science, 57: 012039. doi: 10.1088/1755-1315/57/1/012039
Lun Y F, Mochida A, Murakami S, et al. 2003. Numerical simulation of flow over topographic features by revised k–ε models. Journal of Wind Engineering and Industrial Aerodynamics, 91(1–2): 231–245,
Mason P J, King J C. 1985. Measurements and predictions of flow and turbulence over an isolated hill of moderate slope. Quarterly Journal of the Royal Meteorological Society, 111(468): 617–640. doi: 10.1002/qj.49711146818
Mason P J, Sykes R I. 1979. Flow over an isolated hill of moderate slope. Quarterly Journal of the Royal Meteorological Society, 105(444): 383–395. doi: 10.1002/qj.49710544405
Miller C A, Davenport A G. 1998. Guidelines for the calculation of wind speed-ups in complex terrain. Journal of Wind Engineering and Industrial Aerodynamics, 74–76: 189–197,
Neuman C M, Lancaster N, Nickling W G. 1997. Relations between dune morphology, air flow, and sediment flux on reversing dunes, Silver Peak, Nevada. Sedimentology, 44(6): 1103–1111. doi: 10.1046/j.1365-3091.1997.d01-61.x
Nguyen V T, Nestmann F. 2004. Applications of CFD in hydraulics and river engineering. International Journal of Computational Fluid Dynamics, 18(2): 165–174. doi: 10.1080/10618560310001634186
Nicholas A P. 2001. Computational fluid dynamics modelling of boundary roughness in gravel-bed rivers: an investigation of the effects of random variability in bed elevation. Earth Surface Processes and Landforms, 26(4): 345–362. doi: 10.1002/esp.178
Nordstrom K F, Jackson N L, Klein A H F, et al. 2006. Offshore aeolian transport across a low foredune on a developed barrier island. Journal of Coastal Research, 225: 1260–1267. doi: 10.2112/06A-0008.1
Pan Weihua, Lin Yi. 2019. Spatial feature and seasonal variability characteristics of sea surface wind field in Taiwan Strait from 2007 to 2017. Journal of Tropical Meteorology (in Chinese), 35(3): 296–303
Parsons D R, Walker I J, Wiggs G F S. 2004. Numerical modelling of flow structures over idealized transverse aeolian dunes of varying geometry. Geomorphology, 59(1–4): 149–164,
Pearson D S, Goulart P J, Ganapathisubramani B. 2013. Turbulent separation upstream of a forward-facing step. Journal of Fluid Mechanics, 724: 284–304. doi: 10.1017/jfm.2013.113
Pilarczyk K W, Van Overeem J, Bakker W T. 1986. Design of beach nourishment scheme. Coastal Engineering Proceedings, 1(20): 107. doi: 10.9753/icce.v20.107
Pupienis D, Jarmalavičius D, Žilinskas G, et al. 2014. Beach nourishment experiment in Palanga, Lithuania. Journal of Coastal Research, 70: 490–495. doi: 10.2112/SI70-083.1
Qi Hongshuai, Cai Feng, Lei Gang, et al. 2010. The response of three main beach types to tropical storms in South China. Marine Geology, 275(1–4): 244–254,
Qi Hongshuai, Liu Gen, Cai Feng, et al. 2021. Development trend and prospect of beach nourishment technology. Journal of Applied Oceanography (in Chinese), 40(1): 111–125
Roelvink D, Costas S. 2019. Coupling nearshore and aeolian processes: XBeach and duna process-based models. Environmental Modelling & Software, 115: 98–112. doi: 10.1016/j.envsoft.2019.02.010
Safarzadeh A, Neyshabouri A A S, Dehkordi A N, et al. 2009. 2D numerical simulation of fluvial hydrodynamics and bed morphological changes. In: Simos T E, Maroulis G, eds. Computational Methods in Science and Engineering, Advances in Computational Science. New York: AIP Publishing Center, 739–742,
Sauermann G, Kroy K, Herrmann H J. 2001. Continuum saltation model for sand dunes. Physical Review E, 64(3): 031305. doi: 10.1103/physreve.64.031305
Schroeder L D, Sjoquist D L, Stephan P E. 1986. Understanding Regression Analysis: An Introductory Guide. Thousand Oaks: SAGE Publications, 777–832
Sloss C R, Hesp P A, Shepherd M. 2012. Coastal Dunes: Aeolian Transport. Nature Education Knowledge, 3(10): 21
Stangroom P. 2004. CFD modelling of wind flow over terrain [dissertation]. Nottingham: University of Nottingham
Taylor P A, Gent P R. 1974. A model of atmospheric boundary-layer flow above an isolated two-dimensional ‘hill’; an example of flow above ‘gentle topography’. Boundary-Layer Meteorology, 7(3): 349–362. doi: 10.1007/bf00240837
Taylor P A, Mason P J, Bradley E F. 1987. Boundary-layer flow over low hills. Boundary-Layer Meteorology, 39(1–2): 107–132,
Third Institute of Oceanography, Ministry of Natural Resources (TIO). 2020. Feasibility study report for beach nourishment in the north of Changle Airport (in Chinese). Xiamen: Third Institute of Oceanography, Ministry of Natural Resources
US Army Corps of Engineer (USACE). 2002. Coastal engineering manual. Vicksburg: Dept. of the Army, USACE: 1042–1060
van der Wal D. 1998. The impact of the grain-size distribution of nourishment sand on aeolian sand transport. Journal of Coastal Research, 14(2): 620–631
Walker I J, Davidson-Arnott R G D, Bauer B O, et al. 2017. Scale-dependent perspectives on the geomorphology and evolution of beach-dune systems. Earth-Science Reviews, 171: 220–253. doi: 10.1016/j.earscirev.2017.04.011
Walker I J, Hesp P A. 2013. Fundamentals of aeolian sediment transport: Airflow over dunes. Treatise on Geomorphology, 11: 109–133. doi: 10.1016/b978-0-12-374739-6.00300-6
Walker I J, Nickling W G. 2002. Dynamics of secondary airflow and sediment transport over and in the lee of transverse dunes. Progress in Physical Geography: Earth and Environment, 26(1): 47–75. doi: 10.1191/0309133302pp325ra
Walker I J, Nickling W G. 2003. Simulation and measurement of surface shear stress over isolated and closely spaced transverse dunes in a wind tunnel. Earth Surface Processes and Landforms, 28(10): 1111–1124. doi: 10.1002/esp.520
Walmsley J L, Howard A D. 1985. Application of a boundary-layer model to flow over an eolian dune. Journal of Geophysical Research: Atmospheres, 90(D6): 10631–10640. doi: 10.1029/jd090id06p10631
Weaver C M, Wiggs G F S. 2011. Field measurements of mean and turbulent airflow over a barchan sand dune. Geomorphology, 128(1–2): 32–41,
Wiggs G F S, Livingstone I, Warren A. 1996. The role of streamline curvature in sand dune dynamics: evidence from field and wind tunnel measurements. Geomorphology, 17(1–3): 29–46,
Yang Tingting, Ding Guodong, Hao Yuguang, et al. 2006. A preliminary study on variation in wind velocity and sediment transport rate on windward slope of barchan dune. Research of Soil and Water Conservation (in Chinese), 13(3): 218h219, 225
Zhang Wenkai, Li Zugaung. 1995. The formation, growth and regional distributional characteristic of coastal dunes in the Changle County, Fujian Province. Journal of Desert Research (in Chinese), 15(1): 31–36
Zhuang Zhenye, Cao Lihua, Li Bing, et al. 2011. An overview of beach nourishment in China. Marine Geology & Quaternary Geology (in Chinese), 31(3): 133–139
Zhuang Zhenye, Wang Yonghong, Bao Min, et al. 2009. Beach nourishment process and engineering technology. Periodical of Ocean University of China (in Chinese), 39(5): 1019–1024
Figure 1. Location of the study area (a), the field observation profile before beach nourishment (b) and the profile after nourishment (c). The year-round data of wind rose for the study area in b is sourced from He et al. (2022); the red dashed box in c represents the nourished beach.
Figure 2. Geomorphology of P1 before and after nourishment and location of anemometers on P1 in nourished beach. The photo is the W1 anemometer. HWL: high water level; LWL: low water level.
Figure 3. The wind roses of the three geomorphic feature sites (a) and observed value of cross-shore wind speeds along the beach profile (average wind speed per 10 min) (b).
Figure 4. Comparison of observed and simulated wind speeds at the foredune toe (a–c) and foredune crest (d–f) under different parameter combinations of α and β.
Figure 5. The shapes of different nourished beach profiles are designed when nourished berm height changes (a) or nourished beach slope changes (b) and other conditions remain unchanged; the distribution of cross-shore wind speed with shoreline-normal incidence wind speed of 4 m/s (c), 6 m/s (e), 8 m/s (g), 10 m/s (i) and 12 m/s (k) corresponding to the shapes of different nourished beach profiles in a; the distribution of cross-shore wind speed with shoreline-normal incidence wind speed of 4 m/s (d), 6 m/s (f), 8 m/s (h), 10 m/s (j) and 12 m/s (l) corresponding to the shapes of different nourished beach profiles in b. MHWS: mean high water level of spring tide.
Figure 6. Schematic profile after beach nourishment and the wind speed parameters related to the geomorphology. h stands for the elevation at the nourished berm edge relative to mean sea level (MSL), and θ represents the angle of the nourished beachface. MHWS: mean high water level of spring tide.
Figure 7. Variation trend of wind speed amplification rate with nourished berm height.
Figure 8. Variation characteristics of the airflow field from the slope break to the nourished berm edge (drawing based on Walker et al. (2017) and Bauer and Wakes (2022)).
Figure 9. Conceptual pattern of the airflow field from the slope break to the berm edge and surface shear stress at the berm edge during the evolution of the nourished berm height. The more arrows there are between the slope break and the berm edge, the greater the upward airflow trend is from the slope break; in the local enlarged diagram, $\tau $ represents shear stress, and longer arrow indicates larger shear stress.
Figure 10. Variation trend of wind speed amplification rate with nourished beach slope.
Figure 11. Conceptual airflow field from the slope break to the berm edge during the evolution of nourished beach slope. Greater curvature of the arrows in the locally enlarged image indicates stronger jets.


 DownLoad:


 DownLoad:


 DownLoad: