Figure
1.
Sampling stations in the study area of the Guangxi shelf in the Beibu Gulf.
| Citation: | Hao Wang, Qiangqiang Zhong, Fule Zhang, Suiyuan Chen, Hongyan Bao, Jing Lin, Dekun Huang, Tao Yu. Tracing surface seawater mixing and nutrient transport by 222Rn on the northern coast of Beibu Gulf, China[J]. Acta Oceanologica Sinica, 2023, 42(8): 87-98. doi: 10.1007/s13131-023-2233-3

|
Since the Industrial Revolution, the rapid development of society and economy has led to resource depletion and ecological destruction; thus, environmental problems have gained widespread attention (Chen, 2019). Coastal zones have convenient land and water transportation, and their urbanization is more advanced than that of other regions, making important contributions to global economic development. However, the ecosystems in these areas are fragile and easily damaged by human activities. Many current environmental problems, such as ocean acidification (Liu et al., 2021), marine eutrophication (Santos et al., 2021; Wang et al., 2021), algae bloom (Chen et al., 2020), and organic pollution of seawater, are caused by human activities in this region (McKenzie et al., 2020; Mwangi et al., 2016). Data show that the destruction of coastal ecosystems has restricted social productivity and hindered economic development in coastal areas (Wang et al., 2021). Therefore, the environmental governance of coastal areas has gained the attention of governments worldwide. However, it is difficult to trace the source of pollutants that damage the ecological environment and assess their diffusion and migration process due to the complex hydrodynamic conditions of land-water interactions in coastal zones. These factors restrict the sustainable development of the coastal zone environment and increase the difficulty of environmental governance.
The migration and diffusion of pollutants in seawater are closely related to the mixing and exchange of water bodies. The mixing of marine water bodies is a common form of seawater movement. Previous studies have interpreted this mixing as the process of gradually homogenizing various characteristics in seawater (Su, 2013; Su et al., 2013). The whole water mixing process is divided into four forms: (1) Molecular diffusion occurs mainly via the random movement of molecules to exchange materials with adjacent seawater. The diffusion process is described by Fick’s law. The intensity depends on the material gradient in space, with an order of magnitude of 10−5 cm2/s, and the influencing factor is the properties of seawater (Su, 2013). (2) Turbulent diffusion carries out material exchange with adjacent seawater via the random movement of seawater microclusters (Su, 2013). The diffusion process is closely related to the movement of seawater, which is relatively complex and difficult to simulate numerically. Therefore, eddy diffusivity was introduced to describe the diffusion process and quantify the intensity of diffusion, with an order of magnitude of 10−108 cm2/s (Su, 2013). (3) Advection carries dissolved and granular matter through the water body for migration. The migration process is determined by water flow movement and is closely related to the flow field morphology (Su, 2013). (4) Convection is the process of water exchange and material migration in the vertical direction, which depends on the difference in water density caused by heat and salt. Seawater mixing is the result of the interaction of various mixing forms, but the processes dominated by different mixing forms show different characteristics. In the diffusion-dominated process, the concentration of the source decreases with increasing time but does not change greatly in space. In the advection-dominated process, the concentration of the source does not change with time but moves with the flow in space. In a process dominated by advection and diffusion, the concentration of the source will not only decrease with time but also move spatially with the flow (Su et al., 2013). Current studies have shown that the mixing process of offshore water bodies mainly exists in the form of advection and turbulent diffusion (Blanton et al., 1994; Moore, 2000), and the effect of molecular diffusion is disregarded (Sarmiento et al., 1976). Therefore, the study of turbulent diffusion and peaceful flow has practical significance for the establishment of solute transport models in seawater, the assessment of ocean self-purification capacity, and the calculation of the ocean dilution diffusion coefficient (Su, 2013). This investigation can improve our understanding of the laws and patterns of temporal and spatial variations in dissolved substances in the ocean, especially the biogeochemical cycles near coastal zones (Moore, 2010). For example, nutrient ions and iron ions in the bottom layer are transferred to the surface by eddy current diffusion after remineralization, thus improving primary productivity (Ge et al., 2020). Horizontal water mixing may lead to the cross-shelf migration of nutrients, causing eutrophication in slope areas (Zheng et al., 2020). Vertical stratification of water may cause anoxia and affect the population structure of marine organisms (Zhang et al., 2018).
The natural radionuclide 222Rn (T1/2 = 3.82 d) is a water-soluble inert gas, that is a decay product of the 238U series. 222Rn is chemically and particulate conservative and is not bioavailable or directly affected by geochemical conditions. Because 238U (T1/2 = 4.46×10⁹ a) is widely distributed in soil, rock layers, minerals, and atmospheric particles, 222Rn is ubiquitous. In addition, due to the special geological environment of aquifers, 222Rn will be enriched in groundwater, and its activity is much higher than that of surface runoff and seawater, making it an ideal tracer for the discharge of submarine groundwater (Chen, 2019; Wang, 2020). 222Rn has been widely applied to trace submarine groundwater discharge (SGD) (Chen, 2019; Chen et al., 2019; Wang, 2020; Zhang et al., 2016). In contrast, it is rarely used to evaluate horizontal eddy diffusion, which might be because 222Rn is easily degassed to the atmosphere. Nevertheless, some studies have shown that correcting the fraction of 222Rn escaping to the atmosphere could make it possible to utilize 222Rn for horizontal eddy diffusion tracing (Wang et al., 2021). Theoretically, according to the 222Rn activity, the decay law of the natural radionuclide, and the detection limit of RAD7, 222Rn can still be detected after 5~6 half-lives (Moore, 2000). Thus, 222Rn can trace water mixing for approximately 15 d. Since the offshore process is relatively short and changes rapidly, 222Rn may also be suitable for tracing seawater mixing in coastal regions. Additionally, RAD7 is widely employed with high sensitivity and a low detection limit, and the water consumption (250 mL) is considerably less than that used to detect radium in seawater (50 L). Therefore, 222Rn may be utilized instead of radium to trace water mixing when water sample allocation is limited.
In this study, the distribution of 222Rn activity in the surface water of the Guangxi shelf area of the Beibu Gulf was determined in the summer of 2021 (end of May 2021). By using the one-dimensional advective diffusion model corrected for atmospheric diffusion and flow action under steady-state conditions, we estimated the horizontal eddy current diffusion and compared the spatial variation. Nutrient diffusion fluxes in the study area were further calculated by using the apparent diffusion coefficient to evaluate the influence of nutrient horizontal transport fluxes in the study area. The results of this study provide insights into the significance of water mass mixing on the distribution of nutrients in subtropical bay areas.
The geographical location and sampling stations of the sea area involved in this study are shown in Fig. 1. The study area is in the Beibu Gulf area in the northwestern region of the South China Sea, bordering the Leizhou Peninsula and Hainan Island to the east, Guangxi Zhuang Autonomous Region to the north, Vietnam to the west, and the South China Sea to the south.
The Beibu Gulf is a natural semienclosed shallow bay, with a coastline length of 1 628.6 km and a sea area of 1.283 × 10⁵ km2. Surrounded by islands and land on three sides, the Beibu Gulf is only connected to the sea toward the south, where it projects westward and is fan-shaped. The northern coastal waters of the Beibu Gulf have numerous harbors and runoff, mainly including Tieshan Port, Beihai Bay, Qinzhou Bay, Lianzhou Bay, Fangcheng Port and Nanliu River and Dafeng River. The sea floor in the bay is flat, and the water depth ranges from 20 m to 80 m, with an average depth of 38 m (Wu, 2014). The Beibu Gulf is in tropical and subtropical regions and has a tropical monsoon climate. The annual precipitation is 1 200−2 000 mm, and the precipitation is mainly concentrated from July to September, among which the precipitation along the coast of Guangxi is the highest, with uneven spatial and temporal distributions and large annual variations. The rainfall in the Beibu Gulf is affected by the monsoon circulation system. The dry and wet seasons are distinct, with high rainfall in summer and low rainfall in winter. The prevailing wind has strong seasonal changes, the winter monsoon has a long influence time and fast wind speed, and summer has the opposite effect and is susceptible to tropical cyclones (Xiong, 2019; Tang, 2011; Cao et al., 2019; Yang et al., 2006). Due to the unique topography of the Beibu Gulf, diurnal tides are obvious in the bay, and some areas have irregular diurnal tides. The tidal current is mainly reciprocating. Except for the irregular diurnal tides at Tieshan Port and Longmen Port, the remainders are regular diurnal tides. The maximum possible tidal range in most sea areas is 3−6 m, the average tidal range exceeds 2 m, and the maximum tidal range at the bay crest is greater than 6 m (Feng, 2021; Chen et al., 2020). A total of 31 stations were observed in this study, and the specific sampling stations are displayed in Fig. 1.
The seawater samples are collected by the plexiglass water sampler (the water samples below the water surface are controlled to be collected at 1.5−2 m during sampling). The rubber tube is inserted at the bottom of the water sampler, filled with water samples from the bottom of the bottle, seawater is slowly injected into the 250 mL glass bottle by the overflow method, and the cap is tightened to ensure that there are no bubbles in the glass bottle.
The 226Ra seawater samples in this study were located at the same station as the 222Rn seawater samples. At each sampling station, a pump was used to extract 50 L of surface seawater. The siphon principle was applied to make seawater flow through the water column containing manganese fibers to enrich radium in the water. Afterward, the filtered manganese fibers were cleaned with Milli-Q water to remove salt and sediment particles.
The nutrient samples were filtered through 0.45 μm cellulose acetate filters that were precleaned with hydrochloric acid, rinsed with Milli-Q water and poured into polyethylene bottles. Then, the samples were treated with saturated HgCl2 and kept away from light until the laboratory measurement could be conducted.
222Rn samples collected from 250 mL glass bottles were analyzed by the RAD7 Radon detector (Durridge Co., Inc., USA) and its RAD H2O accessory at Beibu Gulf University. The measurement accuracy of RAD7 is 5% (under any humidity condition), its detection range is 4−750 000 Bq/m3, and the uncertainty value of the mean activity concentration of radon for a 2 h cycle was approximately ≤21% (Diab, 2019).
For 226Ra, after field pretreatment, samples were taken back to the laboratory at the Third Institute of Oceangraphy, Ministry of Natural Resources for follow-up treatment. First, the manganese fibers were dried, loaded into a crucible, covered and placed in a muffle furnace for ashing at 800℃ for 12 h. After grinding, the powder was evenly packed into a 9 mm sample tube, which was compacted, fixed and sealed for 20 d. Then, 226Ra activity was determined with a well-type, high-purity germanium γ spectrometer (Model GCW2021) by 214Pb (at 295.2 keV and 351.9 keV) and 214Bi (at 609.3 keV).
Phosphate and silicate concentrations were measured at Xiamen University using a Four-channel Continuous Flow Technicon AA3 AutoAnalyzer (Dai et al., 2008; Wan et al., 2023). The nitrite and nitrate (DIN) concentrations were measured using the chemiluminescence technique (Braman and Hendrix, 1989; Zheng, 2018). All sampling records and analysis results are shown in Table 1.
| Station | Latitude | Longitude | Temperature/ ℃ | Salinity | pH | DO/ (mg·L−1) | 222Rn/ (Bq·m−3) | 226Ra/ (Bq·m−3) | Offshore distance/ km | Phosphate/ (μmol·L−1) | Nitrite/ (μmol·L−1) | Nitrate/ (μmol·L−1) | Silicate/ (μmol·L−1) |
| A1 | 21.51°N | 108.28°E | 29.08 | 31.78 | 8.29 | 9.32 | 127.7 ± 61.6 | 4.69 ± 0.32 | 3.20 | 0.06 | 0.25 | 6.76 | 10.58 |
| A2 | 21.47°N | 108.28°E | 29.54 | 31.68 | 8.30 | 9.33 | 50.0 ± 37.2 | 4.41 ± 0.24 | 7.70 | 0.08 | 0.21 | 13.95 | 10.46 |
| A3 | 21.42°N | 108.28°E | 29.79 | 31.79 | 8.38 | 9.34 | 117.5 ± 59.3 | 4.32 ± 0.35 | 13.50 | 0.03 | 0.03 | 133.69 | 2.70 |
| A4 | 21.38°N | 108.28°E | 29.62 | 31.97 | 8.40 | 9.54 | 67.2 ± 44.9 | 3.16 ± 0.23 | 18.00 | 0.04 | 0.04 | 12.39 | 2.58 |
| A5 | 21.25°N | 108.30°E | 30.62 | 31.41 | 8.21 | 7.90 | 18.4 ± 21.4 | 2.73 ± 0.32 | 32.00. | 0.00 | 0.08 | 2.02 | 1.07 |
| B1 | 21.50°N | 108.37°E | 29.90 | 31.35 | 8.40 | 9.92 | 136.7 ± 64.7 | 5.15 ± 0.26 | 6.70 | 0.09 | 0.08 | 16.78 | 7.57 |
| B2 | 21.47°N | 108.36°E | 29.60 | 31.37 | 8.40 | 9.69 | 100.7 ± 56.4 | 5.47 ± 0.33 | 10.10 | 0.09 | 0.06 | 49.42 | 7.59 |
| C3 | 21.67°N | 108.61°E | 31.04 | 24.24 | 8.01 | 7.13 | 94.5 ± 54.8 | 5.80 ± 0.45 | 4.20 | 0.83 | 1.15 | 29.95 | 26.95 |
| C4 | 21.61°N | 108.64°E | 31.93 | 28.28 | 8.12 | 7.72 | 53.5 ± 42.3 | 6.97 ± 0.35 | 8.50 | 0.57 | 1.19 | 16.01 | 20.79 |
| C5 | 21.53°N | 108.65°E | 31.36 | 30.10 | 8.17 | 8.10 | 240.4 ± 83.3 | 6.39 ± 0.30 | 15.20 | 0.30 | 1.10 | 9.97 | 17.79 |
| C6 | 21.47°N | 108.67°E | 31.16 | 30.54 | 8.27 | 9.75 | 422.4 ± 111.2 | 6.90 ± 0.29 | 22.10 | 0.13 | 0.19 | 4.05 | 11.81 |
| C7 | 21.40°N | 108.67°E | 30.69 | 31.23 | 8.33 | 8.73 | 26.1 ± 26.0 | 4.46 ± 0.27 | 30.60 | 0.09 | 0.10 | 3.07 | 8.88 |
| C8 | 21.25°N | 108.70°E | 30.51 | 31.16 | 8.15 | 6.70 | 11.8 ± 16.5 | 4.15 ± 0.34 | 52.30 | 0.01 | 0.09 | 3.56 | 5.26 |
| D1 | 21.57°N | 108.87°E | 33.52 | 26.37 | 8.06 | 7.66 | 166.4 ± 65.7 | 5.45 ± 0.30 | 10.10 | 0.30 | 1.27 | 156.72 | 28.53 |
| D2 | 21.50°N | 108.87°E | 33.34 | 28.28 | 8.31 | 9.31 | 263.7 ± 85.8 | 4.80 ± 0.24 | 16.30 | 0.09 | 0.33 | 5.69 | 13.02 |
| D3 | 21.44°N | 108.88°E | 33.20 | 30.46 | 8.14 | 8.36 | 183.4 ± 76.4 | 5.32 ± 0.25 | 23.00 | 0.09 | 0.49 | 60.02 | 14.63 |
| D4 | 21.36°N | 108.88°E | 31.53 | 30.95 | 8.34 | 8.79 | 99.8 ± 54.8 | 4.74 ± 0.16 | 32.10 | 0.06 | 0.10 | 5.12 | 9.32 |
| D5 | 21.25°N | 108.90°E | 31.08 | 29.00 | 8.17 | 6.60 | 23.1 ± 23.2 | 4.09 ± 0.22 | 45.50 | 0.00 | 0.06 | 2.89 | 6.40 |
| E1 | 21.40°N | 109.10°E | 31.82 | 31.40 | 8.34 | 8.96 | 444.4 ± 107.8 | 5.73 ± 0.33 | 3.00 | 0.08 | 0.03 | 97.50 | 4.31 |
| E2 | 21.35°N | 109.10°E | 31.79 | 31.36 | 8.31 | 8.83 | 166.4 ± 65.7 | 3.58 ± 0.20 | 8.60 | 0.08 | 0.03 | 82.62 | 9.61 |
| E3 | 21.50°N | 109.07°E | 31.79 | 28.46 | 8.24 | 8.29 | 336.0 ± 103.9 | − | − | 0.88 | 0.46 | 11.63 | 24.56 |
| E4 | 21.52°N | 109.04°E | 32.84 | 28.44 | 8.21 | 8.24 | 221.2 ± 79.0 | − | − | 0.73 | 0.57 | 37.64 | 29.62 |
| E5 | 21.51°N | 109.11°E | 32.14 | 28.24 | 8.26 | 9.20 | 146.7 ± 66.2 | − | − | 0.90 | 0.38 | 71.29 | 26.83 |
| F1 | 21.41°N | 109.30°E | 36.85 | 30.92 | 8.32 | 8.93 | 252.0 ± 93.8 | 6.05 ± 0.28 | 3.20 | 0.02 | 0.09 | 5.08 | 2.44 |
| F2 | 21.36°N | 109.30°E | 31.71 | 31.74 | 8.33 | 8.75 | 65.8 ± 48.5 | 4.47 ± 0.11 | 8.60 | 0.07 | 0.11 | 9.35 | 8.35 |
| F3 | 21.32°N | 109.31°E | 31.24 | 31.64 | 8.32 | 8.69 | 280.9 ± 91.0 | 4.33 ± 0.20 | 12.90 | 0.06 | 0.07 | 12.41 | 7.67 |
| F4 | 21.25°N | 109.30°E | 30.81 | 32.71 | 8.10 | 6.60 | 48.2 ± 33.7 | 3.13 ± 0.26 | 20.80 | 0.01 | 0.06 | 0.35 | 3.58 |
| G1 | 21.43°N | 109.49°E | 31.88 | 30.77 | 8.26 | 8.50 | 262.1 ± 89.6 | 5.71 ± 0.19 | 5.00 | 0.05 | 0.13 | 5.49 | 5.62 |
| G2 | 21.40°N | 109.49°E | 31.33 | 31.13 | 8.24 | 8.01 | 237.2 ± 66.2 | 5.45 ± 0.14 | 8.40 | 0.07 | 0.21 | 19.63 | 12.21 |
| G3 | 21.34°N | 109.49°E | 31.56 | 31.90 | 8.30 | 8.23 | 74.3 ± 45.3 | 3.57 ± 0.23 | 15.00 | 0.06 | 0.12 | 4.25 | 8.98 |
| G4 | 21.23°N | 109.49°E | 30.81 | 32.71 | 8.10 | 6.60 | 23.4 ± 23.5 | 3.00 ± 0.29 | 27.20 | 0.01 | 0.06 | 1.59 | 7.09 |
| Note: The parameters of 222Rn and 226Ra are in activity concentrations; the parameters of phosphate, nitrite, nitrate and silicate are in concentrations. − represents no data. | |||||||||||||
 DownLoad:
CSV
DownLoad:
CSV
The apparent diffusion coefficient of seawater is calculated using a one-dimensional advection-diffusion model. The specific principle and method are quoted from Moore (2015).
| $$ {\rm{d}}A/{\rm{d}}t=K_h\frac{{\partial}^2A}{\partial X^2}-u\frac{\partial A}{\partial X}-{ {\text{λ}} }A\pm J , $$ | (1) |
where A is the 222Rn activity concentration (Bq/m3) at the sampling station; Kh is the average value of the eddy diffusion coefficient, h refers to the sampling depth (m) above the pycnocline layer; X is the offshore distance (km); u is the advection velocity (m/s); λ denotes the decay constant (2.09 × 10⁻⁶ s−1) of 222Rn; and J represents other 222Rn input or removal (Bq/(m3·s)).
Wang et al. (2021) noted that strong vertical stratification can render the J input at the bottom negligible, and for nuclides with no scavenging effect, J is omitted. At this time, the system can be regarded as a steady-state condition (Moore, 2000). The appropriate boundary condition is selected: when the offshore distance X = 0 km, A = A0; when the offshore distance X →
| $$ A=A_0{\rm{e}}^{\frac{u-\sqrt{u^2+4{ {\text{λ}} }K_h}}{2K_h}X} . $$ | (2) |
The decay of short half-life nuclides is an important loss item. If the diffusion of nuclides is dominant, the influence of advection can be disregarded.
| $$ A=A_0{\rm{exp}}\left(-X\sqrt{\frac{{ {\text{λ}}}}{K_h}}\right) , $$ | (3) |
| $$ {\rm{ln}}\;A={\rm{ln}}\; A_0-X\sqrt{\frac{{\text{λ}}}{K_h}} . $$ | (4) |
The logarithm of 222Rn activity and the offshore distance are used for linear fitting, and the slope is m.
| $$m=-\sqrt{\frac{{\text{λ}}}{K_h}} . $$ | (5) |
Radon is a radioactive inert gas. Although radon will not be used by organisms or directly affected by environmental conditions, it will diffuse to the atmospheric environment, which is the main loss process of radon in the diffusion process. Therefore, atmospheric loss (−J) cannot be disregarded. The atmospheric diffusion of 222Rn is a gap effect, which is corrected using the following formula:
| $$ J=\frac{F}{h} , $$ | (6) |
where F represents the atmospheric loss fluxes (Bq/(m2·s)) of 222Rn at the air-sea interface, which is converted to the activity change (Bq/(m3·s)) in 222Rn at the air-sea interface by dividing by 2. In this study, a water sampler is employed to collect water samples, and the sampling depth is basically the same (h = 2 m).
The atmospheric loss flux of 222Rn is calculated by the following formula:
| $$\tag{7a} F=k(A-\alpha\cdot A_{\rm{air}}) , $$ |
where k is the atmospheric transmission speed (m/s), which can be obtained from Eq. (7c); and Aair refers to the activity (Bq/m3) of 222Rn in the atmospheric environment, which can be directly detected by a RAD7 radon detector. The average activity of 222Rn in this study is 2.89 Bq/m3; the air-sea distribution coefficient α is obtained according to Eq. (7b):
| $$\tag{7b} \alpha =0.105+0.405{\rm{e}}^{-0.050\;2T} , $$ |
| $$\tag{7c} k_{600}=0.266\times v^2 , $$ |
where k600 is the gas migration rate of carbon dioxide under standard conditions (20℃; Schmidt numbers: Sc = 600); v is wind speed (m/s); and T is the temperature (℃) of the surface seawater.
J is substituted into Eq. (1) to obtain the following formula:
| $$ \frac{{\rm{d}}A}{{\rm{d}}t}=K_h\frac{{\partial}^2 A}{\partial X^2}-u\frac{\partial A}{\partial X}-{{\text{λ}}}A- \frac{k\left(A-\alpha A_{\rm{air}}\right)}{h} . $$ | (8) |
A new boundary condition is selected. When the offshore distance X = 0 km, A = A0. When the offshore distance X →
| $$ m^2K_h-mu=\frac{k}{h}+ {\text{λ}} . $$ | (9) |
If advection u is disregarded, then
| $$ K_h =\dfrac{\dfrac{k}{h}+{{\text{λ}}}}{{m}^2} . $$ | (10) |
If the advection term cannot be disregarded, it is calculated according to the one-dimensional model obtained by Li and Cai (2011).
| $$ u=(L_1^2{{\text{λ}}}_1 -L_2^2{{\text{λ}}}_2)/ (L_2-L_1) , $$ | (11) |
| $$ K_h=L_1^2{{\text{λ}}}_1 +L_1{{\text{λ}}}_1=L_2^2 {{\text{λ}}}_2+L_2{{\text{λ}}}_2 , $$ | (12) |
where L1 and L2 are the reciprocals obtained by linear fitting with the change in offshore distance after a logarithmic change in the corresponding nuclide activity.
| $$ {K}_{h}=\dfrac{\dfrac{k}{h}+\text{λ} +mu}{{m}^{2}} . $$ | (13) |
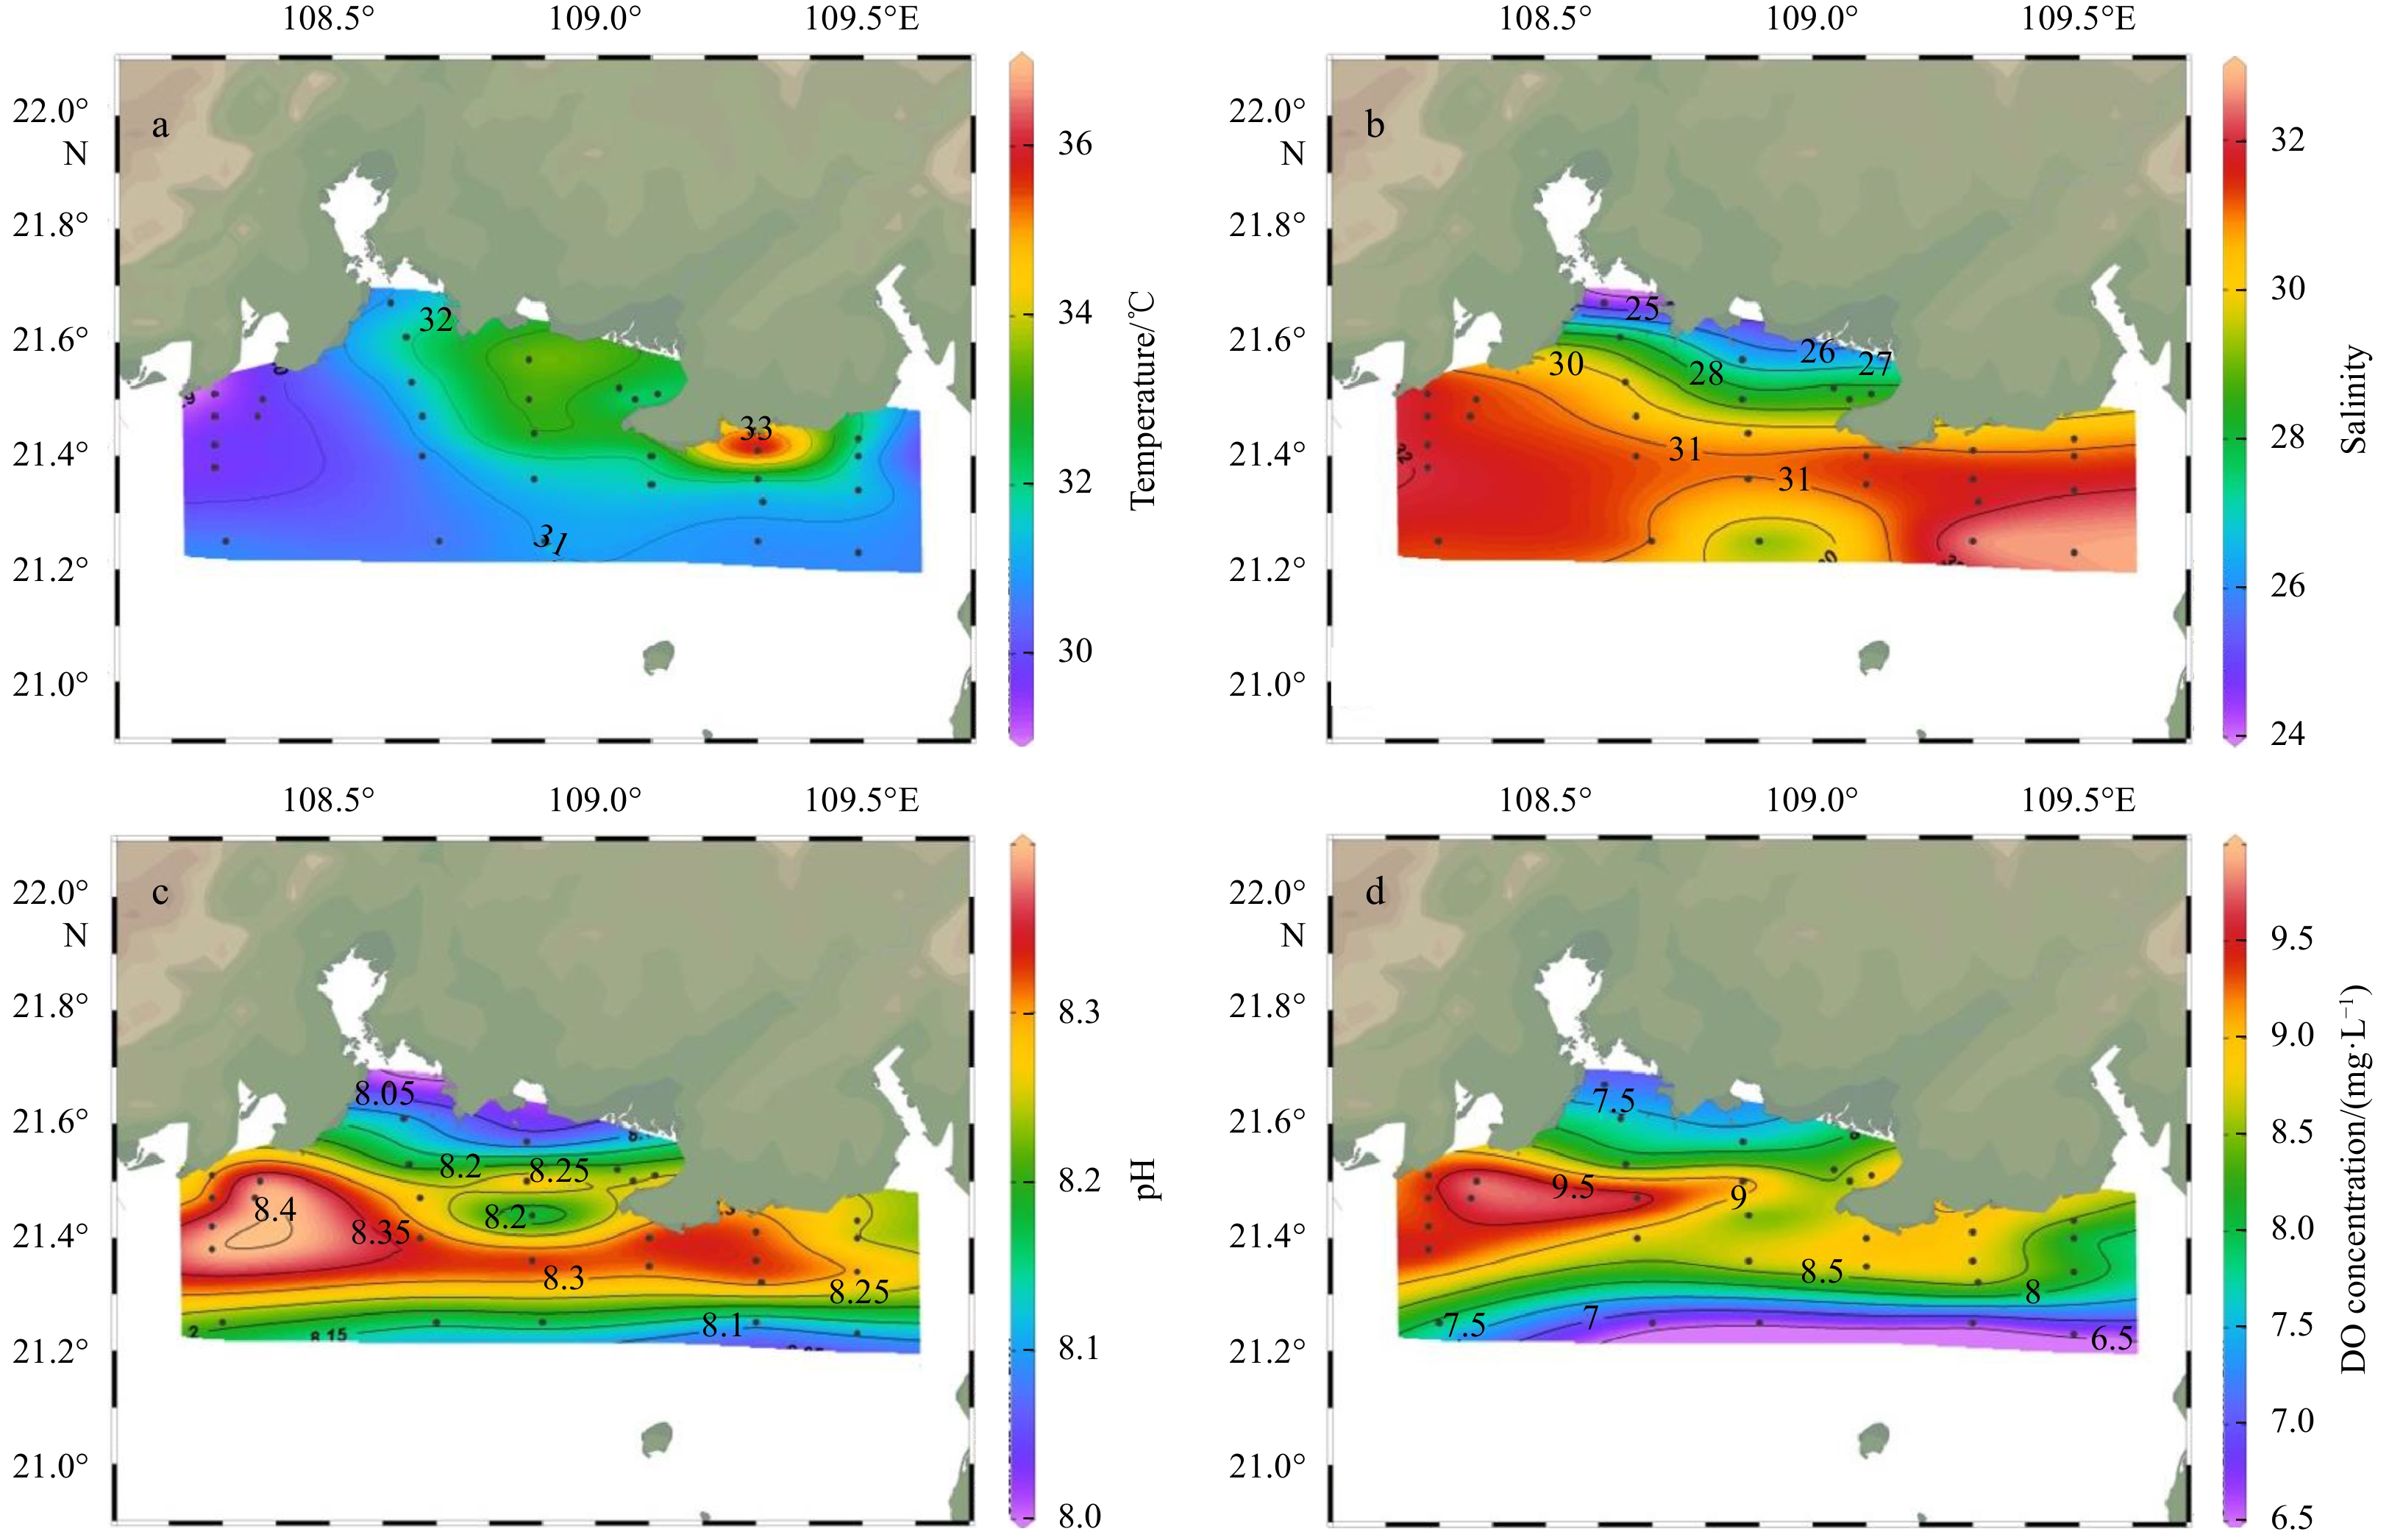
The temperature ranges from 29.08℃ to 36.85℃ (Fig. 2a), and the average temperature is (31.42 ± 0.27)℃ (n = 31). There is a distinct horizontal gradient of the temperature with a decreasing trend toward the offshore region. The surface seawater temperature of coastal waters is relatively high, and the high value area appears near the mangroves of Jinhai Bay in Beihai City, and the estuaries of the Dafeng River and Nanliu River. Because the sampling stations are close to the offshore region, these areas are greatly affected by surface warming, coastal wetlands and upstream runoff. The salinity ranges from 24.24 to 32.71 (Fig. 2b), and the average salinity is 30.43 ± 0.34 (n = 31). The salinity of sea water generally increases from the estuary to the outer bay, which is also a typical characteristic of estuarine and coastal zones (Guo, 2020). Low-value waters appear near the Qinzhou Bay and Sanniang Bay because the Qinzhou River, Dafeng River and other small rivers flow into the shore. The pH range was 8.01−8.40 (Fig. 2c), with an average value of 8.25 ± 0.02 (n = 31).

DO concentrations vary from 6.6 mg/L to 9.92 mg/L (Fig. 2d), with an average value of 8.44 ± 0.18 (n = 31). The DO concentration of surface seawater in offshore waters is relatively high, and there are high value areas near the Bailong Peninsula and the Silver Beach of Beihai. The DO concentrations show a decreasing trend with increasing offshore distance.
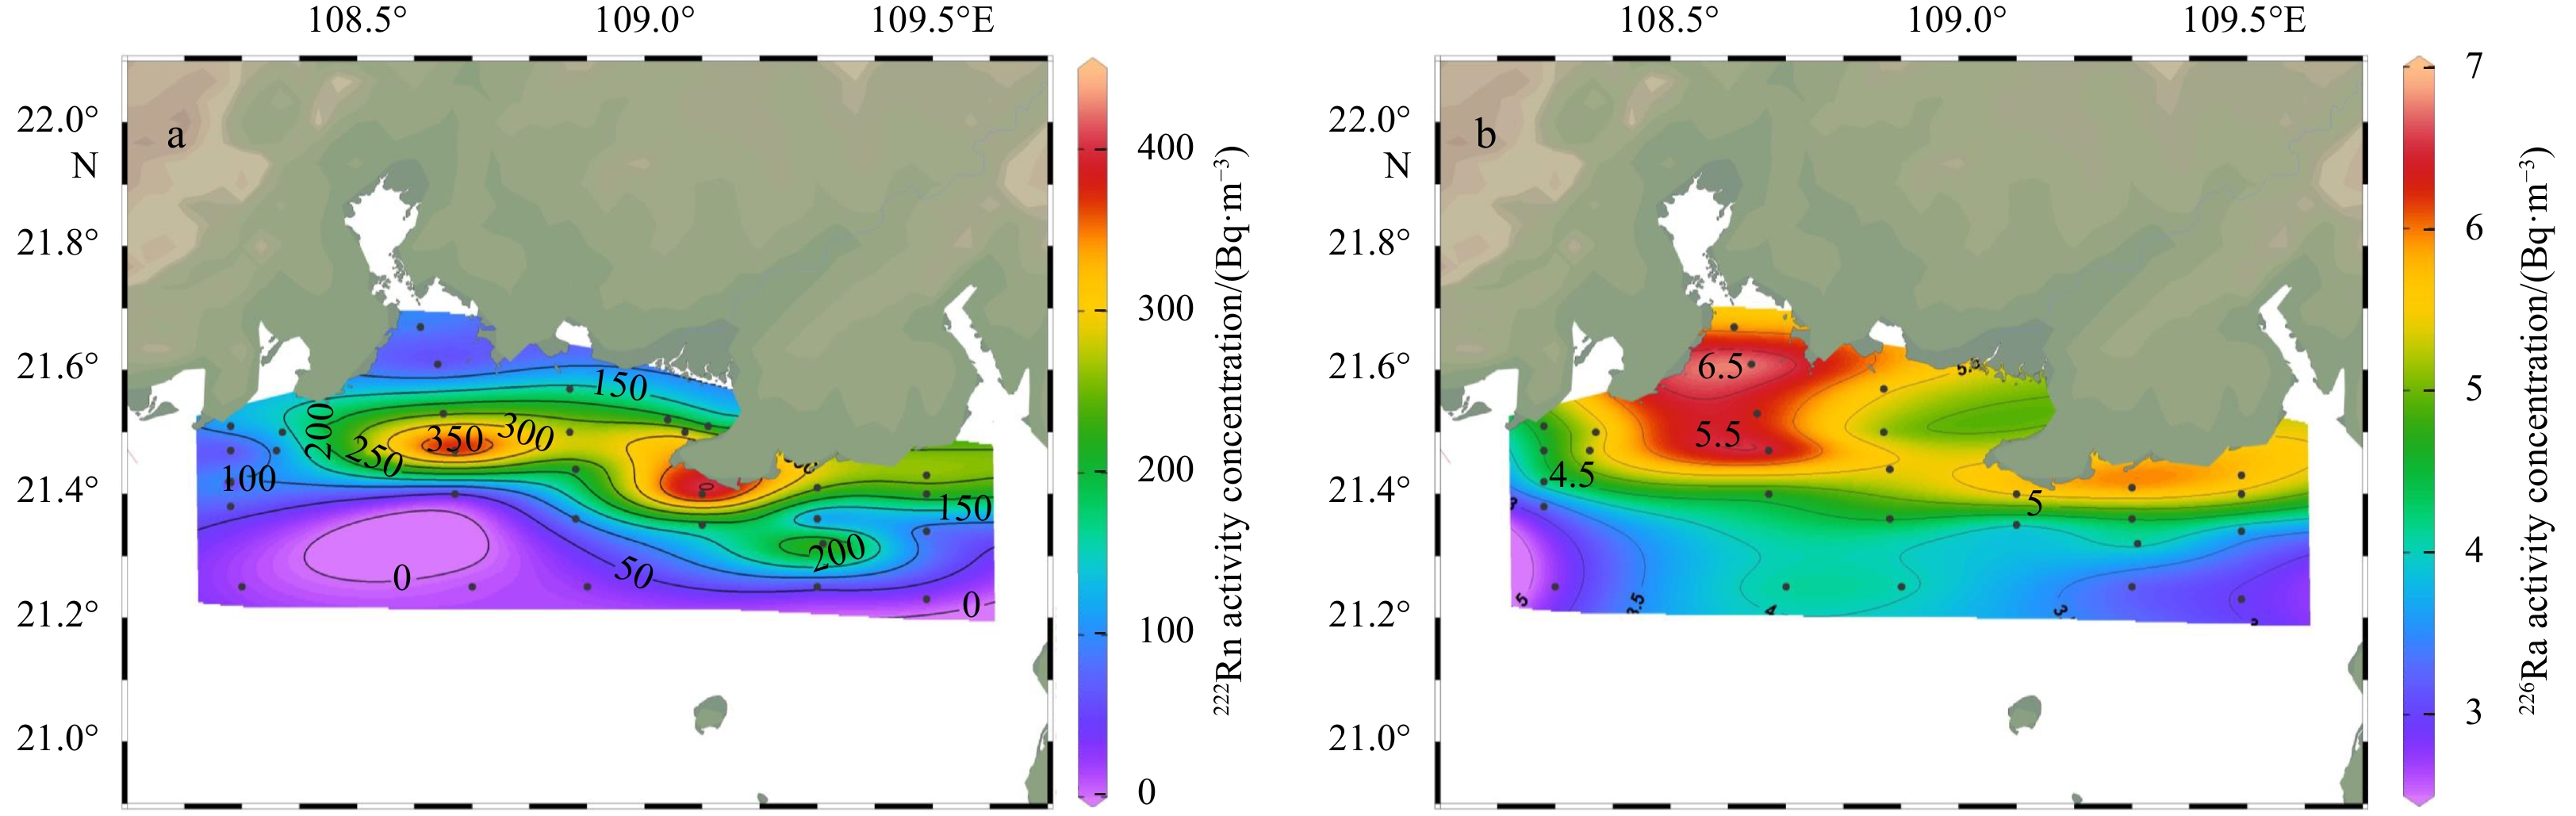
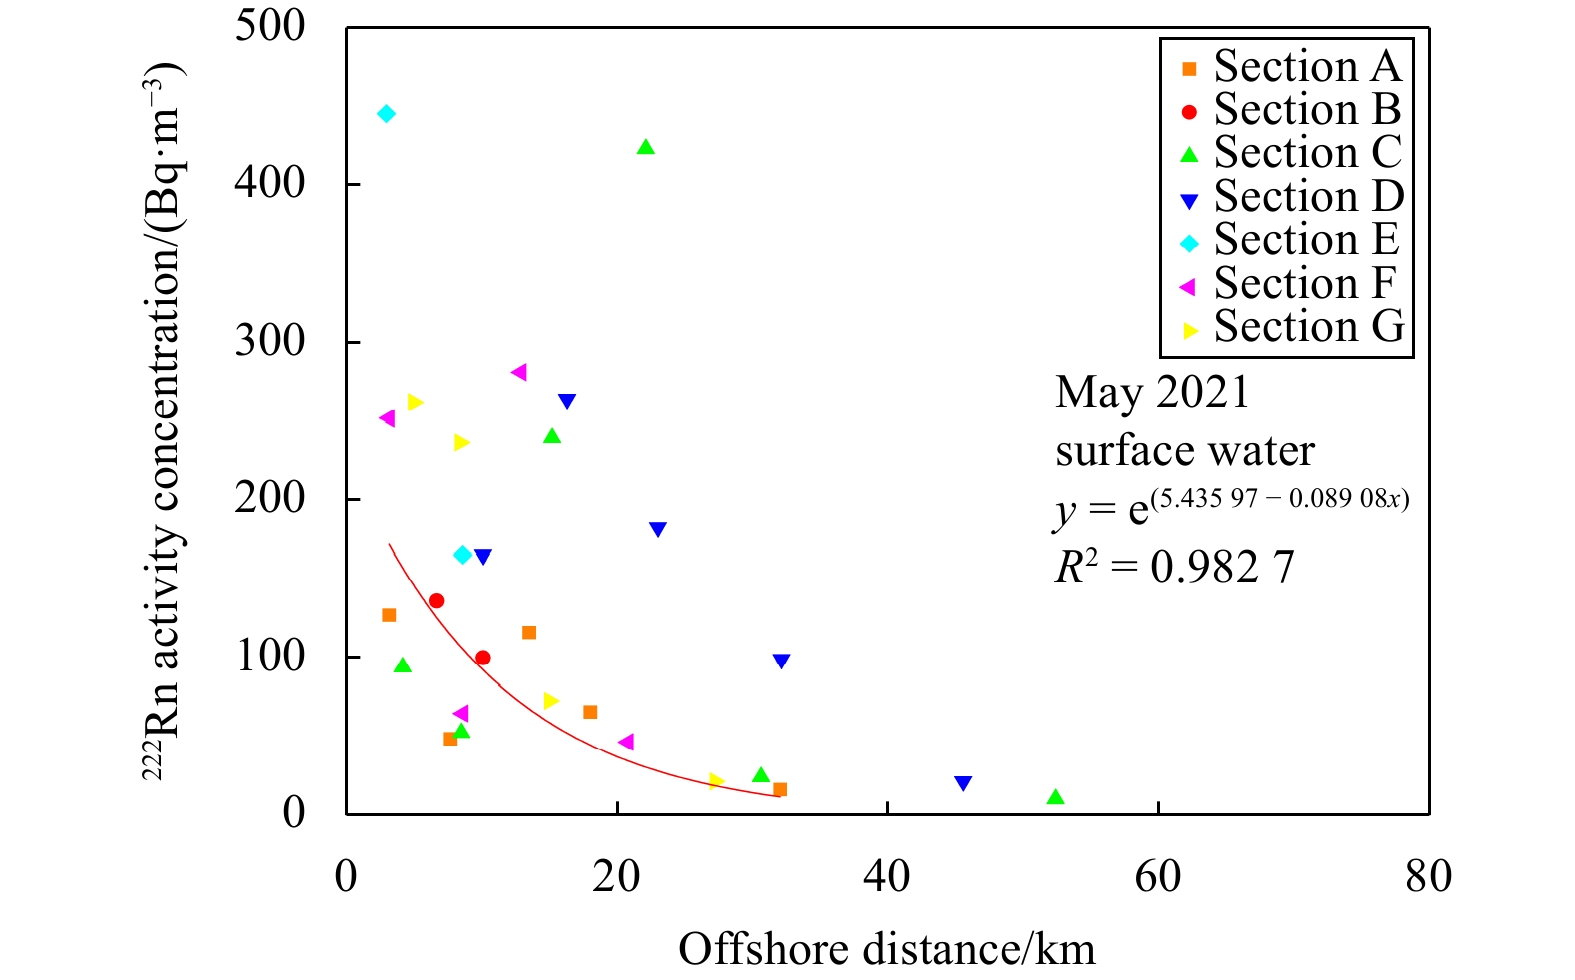
In May 2021, the surface seawater activity of 222Rn in the study area of the Beibu Gulf ranged from 0 Bq/m3 to 444 Bq/m3, with an average concentration of (153 ± 61) Bq/m3 (n = 31) (Fig. 3a). Overall, 222Rn activity decreases with increasing offshore distance, which is similar to the results of other research areas (Moore, 1998). The high value areas of 222Rn activity in surface water were mainly at 21.5°N, which is located at the mouth of Qinzhou Bay and extends outward perpendicular to the shoreline ((422 ± 111) Bq/m3), and the area near the Silver Beach of Beihai ((444 ± 108) Bq/m3). The estuaries of the Dafeng River, Nanliu River and Tieshan Port of Beihai also have high 222Rn activity concentrations (Figs 1 and 3). Low 222Rn activity concentration (below 50 Bq/m3) is mainly distributed in the southern area at approximately 21.3°N.

The activities of 226Ra in the surface seawater in the study area range from 3.00 Bq/m3 to 6.97 Bq/m3 (Fig. 3b), with an average concentration of (4.79 ± 0.22) Bq/m3 (n = 24).
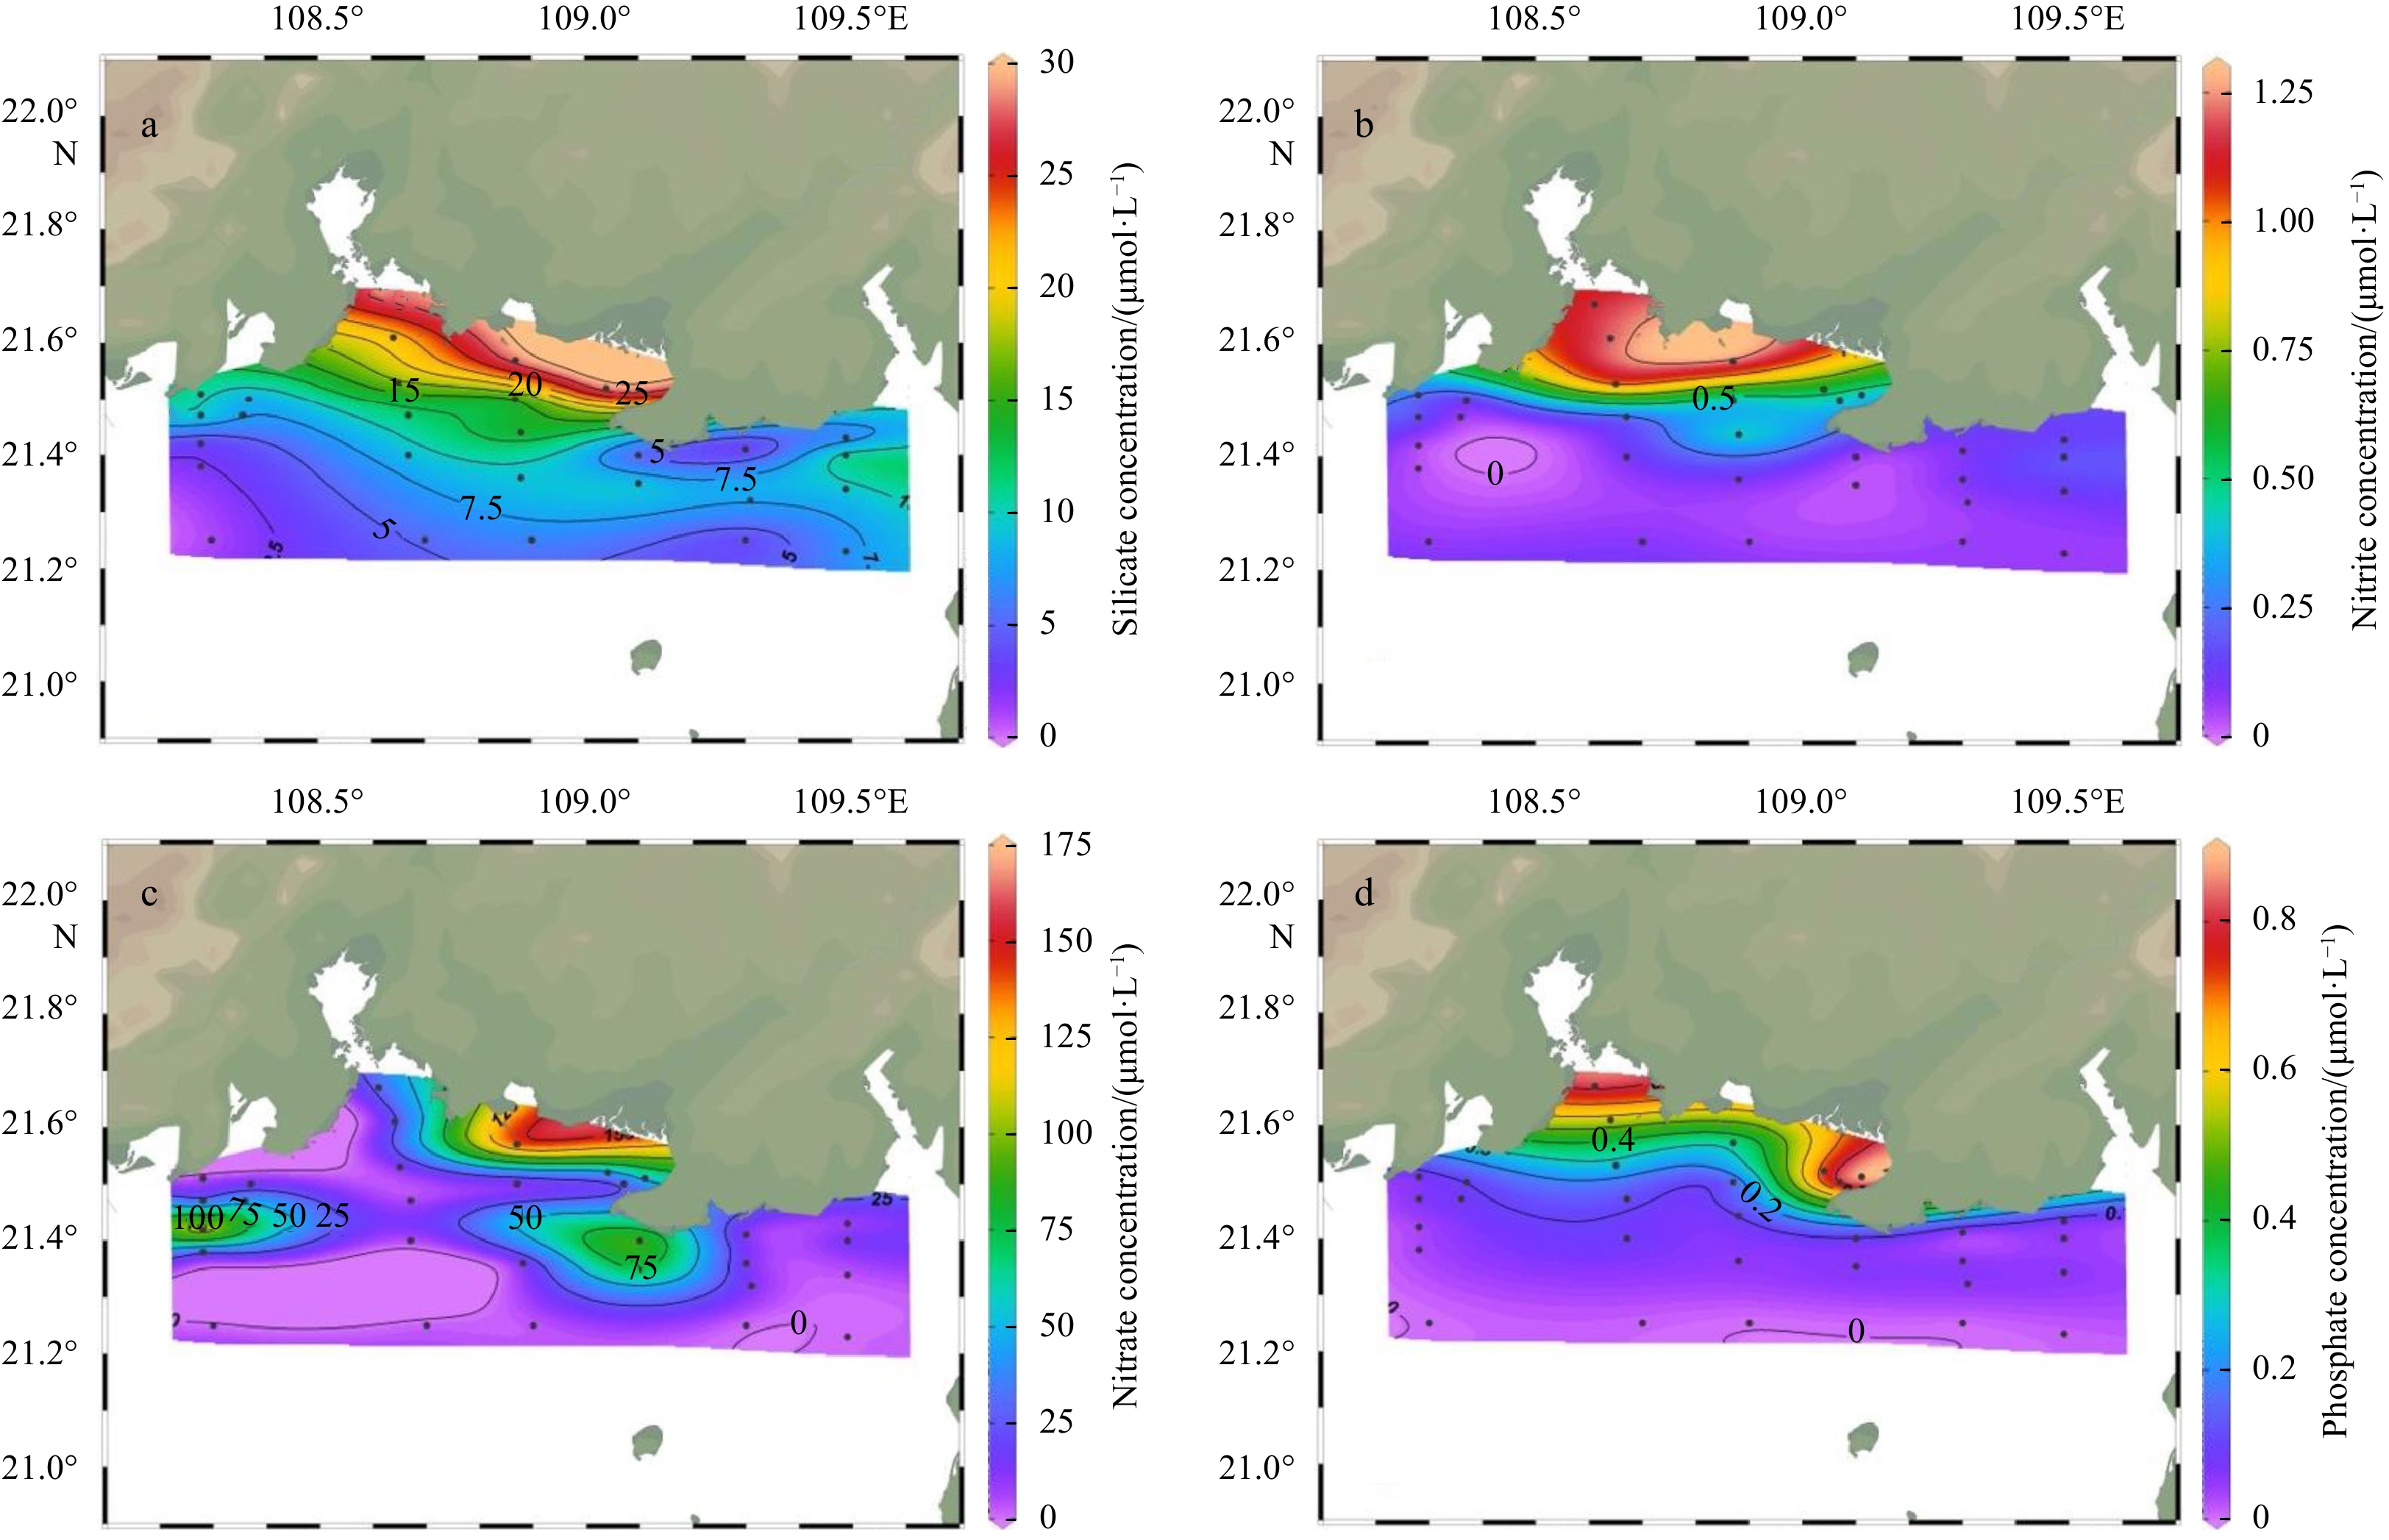
The concentration of nitrite ranged from 0.03 μmol/L to 1.27 μmol/L (Fig. 4b), with an average concentration of (0.30 ± 0.07) μmol/L (n = 31). The nitrate concentration ranged from 0.35 μmol/L to 157 μmol/L (Fig. 4c), with an average concentration of (28.74 ± 7.23) μmol/L (n = 31). The phosphate concentration ranged from 0.002 μmol/L to 0.878 μmol/L (Fig. 4d), with an average concentration of (0.19 ± 0.05) μmol/L (n = 31). The concentration of silicate ranged from 1.07 μmol/L to 29.62 μmol/L (Fig. 4a), and the average concentration was (11.51 ± 1.49) μmol/L (n = 31). Overall, the nutrient concentrations showed higher values in the Qinzhou Bay and Lianzhou Bay and a decreasing trend toward the offshore region. It is speculated that this finding may be related to nutrients discharged from marine fisheries (oyster culture) in local ports. In addition, the Qinzhou Bay and Lianzhou Bay have inputs from the Qinjiang River, Maoling River, Dafeng River and Nanliu River, and the nutrient concentration is similar to the variation trend in runoff (Wu, 2014). The river basin is broad, passes through the urban area and is significantly affected by surrounding industrial construction and human activities. The river carries high concentrations of nutrients into the ocean, which has a significant impact on coastal waters (Li et al., 2015, 2018). In particular, the nitrate concentration in the waters near Silver Beach and Bailong Peninsula in Beihai, showed a high value area, while the silicate showed a low value area. Combined with Figs 2c and d, it was determined that the waters showed a high pH value and high DO concentration, which may be attributed to the existence of nutrient limiting factors that potentially limit the growth of phytoplankton (Wu, 2014). If phytoplankton photosynthesis is dominant, CO2 is absorbed, resulting in an increased pH of water, and O2 is produced, which increases DO. In general, the high nutrient concentration was mainly concentrated in the coastal sea area of the study area, and mainly distributed in the bay mouth and river estuary sea area.

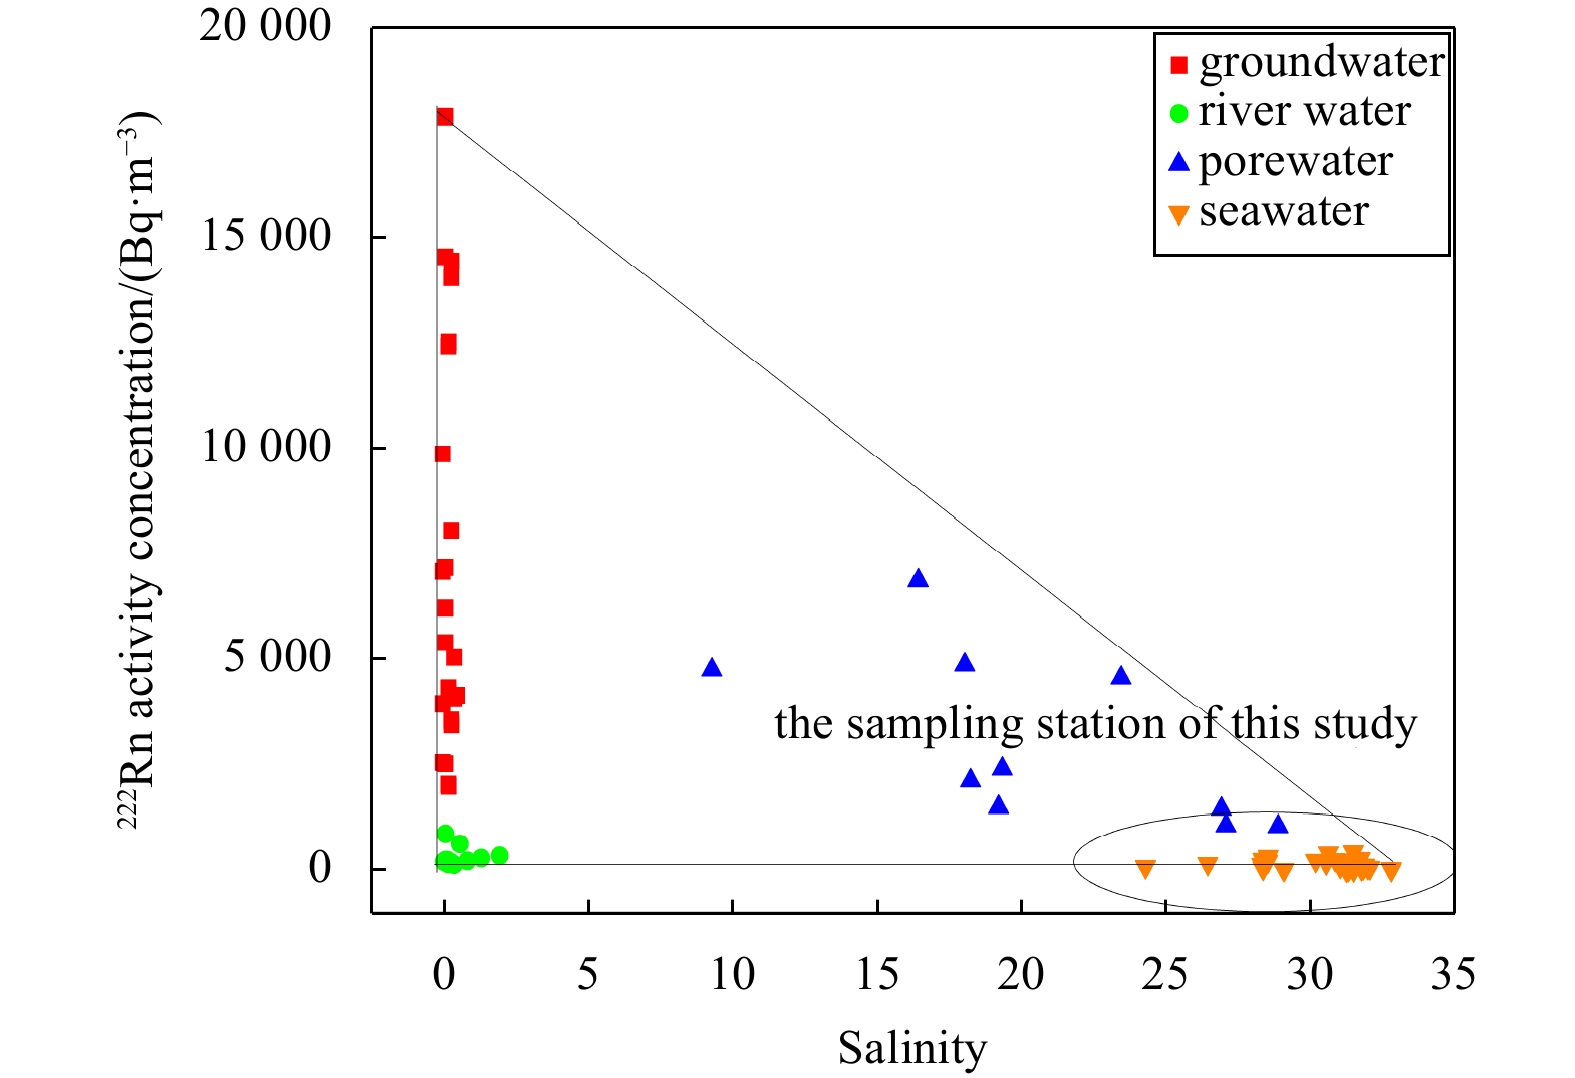
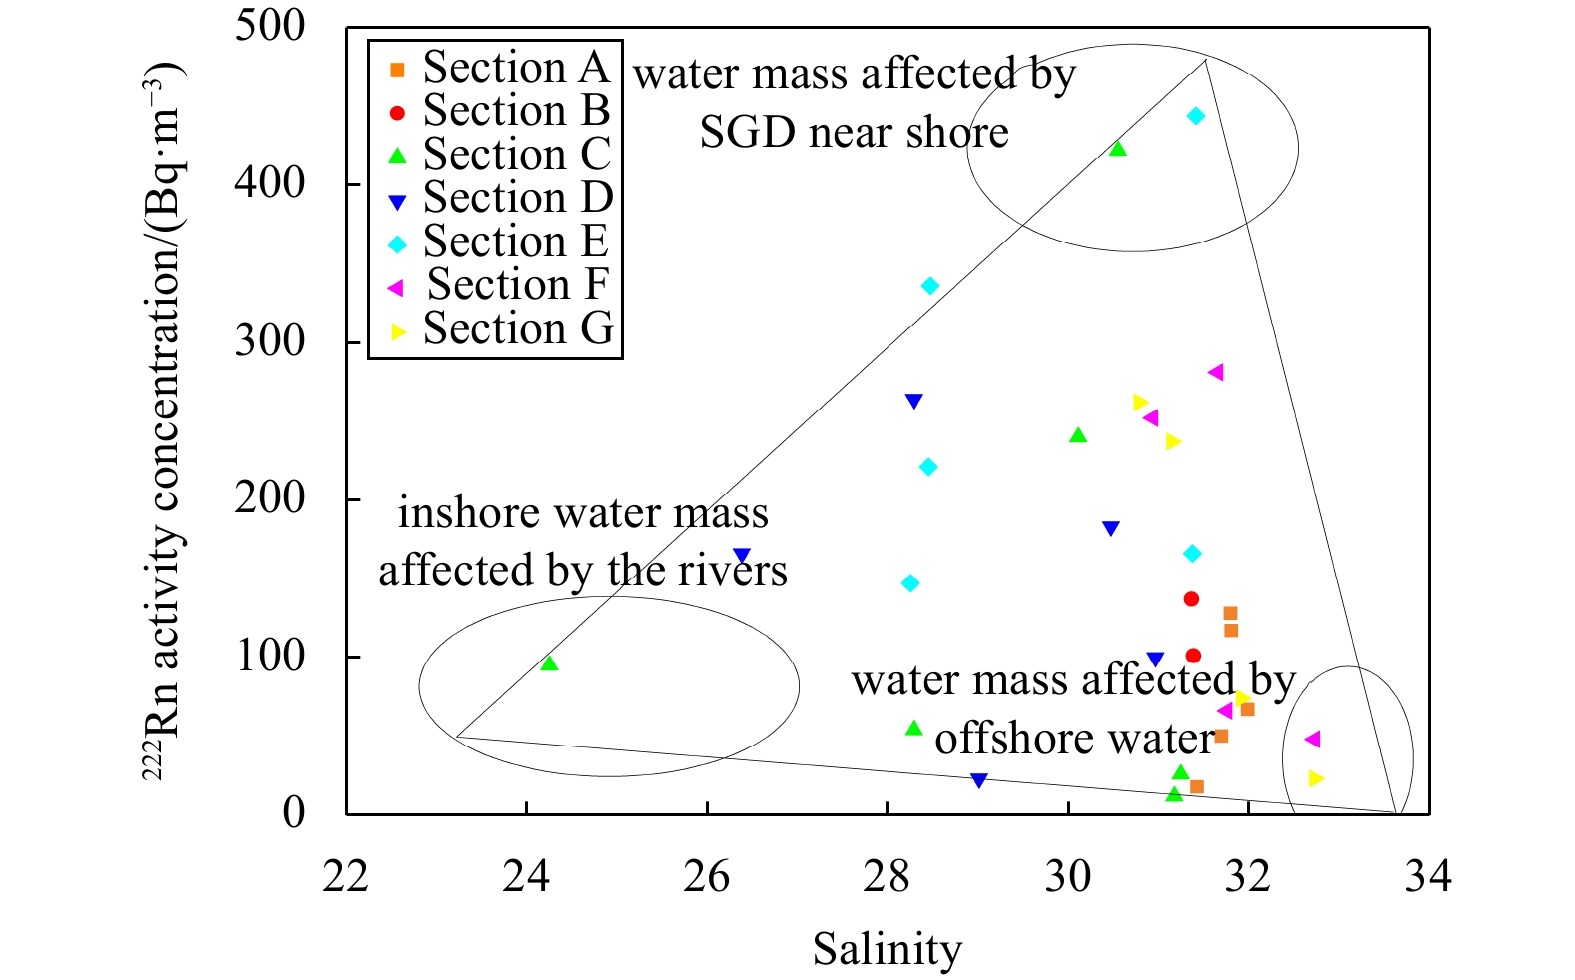
When applying 222Rn to trace the movement of water, it is necessary to identify its source-sink pattern in the study region. The sources mainly include surface runoff input, SGD, decay of 226Ra, and sediment diffusion, while its loss terms mainly include its own decay, atmospheric evaporation, and mixing of seawater (Chen et al., 2018a; Colbert et al., 2008; Zhang et al., 2016). Due to the nature of escaping to the atmosphere, its own decay and other factors, 222Rn usually exhibits the following order in natural aquatic systems: fresh underground water (well water) > porewater > river water > near-shore seawater > offshore seawater (Chen et al., 2018a; Zhang et al., 2016). 222Rn in coastal seawater may be greatly affected by SGD and surface runoff (Chen et al., 2018a; Zhang et al., 2016).
The plot of 222Rn vs. salinity (Figs 5 and 6) provides further evidence for its main sources in the study region. The 222Rn activity was lowest at the offshore stations with the highest salinity, which is a typical characteristic of seawater samples. The lowest salinity samples exhibited medium 222Rn activity, indicating the influence of riverine discharge. In contrast, the highest 222Rn occurred in nearshore samples with salinities of 30−32. However, relatively higher 222Rn activity (compared to offshore seawater) appears in the sea near the Qinzhou Bay and Beihai Silver Beach. 222Rn activities in pore water were relatively higher ((1.06−6.85) × 103 Bq/m3) along the coast of Beibu Gulf (Chen et al., 2018a, b; Wang, 2020). It is speculated that the reason for this higher value may be the input of submarine groundwater discharged from nearby coastal wetlands due to tidal rise and fall by coastal currents.


In addition, sediment diffusion and radium decay could also contribute to 222Rn. 226Ra, as the parent of 222Rn, has particle desorption properties in saltwater environment. In subterranean estuaries, where the geochemistry is complex, the desorption process of radium also contributes to the change in 222Rn activity in seawater (Zhong et al., 2023). Reportedly, the activity of 226Ra in water bodies in estuaries reaches a maximum between salinities of 13 and 25, after which the activity gradually decreases due to the dilution of seawater (Zhong et al., 2023). Thus, it is possible to use Rnex activity = 222Rn activity − 226Ra activity to calibrate the 222Rn provided by 226Ra. The sediment diffusion fluctuations were steady and negligible. According to previous studies, the inventory of sediment diffusion is usually less than 1% and can be disregarded (Berelson et al., 1982; Martens et al., 1980; Zhang et al., 2016). In our study, the inventory of sediment diffusion on the northern coast of the Beibu Gulf was also disregarded.
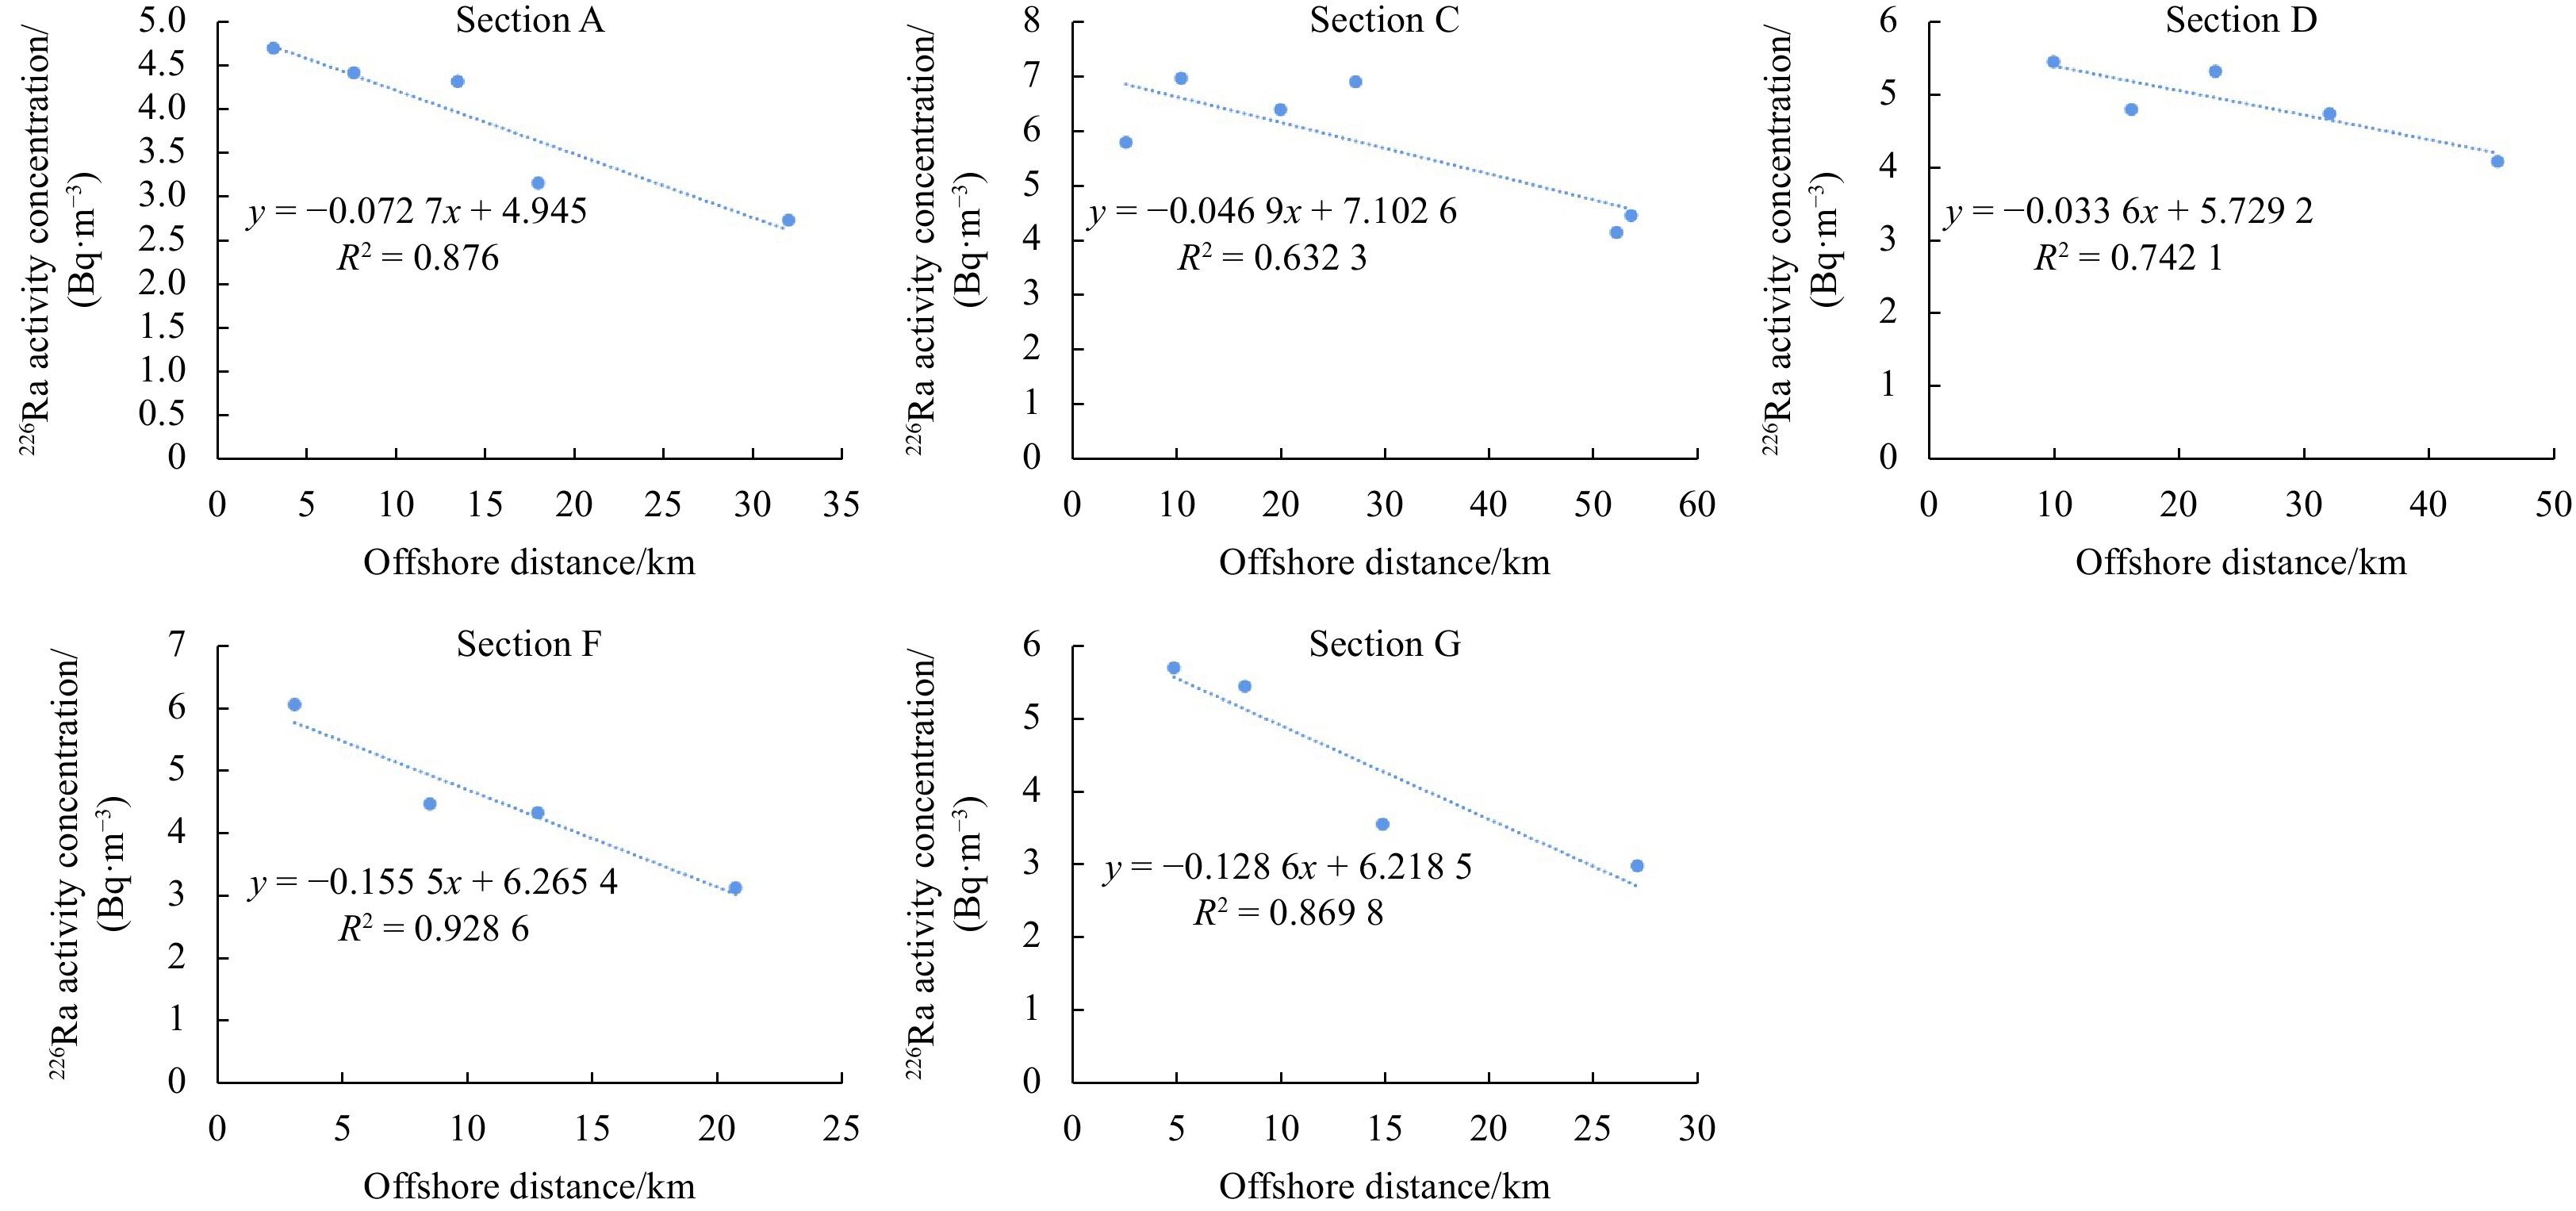
After the introduction of a high radon water mass near shore, it further affects other sea areas by diffusion, advection and other movements. Combined with the distribution characteristics of salinity in Fig. 2b, it is observed that the salinity of nearshore surface seawater significantly changes, indicating the impact of the mixing process on the distribution of the sea water mass. The activity of 222Rn in surface seawater exponentially decreases with increasing offshore distance (Fig. 7), with the most pronounced decrease within 50 km of the coastline. The activity of 226Ra in the surface seawater of each section selected in this study linearly decreased with increasing offshore distance (Fig. 8). Thus, the short-lived isotopes (222Rn) followed a log-linear distribution of activity, while the long-lived isotopes (226Ra) followed a linear-linear distribution within 50 km of the shoreline. A similar phenomenon was also observed in other studies, while the distribution may be controlled by eddy diffusion, and offshore advection can be negligible (Su et al., 2013; Wang et al., 2021; Moore, 2000).


In addition to the sources of 222Rn described above, the loss terms also affect the level distribution of 222Rn and the accuracy of the calculation. The main losses of 222Rn in this study are due to its own decay and atmospheric escape. 222Rn diffuses from the ocean to the atmosphere through the sea-air interface, especially in the presence of more pronounced atmospheric motion. In the case of 222Rn tracing seawater horizontal migration processes with large spatial and temporal scales, the atmospheric diffusion and self-decay terms cannot be disregarded, and the accuracy of the results needs to be improved by correcting these two processes with Eq. (8).
The northern bay can be regarded as a semienclosed system with possible disturbances from lateral inputs other than currents, which often limits the application of the one-dimensional model. However, 222Rn shows a significant decreasing trend with increasing distance offshore, which suggests that the lateral input of 222Rn from other sources to the surface seawater in the study sea is limited, especially in the sea within 50 km from the coast. Therefore, the lateral input of 222Rn in this study could be disregarded. In addition to the lateral input, the 222Rn of surface seawater may also have a vertical input. However, some studies have shown that the horizontal and vertical vortex diffusion coefficients differ by several orders of magnitude. Previous studies have indicated that the amount of radon transported by vertical diffusion is very small (Su et al., 2013; Wang et al., 2021). Following these studies, the effect of vertical eddy diffusion is disregarded in this study.
The 222Rn-based apparent eddy diffusion coefficients of water bodies in the horizontal direction were estimated after correction of each 222Rn source-sink pattern using the eddy diffusion model. As shown in Table 2, if the influence of the atmospheric loss term and advection term in the 222Rn tracer diffusion process is not considered, then the average value of the eddy diffusion coefficients of Sections A, C, D, F, and G is (0.38 ± 0.08) ×108 m2/d according to Eq. (5). If the atmospheric loss term of the 222Rn tracer diffusion process is corrected according to Eq. (10), the average value of the eddy diffusion coefficient Kh for five sections A, C, D, F and G is (1.21 ± 0.30) ×108 m2/d. These results indicated that the Kh estimated by considering atmospheric loss is 3.2 times that estimated by disregarding atmospheric loss, which reflected the importance of the atmospheric loss of 222Rn.
| 222Rn ( considering without u and J) | Combined 222Rn and 226Ra | 222Rn (considering J) | 222Rn ( considering u and J) | |||||||
| Slope | R2 | Kh/(108 m2·d−1) | Kh/(108 m2·d−1) | u/(m·d−1) | Kh/(108 m2·d−1) | Kh/(108 m2·d−1) | ||||
| Section A | −0.07 | 0.821 9 | 0.39 | 0.55 | −1 106 | 2.10 | 2.13 | |||
| Section C | −0.05 | 0.413 7 | 0.60 | 0.73 | −743 | 1.69 | 1.72 | |||
| Section D | −0.07 | 0.802 5 | 0.42 | 0.46 | −328 | 0.80 | 0.81 | |||
| Section F | −0.07 | 0.328 9 | 0.35 | 0.67 | −2 410 | 1.04 | 1.12 | |||
| Section G | −0.12 | 0.979 0 | 0.12 | 0.17 | −518 | 0.41 | 0.42 | |||
| Mean | − | − | 0.38 ± 0.08 | 0.52 ± 0.10 | − | 1.21 ± 0.30 | 1.24 ± 0.31 | |||
| Note: Kh is the average value of the eddy diffusion coefficient, h refers to the sampling depth (m) above the pycnocline layer; u is the advection velocity (m/s); J is other 222Rn input or removal (Bq/(m3·s)); slope is the log-linear slope; R2 is the linear correlation coefficient; − represents no data. | ||||||||||
DownLoad:
CSV
The eddy diffusion coefficient is very sensitive to the effect of advection and is related to the advection velocity (Su et al., 2013; Wang et al., 2021; Moore, 2015; Li and Chen, 2011). Li and Cai (2011) developed a new one-dimensional advection-diffusion model to illustrate the effect of advection on diffusion: the offshore flow increases the eddy diffusion coefficient, while the onshore flow decreases the eddy diffusion coefficient. According to Eqs (11) and (12) and by using 222Rn and 226Ra, the average value of the eddy diffusion coefficient Kh for Sections A, C, D, F, and G is estimated to be (0.52 ± 0.10) ×108 m2/d. The obtained advection results are substituted into Eq. (13) to correct for both atmospheric losses and the advection effects of 222Rn during diffusion. Then, the average value of the eddy diffusion coefficient Kh for Sections A, C, D, F, and G is estimated to be (1.24 ± 0.31) ×108 m2/d, which is 3.3 times more than that of Kh obtained by disregarding both atmospheric losses and advection effects but is similar to that of Kh obtained by considering only atmospheric losses, indicating that advection effects have some influences on the 222Rn tracer diffusion process, while the primary influence is from the atmospheric loss term.
Further, we collected the horizontal vorticity diffusion coefficients in different global sea areas, which varied by several orders of magnitude (0.000 5−8.64) ×108 m2/d (Table 3 and references therein). Possible reasons include the change in hydrological conditions (water depth, wind speed, and velocity) in different sea areas worldwide, the differences in sampling analysis among different research teams (sampling time and offshore distance of the transect), and the differences in tracer methods (Wang et al., 2021). The results of this study are on the same order of magnitude as those of other gulf types within the global Kh variation range.
| Study area | Methods | Season | Kh/(108 m2·d−1) | Reference |
| Laizhou Bay | 224Ra | wet season | 2.53 | Wang et al. (2016) |
| East China Sea | 224Ra | wet season | 2.93 | Men et al. (2011) |
| dry season | 3.36 | Men et al. (2011) | ||
| Taiwan Strait | 224Ra | dry season | 2.16 | Men et al. (2013) |
| South Atlantic Bight | 223Ra, 224Ra | wet season | 0.31−0.36 | Moore (2000) |
| Yellow Sea | 223Ra, 224Ra, 226Ra | wet season | 2.53 | Su et al. (2013) |
| Long Island Sound | 224Ra | wet season | 0.004−0.043 | Torgersen et al. (1996) |
| San Diego to northwest of Hawaii | 226Ra | wet season | 0.09 | Chung (1976) |
| Northeast Pacific | 226Ra, 228Ra | − | 0.09 | Huh and Ku (1998) |
| − | 4.32 | Huh and Ku (1998) | ||
| East China Sea | 226Ra, 228Ra | wet season | 0.004 | Su (2013) |
| wet season | 2.22 | Su (2013) | ||
| Eastern Pacific Ocean | 226Ra, O2 and salinity | wet season | 0.86 | Ku et al. (1980) |
| Western Bay of Bengal | 226Ra, 228Ra | − | 0.86−8.64 | Rengarajan et al. (2002) |
| Cross-shelf of the Bering Sea | 228Ra | wet season | 1.90 | Xing et al. (2011) |
| Sub-Arctic waters | 228Ra | − | 0.43−0.86 | Moore et al. (1980) |
| World ocean | 228Ra | − | 0.86−8.64 | Kaufman et al. (1973) |
| Seto Inland Sea | 228Ra | dry season | 0.095−0.12 | Kasemsupaya et al. (1993) |
| Western Yellow Sea | 228Ra | wet season | 2.51 | Men et al. (2006) |
| Southeastern Bering Sea | salt balance | wet season | 0.86 | Coachman and Walsh (1981) |
| Middle Atlantic Bight | current meter and remotely sensed data | dry season | 0.026 | Fischer (1980) |
| Western Long Island Sound | 222Rn | wet season | >0.04 | Torgersen et al. (1997) |
| Catalina Harbor | 222Rn | wet season | 0.0005 | Colbert et al. (2008) |
| San Nicolas Basin | 222Rn | wet season | 0.0086 | Berelson et al. (1982) |
| Yellow-Bohai Sea | 222Rn | wet season | 3.92 | Wang et al. (2021) |
| dry season | 1.97 | Wang et al. (2021) | ||
| Beibu Gulf | 222Rn | dry season | 0.42−2.13 | this study |
| Note: Kh is the average value of the eddy diffusion coefficient, h refers to the sampling depth (m) above the pycnocline layer; − represents no data. | ||||
DownLoad:
CSV
Assuming that the flux of each section represented the profile of a section of the shoreline, and the diffusion flux of 222Rn can be obtained by the 222Rn activity gradients multiplied by the boundary seepage area (Moore, 1998; Colbert et al., 2008; Swarzenski and Izbicki, 2009). In this study, three sections (A, D and G) showed significant correlations between activity and distance. Assuming that the water body in the study area is evenly distributed, each section extends to the mixed layer with a length of 140 km (Google Earth) and a sampling depth of 5 m. The vorticity diffusion coefficients of the three sections (Kh) were multiplied by the concentration gradient and then multiplied by the size of the mixing layer (S) to obtain the offshore fluxes of 222Rn (FRn, mol/d) under the influence of horizontal vorticity diffusion,
| $$ {F}_{\mathrm{R}\mathrm{n}}\text=\;{{K}}_{{h}}\;\text{×} \;\text{Δ}A\text{}\;\text{×}\;\text{}\text{S} . $$ | (14) |
The offshore fluxes of 222Rn of three sections (A, D and G) were 2.98 ×10¹² Bq/d, 2.30 ×10¹² Bq/d and 1.47 ×10¹² Bq/d, respectively, with an average flux of (2.24 ± 0.44) ×1012 Bq/d (Table 4).
| Section | R2 | Kh/(108 m2·d−1) | ΔA/(Bq·(m3·m)−1) | FRn/(1012 Bq·d−1) |
| A | 0.821 9 | 2.13 | 0.02 | 2.98 |
| D | 0.802 5 | 0.81 | 0.04 | 2.30 |
| G | 0.979 0 | 0.42 | 0.05 | 1.47 |
| Mean | − | − | − | 2.24 ± 0.44 |
| Note: Kh is the average value of the eddy diffusion coefficient, h refers to the sampling depth (m) above the pycnocline layer; A is the 222Rn activity concentration at the sampling station; FRn: the offshore fluxes of 222Rn; R2: the linear correlation coefficient. | ||||
DownLoad:
CSV
To determine the primary sources of 222Rn, we further estimated the average input flux of 222Rn from rivers in the study area (26.54×10¹⁰ mol/d) by multiplying the average annual discharge of coastal terrestrial rivers in the study area by the 222Rn concentration near zero salinity (Table 5). The results indicated that the offshore fluxes of 222Rn are 8.44 times that of the river input fluxes. Thus, surface runoff is not the primary source of 222Rn in the coastal waters of the northern coast of the Beibu Gulf. We speculated that SGD is the most influential factor in the distribution of 222Rn in the surface seawater in this study area, which is consistent with the information derived from the 222Rn and salinity relationship (Fig. 5).
| River | Mean annual discharge/ (109 m3) | Fresh water endmember 222Rn/(Bq·m−3) | Average daily emission flux of 222Rn/ (1010 Bq·d−1) |
| Beilun | 29.40a | 1 859 ± 212c | 14.97 ± 1.71 |
| Jiangping | 7.67b | 640 ± 122c | 1.34 ± 0.26 |
| Fangcheng | 17.86a | 886 ± 149c | 4.34 ± 0.73 |
| Maoling | 16.20a | 234 ± 80c | 1.04 ± 0.36 |
| Qinjiang | 11.53a | 250 ± 80c | 0.79 ± 0.25 |
| Dafeng | 6.05a | 218 ± 86c | 0.36 ± 0.14 |
| Nanliu | 53.13a | 254 ± 74c | 3.70 ± 1.08 |
| Total river input flux | 141.84a | − | 26.54 ± 4.52 |
| Note: Fresh water endmember 222Rn parameter is in activity concentration. − represents no data. a data cited from Wu (2014); b data cited from Wang (2020); c data are from this study. | |||
DownLoad:
CSV
Water mixing provides a pathway for the nutrient transport required by phytoplankton organisms. In this study, the concentration gradients of nutrients (ι, mol/(m3·m)) in five sections of the study area with considerable variation were calculated and multiplied by the value of the horizontal eddy diffusion coefficient Kh to obtain the nutrient fluxes under the influence of diffusion processes, which is the diffusion flux of nutrients (Fnutri, mol/(m2·d)). Fnutri was calculated as follows:
| $$ F_{\rm{nutri}} = K_h\times \iota . $$ | (15) |
Then the horizontal transport fluxes of nutrients can be calculated by following formula (Su, 2013):
| $$ {\rm{Flux}} ({\rm{mol}}/({\rm{m}}^2\cdot {\rm{d}})) = F_{\rm{nutri}}({\rm{mol}}/({\rm{m}}^2\cdot {\rm{d}})) \times {\rm{MLS}} ({\rm{m}}^2) /{\rm{SA}} ({\rm{m}}^2), $$ | (16) |
where MLS represents the size of the mixing layer (m2), SA is the size of the entire study area (m2). The horizontal eddy diffusion is assumed to extend to the nearshore mixed layer of approximately 140 km in length and 5 m in depth. Assuming that the horizontal transport of nutrients is uniformly distributed throughout the study area (area of approximately 5.85 × 10⁹ m2, Google Earth). The nutrient fluxes are 6.28 × 10⁻³ mol/(m2·d) (silicate), 0.10 ×10⁻³ mol/(m2·d) (phosphate), 0.20 × 10⁻³ mol/(m2·d) (nitrite), and 4.15 ×10⁻³ mol/(m2·d) (nitrate) (Table 6). The horizontal transport fluxes of nutrients may be overestimated because the biological uptake and removal effects of sinking particles on nutrients were not considered.
| Kh/(108 m2·d−1) | Silicate Fnutri/ (mol·m−2·d−1) | Phosphate Fnutri/ (mol·m−2·d−1) | Nitrite Fnutri/ (mol·m−2·d−1) | Nitrate Fnutri/ (mol·m−2·d−1) | |
| Section A | 2.13 | 70.51 | 0.46 | 1.31 | 35.11 |
| Section C | 1.72 | 77.53 | 2.91 | 3.77 | 94.32 |
| Section D | 0.81 | 50.77 | 0.67 | 2.79 | 6.61 |
| Section F | 1.12 | 43.96 | 0.09 | 0.19 | 30.19 |
| Section G | 0.42 | 11.29 | 0.08 | 0.13 | 7.30 |
| Mean | 1.24 ± 0.31 | 50.81 ± 11.64 | 0.83 ± 0.53 | 1.64 ± 0.72 | 34.71 ± 15.99 |
| Mixed layer area/m2 | 7.00 × 10⁵ | 7.00 × 10⁵ | 7.00 × 10⁵ | 7.00 × 10⁵ | 7.00 × 10⁵ |
| Study area/m2 | 5.85 × 10⁹ | 5.85 × 10⁹ | 5.85 × 10⁹ | 5.85 × 10⁹ | 5.8 × 10⁹ |
| Flux | − | 6.28 × 10⁻³ | 0.10 × 10⁻³ | 0.20 × 10⁻³ | 4.15 × 10⁻³ |
| Note: Fnutri diffusion flux of nutrients; − represents no data. | |||||
DownLoad:
CSV
The variation in marine primary productivity in summer in the nearshore waters of Beibu Gulf, ranged from 212 mg/(m2·d) to 2 160 mg/(m2·d) (in terms of carbon). Using the maximum value and combined with the Redfield ratio (C:N:P=106:16:1), the amounts of DIN and phosphate required to meet the growth of phytoplankton under ideal conditions were 27.19 × 10⁻³ mol/(m2·d) and 1.70 × 10⁻³ mol/(m2·d), respectively. Accordingly, the horizontal eddy diffusion process in this study accounted for only 7.35% of DIN and 3.52% of phosphate. The reason for this large discrepancy could be the existence of other transport pathways for nutrients. First, the SGD in the near-shore waters of the Beibu Gulf transports 50.8×10⁶ mol/d DIN, 0.61 × 10⁶ mol/d DIP, and 70.7 × 10⁶ mol/d silicate, which is 5−10 times the total river nutrient input (Wang, 2020; Guo, 2020; Chen et al., 2019). In addition, the dry and wet deposition fluxes of atmospheric nitrogen in summer in this study area are 0.18 mmol/(m2·d) and 0.3 mmol/(m2·d), respectively (Guo, 2020). Furthermore, marine aquaculture wastewater discharge can supply approximately 1 478 t of ammonia nitrogen and 195 t of phosphate (Guo, 2020).
Surface runoff and SGD are the main sources of 222Rn in nearshore surface seawater. 222Rn can trace not only the SGD process but also the seawater mixing process. Based on the variation in 222Rn activity with distance in offshore surface seawater, the vorticity diffusion coefficient in the horizontal direction of different sections was estimated, and then, the offshore fluxes of 222Rn and the corresponding nutrient fluxes that were horizontally transported were also estimated.
By comparing the offshore fluxes of 222Rn with the input fluxes of rivers, it is determined that the offshore fluxes are 7.54 times the input fluxes of rivers, which may be influenced by the input of SGD from the Guangxi coastal zone. In addition, by comparing the horizontal transport fluxes of nutrients and the content of nutrients required by phytoplankton growth in the study area under ideal conditions, we discovered that the horizontal transport of nutrients only provided 7.35% N and 3.52% P, which was insufficient to meet the material basis required by phytoplankton growth. This result shows that mixed water transport is not the only route for nutrient intake in the study area.
|
Berelson W M, Hammond D E, Fuller C. 1982. Radon-222 as a tracer for mixing in the water column and benthic exchange in the southern California borderland. Earth and Planetary Science Letters, 61(1): 41–54. doi: 10.1016/0012-821X(82)90036-X
|
|
Blanton J, Werner F, Kim C, et al. 1994. Transport and fate of low-density water in a coastal frontal zone. Continental Shelf Research, 14(4): 401–427. doi: 10.1016/0278-4343(94)90026-4
|
|
Braman R S, Hendrix S A. 1989. Nanogram nitrite and nitrate determination in environmental and biological materials by vanadium (III) reduction with chemiluminescence detection. Analytical Chemistry, 61(24): 2715–2718. doi: 10.1021/ac00199a007
|
|
Cao Zhenyi, Bao Min, Guan Weibing, et al. 2019. Water-mass evolution and the seasonal change in northeast of the Beibu Gulf, China. Oceanologia et Limnologia Sinica (in Chinese), 50(3): 532–542
|
|
Chen Xiaogang. 2019. Submarine groundwater discharge in mangroves, salt marshes, sandy beaches and karst ecosystems of typical coastal zones (in Chinese)[dissertation]. Shanghai: East China Normal University
|
|
Chen Xiaogang, Lao Yanling, Wang Jinlong, et al. 2018a. Submarine groundwater-borne nutrients in a tropical bay (Maowei Sea, China) and their impacts on the oyster aquaculture. Geochemistry, Geophysics, Geosystems, 19(3): 932–951
|
|
Chen Xiaogang, Wang Jinlong, Cukrov N, et al. 2019. Porewater-derived nutrient fluxes in a coastal aquifer (Shengsi Island, China) and its implication. Estuarine, Coastal and Shelf Science, 218: 204–211
|
|
Chen Yizhan, Yang Wei, Cao Yonggang, et al. 2020. Seasonal characteristics of circulation in the northern Beibu Gulf. Journal of Guangdong Ocean University (in Chinese), 40(4): 68–74
|
|
Chen Xiaogang, Zhang Fenfen, Lao Yanling, et al. 2018b. Submarine groundwater discharge-derived carbon fluxes in mangroves: an important component of blue carbon budgets?. Journal of Geophysical Research: Oceans, 123(9): 6962–6979
|
|
Chung Y C. 1976. A deep 226Ra maximum in the Northeast Pacific. Earth and Planetary Science Letters, 32(2): 249–257. doi: 10.1016/0012-821X(76)90065-0
|
|
Coachman L K, Walsh J J. 1981. A diffusion model of cross-shelf exchange of nutrients in the southeastern Bering Sea. Deep-Sea Research Part A. Oceanographic Research Papers, 28(8): 819–846
|
|
Colbert S L, Hammond D E, Berelson W M. 2008. Radon-222 budget in Catalina Harbor, California: 1. Water mixing rates. Limnology and Oceanography, 53(2): 651–658. doi: 10.4319/lo.2008.53.2.0651
|
|
Dai Minhan, Wang Lifang, Guo Xianghui, et al. 2008. Nitrification and inorganic nitrogen distribution in a large perturbed river/estuarine system: the Pearl River Estuary, China. Biogeosciences, 5(5): 1227–1244. doi: 10.5194/bg-5-1227-2008
|
|
Diab H M. 2019. Accuracy and precision of RAD7 and RAD H2O accessories for SNIFF and NORMAL modes. Romanian Journal of Biophysics, 29(2): 1–11
|
|
Feng Yu. 2021. Radionuclides in marine sediments from the Beibu Gulf: spatial patterns, transport pathway, and ionized radiation assessment (in Chinese) [dissertation]. Nanning: Guangxi University
|
|
Fischer H B. 1980. Mixing processes on the Atlantic continental shelf, Cape Cod to Cape Hatteras. Limnology and Oceanography, 25(1): 114–125. doi: 10.4319/lo.1980.25.1.0114
|
|
Ge Jianzhong, Torres R, Chen Changsheng. 2020. Influence of suspended sediment front on nutrients and phytoplankton dynamics off the Changjiang Estuary: A FVCOM-ERSEM coupled model experiment. Journal of Marine Systems, 204: 103292. doi: 10.1016/j.jmarsys.2019.103292
|
|
Guo Jing. 2020. Nitrogen biogeochemical processes and geochemical record of anthropogenic nutrient loading coastal regions of Beibu Gulf, Guangxi Province (in Chinese) [dissertation]. Nanning: Guangxi University
|
|
Huh C A, Ku T L. 1998. A 2-D section of 228Ra and 226Ra in the Northeast Pacific. Oceanologica Acta, 21(4): 533–542. doi: 10.1016/S0399-1784(98)80036-4
|
|
Kasemsupaya V, Tsubota H, Nozaki Y. 1993. 228Ra and its implications in the Seto Inland Sea. Estuarine, Coastal and Shelf Science, 36(1): 31−45
|
|
Kaufman A, Trier R M, Broecker W S, et al. 1973. Distribution of 228Ra in the world ocean. Journal Geophysical Research, 78(36): 8827–8848. doi: 10.1029/JC078i036p08827
|
|
Ku T L, Huh C A, Chen P S. 1980. Meridional distribution of 226Ra in the eastern Pacific along GEOSECS cruise tracks. Earth and Planetary Science Letters, 49(2): 293–308. doi: 10.1016/0012-821X(80)90073-4
|
|
Li Chunyan, Cai Weijun. 2011. On the calculation of eddy diffusivity in the shelf water from radium isotopes: high sensitivity to advection. Journal of Marine Systems, 86(1–2): 28–33. doi: 10.1016/j.jmarsys.2011.01.003
|
|
Li Bin, Tan Quzi, Li Leixian, et al. 2018. The research on contaminative conditions and pollutants fluxing into sea of major rivers in Guangxi Beibu Gulf in 2014. Guangxi Sciences (in Chinese), 25(2): 172–180
|
|
Li Pingyang, Xue Rui, Wang Yinghui, et al. 2015. Influence of anthropogenic activities on PAHs in sediments in a significant gulf of low-latitude developing regions, the Beibu Gulf, South China Sea: Distribution, sources, inventory and probability risk. Marine Pollution Bulletin, 90(1–2): 218–226. doi: 10.1016/j.marpolbul.2014.10.048
|
|
Liu Yi, Jiu Jimmy Jiao, Liang Wenzhao, et al. 2021. Inorganic carbon and alkalinity biogeochemistry and fluxes in an intertidal beach aquifer: Implications for ocean acidification. Journal of Hydrology, 595: 126036. doi: 10.1016/j.jhydrol.2021.126036
|
|
Martens C S, Kipphut G W, Klump J V. 1980. Sediment-water chemical exchange in the coastal zone traced by in situ Radon-222 flux measurements. Science, 208(4441): 285–288. doi: 10.1126/science.208.4441.285
|
|
McKenzie T, Holloway C, Dulai H, et al. 2020. Submarine groundwater discharge: A previously undocumented source of contaminants of emerging concern to the coastal ocean (Sydney, Australia). Marine Pollution Bulletin, 160: 111519. doi: 10.1016/j.marpolbul.2020.111519
|
|
Men Wu, Wang Fenfen, Liu Guangshan. 2011. 224Ra and its implications in the East China Sea. Journal of Radioanalytical and Nuclear Chemistry, 288(1): 189–195. doi: 10.1007/s10967-010-0898-5
|
|
Men Wu, Wang Fenfen, Zhang Yusheng, et al. 2013. Determining coastal mixing rates of western Taiwan Strait using 224Ra. Journal of Radioanalytical and Nuclear Chemistry, 295(1): 89–94. doi: 10.1007/s10967-012-1853-4
|
|
Men Wu, Wei Hao, Liu Guangshan. 2006. 226Ra and 228Ra in the seawater of the western Yellow Sea. Journal of Ocean University of China, 5(3): 228–234. doi: 10.1007/s11802-006-0006-1
|
|
Moore W S. 1998. Application of 226Ra, 228Ra, 223Ra, and 224Ra in coastal waters to assessing coastal mixing rates and groundwater discharge to oceans. Proceedings of the Indian Academy of Science-Earth and Planetary Sciences, 107(4): 343–349
|
|
Moore W S. 2000. Determining coastal mixing rates using radium isotopes. Continental Shelf Research, 20(15): 1993–2007. doi: 10.1016/S0278-4343(00)00054-6
|
|
Moore W S. 2010. The effect of submarine groundwater discharge on the ocean. Annual Review of Marine Science, 2: 59–88. doi: 10.1146/annurev-marine-120308-081019
|
|
Moore W S. 2015. Inappropriate attempts to use distributions of 228Ra and 226Ra in coastal waters to model mixing and advection rates. Continental Shelf Research, 105: 95–100. doi: 10.1016/j.csr.2015.05.014
|
|
Moore W S, Feely H W, Li Yuanhui. 1980. Radium isotopes in sub-Arctic waters. Earth and Planetary Science Letters, 49(2): 329–340. doi: 10.1016/0012-821X(80)90076-X
|
|
Mwangi John Kennedy, Lee Wen-Jhy, Wang Lin-Chi, et al. 2016. Persistent organic pollutants in the Antarctic coastal environment and their bioaccumulation in penguins. Environmental Pollution, 216: 924–934. doi: 10.1016/j.envpol.2016.07.001
|
|
Rengarajan R, Sarin M M, Somayajulu B L K, et al. 2002. Mixing in the surface waters of the western Bay of Bengal using 228Ra and 226Ra. Journal of Marine Research, 60(2): 255–279. doi: 10.1357/00222400260497480
|
|
Santos I R, Chen Xiaogang, Lecher A L, et al. 2021. Submarine groundwater discharge impacts on coastal nutrient biogeochemistry. Nature Reviews Earth & Environment, 2(5): 307–323
|
|
Sarmiento J L, Feely H W, Moore W S, et al. 1976. The relationship between vertical eddy diffusion and buoyancy gradient in the deep sea. Earth and Planetary Science Letters, 32(2): 357–370. doi: 10.1016/0012-821X(76)90076-5
|
|
Su Ni. 2013. Tracing coastal water mixing processes and submarine groundwater discharge by radium isotopes (in Chinese)[dissertation]. Shanghai: East China Normal University
|
|
Su Ni, Du Jinzhou, Li Ying, et al. 2013. Evaluation of surface water mixing and associated nutrient fluxes in the East China Sea using 226Ra and 228Ra. Marine Chemistry, 156: 108–119. doi: 10.1016/j.marchem.2013.04.009
|
|
Swarzenski P W, Izbicki J A. 2009. Coastal groundwater dynamics off Santa Barbara, California: Combining geochemical tracers, electromagnetic seepmeters, and electrical resistivity. Estuarine, Coastal and Shelf Science, 83(1): 77–89
|
|
Tang Lin. 2011. An analysis of the characteristics of SST variation in Guangxi Province and it’s relationship with the southwestlies monsoon on set (in Chinese)[dissertation]. Qingdao: Ocean University of China
|
|
Torgersen T, Turekian K K, Turekian V C, et al. 1996. 224Ra distribution in surface and deep water of Long Island Sound: sources and horizontal transport rates. Continental Shelf Research, 16(12): 1545–1559. doi: 10.1016/0278-4343(96)00003-9
|
|
Torgersen T, DeAngelo E, O’Donnell J. 1997. Calculations of horizontal mixing rates using 222Rn and the controls on hypoxia in western Long Island Sound, 1991. Estuaries, 20(2): 328–345. doi: 10.2307/1352348
|
|
Wan Xianhui, Sheng Huaxia, Dai Minghan, et al. 2023. Epipelagic nitrous oxide production offsets carbon sequestration by the biological pump. Nature Geoscience, 16(1): 29–36. doi: 10.1038/s41561-022-01090-2
|
|
Wang Yali. 2020. Carbon fluxes by submarine groundwater discharge and its optical characteristics in typical mangrove areas of the Beibu Gulf (in Chinese)[dissertation]. Shanghai: East China Normal University
|
|
Wang Xiaoxiong, Chen Xiaogang, Liu Jianan, et al. 2021. Radon traced seasonal variations of water mixing and accompanying nutrient and carbon transport in the Yellow-Bohai Sea. Science of the Total Environment, 784: 147161. doi: 10.1016/j.scitotenv.2021.147161
|
|
Wang Xuejing, Li Hailong, Luo Xin, et al. 2016. Using 224Ra to estimate eddy diffusivity and submarine groundwater discharge in Laizhou Bay, China. Journal of Radioanalytical and Nuclear Chemistry, 308(2): 403–411. doi: 10.1007/s10967-015-4495-5
|
|
Wu Minlan. 2014. The distribution feature of nutrients and the study of their influence on ecosystem in the northern Beibu Gulf (in Chinese)[dissertation]. Xiamen: Xiamen University
|
|
Xing Na, Chen Min, Huang Yipu, et al. 2011. The cross-shelf exchange of surface nutrients in the Bering Sea elucidated from 228Ra tracer. Haiyang Xuebao (in Chinese), 33(2): 77–84
|
|
Xiong Ping. 2019. Paleogeographic reconstructions and sedimentary response since Late Pleistocene in the northwestern margin of South China Sea (in Chinese)[dissertation]. Wuhan: China University of Geoscience
|
|
Yang Shiying, Chen Bo, Li Peiliang. 2006. A study of the characteristics of water transport from the South China Sea into Beibu Bay via the Qiongzhou Strait in summer in terms of temperature and salinity data. Transactions of Oceanology and Limnology (in Chinese), (1): 1–7
|
|
Zhang Yan, Li Hailong, Wang Xuejing, et al. 2016. Estimation of submarine groundwater discharge and associated nutrient fluxes in eastern Laizhou Bay, China using 222Rn. Journal of Hydrology, 533: 103–113. doi: 10.1016/j.jhydrol.2015.11.027
|
|
Zhang Wenxia, Wu Hui, Zhu Zhuoyi. 2018. Transient hypoxia extent off Changjiang River Estuary due to mobile Changjiang River plume. Journal of Geophysical Research: Oceans, 123(12): 9196–9211. doi: 10.1029/2018JC014596
|
|
Zheng Zhenzhen. 2018. The thermal response of marine ammonia oxidation (in Chinese)[dissertation]. Xiamen: Xiamen University
|
|
Zheng Liwen, Zhai Weidong, Wang Lifang, et al. 2020. Improving the understanding of central Bohai Sea eutrophication based on wintertime dissolved inorganic nutrient budgets: Roles of North Yellow Sea water intrusion and atmospheric nitrogen deposition. Environmental Pollution, 267: 115626. doi: 10.1016/j.envpol.2020.115626
|
|
Zhong Qiangqiang, Wang Hao, Wang Qiugui, et al. 2023. Study of Ra desorption processes in an estuary system with high-turbidity at the Southeast China. Journal of Environmental Radioactivity, 259–260: 107108
|

Figures(8) / Tables(6)

Supported by:
Beijing Renhe Information Technology Co. Ltd

Hao Wang, Qiangqiang Zhong, Fule Zhang, Suiyuan Chen, Hongyan Bao, Jing Lin, Dekun Huang, Tao Yu. Tracing surface seawater mixing and nutrient transport by 222Rn on the northern coast of Beibu Gulf, China[J]. Acta Oceanologica Sinica, 2023, 42(8): 87-98. doi: 10.1007/s13131-023-2233-3

| Station | Latitude | Longitude | Temperature/ ℃ | Salinity | pH | DO/ (mg·L−1) | 222Rn/ (Bq·m−3) | 226Ra/ (Bq·m−3) | Offshore distance/ km | Phosphate/ (μmol·L−1) | Nitrite/ (μmol·L−1) | Nitrate/ (μmol·L−1) | Silicate/ (μmol·L−1) |
| A1 | 21.51°N | 108.28°E | 29.08 | 31.78 | 8.29 | 9.32 | 127.7 ± 61.6 | 4.69 ± 0.32 | 3.20 | 0.06 | 0.25 | 6.76 | 10.58 |
| A2 | 21.47°N | 108.28°E | 29.54 | 31.68 | 8.30 | 9.33 | 50.0 ± 37.2 | 4.41 ± 0.24 | 7.70 | 0.08 | 0.21 | 13.95 | 10.46 |
| A3 | 21.42°N | 108.28°E | 29.79 | 31.79 | 8.38 | 9.34 | 117.5 ± 59.3 | 4.32 ± 0.35 | 13.50 | 0.03 | 0.03 | 133.69 | 2.70 |
| A4 | 21.38°N | 108.28°E | 29.62 | 31.97 | 8.40 | 9.54 | 67.2 ± 44.9 | 3.16 ± 0.23 | 18.00 | 0.04 | 0.04 | 12.39 | 2.58 |
| A5 | 21.25°N | 108.30°E | 30.62 | 31.41 | 8.21 | 7.90 | 18.4 ± 21.4 | 2.73 ± 0.32 | 32.00. | 0.00 | 0.08 | 2.02 | 1.07 |
| B1 | 21.50°N | 108.37°E | 29.90 | 31.35 | 8.40 | 9.92 | 136.7 ± 64.7 | 5.15 ± 0.26 | 6.70 | 0.09 | 0.08 | 16.78 | 7.57 |
| B2 | 21.47°N | 108.36°E | 29.60 | 31.37 | 8.40 | 9.69 | 100.7 ± 56.4 | 5.47 ± 0.33 | 10.10 | 0.09 | 0.06 | 49.42 | 7.59 |
| C3 | 21.67°N | 108.61°E | 31.04 | 24.24 | 8.01 | 7.13 | 94.5 ± 54.8 | 5.80 ± 0.45 | 4.20 | 0.83 | 1.15 | 29.95 | 26.95 |
| C4 | 21.61°N | 108.64°E | 31.93 | 28.28 | 8.12 | 7.72 | 53.5 ± 42.3 | 6.97 ± 0.35 | 8.50 | 0.57 | 1.19 | 16.01 | 20.79 |
| C5 | 21.53°N | 108.65°E | 31.36 | 30.10 | 8.17 | 8.10 | 240.4 ± 83.3 | 6.39 ± 0.30 | 15.20 | 0.30 | 1.10 | 9.97 | 17.79 |
| C6 | 21.47°N | 108.67°E | 31.16 | 30.54 | 8.27 | 9.75 | 422.4 ± 111.2 | 6.90 ± 0.29 | 22.10 | 0.13 | 0.19 | 4.05 | 11.81 |
| C7 | 21.40°N | 108.67°E | 30.69 | 31.23 | 8.33 | 8.73 | 26.1 ± 26.0 | 4.46 ± 0.27 | 30.60 | 0.09 | 0.10 | 3.07 | 8.88 |
| C8 | 21.25°N | 108.70°E | 30.51 | 31.16 | 8.15 | 6.70 | 11.8 ± 16.5 | 4.15 ± 0.34 | 52.30 | 0.01 | 0.09 | 3.56 | 5.26 |
| D1 | 21.57°N | 108.87°E | 33.52 | 26.37 | 8.06 | 7.66 | 166.4 ± 65.7 | 5.45 ± 0.30 | 10.10 | 0.30 | 1.27 | 156.72 | 28.53 |
| D2 | 21.50°N | 108.87°E | 33.34 | 28.28 | 8.31 | 9.31 | 263.7 ± 85.8 | 4.80 ± 0.24 | 16.30 | 0.09 | 0.33 | 5.69 | 13.02 |
| D3 | 21.44°N | 108.88°E | 33.20 | 30.46 | 8.14 | 8.36 | 183.4 ± 76.4 | 5.32 ± 0.25 | 23.00 | 0.09 | 0.49 | 60.02 | 14.63 |
| D4 | 21.36°N | 108.88°E | 31.53 | 30.95 | 8.34 | 8.79 | 99.8 ± 54.8 | 4.74 ± 0.16 | 32.10 | 0.06 | 0.10 | 5.12 | 9.32 |
| D5 | 21.25°N | 108.90°E | 31.08 | 29.00 | 8.17 | 6.60 | 23.1 ± 23.2 | 4.09 ± 0.22 | 45.50 | 0.00 | 0.06 | 2.89 | 6.40 |
| E1 | 21.40°N | 109.10°E | 31.82 | 31.40 | 8.34 | 8.96 | 444.4 ± 107.8 | 5.73 ± 0.33 | 3.00 | 0.08 | 0.03 | 97.50 | 4.31 |
| E2 | 21.35°N | 109.10°E | 31.79 | 31.36 | 8.31 | 8.83 | 166.4 ± 65.7 | 3.58 ± 0.20 | 8.60 | 0.08 | 0.03 | 82.62 | 9.61 |
| E3 | 21.50°N | 109.07°E | 31.79 | 28.46 | 8.24 | 8.29 | 336.0 ± 103.9 | − | − | 0.88 | 0.46 | 11.63 | 24.56 |
| E4 | 21.52°N | 109.04°E | 32.84 | 28.44 | 8.21 | 8.24 | 221.2 ± 79.0 | − | − | 0.73 | 0.57 | 37.64 | 29.62 |
| E5 | 21.51°N | 109.11°E | 32.14 | 28.24 | 8.26 | 9.20 | 146.7 ± 66.2 | − | − | 0.90 | 0.38 | 71.29 | 26.83 |
| F1 | 21.41°N | 109.30°E | 36.85 | 30.92 | 8.32 | 8.93 | 252.0 ± 93.8 | 6.05 ± 0.28 | 3.20 | 0.02 | 0.09 | 5.08 | 2.44 |
| F2 | 21.36°N | 109.30°E | 31.71 | 31.74 | 8.33 | 8.75 | 65.8 ± 48.5 | 4.47 ± 0.11 | 8.60 | 0.07 | 0.11 | 9.35 | 8.35 |
| F3 | 21.32°N | 109.31°E | 31.24 | 31.64 | 8.32 | 8.69 | 280.9 ± 91.0 | 4.33 ± 0.20 | 12.90 | 0.06 | 0.07 | 12.41 | 7.67 |
| F4 | 21.25°N | 109.30°E | 30.81 | 32.71 | 8.10 | 6.60 | 48.2 ± 33.7 | 3.13 ± 0.26 | 20.80 | 0.01 | 0.06 | 0.35 | 3.58 |
| G1 | 21.43°N | 109.49°E | 31.88 | 30.77 | 8.26 | 8.50 | 262.1 ± 89.6 | 5.71 ± 0.19 | 5.00 | 0.05 | 0.13 | 5.49 | 5.62 |
| G2 | 21.40°N | 109.49°E | 31.33 | 31.13 | 8.24 | 8.01 | 237.2 ± 66.2 | 5.45 ± 0.14 | 8.40 | 0.07 | 0.21 | 19.63 | 12.21 |
| G3 | 21.34°N | 109.49°E | 31.56 | 31.90 | 8.30 | 8.23 | 74.3 ± 45.3 | 3.57 ± 0.23 | 15.00 | 0.06 | 0.12 | 4.25 | 8.98 |
| G4 | 21.23°N | 109.49°E | 30.81 | 32.71 | 8.10 | 6.60 | 23.4 ± 23.5 | 3.00 ± 0.29 | 27.20 | 0.01 | 0.06 | 1.59 | 7.09 |
| Note: The parameters of 222Rn and 226Ra are in activity concentrations; the parameters of phosphate, nitrite, nitrate and silicate are in concentrations. − represents no data. | |||||||||||||
DownLoad:
CSV
| 222Rn ( considering without u and J) | Combined 222Rn and 226Ra | 222Rn (considering J) | 222Rn ( considering u and J) | |||||||
| Slope | R2 | Kh/(108 m2·d−1) | Kh/(108 m2·d−1) | u/(m·d−1) | Kh/(108 m2·d−1) | Kh/(108 m2·d−1) | ||||
| Section A | −0.07 | 0.821 9 | 0.39 | 0.55 | −1 106 | 2.10 | 2.13 | |||
| Section C | −0.05 | 0.413 7 | 0.60 | 0.73 | −743 | 1.69 | 1.72 | |||
| Section D | −0.07 | 0.802 5 | 0.42 | 0.46 | −328 | 0.80 | 0.81 | |||
| Section F | −0.07 | 0.328 9 | 0.35 | 0.67 | −2 410 | 1.04 | 1.12 | |||
| Section G | −0.12 | 0.979 0 | 0.12 | 0.17 | −518 | 0.41 | 0.42 | |||
| Mean | − | − | 0.38 ± 0.08 | 0.52 ± 0.10 | − | 1.21 ± 0.30 | 1.24 ± 0.31 | |||
| Note: Kh is the average value of the eddy diffusion coefficient, h refers to the sampling depth (m) above the pycnocline layer; u is the advection velocity (m/s); J is other 222Rn input or removal (Bq/(m3·s)); slope is the log-linear slope; R2 is the linear correlation coefficient; − represents no data. | ||||||||||
DownLoad:
CSV
| Study area | Methods | Season | Kh/(108 m2·d−1) | Reference |
| Laizhou Bay | 224Ra | wet season | 2.53 | Wang et al. (2016) |
| East China Sea | 224Ra | wet season | 2.93 | Men et al. (2011) |
| dry season | 3.36 | Men et al. (2011) | ||
| Taiwan Strait | 224Ra | dry season | 2.16 | Men et al. (2013) |
| South Atlantic Bight | 223Ra, 224Ra | wet season | 0.31−0.36 | Moore (2000) |
| Yellow Sea | 223Ra, 224Ra, 226Ra | wet season | 2.53 | Su et al. (2013) |
| Long Island Sound | 224Ra | wet season | 0.004−0.043 | Torgersen et al. (1996) |
| San Diego to northwest of Hawaii | 226Ra | wet season | 0.09 | Chung (1976) |
| Northeast Pacific | 226Ra, 228Ra | − | 0.09 | Huh and Ku (1998) |
| − | 4.32 | Huh and Ku (1998) | ||
| East China Sea | 226Ra, 228Ra | wet season | 0.004 | Su (2013) |
| wet season | 2.22 | Su (2013) | ||
| Eastern Pacific Ocean | 226Ra, O2 and salinity | wet season | 0.86 | Ku et al. (1980) |
| Western Bay of Bengal | 226Ra, 228Ra | − | 0.86−8.64 | Rengarajan et al. (2002) |
| Cross-shelf of the Bering Sea | 228Ra | wet season | 1.90 | Xing et al. (2011) |
| Sub-Arctic waters | 228Ra | − | 0.43−0.86 | Moore et al. (1980) |
| World ocean | 228Ra | − | 0.86−8.64 | Kaufman et al. (1973) |
| Seto Inland Sea | 228Ra | dry season | 0.095−0.12 | Kasemsupaya et al. (1993) |
| Western Yellow Sea | 228Ra | wet season | 2.51 | Men et al. (2006) |
| Southeastern Bering Sea | salt balance | wet season | 0.86 | Coachman and Walsh (1981) |
| Middle Atlantic Bight | current meter and remotely sensed data | dry season | 0.026 | Fischer (1980) |
| Western Long Island Sound | 222Rn | wet season | >0.04 | Torgersen et al. (1997) |
| Catalina Harbor | 222Rn | wet season | 0.0005 | Colbert et al. (2008) |
| San Nicolas Basin | 222Rn | wet season | 0.0086 | Berelson et al. (1982) |
| Yellow-Bohai Sea | 222Rn | wet season | 3.92 | Wang et al. (2021) |
| dry season | 1.97 | Wang et al. (2021) | ||
| Beibu Gulf | 222Rn | dry season | 0.42−2.13 | this study |
| Note: Kh is the average value of the eddy diffusion coefficient, h refers to the sampling depth (m) above the pycnocline layer; − represents no data. | ||||
DownLoad:
CSV
| Section | R2 | Kh/(108 m2·d−1) | ΔA/(Bq·(m3·m)−1) | FRn/(1012 Bq·d−1) |
| A | 0.821 9 | 2.13 | 0.02 | 2.98 |
| D | 0.802 5 | 0.81 | 0.04 | 2.30 |
| G | 0.979 0 | 0.42 | 0.05 | 1.47 |
| Mean | − | − | − | 2.24 ± 0.44 |
| Note: Kh is the average value of the eddy diffusion coefficient, h refers to the sampling depth (m) above the pycnocline layer; A is the 222Rn activity concentration at the sampling station; FRn: the offshore fluxes of 222Rn; R2: the linear correlation coefficient. | ||||
DownLoad:
CSV
| River | Mean annual discharge/ (109 m3) | Fresh water endmember 222Rn/(Bq·m−3) | Average daily emission flux of 222Rn/ (1010 Bq·d−1) |
| Beilun | 29.40a | 1 859 ± 212c | 14.97 ± 1.71 |
| Jiangping | 7.67b | 640 ± 122c | 1.34 ± 0.26 |
| Fangcheng | 17.86a | 886 ± 149c | 4.34 ± 0.73 |
| Maoling | 16.20a | 234 ± 80c | 1.04 ± 0.36 |
| Qinjiang | 11.53a | 250 ± 80c | 0.79 ± 0.25 |
| Dafeng | 6.05a | 218 ± 86c | 0.36 ± 0.14 |
| Nanliu | 53.13a | 254 ± 74c | 3.70 ± 1.08 |
| Total river input flux | 141.84a | − | 26.54 ± 4.52 |
| Note: Fresh water endmember 222Rn parameter is in activity concentration. − represents no data. a data cited from Wu (2014); b data cited from Wang (2020); c data are from this study. | |||
DownLoad:
CSV
| Kh/(108 m2·d−1) | Silicate Fnutri/ (mol·m−2·d−1) | Phosphate Fnutri/ (mol·m−2·d−1) | Nitrite Fnutri/ (mol·m−2·d−1) | Nitrate Fnutri/ (mol·m−2·d−1) | |
| Section A | 2.13 | 70.51 | 0.46 | 1.31 | 35.11 |
| Section C | 1.72 | 77.53 | 2.91 | 3.77 | 94.32 |
| Section D | 0.81 | 50.77 | 0.67 | 2.79 | 6.61 |
| Section F | 1.12 | 43.96 | 0.09 | 0.19 | 30.19 |
| Section G | 0.42 | 11.29 | 0.08 | 0.13 | 7.30 |
| Mean | 1.24 ± 0.31 | 50.81 ± 11.64 | 0.83 ± 0.53 | 1.64 ± 0.72 | 34.71 ± 15.99 |
| Mixed layer area/m2 | 7.00 × 10⁵ | 7.00 × 10⁵ | 7.00 × 10⁵ | 7.00 × 10⁵ | 7.00 × 10⁵ |
| Study area/m2 | 5.85 × 10⁹ | 5.85 × 10⁹ | 5.85 × 10⁹ | 5.85 × 10⁹ | 5.8 × 10⁹ |
| Flux | − | 6.28 × 10⁻³ | 0.10 × 10⁻³ | 0.20 × 10⁻³ | 4.15 × 10⁻³ |
| Note: Fnutri diffusion flux of nutrients; − represents no data. | |||||
DownLoad:
CSV
| Station | Latitude | Longitude | Temperature/ ℃ | Salinity | pH | DO/ (mg·L−1) | 222Rn/ (Bq·m−3) | 226Ra/ (Bq·m−3) | Offshore distance/ km | Phosphate/ (μmol·L−1) | Nitrite/ (μmol·L−1) | Nitrate/ (μmol·L−1) | Silicate/ (μmol·L−1) |
| A1 | 21.51°N | 108.28°E | 29.08 | 31.78 | 8.29 | 9.32 | 127.7 ± 61.6 | 4.69 ± 0.32 | 3.20 | 0.06 | 0.25 | 6.76 | 10.58 |
| A2 | 21.47°N | 108.28°E | 29.54 | 31.68 | 8.30 | 9.33 | 50.0 ± 37.2 | 4.41 ± 0.24 | 7.70 | 0.08 | 0.21 | 13.95 | 10.46 |
| A3 | 21.42°N | 108.28°E | 29.79 | 31.79 | 8.38 | 9.34 | 117.5 ± 59.3 | 4.32 ± 0.35 | 13.50 | 0.03 | 0.03 | 133.69 | 2.70 |
| A4 | 21.38°N | 108.28°E | 29.62 | 31.97 | 8.40 | 9.54 | 67.2 ± 44.9 | 3.16 ± 0.23 | 18.00 | 0.04 | 0.04 | 12.39 | 2.58 |
| A5 | 21.25°N | 108.30°E | 30.62 | 31.41 | 8.21 | 7.90 | 18.4 ± 21.4 | 2.73 ± 0.32 | 32.00. | 0.00 | 0.08 | 2.02 | 1.07 |
| B1 | 21.50°N | 108.37°E | 29.90 | 31.35 | 8.40 | 9.92 | 136.7 ± 64.7 | 5.15 ± 0.26 | 6.70 | 0.09 | 0.08 | 16.78 | 7.57 |
| B2 | 21.47°N | 108.36°E | 29.60 | 31.37 | 8.40 | 9.69 | 100.7 ± 56.4 | 5.47 ± 0.33 | 10.10 | 0.09 | 0.06 | 49.42 | 7.59 |
| C3 | 21.67°N | 108.61°E | 31.04 | 24.24 | 8.01 | 7.13 | 94.5 ± 54.8 | 5.80 ± 0.45 | 4.20 | 0.83 | 1.15 | 29.95 | 26.95 |
| C4 | 21.61°N | 108.64°E | 31.93 | 28.28 | 8.12 | 7.72 | 53.5 ± 42.3 | 6.97 ± 0.35 | 8.50 | 0.57 | 1.19 | 16.01 | 20.79 |
| C5 | 21.53°N | 108.65°E | 31.36 | 30.10 | 8.17 | 8.10 | 240.4 ± 83.3 | 6.39 ± 0.30 | 15.20 | 0.30 | 1.10 | 9.97 | 17.79 |
| C6 | 21.47°N | 108.67°E | 31.16 | 30.54 | 8.27 | 9.75 | 422.4 ± 111.2 | 6.90 ± 0.29 | 22.10 | 0.13 | 0.19 | 4.05 | 11.81 |
| C7 | 21.40°N | 108.67°E | 30.69 | 31.23 | 8.33 | 8.73 | 26.1 ± 26.0 | 4.46 ± 0.27 | 30.60 | 0.09 | 0.10 | 3.07 | 8.88 |
| C8 | 21.25°N | 108.70°E | 30.51 | 31.16 | 8.15 | 6.70 | 11.8 ± 16.5 | 4.15 ± 0.34 | 52.30 | 0.01 | 0.09 | 3.56 | 5.26 |
| D1 | 21.57°N | 108.87°E | 33.52 | 26.37 | 8.06 | 7.66 | 166.4 ± 65.7 | 5.45 ± 0.30 | 10.10 | 0.30 | 1.27 | 156.72 | 28.53 |
| D2 | 21.50°N | 108.87°E | 33.34 | 28.28 | 8.31 | 9.31 | 263.7 ± 85.8 | 4.80 ± 0.24 | 16.30 | 0.09 | 0.33 | 5.69 | 13.02 |
| D3 | 21.44°N | 108.88°E | 33.20 | 30.46 | 8.14 | 8.36 | 183.4 ± 76.4 | 5.32 ± 0.25 | 23.00 | 0.09 | 0.49 | 60.02 | 14.63 |
| D4 | 21.36°N | 108.88°E | 31.53 | 30.95 | 8.34 | 8.79 | 99.8 ± 54.8 | 4.74 ± 0.16 | 32.10 | 0.06 | 0.10 | 5.12 | 9.32 |
| D5 | 21.25°N | 108.90°E | 31.08 | 29.00 | 8.17 | 6.60 | 23.1 ± 23.2 | 4.09 ± 0.22 | 45.50 | 0.00 | 0.06 | 2.89 | 6.40 |
| E1 | 21.40°N | 109.10°E | 31.82 | 31.40 | 8.34 | 8.96 | 444.4 ± 107.8 | 5.73 ± 0.33 | 3.00 | 0.08 | 0.03 | 97.50 | 4.31 |
| E2 | 21.35°N | 109.10°E | 31.79 | 31.36 | 8.31 | 8.83 | 166.4 ± 65.7 | 3.58 ± 0.20 | 8.60 | 0.08 | 0.03 | 82.62 | 9.61 |
| E3 | 21.50°N | 109.07°E | 31.79 | 28.46 | 8.24 | 8.29 | 336.0 ± 103.9 | − | − | 0.88 | 0.46 | 11.63 | 24.56 |
| E4 | 21.52°N | 109.04°E | 32.84 | 28.44 | 8.21 | 8.24 | 221.2 ± 79.0 | − | − | 0.73 | 0.57 | 37.64 | 29.62 |
| E5 | 21.51°N | 109.11°E | 32.14 | 28.24 | 8.26 | 9.20 | 146.7 ± 66.2 | − | − | 0.90 | 0.38 | 71.29 | 26.83 |
| F1 | 21.41°N | 109.30°E | 36.85 | 30.92 | 8.32 | 8.93 | 252.0 ± 93.8 | 6.05 ± 0.28 | 3.20 | 0.02 | 0.09 | 5.08 | 2.44 |
| F2 | 21.36°N | 109.30°E | 31.71 | 31.74 | 8.33 | 8.75 | 65.8 ± 48.5 | 4.47 ± 0.11 | 8.60 | 0.07 | 0.11 | 9.35 | 8.35 |
| F3 | 21.32°N | 109.31°E | 31.24 | 31.64 | 8.32 | 8.69 | 280.9 ± 91.0 | 4.33 ± 0.20 | 12.90 | 0.06 | 0.07 | 12.41 | 7.67 |
| F4 | 21.25°N | 109.30°E | 30.81 | 32.71 | 8.10 | 6.60 | 48.2 ± 33.7 | 3.13 ± 0.26 | 20.80 | 0.01 | 0.06 | 0.35 | 3.58 |
| G1 | 21.43°N | 109.49°E | 31.88 | 30.77 | 8.26 | 8.50 | 262.1 ± 89.6 | 5.71 ± 0.19 | 5.00 | 0.05 | 0.13 | 5.49 | 5.62 |
| G2 | 21.40°N | 109.49°E | 31.33 | 31.13 | 8.24 | 8.01 | 237.2 ± 66.2 | 5.45 ± 0.14 | 8.40 | 0.07 | 0.21 | 19.63 | 12.21 |
| G3 | 21.34°N | 109.49°E | 31.56 | 31.90 | 8.30 | 8.23 | 74.3 ± 45.3 | 3.57 ± 0.23 | 15.00 | 0.06 | 0.12 | 4.25 | 8.98 |
| G4 | 21.23°N | 109.49°E | 30.81 | 32.71 | 8.10 | 6.60 | 23.4 ± 23.5 | 3.00 ± 0.29 | 27.20 | 0.01 | 0.06 | 1.59 | 7.09 |
| Note: The parameters of 222Rn and 226Ra are in activity concentrations; the parameters of phosphate, nitrite, nitrate and silicate are in concentrations. − represents no data. | |||||||||||||
| 222Rn ( considering without u and J) | Combined 222Rn and 226Ra | 222Rn (considering J) | 222Rn ( considering u and J) | |||||||
| Slope | R2 | Kh/(108 m2·d−1) | Kh/(108 m2·d−1) | u/(m·d−1) | Kh/(108 m2·d−1) | Kh/(108 m2·d−1) | ||||
| Section A | −0.07 | 0.821 9 | 0.39 | 0.55 | −1 106 | 2.10 | 2.13 | |||
| Section C | −0.05 | 0.413 7 | 0.60 | 0.73 | −743 | 1.69 | 1.72 | |||
| Section D | −0.07 | 0.802 5 | 0.42 | 0.46 | −328 | 0.80 | 0.81 | |||
| Section F | −0.07 | 0.328 9 | 0.35 | 0.67 | −2 410 | 1.04 | 1.12 | |||
| Section G | −0.12 | 0.979 0 | 0.12 | 0.17 | −518 | 0.41 | 0.42 | |||
| Mean | − | − | 0.38 ± 0.08 | 0.52 ± 0.10 | − | 1.21 ± 0.30 | 1.24 ± 0.31 | |||
| Note: Kh is the average value of the eddy diffusion coefficient, h refers to the sampling depth (m) above the pycnocline layer; u is the advection velocity (m/s); J is other 222Rn input or removal (Bq/(m3·s)); slope is the log-linear slope; R2 is the linear correlation coefficient; − represents no data. | ||||||||||
| Study area | Methods | Season | Kh/(108 m2·d−1) | Reference |
| Laizhou Bay | 224Ra | wet season | 2.53 | Wang et al. (2016) |
| East China Sea | 224Ra | wet season | 2.93 | Men et al. (2011) |
| dry season | 3.36 | Men et al. (2011) | ||
| Taiwan Strait | 224Ra | dry season | 2.16 | Men et al. (2013) |
| South Atlantic Bight | 223Ra, 224Ra | wet season | 0.31−0.36 | Moore (2000) |
| Yellow Sea | 223Ra, 224Ra, 226Ra | wet season | 2.53 | Su et al. (2013) |
| Long Island Sound | 224Ra | wet season | 0.004−0.043 | Torgersen et al. (1996) |
| San Diego to northwest of Hawaii | 226Ra | wet season | 0.09 | Chung (1976) |
| Northeast Pacific | 226Ra, 228Ra | − | 0.09 | Huh and Ku (1998) |
| − | 4.32 | Huh and Ku (1998) | ||
| East China Sea | 226Ra, 228Ra | wet season | 0.004 | Su (2013) |
| wet season | 2.22 | Su (2013) | ||
| Eastern Pacific Ocean | 226Ra, O2 and salinity | wet season | 0.86 | Ku et al. (1980) |
| Western Bay of Bengal | 226Ra, 228Ra | − | 0.86−8.64 | Rengarajan et al. (2002) |
| Cross-shelf of the Bering Sea | 228Ra | wet season | 1.90 | Xing et al. (2011) |
| Sub-Arctic waters | 228Ra | − | 0.43−0.86 | Moore et al. (1980) |
| World ocean | 228Ra | − | 0.86−8.64 | Kaufman et al. (1973) |
| Seto Inland Sea | 228Ra | dry season | 0.095−0.12 | Kasemsupaya et al. (1993) |
| Western Yellow Sea | 228Ra | wet season | 2.51 | Men et al. (2006) |
| Southeastern Bering Sea | salt balance | wet season | 0.86 | Coachman and Walsh (1981) |
| Middle Atlantic Bight | current meter and remotely sensed data | dry season | 0.026 | Fischer (1980) |
| Western Long Island Sound | 222Rn | wet season | >0.04 | Torgersen et al. (1997) |
| Catalina Harbor | 222Rn | wet season | 0.0005 | Colbert et al. (2008) |
| San Nicolas Basin | 222Rn | wet season | 0.0086 | Berelson et al. (1982) |
| Yellow-Bohai Sea | 222Rn | wet season | 3.92 | Wang et al. (2021) |
| dry season | 1.97 | Wang et al. (2021) | ||
| Beibu Gulf | 222Rn | dry season | 0.42−2.13 | this study |
| Note: Kh is the average value of the eddy diffusion coefficient, h refers to the sampling depth (m) above the pycnocline layer; − represents no data. | ||||
| Section | R2 | Kh/(108 m2·d−1) | ΔA/(Bq·(m3·m)−1) | FRn/(1012 Bq·d−1) |
| A | 0.821 9 | 2.13 | 0.02 | 2.98 |
| D | 0.802 5 | 0.81 | 0.04 | 2.30 |
| G | 0.979 0 | 0.42 | 0.05 | 1.47 |
| Mean | − | − | − | 2.24 ± 0.44 |
| Note: Kh is the average value of the eddy diffusion coefficient, h refers to the sampling depth (m) above the pycnocline layer; A is the 222Rn activity concentration at the sampling station; FRn: the offshore fluxes of 222Rn; R2: the linear correlation coefficient. | ||||
| River | Mean annual discharge/ (109 m3) | Fresh water endmember 222Rn/(Bq·m−3) | Average daily emission flux of 222Rn/ (1010 Bq·d−1) |
| Beilun | 29.40a | 1 859 ± 212c | 14.97 ± 1.71 |
| Jiangping | 7.67b | 640 ± 122c | 1.34 ± 0.26 |
| Fangcheng | 17.86a | 886 ± 149c | 4.34 ± 0.73 |
| Maoling | 16.20a | 234 ± 80c | 1.04 ± 0.36 |
| Qinjiang | 11.53a | 250 ± 80c | 0.79 ± 0.25 |
| Dafeng | 6.05a | 218 ± 86c | 0.36 ± 0.14 |
| Nanliu | 53.13a | 254 ± 74c | 3.70 ± 1.08 |
| Total river input flux | 141.84a | − | 26.54 ± 4.52 |
| Note: Fresh water endmember 222Rn parameter is in activity concentration. − represents no data. a data cited from Wu (2014); b data cited from Wang (2020); c data are from this study. | |||
| Kh/(108 m2·d−1) | Silicate Fnutri/ (mol·m−2·d−1) | Phosphate Fnutri/ (mol·m−2·d−1) | Nitrite Fnutri/ (mol·m−2·d−1) | Nitrate Fnutri/ (mol·m−2·d−1) | |
| Section A | 2.13 | 70.51 | 0.46 | 1.31 | 35.11 |
| Section C | 1.72 | 77.53 | 2.91 | 3.77 | 94.32 |
| Section D | 0.81 | 50.77 | 0.67 | 2.79 | 6.61 |
| Section F | 1.12 | 43.96 | 0.09 | 0.19 | 30.19 |
| Section G | 0.42 | 11.29 | 0.08 | 0.13 | 7.30 |
| Mean | 1.24 ± 0.31 | 50.81 ± 11.64 | 0.83 ± 0.53 | 1.64 ± 0.72 | 34.71 ± 15.99 |
| Mixed layer area/m2 | 7.00 × 10⁵ | 7.00 × 10⁵ | 7.00 × 10⁵ | 7.00 × 10⁵ | 7.00 × 10⁵ |
| Study area/m2 | 5.85 × 10⁹ | 5.85 × 10⁹ | 5.85 × 10⁹ | 5.85 × 10⁹ | 5.8 × 10⁹ |
| Flux | − | 6.28 × 10⁻³ | 0.10 × 10⁻³ | 0.20 × 10⁻³ | 4.15 × 10⁻³ |
| Note: Fnutri diffusion flux of nutrients; − represents no data. | |||||
 DownLoad:


 DownLoad: