Figure
1.
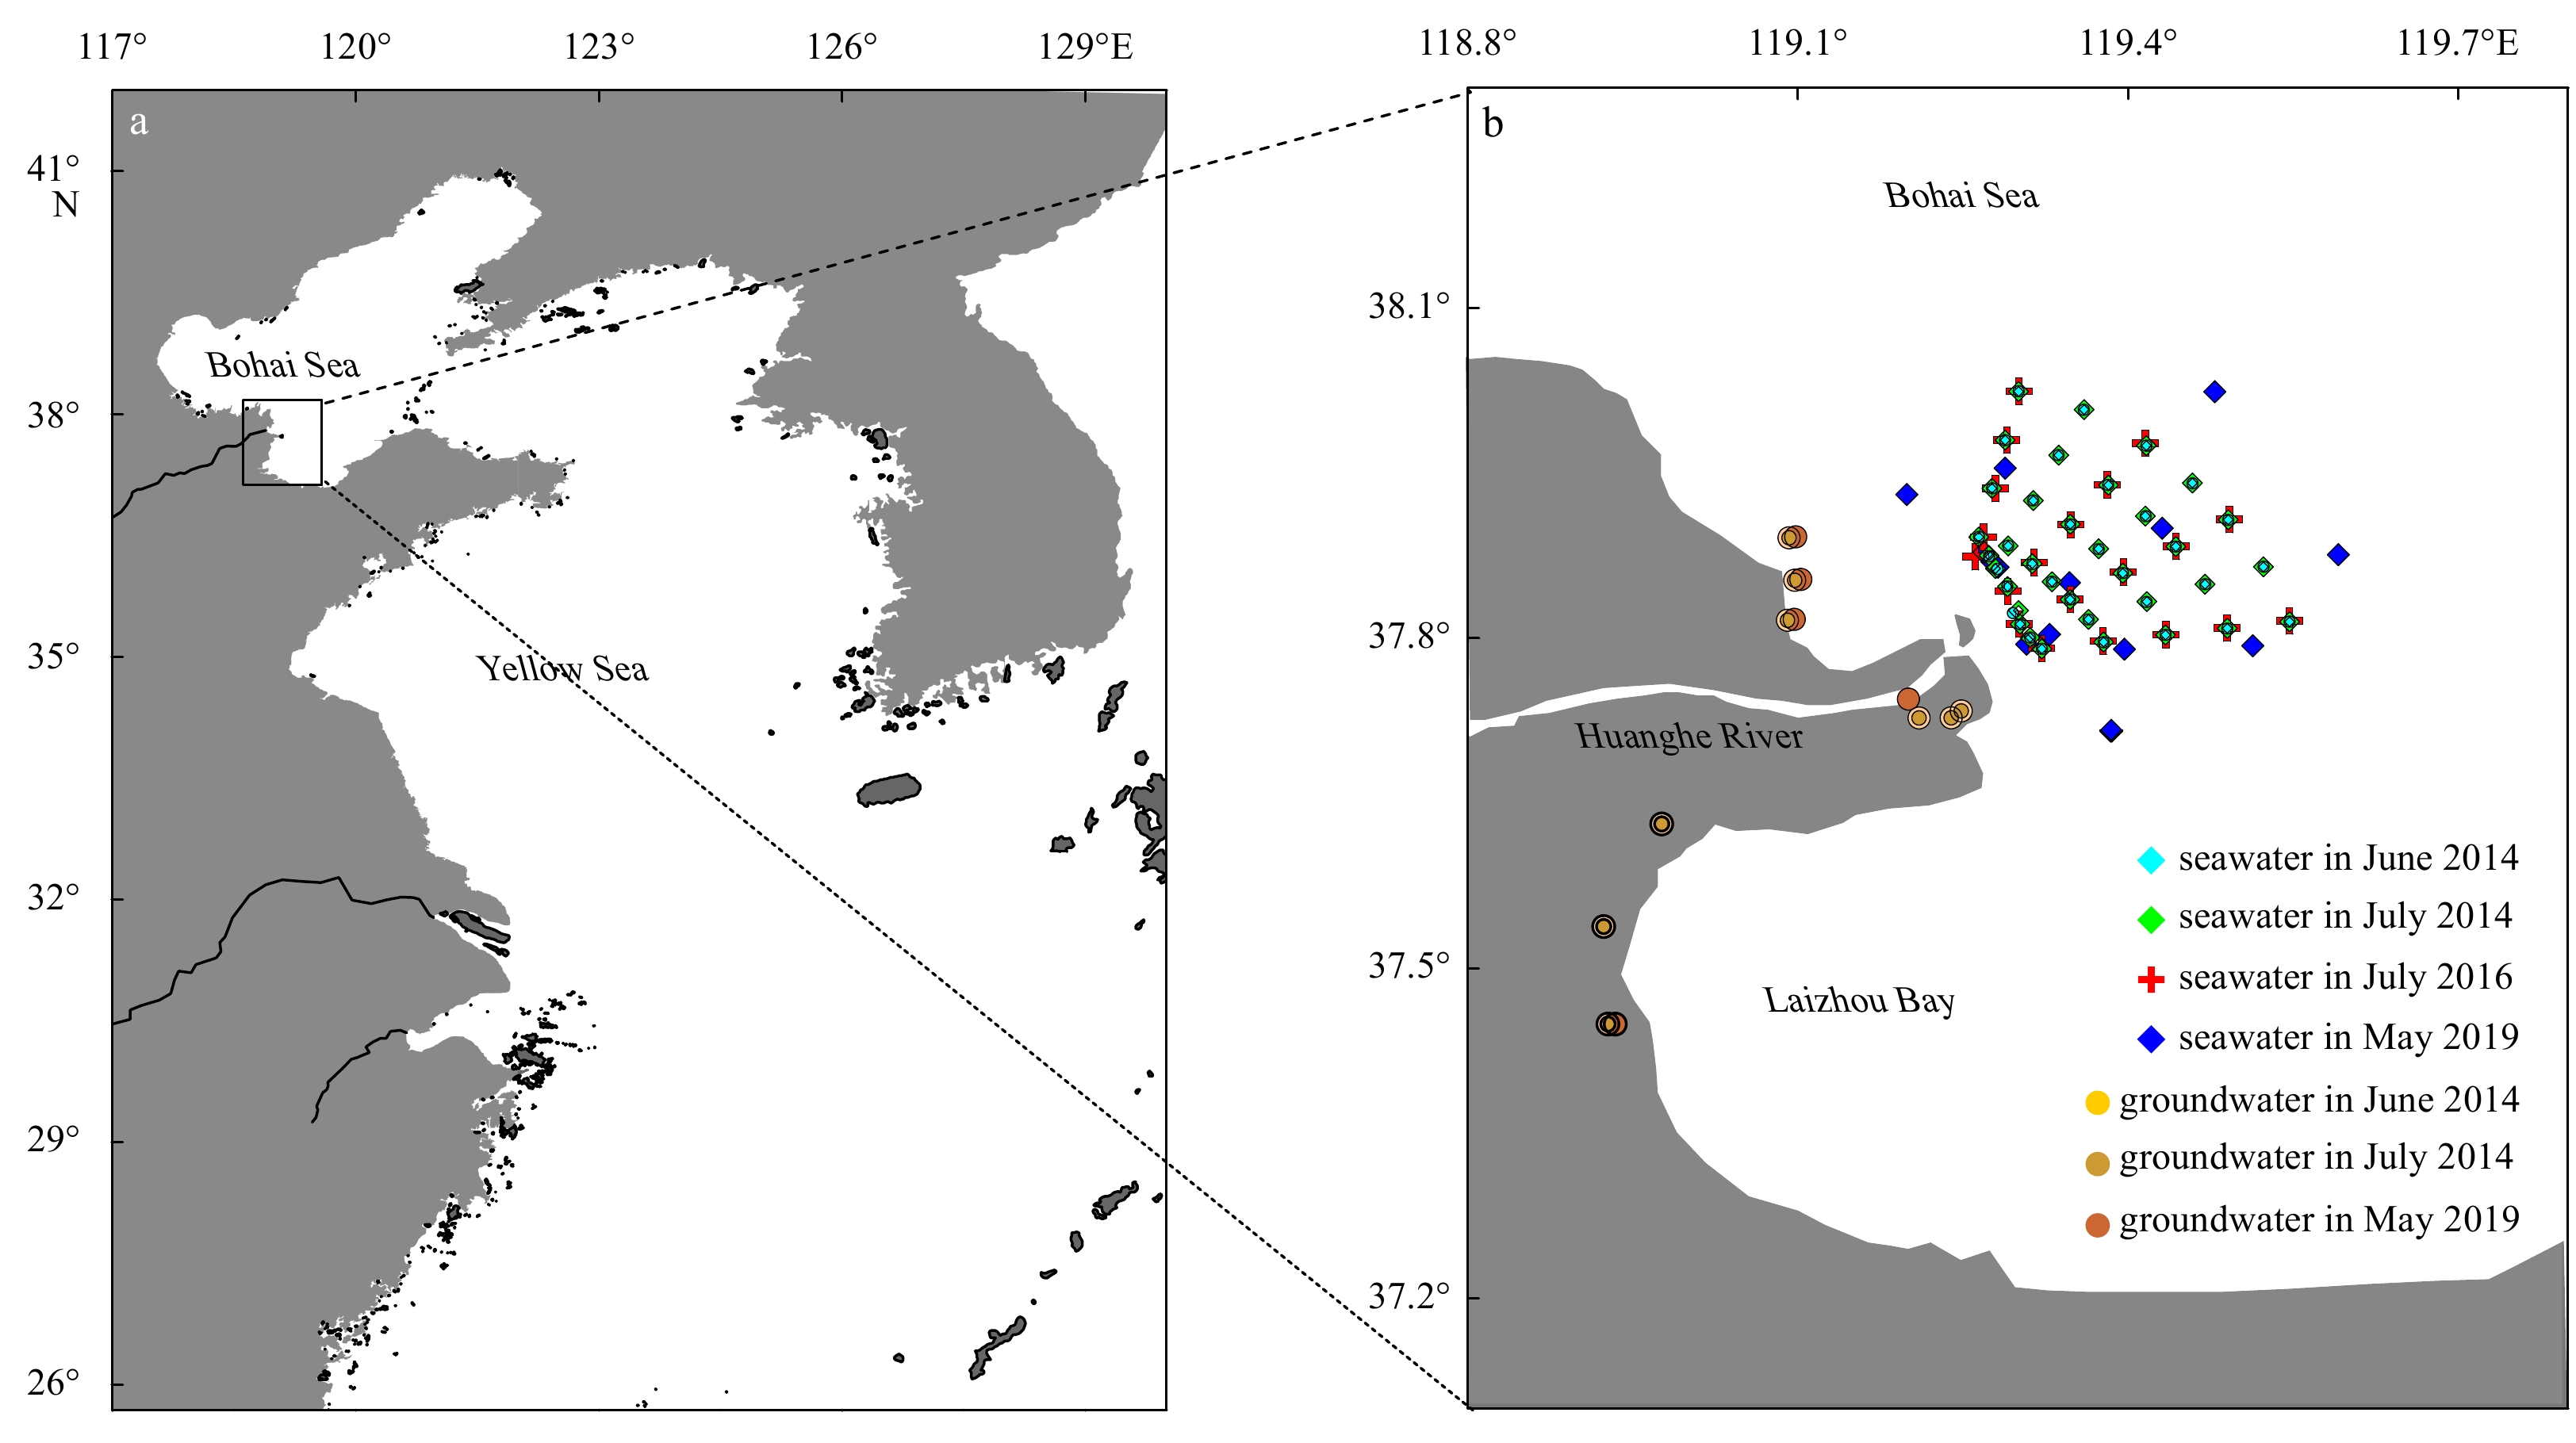
Study area of the Huanghe River Estuary (a), and locations of sampling stations for seawater and groundwater collected from 2014 to 2019 are denoted in color symbols (b).
| Citation: | Haowei Xu, Disong Yang, Xiaoyi Guo, Maosheng Gao, Guangquan Chen, Diansheng Ji, Shengtao Chen, Huaming Yu, Bochao Xu. Using radium isotopes to quantify submarine groundwater discharge at different scales in the Huanghe River Estuary, China[J]. Acta Oceanologica Sinica, 2023, 42(8): 32-39. doi: 10.1007/s13131-023-2236-0

|
Estuaries play an important role in transport of continental weathering materials from land to the sea (Meybeck and Vörösmarty, 2005). A large amount of terrestrial material will enter the ocean with the river discharge. In addition to terrestrial inputs, subterranean estuaries can also change the oceanic chemical budgets in coastal zones (Moore, 1996). Submarine groundwater discharge (SGD) is now considered as an important contributor to coastal ocean geochemical budgets that supplies a significant amount of nutrients and other constituents (e.g., carbon, trace metals) to estuaries and coastal zones (Swarzenski et al., 2007).
SGD has been commonly defined as any and all flow of water on continental margins from the seabed to the coastal ocean, regardless of fluid composition or driving force (Burnett et al., 2003; Taniguchi et al., 2019; Garcia-Orellana et al., 2021). This definition involves short-scale (centimeters) seawater-porewater interaction processes (short-scale SGD) and long-scale (meters to kilometers) groundwater transport processes (long-scale SGD). Of course, short-scale SGD may occur at deeper depths in certain environments with intense bioturbation, such as mangroves. It should be noted that the chemical composition of these water fluxes at different spatial and temporal scales may be considerably different due to factors such as the redox condition variations during transport. For example, Alorda-Kleinglass et al. (2019), in their study of coastal mine tailing, found that while most of the dissolved metals were remobilized and released into the water column by short-scale SGD, the dissolved Fe was imported into the ocean by long-scale SGD. Therefore, differentiating short-scale SGD and long-scale SGD from total SGD can better characterize the fluxes of dissolved constituents to coastal systems and their ecological implications.
Over the past decades, natural radium isotopes (Moore, 1996, 2007, 2010) and radon (Lambert and Burnett, 2003; Santos et al., 2008, 2009; Adyasari et al., 2023) are widely applied to estimate SGD flux/rate due to their conservative chemical behavior and distinct differences in the concentrations between groundwater and seawater. However, water fluxes across the sediment-water interface are commonly a mixture of several components due to heterogeneous nature of the spatial and temporal distribution of SGD. Thus, it can be challenging to differentiate advective fluxes into groundwater components, which commonly have resided in the aquifer for relatively long periods, and exchange of porewater, which often spends comparatively shorter time in contact with sediments. Radium isotopes (224Ra, T1/2 = 3.66 d; 223Ra, T1/2 = 11.4 d; 228Ra, T1/2 = 5.75 a; 226Ra, T1/2 = 1 600 a) appear to be reliable tracers for distinguishing and quantifying both long-scale SGD and short-scale SGD (Rodellas et al., 2017). Radium isotopes are enriched in both brackish groundwater and porewater relative to coastal ocean. Considering different half-lives, the ingrowth of radium isotopes governed by their decay constants makes them to be characteristic in endmembers associated with different processes. Thus, short-scale SGD occurring on shorter time scales does not allow a significant ingrowth of the long-lived radium isotopes, which might be valid for long-scale SGD (Gleeson et al., 2013). Therefore, endmembers with unique radium isotopes compositions may be a marker to differentiate long-scale SGD and short-scale SGD.
The Huanghe River Estuary (HRE) is a well-studied example of SGD in different biogeochemical and hydrological aspects. As the second longest river in China, the Huanghe River flows over 5 400 km and drains an area of 745 000 km2 (Jiang et al., 2007). Previous studies have found that abundant quantities of groundwater are discharged from the Huanghe River delta into the Bohai Sea, both by using seepage meters (Taniguchi et al., 2008) and Ra/Rn tracer-based method (Peterson et al., 2008; Xu et al., 2013, 2014; Xia et al., 2016; Wang et al., 2015). These discharged groundwaters and associated nutrients make important contributions to the coastal ecosystem, and studies have shown that SGD flux was higher than the Huanghe River and supplies about 70% of the total nutrient load to the HRE (Xu et al., 2013). A recent study found that SGD in the HRE is spatially heterogeneous and very important to alter the benthic biogeochemistry (i.e., pH, DO) (Chen et al., 2022). However, the above results are the quantification of total groundwater discharge fluxes mainly without distinguishing long-scale SGD and short-scale SGD processes. Outcomes of relative studies would surely improve the understanding of the key driving process on the benthic boundary of the HRE.
Therefore, the main goal of this work is to distinguish and quantify long-scale SGD and short-scale SGD fluxes into the HRE by using radium isotopes (223Ra and 224Ra) as tracers. Results obtained from this study would help to better understand the contribution of groundwater discharge processes to regional substances.
Four sampling cruises were conducted in the HRE in June 2014, July 2014, July 2016, and May 2019, and 104 sampling stations were setup as shown in Fig. 1. Water salinity, temperature, pH, and DO for all cruises were measured in situ via an XR-420 model submersible multichannel conductivity-temperature-depth sensor (RBR, Canada). Seawater samples were collected from 0.5 m below surface for radium isotopes (223Ra, 224Ra) analysis. During the same period, three field investigations along the coast of the Huanghe River delta were conducted to obtain groundwater samples in June 2014, July 2014, and May 2019. Results from the 2014 cruises were previously reported by Xu et al. (2016).
Seawater samples (about 80 L) were collected by using a submersible pump at each station during the cruises. Shallow groundwater samples of about 2 L (~0.5−1 m below the sediment surface) along the coast were collected at each site for radium analyses by using a push-point piezometer with a peristaltic pump. All water samples were pre-concentrated by passing through cartridges filled with ~20 g manganese impregnated acrylic fiber (“Mn-fiber”) at a flow rate of <1 L/min to quantitatively extract radium isotopes. After collection, all fibers were thoroughly washed with distilled water to remove residual salt and particulate matter. After being partially dried until the water/fiber mass ratio range reached ~0.8−1.0, fiber samples were taken to laboratory for later radium isotope activity measurements. The short-lived radium isotopes (223Ra and 224Ra) were then counted via the radium delayed coincidence counting system (RaDeCC) (Moore and Arnold, 1996; Moore, 2008). The measurement errors were on average 20% for 223Ra and 12% for 224Ra.
The radium quartet (223Ra, 224Ra, 226Ra, and 228Ra) have been proven to be powerful tracers for differentiating flows of long-scale SGD and short-scale SGD in coastal settings (Rodellas et al., 2017). These water fluxes occurring at multiple spatial scales can be quantified concurrently by mass balances for different radium isotopes, considering suitable half-lives matching with the timescales of water flow pathways (Alorda-Kleinglass et al., 2019). In this model, radium inputs and outputs are quantified, and the excess (or unexplained) radium inputs must come from SGD. Finally, different types of volumetric fluxes can be evaluated by dividing the excess radium flux by radium activity concentrations in different endmembers (Garcia-Orellana et al., 2021). Assuming steady state conditions, the mass balance for radium isotopes can thus be expressed as follows:
| $$ \begin{split}&F_{\rm{Ra}}-F_{\rm{ocean}}-F_{\rm{river}}-F_{\rm{diff}}+F_{\rm{dec}}=\\&Q_{\text{short-scale SGD}}\cdot {\rm{Ra}}_{\text{short-scale}}\cdot S+ Q_{\text{long-scale SGD}}\cdot {\rm{Ra}}_{\text{long-scale}}\cdot S , \end{split}$$ | (1) |
where FRa is the total Ra flux to the HRE (dpm/d) (1 Bq = 60 dpm); Focean is the radium flux contributed by the open ocean (dpm/d); Friver is the radium input from Huanghe River (dpm/d); Fdiff represents the radium fluxes diffusing bottom sediments (dpm/d); Fdec is the decay loss of Ra (dpm/d); Qshort-scale SGD is the short-scale SGD flux (m/d); Qlong-scale SGD is the long-scale SGD flux (m/d); Rashort-scale is the Ra activity concentration in short-scale SGD endmember (dpm/m3); Ralong-scale is the Ra activity concentration in long-scale SGD endmember (dpm/m3); and S is the seawater area (m2). Two radium isotopes, 223Ra and 224Ra, were used together to solve the two unknown terms of long-scale SGD and short-scale SGD in the equation.
Distribution patterns of salinity, 223Ra, and 224Ra in seawater are shown in Fig. 2, with detailed data listed in Table S1. During the sampling period, the salinity of seawater ranged from 11.80 to 27.29 (mean: 25.40) in June 2014, from 7.77 to 27.14 (mean: 22.57) in July 2014, from 23.96 to 30.15 (mean: 27.52) in July 2016, from 25.86 to 29.04 (mean: 27.62) in May 2019. Overall, the salinity showed lower values near the estuary and increased toward the open sea (Fig. 2a1−a4). However, the location of minimum salinity zone varied in different sampling periods, which was changed from the northern side of the estuary (June 2014 and July 2014) to the southern side of the estuary (July 2016 and May 2019). This phenomenon was corresponding with the deflection of the flushing direction of the Huanghe River diluted water (Xia et al., 2016).

During all four-sampling period, 223Ra (Fig. 2b1−b4) and 224Ra (Fig. 2c1−c4) showed similar temporal and spatial distributions in the coastal waters, which was higher nearshore and lower offshore. The main sources of radium isotopes in the HRE are the Huanghe River runoff input, suspended particulate matter (SPM) desorption, and long/short-scale SGD. During the four cruise surveys, the Huanghe River had the highest runoff and sediment load in July 2014, while the highest isotopic levels of 223Ra and 224Ra were observed in the HRE ranging from 6.03 dpm/m3 to 41.3 dpm/m3 and 121 dpm/m3 to 1 810 dpm/m3, respectively.
The salinity and radium activities in groundwater during coastal investigations (June 2014, July 2016, and May 2019) are given in Table S2. The salinity of groundwater samples ranged from 13.66 to 44.80. Salinization of groundwater implies that the recirculated seawater dominates the shallow coastal aquifer in the Huanghe River delta region. The averaged activity concentrations of 223Ra and 224Ra (480 dpm/m3 and 17 800 dpm/m3) in groundwater were approximately 23 and 36 times higher than in the coastal seawaters, respectively.
In order to constrain the 224Ra and 223Ra activities in the short-scale SGD endmember, the 224Ra/223Ra activity ratios (AR224/223) in nearshore coastal waters can be used (Alorda-Kleinglass et al., 2019). The AR224/223 in nearshore coastal waters has proven to be a useful tool for quantifying water age (Moore, 2000). The temporal scales of short-scale SGD are ranging from second to day, so there would be no significant change in the AR224/223 during this process. Assuming that short-scale SGD input is the main source of short-lived radium isotopes to coastal waters and there is no significant decay in nearshore samples, the AR224/223 in those samples should be the same as the AR224/223 in the short-scale SGD endmember. We therefore used the average of activity concentrations measured in the samples with AR224/223 comparable to those measured in coastal waters (AR224/223, ~25) as the endmember for short-scale SGD. The remaining samples (average AR224/223, > 40) were then used as the endmember for long-scale SGD. The apparently different signatures between endmembers supported the separate estimations of short-scale SGD and long-scale SGD processes sound.
To calculate the apparent residence time of seawater in the HRE, we used the “Apparent Radium Age” model pioneered by Moore (2000), which is the commonly applied approach in continental shelf and large river plume environments (Xu et al., 2016; Garcia-Orellana et al., 2021; Wang et al., 2021; Guo et al., 2022). The water ‘‘age” represents the time that passed since the short-lived radium isotopes were added to the system from a common source with a constant isotopic composition. 224Ra and 223Ra were used because their short half-lives are suited for the expected short residence times on time scales of days to weeks. Thus, the water residence times (τ) of four cruise periods are calculated by Eq. (2),
| $$ \tau = \frac{\rm{ln}[({{{\rm{Ra}}}}_{224}/{\rm{Ra}}_{223})_{\rm{obs}}/{({\rm{Ra}}_{224}/{\rm{Ra}}_{223})}_{\rm{i}}]}{ \text{λ}_{223}- \text{λ} _{224}} , $$ | (2) |
where (Ra224/Ra223)obs refers to the radium activity ratio at a specific sampling location/time, while (Ra224/Ra223)i represents the initial activity ratio at/near the source. The λ223 and λ224 are the decay constants of 223Ra and 224Ra, respectively. The apparent water age, τ, represents the calculated water residence time. In our case, (Ra224/Ra223)i is the maximum ratio among all sampling locations for each cruise, and (Ra224/Ra223)obs is the average radium activity ratio of all sampling stations in the system.
The water residence time was calculated to be ranged from 3−7 d. Xu et al. (2016) estimated the residence time of the HRE from 5 d to 8 d using the “Apparent Radium Age” model. Xia et al. (2016) estimated the residence time of 2.7−3.8 d by radium age model. Compared with the previously reported results, it is reasonable for the estimated residence time of HRE to be on the time scale of about one week. The study area was calculated to be approximately 400 km2. Therefore, the average aerial mixing rate for four cruises were about 52.84 km2/d, 70.80 km2/d, 52.42 km2/d, and 127.7 km2/d, respectively. These differences are mainly due to the altered Huanghe River discharge (Table 1). A larger amount of fresh water was discharged into the estuary in July 2014 and May 2019, resulting in much lower salinities and younger water ages.
| Parameter | June 2014 | July 2014 | July 2016 | May 2019 | |||||||
| 224Ra | 223Ra | 224Ra | 223Ra | 224Ra | 223Ra | 224Ra | 223Ra | ||||
| S/m2 | 4.00×10⁸ | 4.00×10⁸ | 4.00×10⁸ | 4.00×10⁸ | 4.00×10⁸ | 4.00×10⁸ | 4.00×10⁸ | 4.00×10⁸ | |||
| V/m3 | 5.83×10⁹ | 5.83×10⁹ | 5.83×10⁹ | 5.83×10⁹ | 5.83×10⁹ | 5.83×10⁹ | 5.83×10⁹ | 5.83×10⁹ | |||
| $\text{λ} $/d−1 | 0.19 | 0.06 | 0.19 | 0.06 | 0.19 | 0.06 | 0.19 | 0.06 | |||
| k/(dpm·m−2·d−1) | 54.4 | 0.68 | 54.4 | 0.68 | 54.4 | 0.68 | 54.4 | 0.68 | |||
| Ad/(dpm·g−1) | 0.18 | 0.004 | 0.18 | 0.004 | 0.18 | 0.004 | 0.18 | 0.004 | |||
| $\tau $/d | 7.57 | 7.57 | 5.65 | 5.65 | 7.63 | 7.63 | 3.13 | 3.13 | |||
| I/dpm | 9.85×10¹¹ | 6.79×10¹¹ | 3.75×10¹² | 1.22×10¹¹ | 2.26×10¹² | 1.01×10¹¹ | 2.34×10¹² | 1.16×10¹¹ | |||
| Ao/(dpm·m−3) | 27.6 | 3.88 | 121 | 6.03 | 174 | 5.93 | 26.3 | 10.2 | |||
| Qr/(m3·s−1) | 378 | 378 | 3 007 | 3 007 | 594 | 594 | 1 003 | 1 003 | |||
| Ar/(dpm·m−3) | 426 | 9.03 | 986 | 26.5 | 651 | 12.0 | 679 | 18.8 | |||
| Cspm/(g·m−3) | 580 | 580 | 2 335 | 2 335 | 354 | 354 | 1 215 | 1 215 | |||
| FRa/(dpm·d−1) | 1.30×10¹¹ | 8.96×10⁹ | 6.64×10¹¹ | 2.15×10¹⁰ | 2.96×10¹¹ | 1.32×10¹⁰ | 7.25×10¹¹ | 3.58×10¹⁰ | |||
| Focean/(dpm·d−1) | 2.13×10¹⁰ | 2.99×10⁹ | 1.24×10¹¹ | 6.22×10⁹ | 1.33×10¹¹ | 4.53×10⁹ | 4.74×10¹⁰ | 1.85×10¹⁰ | |||
| Friver/(dpm·d−1) | 1.73×10¹⁰ | 3.67×10⁸ | 3.65×10¹¹ | 9.21×10⁹ | 3.67×10¹⁰ | 6.86×10⁸ | 7.78×10¹⁰ | 2.03×10⁹ | |||
| Fdec/(dpm·d−1) | 1.84×10¹¹ | 4.13×10⁹ | 7.10×10¹¹ | 7.39×10⁹ | 4.28×10¹¹ | 6.11×10⁹ | 4.30×10¹¹ | 6.82×10⁹ | |||
| Fdiff/(dpm·d−1) | 2.18×10¹⁰ | 2.74×10⁸ | 2.18×10¹⁰ | 2.74×10⁸ | 2.18×10¹⁰ | 2.74×10⁸ | 2.18×10¹⁰ | 2.74×10⁸ | |||
| Rashort-scale/(dpm·m−3) | 18 600 | 739 | 18 300 | 596 | 18 600 | 739 | 16 000 | 665 | |||
| Ralong-scale/(dpm·m−3) | 21 100 | 510 | 8 250 | 76.2 | 12 000 | 218 | 19 400 | 288 | |||
| Qshort-scale SGD/(m·d−1) | 0.03 | 0.03 | 0.03 | 0.03 | 0.03 | 0.03 | 0.04 | 0.04 | |||
| Qlong-scale SGD/(m·d−1) | 0.01 | 0.01 | 0.19 | 0.19 | 0.07 | 0.07 | 0.10 | 0.10 | |||
| Note: S is the seawater area; V is total seawater volume of Huanghe River Estuary (HRE); $\text{λ} $ is the decay constant of Ra, which is 0.19 d−1 and 0.06 d−1 for 224Ra and 223Ra, respectively; k is the diffusion coefficient of radium, which is cited from Wang et al. (2019); Ad is the desorption coefficient; $\tau $ is the water residence time; I is the Ra stock in the HRE; Ao is the activity concentration of radium in the Bohai Sea; Qr is Huanghe River runoff; Ar is activity concentration of dissolved radium in the Huanghe River; Cspm is concentration of suspended particulate matter in the Huanghe River; FRa is the total Ra flux to the HRE; Focean is the radium flux contributed by the open ocean; Friver is the radium input from Huanghe River; Fdec is the decay loss of Ra; Fdiff is the radium flux diffusing bottom sediments; Rashort-scale is the Ra activity in short-scale SGD endmember; Ralong-scale SGD is the Ra activity in long-scale SGD endmember; Qshort-scale SGD is the short-scale SGD flux; Qlong-scale SGD is the long-scale SGD flux. | |||||||||||
 DownLoad:
CSV
DownLoad:
CSV
Based on the mass balance for 224Ra and 223Ra, the long-scale SGD and short-scale SGD fluxes into the HRE can be solved by putting the source and sink terms of these two tracers in Eq. (1). Parameters needed for the mass balance model are shown in Table 1 and discussed as follows.
As an important parameter in the mass balance model, the evaluation of radium storage is crucial for estimating long-scale SGD and short-scale SGD because it directly affects the total radium flux to the HRE. In order to calculate the 224Ra and 223Ra stocks, the total study region was divided into 48 triangular elements (Fig. S1). The stock of a radium isotope in each triangular cell was calculated as the product of the area, the mean seawater depth, and the mean radium activity of the corresponding triangular cell.
Overall, the total seawater area (S) and volume (V) of HRE were estimated to be 4.00 × 10⁸ m2 and 5.83×10⁹ m3, respectively. Stocks of 224Ra and 223Ra during the four cruises were estimated to be 9.85 × 10¹¹ dpm and 6.79 × 10¹⁰ dpm (June 2014), 3.75 × 10¹² dpm and 1.22 × 10¹¹ dpm (July 2014), 2.26 × 10¹² dpm and 1.01 × 10¹¹ dpm (July 2016), 2.34 × 10¹² dpm and 1.16 × 10¹¹ dpm (May 2019), respectively. Dividing the amount of Ra stock by the water residence times, the total fluxes (FRa) of 224Ra and 223Ra were estimated to be 1.30 × 10¹¹ dpm/d and 8.96 × 10⁹ dpm/d (June 2014), 6.64 × 10¹¹ dpm/d and 2.15 × 10¹⁰ dpm/d (July 2014), 2.96 × 10¹¹ dpm/d and 1.32 × 10¹⁰ dpm/d (July 2016), 7.25 × 10¹¹ dpm/d and 3.58 × 10¹⁰ dpm/d (May 2019), which were shown in Table 1.
Radium inputs from river are composed of river water dissolved radium and the desorbed radium from SPM. The activity concentrations of dissolved Ra (Ar) and SPM concentration (Cspm) in the Huanghe River were measured and the results are shown in Table 1. These samples were collected at the Lijin station, which is about 100 km upstream of the river mouth. Thus, the fluxes of dissolved 224Ra and 223Ra during the four cruises were estimated to be 1.39 × 10¹⁰ dpm/d and 2.95 × 10⁸ dpm/d (June 2014), 2.56 × 10¹¹ dpm/d and 6.89 × 10⁹ dpm/d (July 2014), 3.34 × 10¹⁰ dpm/d and 6.17 × 10⁸ dpm/d (July 2016), 5.88 × 10¹⁰ dpm/d and 1.63 × 10⁹ dpm/d (May 2019) by multiplying the Ra activity concentration by the riverine runoff.
In order to calculate the desorption of radium from suspended particles, a series of single factor laboratory simulation experiments were previously conducted in our laboratory (Yang et al., 2019). A matrix of varying salinity (0.5, 10, 20, and 30) and SPM concentrations (0.2−15 g/L) were set up to evaluate the influence of these parameters on radium desorption. The results showed a linear relationship between the activities of radium with SPM concentrations (R2 > 0.8) when salinities are at 10 or above. And the desorption coefficient (Ad) of 224Ra in seawater with a salinity of 30 was obtained as 0.18 dpm/g. Due to the low abundance of 223Ra in nature, the Ad of 223Ra was estimated by the Ad of 224Ra and the ratio of 223Ra activity to 224Ra activity in river water, which was calculated to be 0.004 dpm/g. We used these Ra desorption ratios to estimate the desorption fluxes of 224Ra and 223Ra from Huanghe River for the four cruises at 3.41 × 10⁹ dpm/d and 7.24 × 10⁷ dpm/d (June 2014), 1.09 × 10¹¹ dpm/d and 2.32 × 10⁹ dpm/d (July 2014), 3.28 × 10⁹ dpm/d and 6.95 × 10⁷ dpm/d (July 2016), 1.90 × 10¹⁰ dpm/d and 4.02 × 10⁸ dpm/d (May 2019). Thus, the fluxes of 224Ra and 223Ra from Huanghe River (Friver) summed to 1.73 × 10¹⁰ dpm/d and 3.67 × 10⁸ dpm/d (June 2014), 3.65 × 10¹¹ dpm/d and 9.21 × 10⁹ dpm/d (July 2014), 3.67 × 10¹⁰ dpm/d and 6.86 × 10⁸ dpm/d (July 2016), 7.78 × 10¹⁰ dpm/d and 2.03 × 10⁹ dpm/d (May 2019), which were shown in Table 1. These inputs are less than 15% of the total radium fluxes necessary to support the measured stocks, except for June 2014 (more than 42.3%).
The radium in Bohai Sea seawater flowing into the HRE is an important radium addition despite their low activity. The activity concentrations of 224Ra and 223Ra in the Bohai Sea (Ao) were determined using the lowest activity concentrations of 224Ra and 223Ra during each sampling period, which were 27.6 dpm/m3 and 3.88 dpm/m3 (June 2014), 121 dpm/m3 and 6.03 dpm/m3 (July 2014), 174 dpm/m3 and 5.93 dpm/m3(July 2016), 26.3 dpm/m3 and 10.2 dpm/m3 (May 2019), respectively (Table 1). Thus, the radium flux contributed by the open ocean (Focean) can be calculated by multiplying the radium activity concentration in the open ocean over the average HRE water volume (m3) and then dividing by the water age.
The additions of 224Ra contributed by the Bohai Sea were thus 2.13 × 10¹⁰ dpm/d (June 2014), 1.24 × 10¹¹ dpm/d (July 2014), 1.33 × 10¹¹ dpm/d (July 2016), and 4.74 × 10¹¹ dpm/d (May 2019). As for 223Ra, they are 2.99 × 10⁹ dpm/d (June 2014), 6.22 × 10⁹ dpm/d (July 2014), 4.53 × 10⁹ dpm/d (July 2016), and 1.85 × 10¹⁰ dpm/d (May 2019).
The decay flux can be calculated by Eq. (3) as follows:
| $$ F_{\rm{dec}}=I\cdot {\text{λ}}, $$ | (3) |
where I (dpm) is the Ra stock in the HRE, which is calculated in the Section 4.1.1; λ is the decay constant of Ra (d−1), which is 0.19 d−1 and 0.06 d−1 for 224Ra and 223Ra, respectively. The decay fluxes of 224Ra and 223Ra in the four cruises were estimated to be 1.87 × 10¹¹ dpm/d and 4.13 × 10⁹ dpm/d (June 2014), 7.10 × 10¹¹ dpm/d and 7.39 × 10⁹ dpm/d (July 2014), 4.28 × 10¹¹ dpm/d and 6.11 × 10⁹ dpm/d (July 2016), 4.30×10¹¹ dpm/d and 6.82 × 10⁹ dpm/d (May 2019), which were shown in Table 1.
Radium inputs from sediments are estimated by using the following formulation:
| $$ F_{\rm{diff}}=k\cdot S , $$ | (4) |
where k is the diffusion coefficient (dpm/(m2·d)) of radium, which is cited from Wang et al. (2019); S equals 4.00 × 10⁸ m2. We assumed that k was constant during the four cruises, and thus the diffusive fluxes of 224Ra and 223Ra were estimated to be 2.18 × 10¹⁰ dpm/d and 2.74 × 10⁸ dpm/d, respectively. Consequently, the radium contribution of sediment may be ignored compared to other inputs at high runoff rates, but not at low riverine runoff.
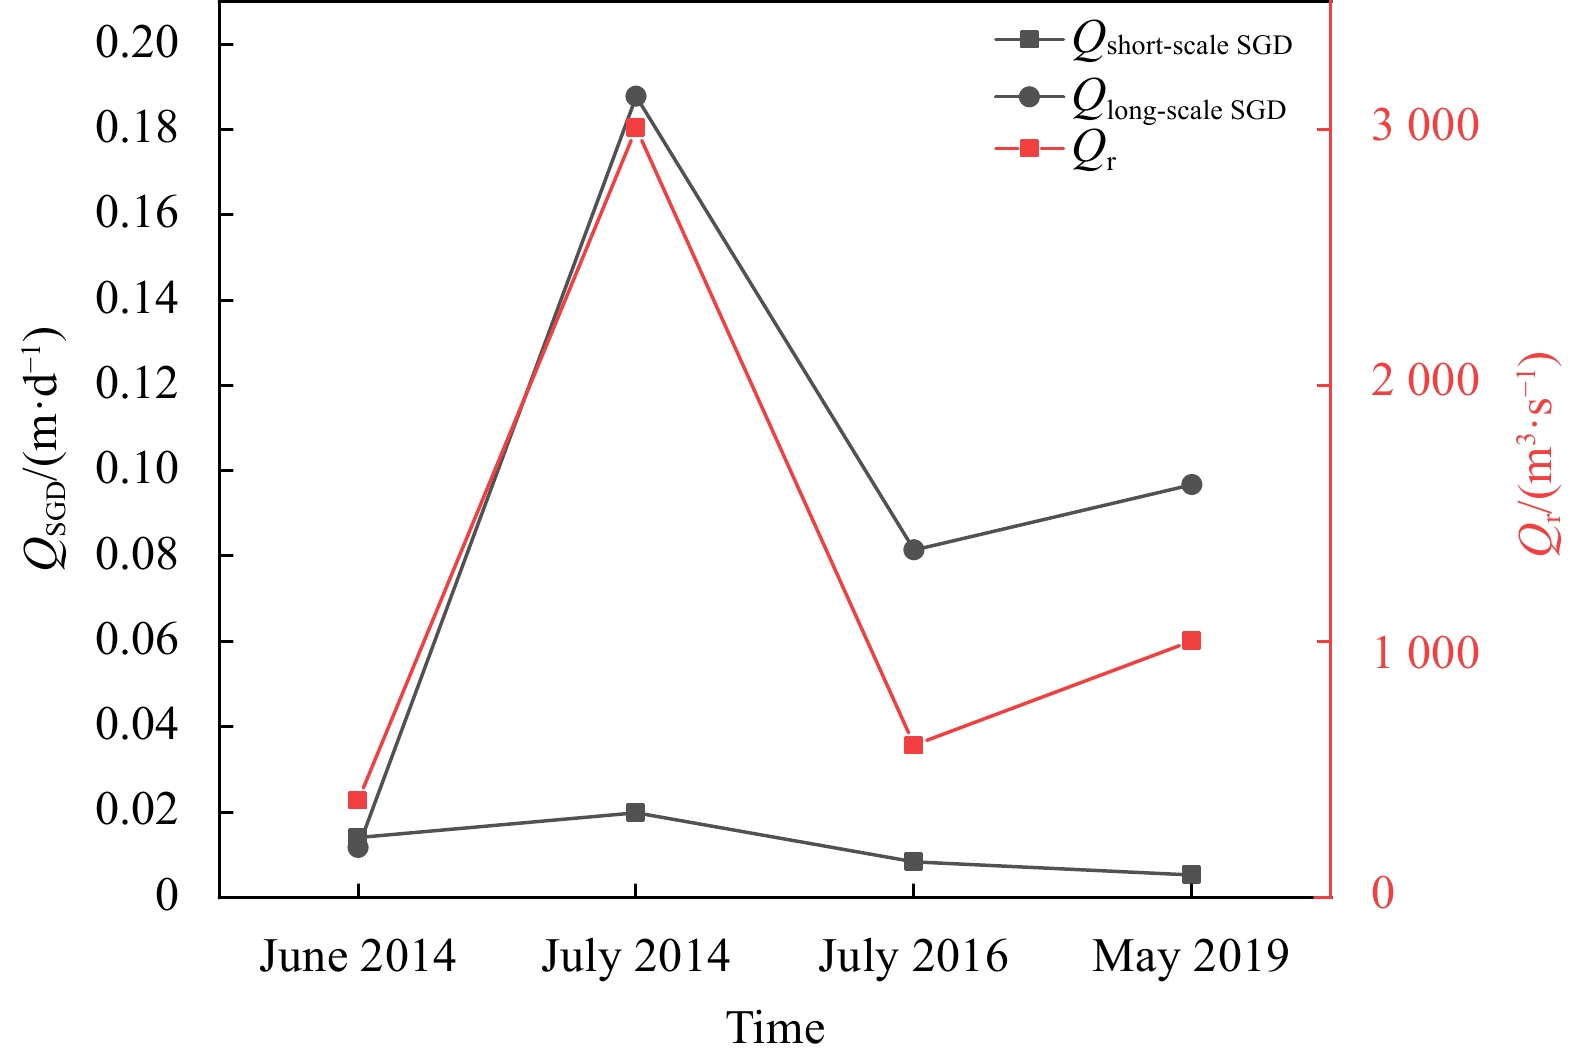
The estimated short-scale SGD fluxes from four different cruises were 0.03 m/d (June 2014), 0.03 m/d (July 2014), 0.03 m/d (July 2016), and 0.04 m/d (May 2019), indicating the short spatial-temporal scale process was almost identical among seasons. While the long-scale SGD fluxes were more variable at 0.01 m/d (June 2014), 0.19 m/d (July 2014), 0.07 m/d (July 2016), and 0.10 m/d (May 2019), suggesting long-scale SGD fluxes were strongly influenced by seasonal factors in this region. The Huanghe River runoff and groundwater flow discharge rates for different periods are shown in Fig. 3. The good linear relationship between long-scale SGD flux and river discharge (R2 = 0.895) indicates that long-scale SGD is strongly influenced by the Huanghe River, while short-scale SGD is barely influenced by river discharge (Fig. S2).

Groundwater discharges include terrestrial groundwater discharge, density-driven recirculating seawater release, and other hydrodynamic processes. Xu et al. (2014) showed that an increase in Huanghe River runoff would enhance the rate of groundwater discharge in the HRE, and Xia et al. (2016) reported increases of the SGD flux from 2−20 cm/d to 67−122 cm/d because of the Water–Sediment Regulation Scheme event. These studies also explain the strong correlation between the river flow and SGD. Previous study reported that large amounts of silty clay containing high water contents are deposited near the river mouth, while some underground paleo-channels are spread throughout the Huanghe River delta (Yu, 2002). Thus, when the runoff of the Huanghe River increases, these paleo-channels may be decongested by higher fluvial hydraulic head and serve as more significant pathways for groundwater-seawater interaction (Stieglitz, 2005). This explains why long-scale SGD is only equivalent to 30% of short-scale SGD during low runoff periods (June 2014), while can reach up to 6 times of short-scale SGD during high runoff periods (July 2014).
Selecting representative end-members of 224Ra and 223Ra in mass balance models is of great importance to calculate the fluxes of long-scale SGD and short-scale SGD. In this study, we used sensitivity analysis to discuss the impact of parameter variation on the estimated results. Sensitivity analysis was performed to examine the contribution of the single parameter to the fluxes of long-scale SGD and short-scale SGD by increasing and decreasing the parameter by 10% without changing the other parameters. In this study, parameters of water age, desorption factor of SPM, sediment release, and activity concentrations of radium in river, endmembers of long-scale SGD and short-scale SGD were selected for the sensitivity analysis (Table 2).
| Term | 10% increase in term value | 10% decrease in term value | |||
| Change in short-scale SGD flux | Change in long-scale SGD flux | Change in short-scale SGD flux | Change in long-scale SGD flux | ||
| June 2014 | |||||
| $\tau $ | −9.30% | +20.55% | +11.36% | −25.11% | |
| Ar | +0.12% | −3.54% | −0.12% | +3.54% | |
| Ad | +0.03% | −0.87% | −0.03% | +0.87% | |
| Fdiff | +0.77% | −8.12% | −0.77% | +8.12% | |
| Ralong/short-scale | −9.09% | −9.09% | +11.11% | +11.11% | |
| July 2014 | |||||
| $\tau $ | −17.92% | −1.36% | +21.91% | +1.67% | |
| Ar | −8.66% | −0.96% | +8.66% | +0.96% | |
| Ad | −2.50% | −0.83% | +2.50% | +0.83% | |
| Fdiff | −0.14% | −0.29% | +0.14% | +0.29% | |
| Ralong/short-scale | −9.09% | −9.09% | +11.11% | +11.11% | |
| July 2016 | |||||
| $\tau $ | −12.56% | +2.66% | +15.35% | −3.25% | |
| Ar | −0.02% | −0.96% | +0.02% | +0.96% | |
| Ad | −0.02% | −0.08% | +0.02% | +0.08% | |
| Fdiff | +0.30% | −0.80% | −0.30% | +0.80% | |
| Ralong/short-scale | −9.09% | −9.09% | +11.11% | +11.11% | |
| May 2019 | |||||
| $\tau $ | −9.63% | −4.91% | +11.76% | +6.00% | |
| Ar | −1.11% | −0.40% | +1.11% | +0.40% | |
| Ad | −0.18% | −0.19% | +0.18% | +0.19% | |
| Fdiff | +0.07% | −0.31% | −0.07% | +0.31% | |
| Ralong/short-scale | −9.09% | −9.09% | +11.11% | +11.11% | |
| Note: $\tau $ is the water residence time; Ar is activity concentration of dissolved radium; Ad is the desorption coefficient; Fdiff is the radium flux diffusing bottom sediments. | |||||
DownLoad:
CSV
Sensitivity analysis showed that water age and radium activity concentrations in endmembers of SGD had important influences on long-scale SGD and short-scale SGD. Water age had the greatest degree of influence, with a 10% variation leading to a change in the final discharge rate of up to 25%. Variations in radium activity concentrations in endmembers of long/short-scale SGD had an effect of about 10% on long-scale SGD and short-scale SGD. As an important factor affecting the distribution of radium in groundwater, the heterogeneity of ionic strength (salinity) in sediment distribution makes it possible to show several orders of magnitude variation in the activity concentration of radium in coastal groundwater (Webster et al., 1995; Duque et al., 2019). This explains the fact that the maximum activities of 224Ra and 223Ra were an order of magnitude greater than the minimum activities in this study. Overall, both determining water age and selecting 224Ra and 223Ra activity concentrations in endmembers of long/short-scale SGD were crucial for estimating the fluxes of long-scale SGD and short-scale SGD. In contrast, the accuracy of determining SPM resolution factors, the activity concentrations of radium in Huanghe River, and sediment diffusion had negligible effect on the results of the long-scale SGD and short-scale SGD calculations. SPM resolution factors had the least degree of influence, with a 10% variation leading to a change in the final discharge rate of less than 3%. As for the 10% variation of the activity concentrations of radium in Huanghe River and sediment discharge, the change of results was less than 5% in most cases.
In this study, four field surveys were conducted to compare the characteristics of radium isotope distribution in different periods in the HRE. By using the association of radium isotopes, both long-scale SGD and short-scale SGD fluxes in the HRE were calculated in different periods. The results showed that short-scale SGD remained basically unchanged among seasons at 0.03−0.04 m/d. However, the long-scale SGD fluxes varied greatly in different periods at 0.01−0.19 m/d, which was well corresponded with the variation of the Huanghe River discharge. The maximum flux of long-scale SGD could be up to 6 times higher than that of short-scale SGD.
|
Adyasari D, Dimova N T, Dulai H, et al. 2023. Radon-222 as a groundwater discharge tracer to surface waters. Earth-Science Reviews, 238: 104321. doi: 10.1016/j.earscirev.2023.104321
|
|
Alorda-Kleinglass A, Garcia-Orellana J, Rodellas V, et al. 2019. Remobilization of dissolved metals from a coastal mine tailing deposit driven by groundwater discharge and porewater exchange. Science of the Total Environment, 688: 1359–1372. doi: 10.1016/j.scitotenv.2019.06.224
|
|
Burnett W C, Bokuniewicz H, Huettel M, et al. 2003. Groundwater and pore water inputs to the coastal zone. Biogeochemistry, 66(1−2): 3–33
|
|
Chen Guangquan, Xu Bochao, Zhao Shibin, et al. 2022. Submarine groundwater discharge and benthic biogeochemical zonation in the Huanghe River Estuary. Acta Oceanologica Sinica, 41(1): 11–20. doi: 10.1007/s13131-021-1882-3
|
|
Duque C, Knee K L, Russoniello C J, et al. 2019. Hydrogeological processes and near shore spatial variability of radium and radon isotopes for the characterization of submarine groundwater discharge. Journal of Hydrology, 579: 124192. doi: 10.1016/j.jhydrol.2019.124192
|
|
Garcia-Orellana J, Rodellas V, Tamborski J, et al. 2021. Radium isotopes as submarine groundwater discharge (SGD) tracers: Review and recommendations. Earth-Science Reviews, 220: 103681. doi: 10.1016/j.earscirev.2021.103681
|
|
Gleeson J, Santos I R, Maher D T, et al. 2013. Groundwater–surface water exchange in a mangrove tidal creek: Evidence from natural geochemical tracers and implications for nutrient budgets. Marine Chemistry, 156: 27–37. doi: 10.1016/j.marchem.2013.02.001
|
|
Guo Qiaona, Zhao Yue, Li Mengjun, et al. 2022. Radium isotope assessment of submarine groundwater discharge and associated nutrient inputs in eastern Liaodong Bay, China. Frontiers in Marine Science, 9: 916109. doi: 10.3389/fmars.2022.916109
|
|
Jiang Xueyan, Yu Zhigang, Ku T L, et al. 2007. Behavior of uranium in the Yellow River Plume (Yellow River Estuary). Estuaries and Coasts, 30(6): 919–926. doi: 10.1007/BF02841385
|
|
Lambert M J, Burnett W C. 2003. Submarine groundwater discharge estimates at a Florida coastal site based on continuous radon measurements. Biogeochemistry, 66(1−2): 55–73
|
|
Meybeck M, Vörösmarty C. 2005. Fluvial filtering of land-to-ocean fluxes: from natural Holocene variations to Anthropocene. Comptes Rendus Geoscience, 337(1–2): 107–123. doi: 10.1016/j.crte.2004.09.016
|
|
Moore W S. 1996. Large groundwater inputs to coastal waters revealed by 226Ra enrichments. Nature, 380(6575): 612–614. doi: 10.1038/380612a0
|
|
Moore W S. 2000. Ages of continental shelf waters determined from 223Ra and 224Ra. Journal of Geophysical Research: Oceans, 105(C9): 22117–22122. doi: 10.1029/1999JC000289
|
|
Moore W S. 2007. Seasonal distribution and flux of radium isotopes on the southeastern U. S. continental shelf. Journal of Geophysical Research: Oceans, 112(C10): C10013. doi: 10.1029/2007JC004199
|
|
Moore W S. 2008. Fifteen years experience in measuring 224Ra and 223Ra by delayed-coincidence counting. Marine Chemistry, 109(3−4): 188–197. doi: 10.1016/j.marchem.2007.06.015
|
|
Moore W S. 2010. The effect of submarine groundwater discharge on the ocean. Annual Review of Marine Science, 2(1): 59–88. doi: 10.1146/annurev-marine-120308-081019
|
|
Moore W S, Arnold R. 1996. Measurement of 223Ra and 224Ra in coastal waters using a delayed coincidence counter. Journal of Geophysical Research: Oceans, 101(C1): 1321–1329. doi: 10.1029/95JC03139
|
|
Peterson R N, Burnett W C, Taniguchi M, et al. 2008. Radon and radium isotope assessment of submarine groundwater discharge in the Yellow River delta, China. Journal of Geophysical Research: Oceans, 113(C9): C09021
|
|
Rodellas V, Garcia-Orellana J, Trezzi G, et al. 2017. Using the radium quartet to quantify submarine groundwater discharge and porewater exchange. Geochimica et Cosmochimica Acta, 196: 58–73. doi: 10.1016/j.gca.2016.09.016
|
|
Santos I R, Dimova N, Peterson R N, et al. 2009. Extended time series measurements of submarine groundwater discharge tracers (222Rn and CH4) at a coastal site in Florida. Marine Chemistry, 113(1−2): 137–147. doi: 10.1016/j.marchem.2009.01.009
|
|
Santos I R, Niencheski F, Burnett W, et al. 2008. Tracing anthropogenically driven groundwater discharge into a coastal lagoon from southern Brazil. Journal of Hydrology, 353(3–4): 275–293. doi: 10.1016/j.jhydrol.2008.02.010
|
|
Stieglitz T. 2005. Submarine groundwater discharge into the near-shore zone of the Great Barrier Reef, Australia. Marine Pollution Bulletin, 51(1–4): 51–59. doi: 10.1016/j.marpolbul.2004.10.055
|
|
Swarzenski P W, Reich C, Kroeger K D, et al. 2007. Ra and Rn isotopes as natural tracers of submarine groundwater discharge in Tampa Bay, Florida. Marine Chemistry, 104(1–2): 69–84. doi: 10.1016/j.marchem.2006.08.001
|
|
Taniguchi M, Dulai H, Burnett K M, et al. 2019. Submarine groundwater discharge: updates on its measurement techniques, geophysical drivers, magnitudes, and effects. Frontiers in Environmental Science, 7: 141. doi: 10.3389/fenvs.2019.00141
|
|
Taniguchi M, Ishitobi T, Chen Jianyao, et al. 2008. Submarine groundwater discharge from the Yellow River Delta to the Bohai Sea, China. Journal of Geophysical Research: Oceans, 113(C6): C06025
|
|
Wang Xuejing, Li Hailong, Jiao Jiu Jimmy, et al. 2015. Submarine fresh groundwater discharge into Laizhou Bay comparable to the Yellow River flux. Scientific Reports, 5(1): 8814. doi: 10.1038/srep08814
|
|
Wang Qianqian, Li Hailong, Zhang Yan, et al. 2019. Evaluations of submarine groundwater discharge and associated heavy metal fluxes in Bohai Bay, China. Science of the Total Environment, 695: 133873. doi: 10.1016/j.scitotenv.2019.133873
|
|
Wang Qianqian, Wang Xuejing, Xiao Kai, et al. 2021. Submarine groundwater discharge and associated nutrient fluxes in the Greater Bay Area, China revealed by radium and stable isotopes. Geoscience Frontiers, 12(5): 101223. doi: 10.1016/j.gsf.2021.101223
|
|
Webster I T, Hancock G J, Murray A S. 1995. Modelling the effect of salinity on radium desorption from sediments. Geochimica et Cosmochimica Acta, 59(12): 2469–2476. doi: 10.1016/0016-7037(95)00141-7
|
|
Xia Dong, Yu Zhigang, Xu Bochao, et al. 2016. Variations of hydrodynamics and submarine groundwater discharge in the Yellow River Estuary under the influence of the water-sediment regulation scheme. Estuaries and Coasts, 39(2): 333–343. doi: 10.1007/s12237-015-9994-7
|
|
Xu Bochao, Burnett W, Dimova N, et al. 2013. Hydrodynamics in the Yellow River Estuary via radium isotopes: ecological perspectives. Continental Shelf Research, 66: 19–28. doi: 10.1016/j.csr.2013.06.018
|
|
Xu Bochao, Xia Dong, Burnett W C, et al. 2014. Natural 222Rn and 220Rn indicate the impact of the Water-Sediment Regulation Scheme (WSRS) on submarine groundwater discharge in the Yellow River Estuary, China. Applied Geochemistry, 51: 79–85. doi: 10.1016/j.apgeochem.2014.09.018
|
|
Xu Bochao, Yang Disong, Burnett W C, et al. 2016. Artificial water sediment regulation scheme influences morphology, hydrodynamics and nutrient behavior in the Yellow River Estuary. Journal of Hydrology, 539: 102–112. doi: 10.1016/j.jhydrol.2016.05.024
|
|
Yang Disong, Xu Bochao, Burnett W, et al. 2019. Radium isotopes–suspended sediment relationships in a muddy river. Chemosphere, 214: 250–258. doi: 10.1016/j.chemosphere.2018.09.058
|
|
Yu Liansheng. 2002. The Huanghe (Yellow) River: a review of its development, characteristics, and future management issues. Continental Shelf Research, 22(3): 389–403. doi: 10.1016/S0278-4343(01)00088-7
|
 Xu Haowen Supplemental File.docx
|

|

Figures(3) / Tables(2)

Supported by:
Beijing Renhe Information Technology Co. Ltd

Haowei Xu, Disong Yang, Xiaoyi Guo, Maosheng Gao, Guangquan Chen, Diansheng Ji, Shengtao Chen, Huaming Yu, Bochao Xu. Using radium isotopes to quantify submarine groundwater discharge at different scales in the Huanghe River Estuary, China[J]. Acta Oceanologica Sinica, 2023, 42(8): 32-39. doi: 10.1007/s13131-023-2236-0

| Parameter | June 2014 | July 2014 | July 2016 | May 2019 | |||||||
| 224Ra | 223Ra | 224Ra | 223Ra | 224Ra | 223Ra | 224Ra | 223Ra | ||||
| S/m2 | 4.00×10⁸ | 4.00×10⁸ | 4.00×10⁸ | 4.00×10⁸ | 4.00×10⁸ | 4.00×10⁸ | 4.00×10⁸ | 4.00×10⁸ | |||
| V/m3 | 5.83×10⁹ | 5.83×10⁹ | 5.83×10⁹ | 5.83×10⁹ | 5.83×10⁹ | 5.83×10⁹ | 5.83×10⁹ | 5.83×10⁹ | |||
| $\text{λ} $/d−1 | 0.19 | 0.06 | 0.19 | 0.06 | 0.19 | 0.06 | 0.19 | 0.06 | |||
| k/(dpm·m−2·d−1) | 54.4 | 0.68 | 54.4 | 0.68 | 54.4 | 0.68 | 54.4 | 0.68 | |||
| Ad/(dpm·g−1) | 0.18 | 0.004 | 0.18 | 0.004 | 0.18 | 0.004 | 0.18 | 0.004 | |||
| $\tau $/d | 7.57 | 7.57 | 5.65 | 5.65 | 7.63 | 7.63 | 3.13 | 3.13 | |||
| I/dpm | 9.85×10¹¹ | 6.79×10¹¹ | 3.75×10¹² | 1.22×10¹¹ | 2.26×10¹² | 1.01×10¹¹ | 2.34×10¹² | 1.16×10¹¹ | |||
| Ao/(dpm·m−3) | 27.6 | 3.88 | 121 | 6.03 | 174 | 5.93 | 26.3 | 10.2 | |||
| Qr/(m3·s−1) | 378 | 378 | 3 007 | 3 007 | 594 | 594 | 1 003 | 1 003 | |||
| Ar/(dpm·m−3) | 426 | 9.03 | 986 | 26.5 | 651 | 12.0 | 679 | 18.8 | |||
| Cspm/(g·m−3) | 580 | 580 | 2 335 | 2 335 | 354 | 354 | 1 215 | 1 215 | |||
| FRa/(dpm·d−1) | 1.30×10¹¹ | 8.96×10⁹ | 6.64×10¹¹ | 2.15×10¹⁰ | 2.96×10¹¹ | 1.32×10¹⁰ | 7.25×10¹¹ | 3.58×10¹⁰ | |||
| Focean/(dpm·d−1) | 2.13×10¹⁰ | 2.99×10⁹ | 1.24×10¹¹ | 6.22×10⁹ | 1.33×10¹¹ | 4.53×10⁹ | 4.74×10¹⁰ | 1.85×10¹⁰ | |||
| Friver/(dpm·d−1) | 1.73×10¹⁰ | 3.67×10⁸ | 3.65×10¹¹ | 9.21×10⁹ | 3.67×10¹⁰ | 6.86×10⁸ | 7.78×10¹⁰ | 2.03×10⁹ | |||
| Fdec/(dpm·d−1) | 1.84×10¹¹ | 4.13×10⁹ | 7.10×10¹¹ | 7.39×10⁹ | 4.28×10¹¹ | 6.11×10⁹ | 4.30×10¹¹ | 6.82×10⁹ | |||
| Fdiff/(dpm·d−1) | 2.18×10¹⁰ | 2.74×10⁸ | 2.18×10¹⁰ | 2.74×10⁸ | 2.18×10¹⁰ | 2.74×10⁸ | 2.18×10¹⁰ | 2.74×10⁸ | |||
| Rashort-scale/(dpm·m−3) | 18 600 | 739 | 18 300 | 596 | 18 600 | 739 | 16 000 | 665 | |||
| Ralong-scale/(dpm·m−3) | 21 100 | 510 | 8 250 | 76.2 | 12 000 | 218 | 19 400 | 288 | |||
| Qshort-scale SGD/(m·d−1) | 0.03 | 0.03 | 0.03 | 0.03 | 0.03 | 0.03 | 0.04 | 0.04 | |||
| Qlong-scale SGD/(m·d−1) | 0.01 | 0.01 | 0.19 | 0.19 | 0.07 | 0.07 | 0.10 | 0.10 | |||
| Note: S is the seawater area; V is total seawater volume of Huanghe River Estuary (HRE); $\text{λ} $ is the decay constant of Ra, which is 0.19 d−1 and 0.06 d−1 for 224Ra and 223Ra, respectively; k is the diffusion coefficient of radium, which is cited from Wang et al. (2019); Ad is the desorption coefficient; $\tau $ is the water residence time; I is the Ra stock in the HRE; Ao is the activity concentration of radium in the Bohai Sea; Qr is Huanghe River runoff; Ar is activity concentration of dissolved radium in the Huanghe River; Cspm is concentration of suspended particulate matter in the Huanghe River; FRa is the total Ra flux to the HRE; Focean is the radium flux contributed by the open ocean; Friver is the radium input from Huanghe River; Fdec is the decay loss of Ra; Fdiff is the radium flux diffusing bottom sediments; Rashort-scale is the Ra activity in short-scale SGD endmember; Ralong-scale SGD is the Ra activity in long-scale SGD endmember; Qshort-scale SGD is the short-scale SGD flux; Qlong-scale SGD is the long-scale SGD flux. | |||||||||||
DownLoad:
CSV
| Term | 10% increase in term value | 10% decrease in term value | |||
| Change in short-scale SGD flux | Change in long-scale SGD flux | Change in short-scale SGD flux | Change in long-scale SGD flux | ||
| June 2014 | |||||
| $\tau $ | −9.30% | +20.55% | +11.36% | −25.11% | |
| Ar | +0.12% | −3.54% | −0.12% | +3.54% | |
| Ad | +0.03% | −0.87% | −0.03% | +0.87% | |
| Fdiff | +0.77% | −8.12% | −0.77% | +8.12% | |
| Ralong/short-scale | −9.09% | −9.09% | +11.11% | +11.11% | |
| July 2014 | |||||
| $\tau $ | −17.92% | −1.36% | +21.91% | +1.67% | |
| Ar | −8.66% | −0.96% | +8.66% | +0.96% | |
| Ad | −2.50% | −0.83% | +2.50% | +0.83% | |
| Fdiff | −0.14% | −0.29% | +0.14% | +0.29% | |
| Ralong/short-scale | −9.09% | −9.09% | +11.11% | +11.11% | |
| July 2016 | |||||
| $\tau $ | −12.56% | +2.66% | +15.35% | −3.25% | |
| Ar | −0.02% | −0.96% | +0.02% | +0.96% | |
| Ad | −0.02% | −0.08% | +0.02% | +0.08% | |
| Fdiff | +0.30% | −0.80% | −0.30% | +0.80% | |
| Ralong/short-scale | −9.09% | −9.09% | +11.11% | +11.11% | |
| May 2019 | |||||
| $\tau $ | −9.63% | −4.91% | +11.76% | +6.00% | |
| Ar | −1.11% | −0.40% | +1.11% | +0.40% | |
| Ad | −0.18% | −0.19% | +0.18% | +0.19% | |
| Fdiff | +0.07% | −0.31% | −0.07% | +0.31% | |
| Ralong/short-scale | −9.09% | −9.09% | +11.11% | +11.11% | |
| Note: $\tau $ is the water residence time; Ar is activity concentration of dissolved radium; Ad is the desorption coefficient; Fdiff is the radium flux diffusing bottom sediments. | |||||
DownLoad:
CSV
| Parameter | June 2014 | July 2014 | July 2016 | May 2019 | |||||||
| 224Ra | 223Ra | 224Ra | 223Ra | 224Ra | 223Ra | 224Ra | 223Ra | ||||
| S/m2 | 4.00×10⁸ | 4.00×10⁸ | 4.00×10⁸ | 4.00×10⁸ | 4.00×10⁸ | 4.00×10⁸ | 4.00×10⁸ | 4.00×10⁸ | |||
| V/m3 | 5.83×10⁹ | 5.83×10⁹ | 5.83×10⁹ | 5.83×10⁹ | 5.83×10⁹ | 5.83×10⁹ | 5.83×10⁹ | 5.83×10⁹ | |||
| $\text{λ} $/d−1 | 0.19 | 0.06 | 0.19 | 0.06 | 0.19 | 0.06 | 0.19 | 0.06 | |||
| k/(dpm·m−2·d−1) | 54.4 | 0.68 | 54.4 | 0.68 | 54.4 | 0.68 | 54.4 | 0.68 | |||
| Ad/(dpm·g−1) | 0.18 | 0.004 | 0.18 | 0.004 | 0.18 | 0.004 | 0.18 | 0.004 | |||
| $\tau $/d | 7.57 | 7.57 | 5.65 | 5.65 | 7.63 | 7.63 | 3.13 | 3.13 | |||
| I/dpm | 9.85×10¹¹ | 6.79×10¹¹ | 3.75×10¹² | 1.22×10¹¹ | 2.26×10¹² | 1.01×10¹¹ | 2.34×10¹² | 1.16×10¹¹ | |||
| Ao/(dpm·m−3) | 27.6 | 3.88 | 121 | 6.03 | 174 | 5.93 | 26.3 | 10.2 | |||
| Qr/(m3·s−1) | 378 | 378 | 3 007 | 3 007 | 594 | 594 | 1 003 | 1 003 | |||
| Ar/(dpm·m−3) | 426 | 9.03 | 986 | 26.5 | 651 | 12.0 | 679 | 18.8 | |||
| Cspm/(g·m−3) | 580 | 580 | 2 335 | 2 335 | 354 | 354 | 1 215 | 1 215 | |||
| FRa/(dpm·d−1) | 1.30×10¹¹ | 8.96×10⁹ | 6.64×10¹¹ | 2.15×10¹⁰ | 2.96×10¹¹ | 1.32×10¹⁰ | 7.25×10¹¹ | 3.58×10¹⁰ | |||
| Focean/(dpm·d−1) | 2.13×10¹⁰ | 2.99×10⁹ | 1.24×10¹¹ | 6.22×10⁹ | 1.33×10¹¹ | 4.53×10⁹ | 4.74×10¹⁰ | 1.85×10¹⁰ | |||
| Friver/(dpm·d−1) | 1.73×10¹⁰ | 3.67×10⁸ | 3.65×10¹¹ | 9.21×10⁹ | 3.67×10¹⁰ | 6.86×10⁸ | 7.78×10¹⁰ | 2.03×10⁹ | |||
| Fdec/(dpm·d−1) | 1.84×10¹¹ | 4.13×10⁹ | 7.10×10¹¹ | 7.39×10⁹ | 4.28×10¹¹ | 6.11×10⁹ | 4.30×10¹¹ | 6.82×10⁹ | |||
| Fdiff/(dpm·d−1) | 2.18×10¹⁰ | 2.74×10⁸ | 2.18×10¹⁰ | 2.74×10⁸ | 2.18×10¹⁰ | 2.74×10⁸ | 2.18×10¹⁰ | 2.74×10⁸ | |||
| Rashort-scale/(dpm·m−3) | 18 600 | 739 | 18 300 | 596 | 18 600 | 739 | 16 000 | 665 | |||
| Ralong-scale/(dpm·m−3) | 21 100 | 510 | 8 250 | 76.2 | 12 000 | 218 | 19 400 | 288 | |||
| Qshort-scale SGD/(m·d−1) | 0.03 | 0.03 | 0.03 | 0.03 | 0.03 | 0.03 | 0.04 | 0.04 | |||
| Qlong-scale SGD/(m·d−1) | 0.01 | 0.01 | 0.19 | 0.19 | 0.07 | 0.07 | 0.10 | 0.10 | |||
| Note: S is the seawater area; V is total seawater volume of Huanghe River Estuary (HRE); $\text{λ} $ is the decay constant of Ra, which is 0.19 d−1 and 0.06 d−1 for 224Ra and 223Ra, respectively; k is the diffusion coefficient of radium, which is cited from Wang et al. (2019); Ad is the desorption coefficient; $\tau $ is the water residence time; I is the Ra stock in the HRE; Ao is the activity concentration of radium in the Bohai Sea; Qr is Huanghe River runoff; Ar is activity concentration of dissolved radium in the Huanghe River; Cspm is concentration of suspended particulate matter in the Huanghe River; FRa is the total Ra flux to the HRE; Focean is the radium flux contributed by the open ocean; Friver is the radium input from Huanghe River; Fdec is the decay loss of Ra; Fdiff is the radium flux diffusing bottom sediments; Rashort-scale is the Ra activity in short-scale SGD endmember; Ralong-scale SGD is the Ra activity in long-scale SGD endmember; Qshort-scale SGD is the short-scale SGD flux; Qlong-scale SGD is the long-scale SGD flux. | |||||||||||
| Term | 10% increase in term value | 10% decrease in term value | |||
| Change in short-scale SGD flux | Change in long-scale SGD flux | Change in short-scale SGD flux | Change in long-scale SGD flux | ||
| June 2014 | |||||
| $\tau $ | −9.30% | +20.55% | +11.36% | −25.11% | |
| Ar | +0.12% | −3.54% | −0.12% | +3.54% | |
| Ad | +0.03% | −0.87% | −0.03% | +0.87% | |
| Fdiff | +0.77% | −8.12% | −0.77% | +8.12% | |
| Ralong/short-scale | −9.09% | −9.09% | +11.11% | +11.11% | |
| July 2014 | |||||
| $\tau $ | −17.92% | −1.36% | +21.91% | +1.67% | |
| Ar | −8.66% | −0.96% | +8.66% | +0.96% | |
| Ad | −2.50% | −0.83% | +2.50% | +0.83% | |
| Fdiff | −0.14% | −0.29% | +0.14% | +0.29% | |
| Ralong/short-scale | −9.09% | −9.09% | +11.11% | +11.11% | |
| July 2016 | |||||
| $\tau $ | −12.56% | +2.66% | +15.35% | −3.25% | |
| Ar | −0.02% | −0.96% | +0.02% | +0.96% | |
| Ad | −0.02% | −0.08% | +0.02% | +0.08% | |
| Fdiff | +0.30% | −0.80% | −0.30% | +0.80% | |
| Ralong/short-scale | −9.09% | −9.09% | +11.11% | +11.11% | |
| May 2019 | |||||
| $\tau $ | −9.63% | −4.91% | +11.76% | +6.00% | |
| Ar | −1.11% | −0.40% | +1.11% | +0.40% | |
| Ad | −0.18% | −0.19% | +0.18% | +0.19% | |
| Fdiff | +0.07% | −0.31% | −0.07% | +0.31% | |
| Ralong/short-scale | −9.09% | −9.09% | +11.11% | +11.11% | |
| Note: $\tau $ is the water residence time; Ar is activity concentration of dissolved radium; Ad is the desorption coefficient; Fdiff is the radium flux diffusing bottom sediments. | |||||
 DownLoad:


 DownLoad: