


Figure
1.
The 1900–2015 20CR (left; a, d, g, and j), 1979–2015 20CR (middle; b, e, h, and k) and 1979–2015 ERA5 (right; c, f, i, and l) surface air temperature trends in different seasons.
| Citation: | Cuijuan Sui, Lejiang Yu, Alexey Yu. Karpechko, Licheng Feng, Shan Liu. Influence of the Atlantic Multidecadal Oscillation and Interdecadal Pacific Oscillation on Antarctic surface air temperature during 1900 to 2015[J]. Acta Oceanologica Sinica, 2024, 43(3): 48-58. doi: 10.1007/s13131-023-2247-x

|
During the satellite era since 1979, a series of climatic changes have been observed in Antarctica. For example, surface air temperatures (SAT) rose over West Antarctica and the Antarctic Peninsula, the heat content of the ocean increased, and sea ice increased before 2015 and decreased after that (Li et al., 2021). Most interestingly, SAT changes in Antarctica exhibit strong seasonality and spatial complexity (Ding and Steig, 2013). With continued warming, temperature trends in Antarctica are more uneven (Jones et al., 2019). For example, the near-surface air temperature in West Antarctica has increased significantly (twice the global average) (Schneider et al., 2012; Bromwich et al., 2013; Li et al., 2014), but negligible warming or slight cooling has occurred in East Antarctica in recent decades (Steig et al., 2009; Nicolas and Bromwich, 2014; Turner et al., 2016; Jones et al., 2019; Wang et al., 2020; Li et al., 2021). However, the modeling studies by Klein et al. (2019) and Jones et al. (2019) show uniform warming over both West Antarctica and East Antarctica.
The southern annular mode (SAM) was confirmed by previous studies to have a significant impact on the changes in Antarctic SAT (Thompson and Solomon, 2002; Hosking et al., 2013; Marshall and Thompson, 2016). The El Niño-Southern Oscillation (ENSO) phenomenon is a large-scale atmosphere-ocean interaction occurring in the tropical Pacific and has crucial effects on the global climate through atmospheric teleconnections (Wallace et al., 1998; Liu et al., 2013; Li et al., 2023). Jones et al. (2019) suggested that the ENSO is related to the SAM, and their impacts on SAT can sometimes be difficult to separate. There is strong evidence that in fact the response to ENSO is modulated by the background state of the SAM. The ENSO teleconnection is only statistically significant when SAM is in a weak (i.e., neutral) phase, or when SAM is in phase with the driving ENSO event. When SAM is in the negative phase, the Teleconnection with El Nino is significant, while when SAM is in the positive phase, the Teleconnection with La Nina is significant (Fogt and Bromwich, 2006; Stammerjohn et al., 2008; Fogt et al., 2011; Hobbs et al., 2016). However, Li et al. (2014) suggested that these regional-scale changes are mainly affected by changes in atmospheric circulation; in particular, the Amundsen Sea Low (ASL), which is associated with internal tropical ocean variability and subsequent tropical–polar teleconnections, has been found to be important (Steig et al., 2009; Turner et al., 2013; Raphael et al., 2016).
Li et al. (2021) believed that a potential driver of multidecadal changes in Antarctica is sea surface temperature (SST) variability associated with the Atlantic Multidecadal Oscillation (AMO) and the Interdecadal Pacific Oscillation (IPO). During the period of +AMO, the Rossby wavetrain linked warming SSTs in the Atlantic Ocean to surface pressure around the Amundsen Sea in all seasons except austral summer (Simpkins et al., 2014; Li et al., 2014, 2015). In addition, the IPO shifted from a positive phase to a negative phase, with a decrease in tropical Pacific SSTs and a deepening of the ASL, which contributed to the circulation changes in the Ross Sea region (Meehl et al., 2016). Simpkins et al. (2016) emphasized that the role of the Atlantic and Pacific Oceans cannot be considered separately when diagnosing climatic changes related to the tropics in the southern Hemisphere extratropics. It has been found that the joint impact of +AMO and –IPO can deepen the ASL (Li et al., 2021). The ASL can strongly influence the climate of the Antarctic Peninsula and West Antarctica (Kreutz et al., 2000). The ASL has also deepened in recent years, contributing a positive SAT trend in the Peninsula and West Antarctica because more northerly wind anomalies lead to warm advection (Raphael et al., 2016).
To date, research has mostly investigated the individual impact of the AMO or IPO on the atmospheric circulation and Antarctic SAT (Ding et al., 2011; Ding and Steig, 2013; Simpkins et al., 2014; Li et al., 2014, 2015; Meehl et al., 2016) or the combined impact of the opposing AMO and IPO phases (Yu et al., 2017, 2022; Li et al., 2021), rarely considering the impact of the coinciding phases (–AMO–IPO or +AMO+IPO). We would like to know the impact of AMO and IPO on Antarctic surface temperature under the same and opposite phases. However, since satellite observation data has been available, both IPOs and AMOs have been in opposite phases, so the length of the data time series is crucial for our research. If the data are extended to the late 1990s, will the AMO and IPO also play a significant role in the Antarctic SAT? An answer to this question is still lacking. In this study, we used long-term reanalysis data to investigate the effects of the four combinations of +AMO+IPO, –AMO–IPO, +AMO–IPO, and –AMO+IPO on Antarctic SAT over the past more than 100 years.
This analysis specifically focuses on the monthly data obtained from the National Oceanic and Atmospheric Administration (NOAA)-the Cooperative Institute for Research in Environmental Sciences (CIRES)-the U.S. Department of Energy (DOE) Twentieth Century Reanalysis (20CR) project Version 3 (Slivinski et al., 2019). The 20CRv3 data covers the time period from January 1836 to December 2015, with a horizontal resolution of 1°. The evaluation of 20CRv3 shows that the variability of many fields is reliable throughout the twentieth and twenty-first centuries but does not include the nineteenth century (Slivinski et al., 2021). The main objective of this study is to assess the spatial distribution of Antarctic SAT in relation to the four combinations of +AMO+IPO, –AMO–IPO, +AMO–IPO, and –AMO+IPO, rather than focusing on trend changes. Therefore, we used detrended data on sea-level pressure (SLP), 10-m wind speed, 2-m air temperature, albedo, net shortwave radiation flux, total cloud cover, downward longwave radiation flux and atmospheric variables, including 200-hPa geopotential height, temperature and winds, during 1900 to 2015. As the European Center for Medium-Range Weather Forecasts (ECMWF) Twentieth Century Reanalysis (ERA-20C) data only extend to 2010, we only used them in this study to compare SAT to 20CR. The SAT of the fifth generation European Center for Medium-Range Weather Forecasts reanalysis (ERA5), with a spatial resolution of approximately 0.25° latitude-longitude (Hersbach et al., 2020), was used to evaluate the quality of 20CR by analyzing the overlapping period (1979–2015).
In addition, we also utilized the monthly NOAA Extended Reconstructed Sea Surface Temperature data version 5 ERSSTv5, (Huang et al., 2017). The AMO index with a ten-year running mean (Enfield et al., 2001) and the IPO index with a 13-year Chebyshev low-pass filter (Henley et al., 2015) values were obtained from NOAA archives at
Austral summer, autumn, winter and spring refer to January, February, and March (JFM); April, May, and June (AMJ); July, August, and September (JAS); and October, November, and December (OND), respectively. The anomalies of variables were calculated with respect to the climatology over the period 1900–2015. The significance is calculated using the two-tailed Student’s t-test.
Following Sardeshmukh and Hoskins (1988), the Rossby wave source (RWS) in the upper troposphere plays an important role in tropical-extratropical teleconnections, which can be given by
| $$ \mathrm{R}\mathrm{W}\mathrm{S}=-{V}_{\chi }\cdot \nabla \zeta -\zeta D\approx -{V'}_{\chi }\cdot \nabla \bar{\zeta }-\bar{\zeta }{D'} , $$ | (1) |
where ζ is the 2D absolute vorticity;
We start by evaluating the SAT data. Figure 1 illustrates the trend of the Antarctic surface air temperature of the 20CR data during 1900–2015 and 1979–2015 in the satellite observation era and the comparison with ERA5 data from the same period (1979–2015). The SAT trend of the 20CR data is broadly consistent with that of the ERA5 data during the satellite observation era. Specifically, the SAT of West Antarctica increases in austral summer (JFM) while the temperature of the Antarctic Peninsula increases and the temperature of the Southwest Pole and the Ross Sea decreases in austral autumn (AMJ). There is warming in the southwest polar region in austral winter (JAS) and warming south of 70°S in austral spring (OND).
During 1900 to 2015, there is a significant difference in the trend of Antarctic temperature compared to the period after 1979. The Southern Ocean exhibits the most pronounced warming signal, and overall, Antarctica shows nearly ubiquitous warming, which is consistent with temperature trends over a centennial period being driven by anthropogenic warming compared to the asymmetric pattern over a shorter period when the influence of internal variability is strong. In other words, the distribution of the temperature trend strongly depends on the period of study. However, the comparison with ERA5 shows that the 20CR data can effectively captures SAT variability, instilling greater confidence in its quality prior to 1979. At the same time, we also found that autumn (AMJ) has the largest variability in SAT (as shown in Fig. 2). Therefore, this study focuses on the analysis of the effect of the AMO and IPO indices on autumn SAT in Antarctica.

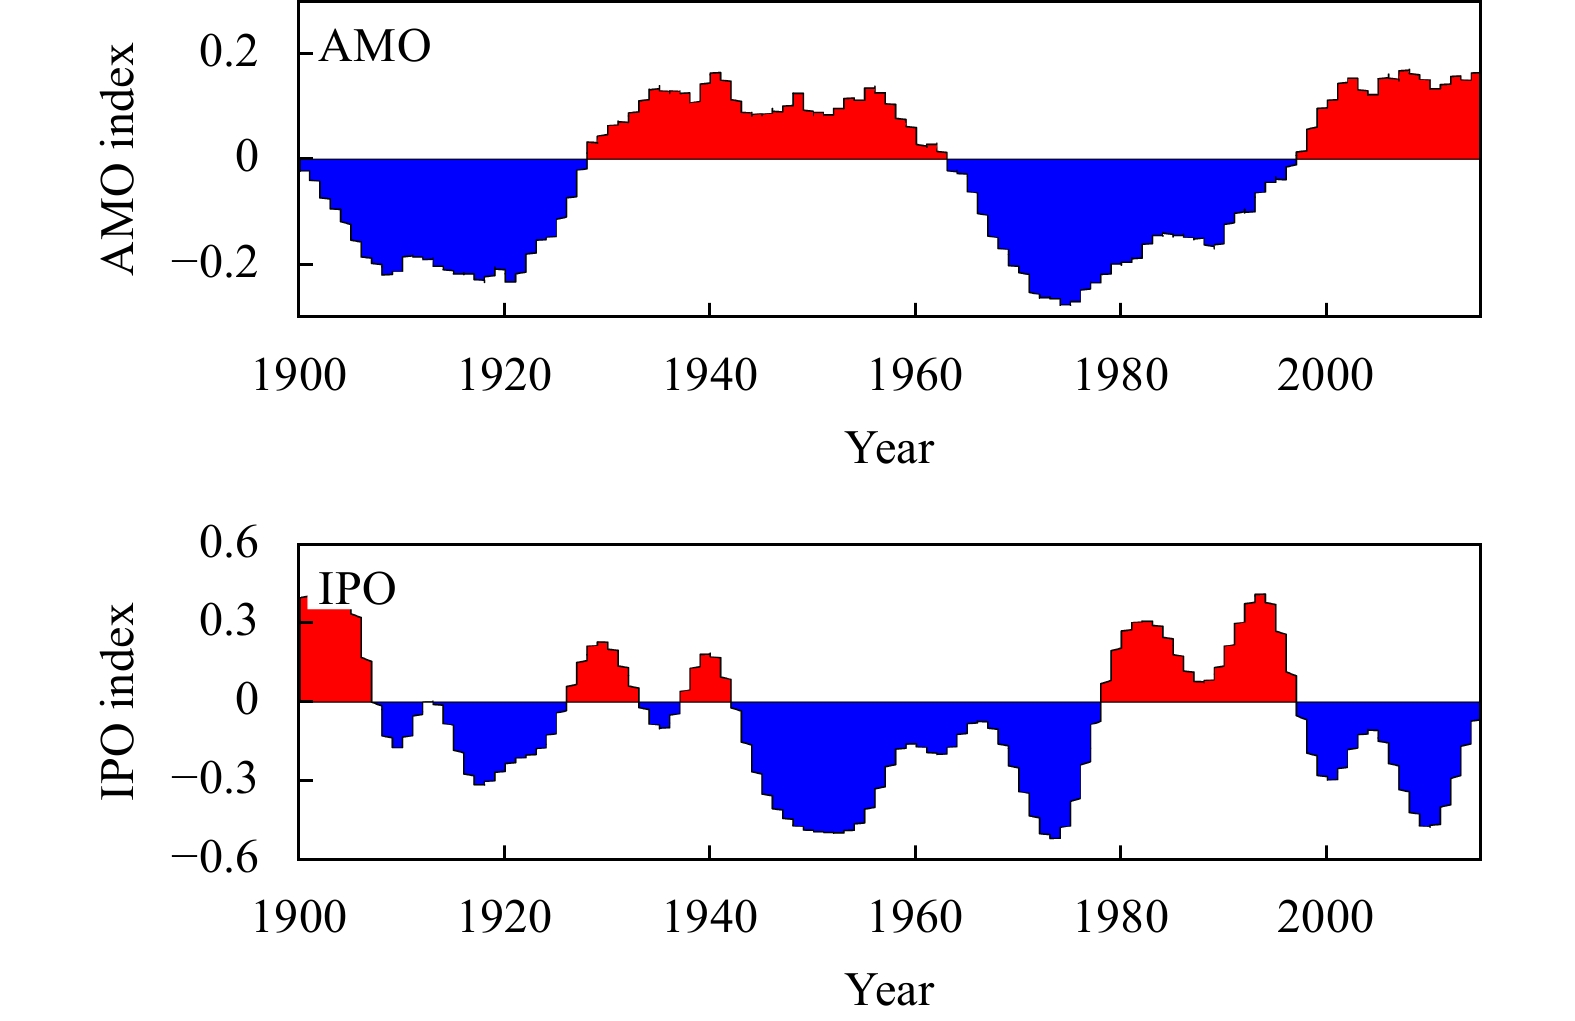
The multidecadal variability in SST associated with the AMO and IPO indices is believed to be a potential driver of multidecadal changes in Antarctica (Simpkins et al., 2016; Li et al., 2021). Figure 3 shows four periods of the AMO during 1900 to 2015, including a negative phase from 1900 to 1928 and from 1964 to 1997 and a positive phase from 1929 to 1963 and from 1998 to 2015. The IPO period is on 20- to 30-year timescales. The positive phase of the AMO can enhance the observed negative phase of the IPO since the 1990s (Li et al., 2021).

According to phases of the seasonal AMO and IPO indices, we divided the whole period of 1900–2015 into four combinations for each season (+AMO and +IPO, –AMO and –IPO, +AMO and –IPO; –AMO and +IPO) (Table 1). The difference in the years is small among seasons. There were only ten years (9%) in the +AMO+IPO combination, while the +AMO–IPO combination was the longest (43 years or 39%). The –AMO+IPO and –AMO–IPO combinations each lasted approximately 30 years, or 26% and 28%, respectively. Next, through composite analysis, we reveal the influence mechanism of the SST anomalies associated with the four combinations of the AMO and IPO indices on the Antarctic SAT.
| Month | Years in different phases | |||
| +AMO+IPO | –AMO–IPO | +AMO–IPO | –AMO+IPO | |
| JFM |
1929–1933 1938–1942 |
1908–1912 1914–1926 1964–1978 |
1934–1937 1943–1963 1998–2015 |
1900–1907/1913 1927–1928 1979–1997 |
| AMJ |
1928–1933 1938–1942 |
1908–1912 1914–1925 1963–1978 |
1934–1937 1943–1962 1998–2015 |
1900–1907/1913 1926–1927 1979–1997 |
| JAS |
1928–1933 1937–1942/1997 |
1908–1912 1914–1925 1963–1977 |
1934–1036 1943–1962 1998–2015 |
1900–1907/1913 1926–1927 1978–1996 |
| OND |
1928–1932 1937–1941 |
1908–1925 1963–1977 |
1933–1936 1942–1962 1997–2015 |
1900–1907 1926–1927 1978–1996 |
 DownLoad:
CSV
DownLoad:
CSV
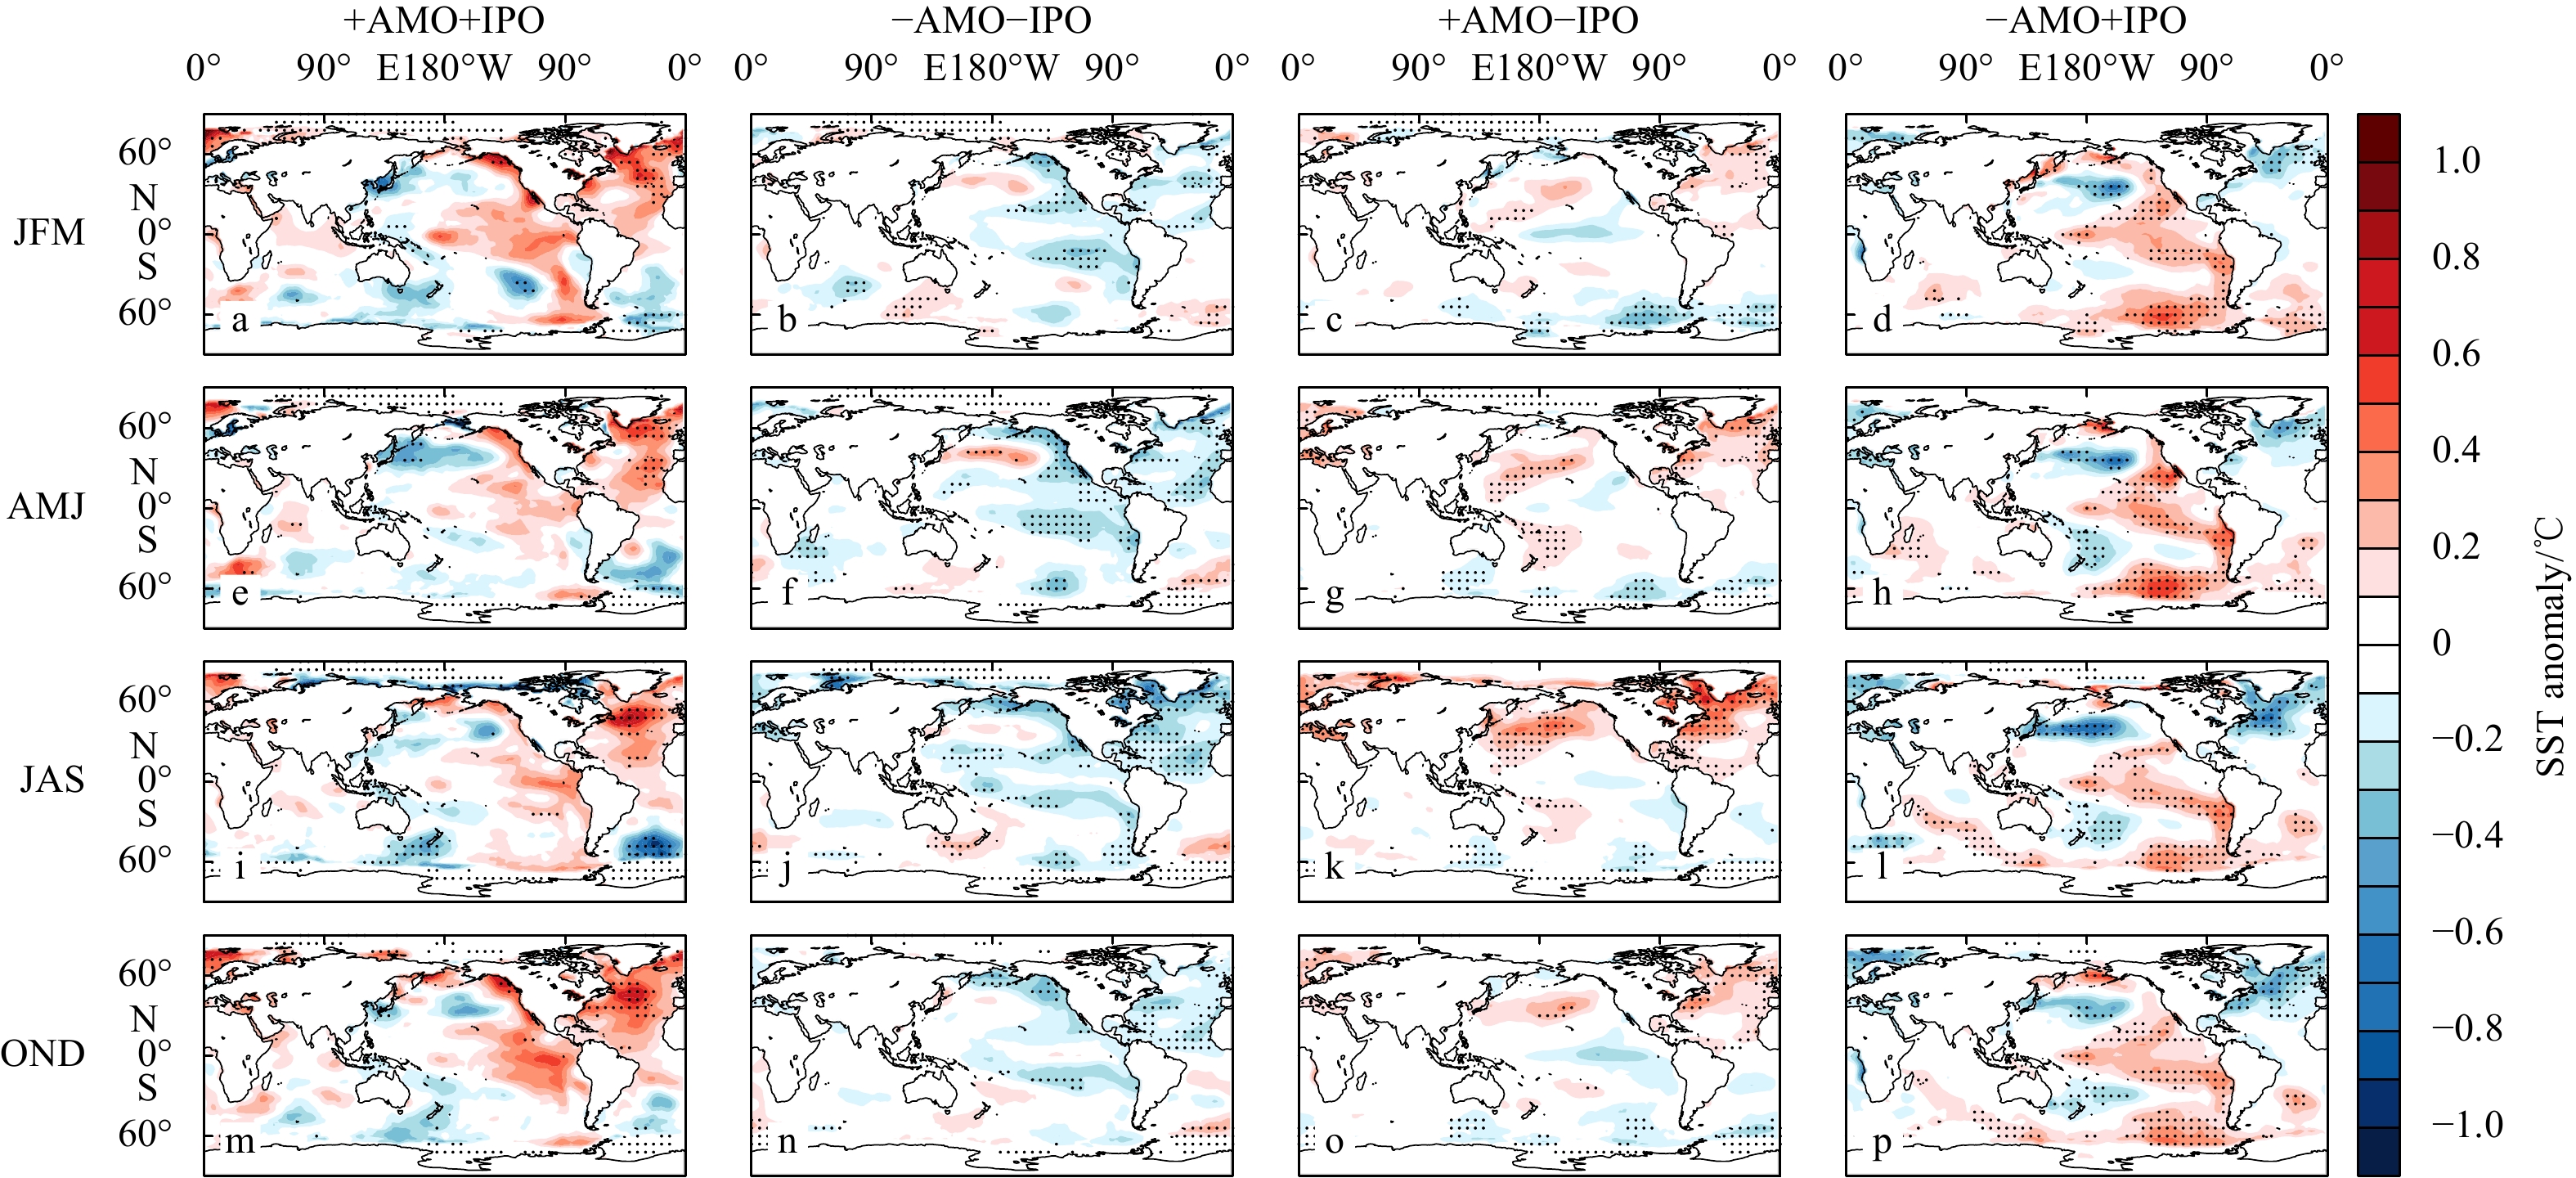
We made a composite of SST anomalies for each season (Fig. 4). The +AMO phase is characterized by an amplitude of the spatial mean temperature up to 0.5℃ over the North Atlantic Ocean (Figs 4a, e, i, m and Figs 4c, g, k, o). Moreover, positive SST anomalies over the tropical eastern Pacific and negative SST anomalies over the extratropical-mid-latitude western Pacific appeared in the +IPO phase (Figs 4a, e, i, m and Figs 4d, h, l, p). The spatial patterns of the four combinations are similar for the four seasons despite small differences in magnitudes and locations. There is strong asymmetry in the spatial patterns of SST anomalies for the combination of +AMO and –IPO and –AMO and +IPO, especially over the tropical central and eastern Pacific.

Composited SAT anomalies are shown in Fig. 5. For the combination of +AMO and +IPO, there is a positive anomaly south of 50°S in austral summer (JFM, Fig. 5a) and austral spring (OND, Fig. 5m), a positive anomaly near the Ross Sea in JFM but a negative anomaly in the same region in OND. The temperature increases near the Amundsen Sea in AMJ (Fig. 5e) and decreases significantly in the other southern oceans in JAS (Fig. 5i). The distribution of SAT anomalies for the combination of +AMO–IPO (Figs 5c, g, k, o) is almost opposite to that during +AMO+IPO and opposite to that during –AMO+IPO (Figs 5d, h, l, p), except for the domain of the Southern Indian Ocean. During –AMO+IPO, nearly the whole Antarctic is warming except over the Antarctic Peninsula and near the Weddell Sea. The smallest magnitude compared with the other three phases is found for the –AMO and –IPO combination (Figs 5b, f, j, n).

To further confirm the above results, we made a composite of SAT using 2-m air temperature dataset from the ERA-20C dataset (Fig. 6). The spatial patterns of SAT exhibit similarities to those obtained using the t2m dataset from 20CR; for example, the distribution of SAT anomalies for the combination of +AMO–IPO (Figs 6c, g, k, o) is almost opposite that for the combination of +AMO+IPO (Figs 6a, e, i, m), and the Antarctic region as a whole experiences warming during the period of –AMO+IPO (Figs 6d, h, l, p). The spatial correlation coefficients between the SAT anomalies in ERA-20C and 20CR have the largest value of 0.93 in AMJ for the combination of +AMO and +IPO (Table 2), with the correlation coefficients for most other seasons and combinations being higher than 0.6. However, the correlation coefficient is not significant in AMJ (Fig. 6f, 0.01) and JAS (Fig. 6j, 0.26) for the combination of –AMO–IPO. In general, the two sets of data are consistent with each other. Next, we explored the mechanisms responsible for the spatial patterns of Antarctic SAT in austral autumn (AMJ) during the different combinations of the AMO and IPO.

| Month | Correlation coefficient | |||
| +AMO+IPO | –AMO–IPO | +AMO–IPO | –AMO+IPO | |
| JFM | 0.62* | 0.77* | 0.86* | 0.72* |
| AMJ | 0.93* | 0.01 | 0.63* | 0.74* |
| JAS | 0.79* | 0.26* | 0.69* | 0.72* |
| OND | 0.62* | 0.41* | 0.64* | 0.73* |
| Note: Asterisk (*) denotes above 99% confidence level. | ||||
DownLoad:
CSV
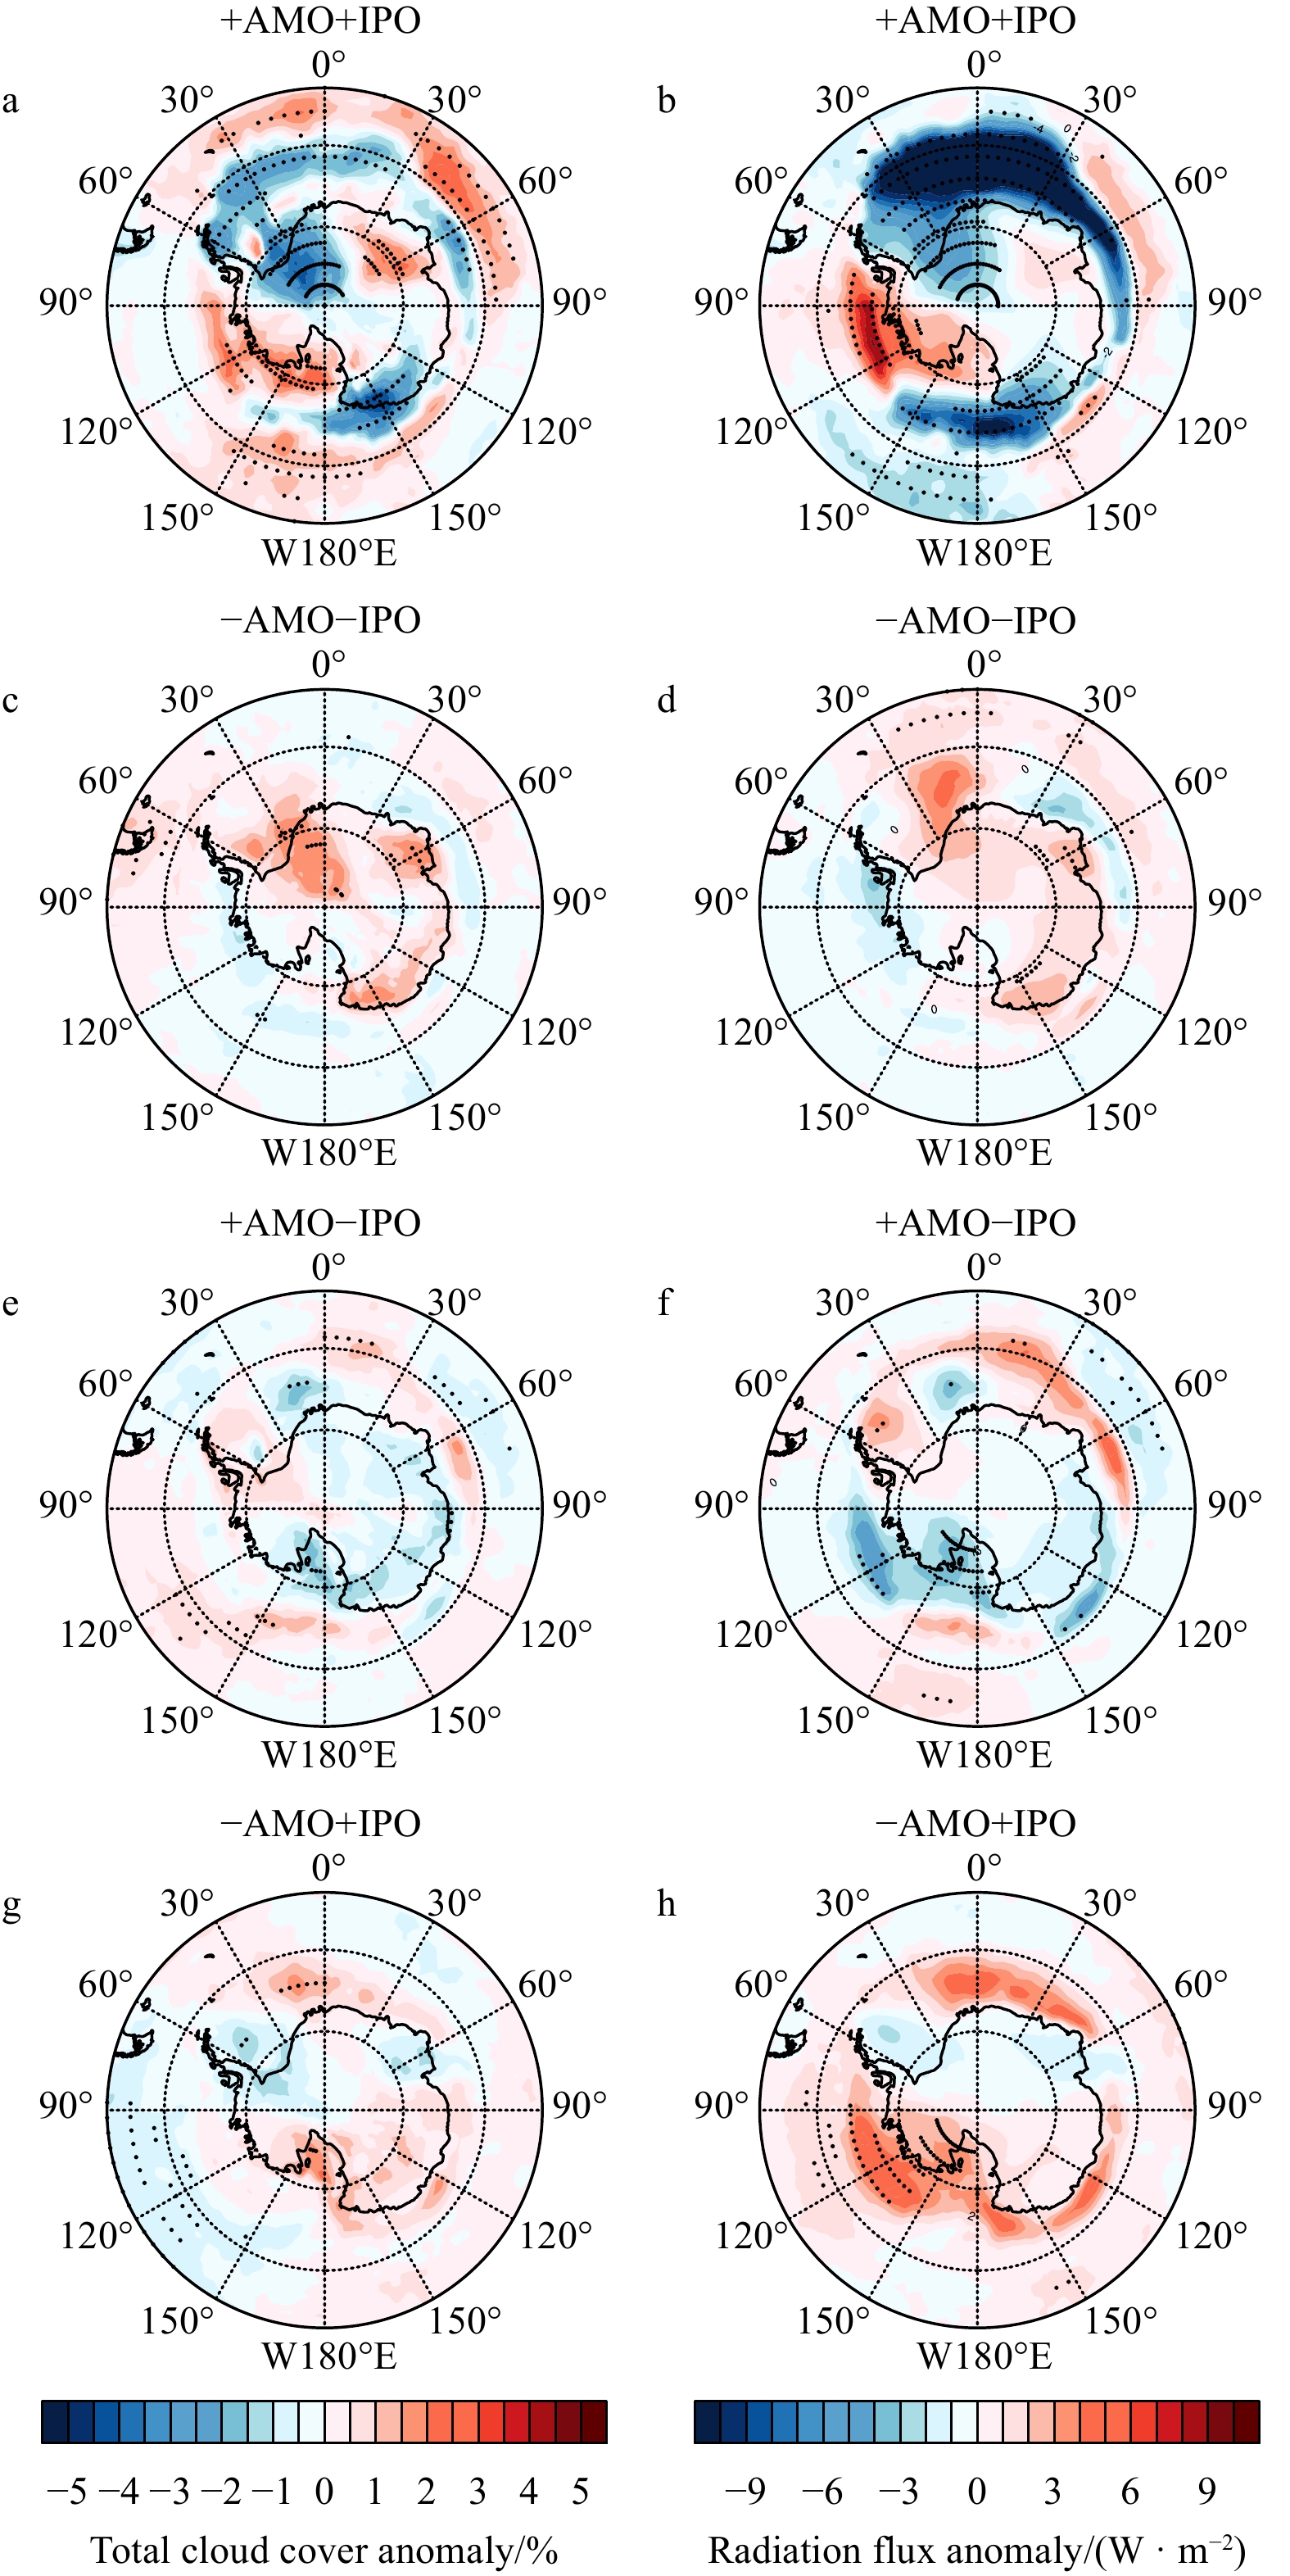
To explain the anomalous Antarctic SAT for different combinations, we made a composite of anomalous 10-m wind and sea level pressure (Fig. 7). For austral autumn, anomalous surface wind influences SAT through heat advection. For years of +AMO+IPO, anomalous surface anticyclonic circulation over the Bellingshausen Sea and cyclonic circulation produce southerly wind anomalies over the Weddell and Ross Seas and northerly wind anomalies over the Bellingshausen and Amundsen Seas, which result in negative and positive SAT anomalies, respectively (Figs 7a and 5e). Downward longwave radiation anomalies related to anomalous cloud cover also strengthen the SAT in the above regions (Figs 8a and b). Although the spatial pattern of albedo anomalies shows opposite variability to that of SAT, the net shortwave radiation related to it excites a smaller effect on positive air temperature anomalies over the Bellingshausen Sea and negative air temperature anomalies over the South Atlantic Ocean (Figs 9a and b). For the other three combinations, surface wind field anomalies can explain SAT anomalies through heat advection, especially over the Amundsen Sea for years of +AMO–IPO and –AMO+IPO (Figs 5g, h and Figs 7c, d). This also suggests that the circulation of +AMO–IPO can deepen the Amundsen low pressure and cause warming of the Antarctic Peninsula, which is consistent with previous studies (Li et al., 2021). Downward longwave radiation anomalies also have a larger effect than the net shortwave radiation, but their spatial patterns are not consistent with the cloud cover anomalies (Figs 8 and 9).


Previous studies have suggested that anomalous SSTs in the tropics can influence atmospheric circulation through the generation of planetary wavetrains (Li et al., 2015, 2021; Ding and Steig, 2013; Simpkins et al., 2014). To link the tropical SST anomalies and high-latitude atmosphere circulation anomalies, we composited the anomalous surface precipitation rate and upward longwave radiation flux at the nominal top of the atmosphere (Fig. 10) and the divergent wind, RWS, height anomaly, and wave activity flux (WAF) at the 200-hPa level (Fig. 11). For years of +AMO+IPO, negative SST anomalies over the southeastern Indian and southeastern Pacific Oceans produce increased precipitation and negative upward longwave radiation over the region southeast of Australia and southwestern Australia (Figs 10a and b), which induces anomalous divergent winds and positive RWSs. The positive RWSs excite a wavetrain propagating southeastwards into the Ross and Amundsen Seas and then into the Bellingshausen and Weddell Seas (Figs 11a and b). The wavetrain generates negative upper-level height anomalies over the Ross and Weddell Seas and positive values over the Bellingshausen Sea, which induces surface mean sea level pressure (MSLP) and air temperature anomalies.


For years of +AMO–IPO, increased precipitation and convective activities occur over the western tropical Pacific Ocean and the region east of Australia (Fig. 10e). Increased convective activities produce positive RWSs and upper-level divergent winds over the region east of Australia (Fig. 11e), which triggers a wavetrain propagating southeastward (Fig. 11f). The wavetrain leads to positive height anomalies over the southern Pacific Ocean and the Weddell Sea and negative height anomalies over the Amundsen and Bellingshausen Seas, which influences the MSLP and SAT. The opposite case occurs for years of –AMO+IPO.
For years of –AMO–IPO, positive SST anomalies over the central South Pacific Ocean increase the precipitation and convective activities there (Figs 10c and d), which generates positive RWSs and divergent winds (Fig. 11c). The positive RWSs also trigger a wavetrain propagating northeastwards and reflecting into the Weddell Seas and the Bellingshausen and the South Indian Ocean (Fig. 11d), which results in anomalous upper-level height, MSLP and SAT.
Interdecadal variability Atlantic and Pacific SST have a strong impact on Antarctic temperature by teleconnections. These impacts are of great important implications for understanding and predicting future changes in Antarctica. Similar tropical-polar teleconnections are also evident on Arctic climate, and the linkages between tropical anomalies and the Arctic have been widely reported (e.g., Garfinkel and Hartmann, 2007; Xie et al., 2012; Kren et al., 2016; Rao and Ren, 2018; Song and Son, 2018). Li et al. (2021) suggested that the relative importance of tropical-polar teleconnections, anthropogenic forcing and internal variability are still not fully understood.
In this study, we utilized two long-term reanalysis datasets to investigate the impact of the IPO and AMO indices on Antarctic SAT over the past 115 years. We categorized the IPO and AMO indices into four combinations of +AMO+IPO, –AMO–IPO, +AMO–IPO, and –AMO+IPO and examined their effects on the Antarctic SAT.
A positive AMO probably intensified negative IPO observed since the 1990s (Li et al., 2021). During the period of +AMO+IPO, the distribution of Antarctic SAT exhibits an opposite pattern compared to the period of +AMO–IPO. During the period of –AMO+IPO, except for the Antarctic Peninsula and near the Weddell Sea, overall Antarctic region experiences warming. The strongest signal of the SAT anomalies is observed during the austral autumn season (AMJ), while the smallest magnitude compared with the other three phases is for the –AMO and –IPO.
More specifically, in austral autumn (AMJ) and for the combination of +AMO+IPO, the negative SST anomalies over the southeastern Indian and southeastern Pacific Oceans produce anomalous divergent winds and positive RWSs, which excite a wavetrain propagating southeastward. Anomalous surface anticyclonic circulation over the Bellingshausen Sea and cyclonic circulation produce southerly wind anomalies over the Weddell and Ross Seas and northerly wind anomalies over the Bellingshausen and Amundsen Seas. As a result, SAT increases in West Antarctica. For years of –AMO–IPO, positive SST anomalies over the central South Pacific Ocean also trigger a wavetrain propagating northeastwards toward the Weddell Seas and the Bellingshausen and the South Indian Ocean. For +AMO–IPO and –AMO+IPO years, similar wavetrains are excited over the South Pacific and Atlantic Oceans, but the upper-level height anomalies exhibit opposite patterns due to the opposite SST anomalies over the southwestern Pacific Ocean. These opposite upper-level height anomalies lead to opposite surface atmospheric circulation anomalies. SAT decreases in the South Pacific and Atlantic oceans, while SAT increases in other regions for the combination of +AMO and –IPO, and almost the opposite is true for the combination of –AMO and +IPO.
In summary, the wavetrain generated by SST anomalies triggers upper-level height and surface atmospheric circulation anomalies, resulting in changes in SAT. Downward longwave radiation anomalies related to anomalous cloud cover also play a role. Our conclusions support previous results that the joint impact of the positive AMO and the negative IPO leads to a deepening of the Amundsen Sea Low (Fig. 7c, Hosking et al., 2013; Li et al., 2021). Furthermore, we show results for the remaining three combinations of the indices. In the future, the phases of AMO and IPO if the phases of AMO and IPO were to reverse (with AMO transitioning to a negative phase and IPO transitioning to a positive phase), Antarctica could potentially experience more pronounced warming and accelerated melting compared to the current observations.
It should be noted that the long-term reanalysis data 20CR is the first reanalysis dataset that covers a span of over 100 years. Compared to satellite products, observations and other reanalysis data, 20CRv3 can credibly reproduce different scales of atmospheric estimates ranging from weather to long-term climate events (Slivinski et al., 2019, 2021); however, it is crucial to exercise caution when interpreting the results based on surface data reanalysis. It should be noted that there is a significant shortage of assimilable observations in long-term reanalysis prior to approximately 1955 (Schneider and Fogt, 2018). As a next step, we intend to validate our findings by comparing them with CMIP6 model simulations and plan to design model experiments to further investigate and confirm the mechanism through which the AMO and IPO influence the Antarctic SAT, as revealed in this study.
|
Bromwich D H, Nicolas J P, Monaghan A J, et al. 2013. Central West Antarctica among the most rapidly warming regions on Earth. Nature Geoscience, 6(2): 139–145, doi: 10.1038/ngeo1671
|
|
Ding Qinghua, Steig E J. 2013. Temperature change on the Antarctic Peninsula linked to the tropical Pacific. Journal of Climate, 26(19): 7570–7585, doi: 10.1175/JCLI-D-12-00729.1
|
|
Ding Qinghua, Steig E J, Battisti D S, et al. 2011. Winter warming in West Antarctica caused by central tropical Pacific warming. Nature Geoscience, 4(6): 398–403, doi: 10.1038/ngeo1129
|
|
Enfield D B, Mestas-Nuñez A M, Trimble P J. 2001. The Atlantic multidecadal oscillation and its relation to rainfall and river flows in the continental U.S. Geophysical Research Letters, 28(10): 2077–2080, doi: 10.1029/2000GL012745
|
|
Fogt R L, Bromwich D H. 2006. Decadal variability of the ENSO teleconnection to the high-latitude South Pacific governed by coupling with the southern annular mode. Journal of Climate, 19(6): 979–997, doi: 10.1175/Jcli3671.1
|
|
Fogt R L, Bromwich D H, Hines K M. 2011. Understanding the SAM influence on the South Pacific ENSO teleconnection. Climate Dynamics, 36(7/8): 1555–1576, doi: 10.1007/s00382-010-0905-0
|
|
Garfinkel C I, Hartmann D L. 2007. Effects of the El Niño-Southern Oscillation and the Quasi-Biennial Oscillation on polar temperatures in the stratosphere. Journal of Geophysical Research: Atmospheres, 112(D19): D19112, doi: 10.1029/2007JD00 8481, doi: 10.1029/2007JD008481
|
|
Henley B J, Gergis J, Karoly D J, et al. 2015. A tripole index for the Interdecadal Pacific Oscillation. Climate Dynamics, 45(11–12): 3077–3090, doi: 10.1007/s00382-015-2525-1
|
|
Hersbach H, Bell B, Berrisford P, et al. 2020. The ERA5 global reanalysis. Quarterly Journal of the Royal Meteorological Society, 146(730): 1999–2049, doi: 10.1002/qj.3803
|
|
Hobbs W R, Massom R, Stammerjohn S, et al. 2016. A review of recent changes in Southern Ocean sea ice, their drivers and forcings. Global and Planetary Change, 143: 228–250, doi: 10.1016/j.gloplacha.2016.06.008
|
|
Hosking J S, Orr A, Marshall G J, et al. 2013. The influence of the Amundsen-Bellingshausen seas low on the climate of West Antarctica and its representation in coupled climate model simulations. Journal of Climate, 26(17): 6633–6648, doi: 10.1175/JCLI-D-12-00813.1
|
|
Huang Boyin, Thorne P W, Banzon V F, et al. 2017. Extended Reconstructed Sea Surface Temperature, version 5 (ERSSTv5): upgrades, validations, and intercomparisons. Journal of Climate, 30(20): 8179–8205, doi: 10.1175/JCLI-D-16-0836.1
|
|
Jones M E, Bromwich D H, Nicolas J P, et al. 2019. Sixty years of widespread warming in the southern middle and high latitudes (1957–2016). Journal of Climate, 32(20): 6875–6898, doi: 10.1175/JCLI-D-18-0565.1
|
|
Klein F, Abram N J, Curran M A J, et al. 2019. Assessing the robustness of Antarctic temperature reconstructions over the past 2 millennia using pseudoproxy and data assimilation experiments. Climate of the Past, 15(2): 661–684, doi: 10.5194/cp-15-661-2019
|
|
Kren A C, Marsh D R, Smith A K, et al. 2016. Wintertime Northern Hemisphere response in the stratosphere to the Pacific decadal oscillation using the whole atmosphere community climate model. Journal of Climate, 29(3): 1031–1049, doi: 10.1175/JCLI-D-15-0176.1
|
|
Kreutz K J, Mayewski P A, Pittalwala I I, et al. 2000. Sea level pressure variability in the Amundsen Sea region inferred from a West Antarctic glaciochemical record. Journal of Geophysical Research: Atmospheres, 105(D3): 4047–4059, doi: 10.1029/1999JD901069
|
|
Li Xichen, Cai Wenju, Meehl G A, et al. 2021. Tropical teleconnection impacts on Antarctic climate changes. Nature Reviews Earth & Environment, 2(10): 680–698., doi: 10.1038/s43017-021-00204-5
|
|
Li Guangliang, Feng Licheng, Zhuang Wei, et al. 2024. Differences in spring precipitation over southern China associated with multiyear La Niña events. Acta Oceanologica Sinica, 43(2):1–10, doi: 10.1007/s13131-023-2147-0
|
|
Li Xichen, Gerber E P, Holland D M, et al. 2015. A Rossby wave bridge from the tropical Atlantic to West Antarctica. Journal of Climate, 28(6): 2256–2273, doi: 10.1175/JCLI-D-14-00450.1
|
|
Li Xichen, Holland D M, Gerber E P, et al. 2014. Impacts of the north and tropical Atlantic Ocean on the Antarctic Peninsula and sea ice. Nature, 505(7484): 538–542, doi: 10.1038/nature12945
|
|
Liu Na, Wang Hui, Ling Tiejun, et al. 2013. The influence of ENSO on sea surface temperature variations in the China seas. Acta Oceanologica Sinica, 32(9): 21–29, doi: 10.1007/s13131-013-0348-7
|
|
Marshall G J, Thompson D W J. 2016. The signatures of large-scale patterns of atmospheric variability in Antarctic surface temperatures. Journal of Geophysical Research: Atmospheres, 121(7): 3276–3289, doi: 10.1002/2015JD024665
|
|
Meehl G A, Arblaster J M, Bitz C M, et al. 2016. Antarctic sea-ice expansion between 2000 and 2014 driven by tropical Pacific decadal climate variability. Nature Geoscience, 9(8): 590–595, doi: 10.1038/ngeo2751
|
|
Nicolas J P, Bromwich D H. 2014. New reconstruction of Antarctic near-surface temperatures: multidecadal trends and reliability of global reanalyses. Journal of Climate, 27(21): 8070–8093, doi: 10.1175/JCLI-D-13-00733.1
|
|
Rao Jian, Ren Rongcai. 2018. Varying stratospheric responses to tropical Atlantic SST forcing from early to late winter. Climate Dynamics, 51(5/6): 2079–2096,doi: 10.1007/s00382-017-3998-x, doi: 10.1007/s00382-017-3998-x
|
|
Raphael M N, Marshall G J, Turner J, et al. 2016. The Amundsen Sea low: variability, change, and impact on Antarctic climate. Bulletin of the American Meteorological Society, 97(1): 111–121, doi: 10.1175/BAMS-D-14-00018.1
|
|
Sardeshmukh P D, Hoskins B J. 1988. The generation of global rotational flow by steady idealized tropical divergence. Journal of the Atmospheric Sciences, 45(7): 1228–1251, doi: 10.1175/1520-0469(1988)045<1228:TGOGRF>2.0.CO;2
|
|
Schneider D P, Deser C, Okumura Y. 2012. An assessment and interpretation of the observed warming of West Antarctica in the austral spring. Climate Dynamics, 38(1/2): 323–347, doi: 10.1007/s00382-010-0985-x
|
|
Schneider D P, Fogt R L. 2018. Artifacts in century-length atmospheric and coupled reanalyses over Antarctica due to historical data availability. Geophysical Research Letters, 45(2): 964–973, doi: 10.1002/2017GL076226
|
|
Simpkins G R, Mcgregor S, Taschetto A S, et al. 2014. Tropical connections to climatic change in the extratropical Southern Hemisphere: the role of Atlantic SST trends. Journal of Climate, 27(13): 4923–4936, doi: 10.1175/JCLI-D-13-00615.1
|
|
Simpkins G R, Peings Y, Magnusdottir G. 2016. Pacific influences on tropical Atlantic teleconnections to the Southern Hemisphere high latitudes. Journal of Climate, 29(18): 6425–6444, doi: 10.1175/JCLI-D-15-0645.1
|
|
Slivinski L C, Compo G P, Sardeshmukh P D, et al. 2021. An evaluation of the performance of the twentieth century reanalysis version 3. Journal of Climate, 34(4): 1417–1438, doi: 10.1175/JCLI-D-20-0505.1
|
|
Slivinski L C, Compo G P, Whitaker J S, et al. 2019. Towards a more reliable historical reanalysis: improvements for version 3 of the Twentieth Century Reanalysis system. Quarterly Journal of the Royal Meteorological Society, 145(724): 2876–2908, doi: 10.1002/qj.3598
|
|
Song K, Son S W. 2018. Revisiting the ENSO-SSW relationship. Journal of Climate, 31(6): 2133–2143, doi: 10.1175/JCLI-D-17-0078.1
|
|
Stammerjohn S E, Martinson D G, Smith R C, et al. 2008. Trends in Antarctic annual sea ice retreat and advance and their relation to El Niño-Southern Oscillation and Southern Annular Mode variability. Journal of Geophysical Research: Oceans, 113(C3): C03S90, doi: 10.1029/2007jc004269
|
|
Steig E J, Schneider D P, Rutherford S D, et al. 2009. Warming of the Antarctic ice-sheet surface since the 1957 International Geophysical Year. Nature, 457(7228): 459–462, doi: 10.1038/nature07669
|
|
Thompson D W J, Solomon S. 2002. Interpretation of recent Southern Hemisphere climate change. Science, 296(5569): 895–899, doi: 10.1126/science.1069270
|
|
Turner J, Lu Hua, White I, et al. 2016. Absence of 21st century warming on Antarctic Peninsula consistent with natural variability. Nature, 535(7612): 411–415, doi: 10.1038/nature18645
|
|
Turner J, Phillips T, Hosking J S, et al. 2013. The Amundsen sea low. International Journal of Climatology, 33(7): 1818–1829, doi: 10.1002/joc.3558
|
|
Wallace J M, Rasmusson E M, Mitchell T P, et al. 1998. On the structure and evolution of ENSO-related climate variability in the tropical Pacific: lessons from TOGA. Journal of Geophysical Research: Oceans, 103(C7): 14241–14259, doi: 10.1029/97JC02905
|
|
Wang Guomin, Hendon H H, Arblaster J M, et al. 2019. Compounding tropical and stratospheric forcing of the record low Antarctic sea-ice in 2016. Nature Communications, 10(1): 13, doi: 10.1038/s41467-018-07689-7
|
|
Wang Ya, Huang Gang, Hu Kaiming. 2020. Internal variability in multidecadal trends of surface air temperature over Antarctica in austral winter in model simulations. Climate Dynamics, 55(9–10): 2835–2847, doi: 10.1007/s00382-020-05412-1
|
|
Xie Fei, Li J, Tian Wenshou, et al. 2012. Signals of El Niño Modoki in the tropical tropopause layer and stratosphere. Atmospheric Chemistry and Physics, 12(11): 5259–5273, doi: 10.5194/acp-12-5259-2012
|
|
Yu Lejiang, Zhong Shiyuan, Sun Bo. 2022. Synchronous variation patterns of monthly sea ice anomalies at the Arctic and Antarctic. Journal of Climate, 35(9): 2823–2847, doi: 10.1175/JCLI-D-21-0756.1
|
|
Yu Lejiang, Zhong Shiyuan, Winkler J A, et al. 2017. Possible connections of the opposite trends in Arctic and Antarctic sea-ice cover. Scientific Reports, 7: 45804, doi: 10.1038/srep45804
|


Figures(11) / Tables(2)

Supported by:
Beijing Renhe Information Technology Co. Ltd

Cuijuan Sui, Lejiang Yu, Alexey Yu. Karpechko, Licheng Feng, Shan Liu. Influence of the Atlantic Multidecadal Oscillation and Interdecadal Pacific Oscillation on Antarctic surface air temperature during 1900 to 2015[J]. Acta Oceanologica Sinica, 2024, 43(3): 48-58. doi: 10.1007/s13131-023-2247-x

| Month | Years in different phases | |||
| +AMO+IPO | –AMO–IPO | +AMO–IPO | –AMO+IPO | |
| JFM |
1929–1933 1938–1942 |
1908–1912 1914–1926 1964–1978 |
1934–1937 1943–1963 1998–2015 |
1900–1907/1913 1927–1928 1979–1997 |
| AMJ |
1928–1933 1938–1942 |
1908–1912 1914–1925 1963–1978 |
1934–1937 1943–1962 1998–2015 |
1900–1907/1913 1926–1927 1979–1997 |
| JAS |
1928–1933 1937–1942/1997 |
1908–1912 1914–1925 1963–1977 |
1934–1036 1943–1962 1998–2015 |
1900–1907/1913 1926–1927 1978–1996 |
| OND |
1928–1932 1937–1941 |
1908–1925 1963–1977 |
1933–1936 1942–1962 1997–2015 |
1900–1907 1926–1927 1978–1996 |
DownLoad:
CSV
| Month | Correlation coefficient | |||
| +AMO+IPO | –AMO–IPO | +AMO–IPO | –AMO+IPO | |
| JFM | 0.62* | 0.77* | 0.86* | 0.72* |
| AMJ | 0.93* | 0.01 | 0.63* | 0.74* |
| JAS | 0.79* | 0.26* | 0.69* | 0.72* |
| OND | 0.62* | 0.41* | 0.64* | 0.73* |
| Note: Asterisk (*) denotes above 99% confidence level. | ||||
DownLoad:
CSV
| Month | Years in different phases | |||
| +AMO+IPO | –AMO–IPO | +AMO–IPO | –AMO+IPO | |
| JFM |
1929–1933 1938–1942 |
1908–1912 1914–1926 1964–1978 |
1934–1937 1943–1963 1998–2015 |
1900–1907/1913 1927–1928 1979–1997 |
| AMJ |
1928–1933 1938–1942 |
1908–1912 1914–1925 1963–1978 |
1934–1937 1943–1962 1998–2015 |
1900–1907/1913 1926–1927 1979–1997 |
| JAS |
1928–1933 1937–1942/1997 |
1908–1912 1914–1925 1963–1977 |
1934–1036 1943–1962 1998–2015 |
1900–1907/1913 1926–1927 1978–1996 |
| OND |
1928–1932 1937–1941 |
1908–1925 1963–1977 |
1933–1936 1942–1962 1997–2015 |
1900–1907 1926–1927 1978–1996 |
| Month | Correlation coefficient | |||
| +AMO+IPO | –AMO–IPO | +AMO–IPO | –AMO+IPO | |
| JFM | 0.62* | 0.77* | 0.86* | 0.72* |
| AMJ | 0.93* | 0.01 | 0.63* | 0.74* |
| JAS | 0.79* | 0.26* | 0.69* | 0.72* |
| OND | 0.62* | 0.41* | 0.64* | 0.73* |
| Note: Asterisk (*) denotes above 99% confidence level. | ||||
 DownLoad:

 DownLoad: