Frontiers Science Center for Deep Ocean Multispheres and Earth System/Key Laboratory of Marine Chemistry Theory and Technology of Ministry of Education, Ocean University of China, Qingdao 266100, China
2.
Laboratory for Marine Ecology and Environmental Science, Qingdao National Laboratory for Marine Science and Technology, Qingdao 266071, China
3.
College of Chemistry and Chemical Engineering, Ocean University of China, Qingdao 266100, China
4.
Academy of the Future Ocean, Ocean University of China, Qingdao 266100, China
5.
Key Laboratory of Marine Eco-Environmental Science and Technology, First Institute of Oceanography, Ministry of Natural Resources, Qingdao 266100, China
6.
Research Center for Monitoring and Environmental Sciences, Taihu Basin and East China Sea Ecological Environment Supervision and Administration Authority, Ministry of Ecology and Environment, Shanghai 200120, China
7.
State Key Laboratory of Marine Geology, Tongji University, Shanghai 200092, China
8.
Department of Earth, Ocean and Atmospheric Science, Florida State University, Tallahassee FL 32306, USA
Funds:
The National Natural Science Foundation of China under contract Nos 42130410 and U22A20580; the Fundamental Research Funds for the Central Universities under contract No. 202341002.
Hypoxia is a common phenomenon in the sea adjacent to the Changjiang River Estuary (CJE), one of the global major estuaries. Submarine groundwater discharge (SGD) is a widely recognized pathway for terrestrial materials entering the sea, and has been found to be significant off the CJE. We used a 222Rn mass balance model to estimate the SGD fluxes off the CJE and showed that it is linked to seasonal dissolved oxygen (DO) variations. Average SGD fluxes were estimated to be (0.012 ± 0.010) m3/(m2·d) in winter, (0.034 ± 0.015) m3/(m2·d) in summer, and (0.020 ± 0.010) m3/(m2·d) in autumn. We found a significant negative correlation between DO concentrations and SGD rates with groundwater discharge being highest in the summer flood season. In addition, distribution patterns of SGD and hypoxia zones in summer are spatially overlapped, indicating that SGD is an important contributor to summer hypoxia in this region.
Hypoxia is a condition that occurs in the water column when dissolved oxygen (DO) falls below the 2 mg/L (Diaz and Rosenberg, 1995) or 3 mg/L (Chen et al., 2007). Recently, hypoxia has been found commonly in many estuaries and coastal areas (Conley et al., 2009; Justić et al., 2002; Li et al., 2002; Montagna and Froeschke, 2009). This includes the East China Sea (ECS), which has long been one of the world’s major fishing grounds. High primary productivity and abundant nutrients lead to high fishery yields, especially in the Changjiang River Plume and adjacent coastal waters. The Changjiang River Estuary (CJE) and its adjacent sea is one of the most serious seasonal hypoxia regions in the world (Chen et al., 2007; Fennel and Testa, 2019), with a record of hypoxia that can be traced back to the 1950s (Gu, 1980). The low-oxygen situation in the waters off the CJE began to appear in late spring or early summer. Hypoxia is usually formed in the southeast portion of the sea during the early stages, then spreads both southward and northward. Temporally, hypoxia is most severe in August, weakening in autumn and disappearing in winter (Wang et al., 2012). The severity of hypoxia off the CJE varies with the year, as does the position of hypoxia regions (Wei et al., 2017).
The traditional view is that organic matter deposition and water stratification are the main mechanisms leading to the formation of hypoxia (Chi et al., 2017; Wei et al., 2015; Zhu et al., 2011). The stratification of a water body is essential for the formation of hypoxia in continental shelf environments. Stratification will prevent deep water from mixing with oxygen-rich surface waters. Organic matter decomposition is the main consumer of DO in seawater. Stratification is important for the development of hypoxia in the deeper levels, and the maintenance of these conditions requires a continuously supply of organic matter. Recent studies suggested that submarine groundwater discharge (SGD) may be a new potential mechanism to change the redox conditions in the bottom layer in the region off the CJE (Guo et al., 2020; Peterson et al., 2016; Sanial et al., 2021). Guo et al. (2020) found a well-developed overlap of the distribution patterns for both SGD fluxes and DO concentrations. This led to a proposed direct and indirect mechanisms in which SGD contributes to hypoxia off the CJE. Directly, SGD transfers anoxic groundwater that contribute to hypoxia via dilution. In addition, groundwater contains a variety of reducing substances that may accumulate in sediments and be released when an outbreak occurs (Emeis et al., 2004). As for the indirect way, groundwater may contain much higher nutrient concentrations than seawater. The region of summer hypoxia off the CJE is similar to the region with higher chlorophyll content (Wei et al., 2015).
SGD is the groundwater flux from the seabed to the ocean, including any and all flow of water regardless of fluid composition or driving force (Burnett et al., 2003; Moore, 2010). SGD is driven by multiple forces, and thus covers a variety of temporal and spatial scales. As a pathway for transporting dissolved substances such as nutrients (Cho et al., 2018; Kim et al., 2005), heavy metals (Alorda-Kleinglass et al., 2019), organic matter (Santos et al., 2009) from land to sea, SGD has been recognized as an important part of the water cycle. Ecological and environmental effects can be caused due to large amounts of materials carried by SGD into the sea, such as eutrophication (Knee and Paytan, 2011), red tides (Lee et al., 2009), hypoxia (Moore et al., 2022; Peterson et al., 2016), acidification (Lee and Kim, 2015), and more. SGD can be followed by geochemistry tracers, among which radium and radon isotopes are mostly applied. The high concentration of 222Rn in groundwater compared to seawater, together with its non-reactive nature and short half-life (t1/2 = 3.82 d) make 222Rn an excellent tracer for identifying significant groundwater discharge regions (Charette et al., 2008). 222Rn is increasingly being used for tracing and quantifying SGD in a wide range of environments such as estuary (Kim et al., 2010), coastal ocean (Smith and Swarzenski, 2012), coastal embayment (Corbett et al., 1999), lagoons (Sadat-Noori et al., 2016), among others.
In this study, we used a 222Rn mass balance model to estimate the SGD fluxes off the CJE based on the 222Rn and 226Ra activities of bottom waters. The seasonal variations of SGD in the region off the CJE are described. The results obtained from this work would help to better understand the correlation between SGD and hypoxia off the CJE.
2.
Materials and methods
2.1
Study site
The Changjiang River is the largest river in China with an annual mean discharge of 9.4×10¹¹ m3/a over the past ten years (Changjiang River Sediment Bulletin in 2021, http://www.cjw.gov.cn/zwzc/bmgb/nsgb/62179.html), carrying tremendous amounts of nutrients and organic matter into the ECS. The main hydrographic features of the CJE and its adjacent waters include Changjiang River Diluted Water, Yellow Sea Coastal Current, Taiwan Warm Current, nearshore Kuroshio Branch Current. The intensities of these water masses and their interactions may be the driving forces of the annual variation of the location and the expansion of the hypoxic zone (Wei et al., 2011). The tidal range around the Changjiang River mouth is 5 m (Wu et al., 2011). The mean annual precipitation is 1 115 mm. There is a topographic feature of the study area that is close to the hypoxic zone. This feature is an underwater valley extending from the southeast to the northwest, of which the location is usually overlap with one of the cores of the hypoxic zones off the CJE.
2.2
Sampling and analytical method
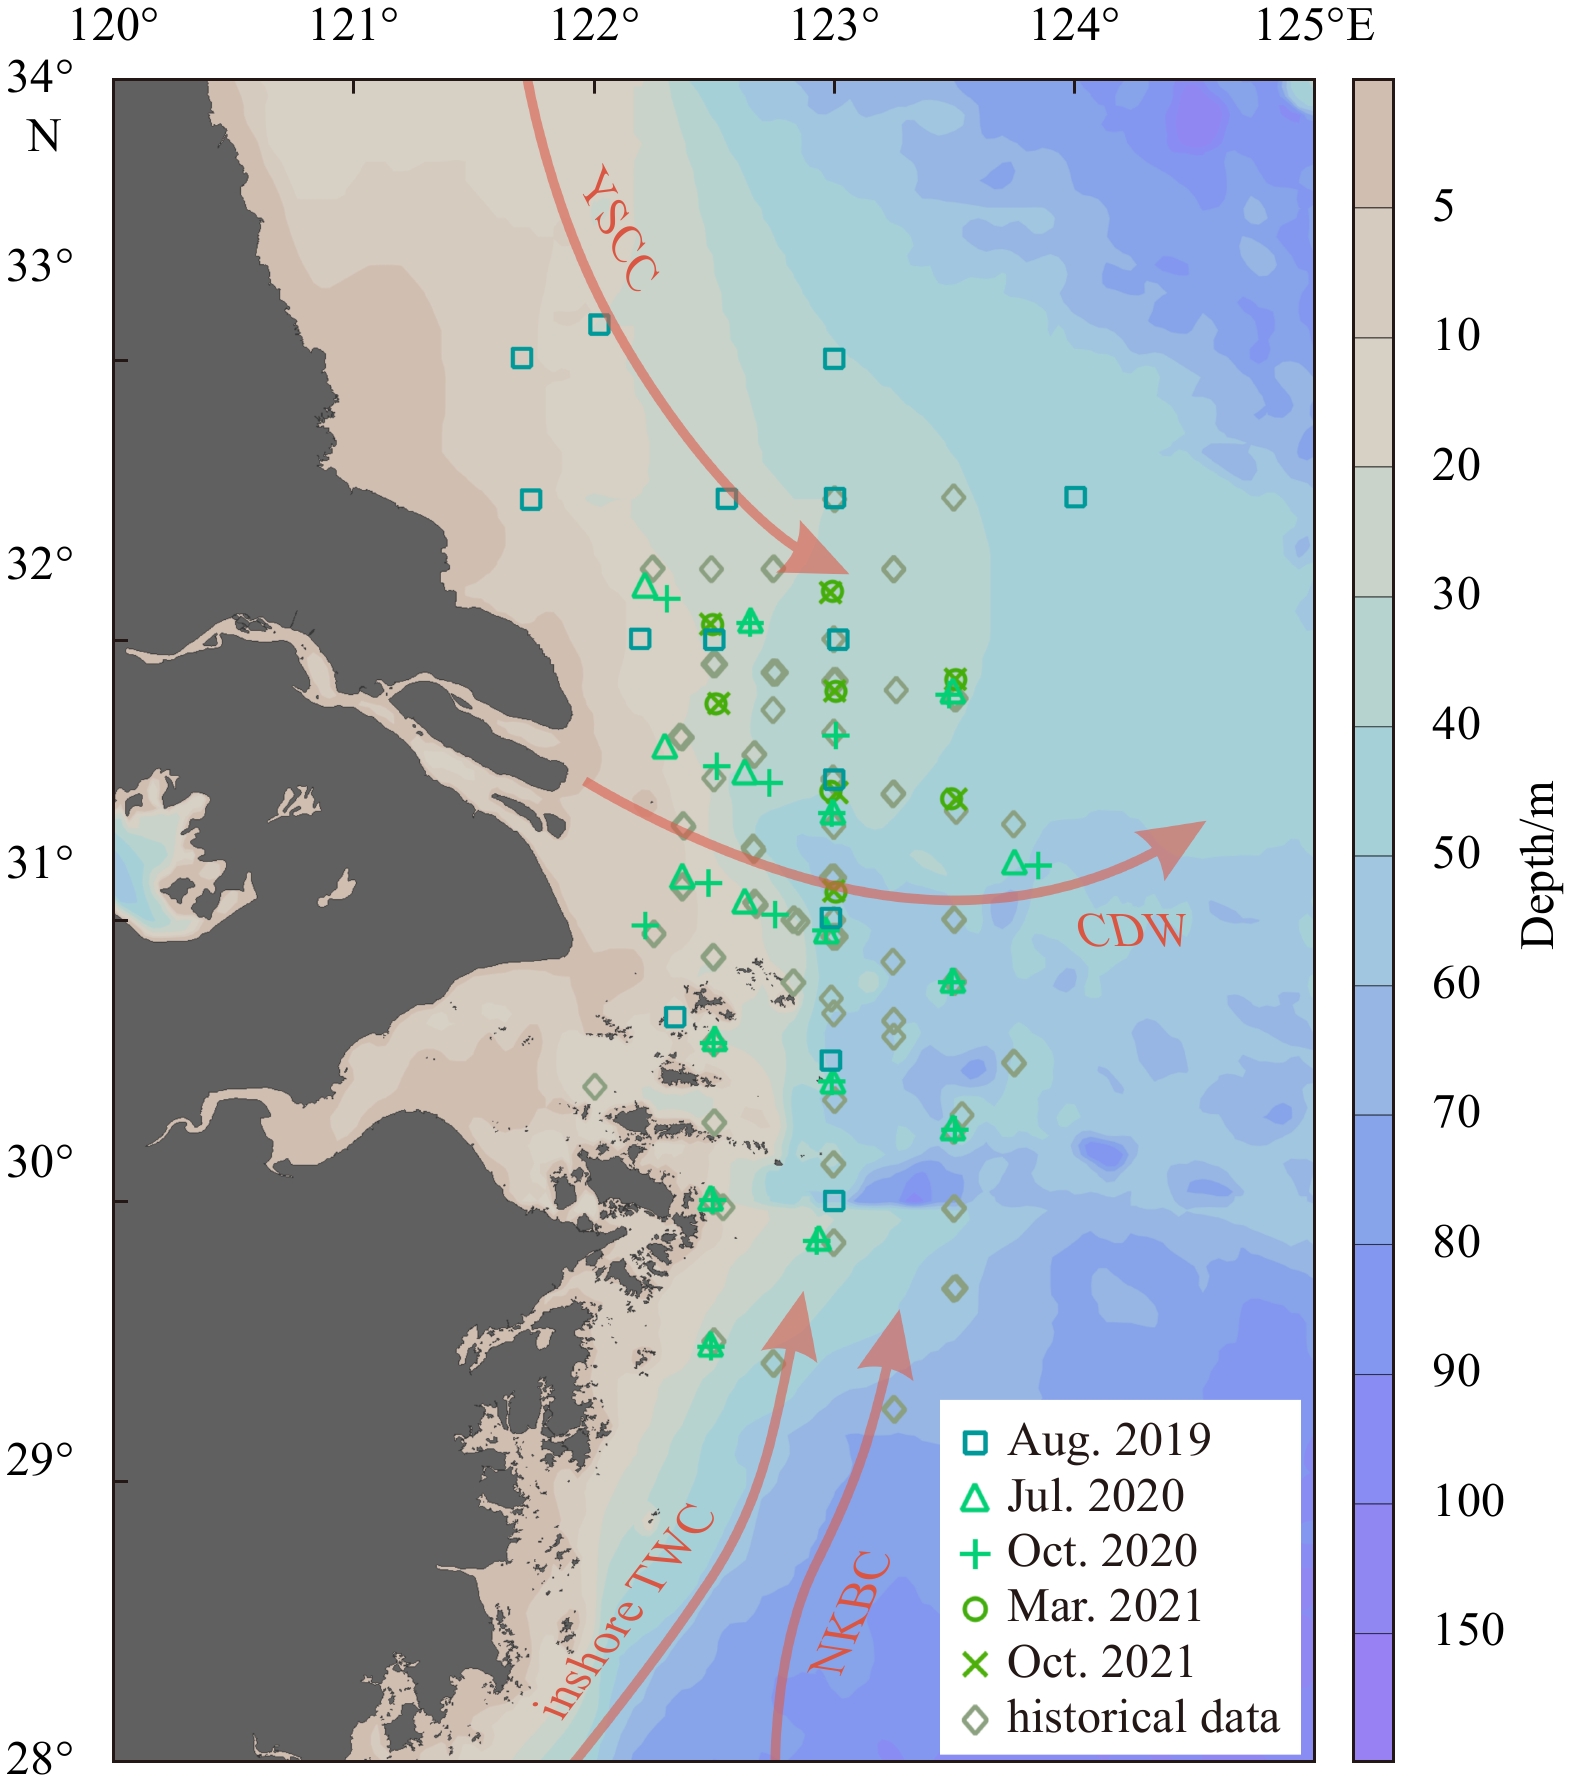
A series of field sampling and measurements were conducted in different seasons in the sea adjacent to the CJE. Samples were collected during five cruises, including August 2019 (R/V Runjiang1), July and October 2020 (R/V Zheyuke), March and October 2021 (R/V Runjiang1). The sampling stations of seawater are shown in Fig. 1. The water depth in our study area ranges from 9 m to 64 m.
Figure
1.
Sampling stations and main water masses in the sea adjacent to the Changjiang River Estuary. Historical data were previously reported in Guo et al. (2020). The solid arrows represent paths of different water masses: Changjiang River Diluted Water (CDW), Yellow Sea Coastal Current (YSCC), Taiwan Warm Current (TWC), nearshore Kuroshio Branch Current (NKBC).
Seawater at each sampling station was sampled from an onboard SeaBird CTD rosette (SBE 9/11 puls, SBE Inc., USA). Then ~6 L of water was subsampled into sealed and evacuated Nalgene bottles for both surface and bottom 222Rn analysis on board. High-purity helium gas was flushed through the water sample to sweep out the 222Rn gas, which was then captured in a liquid nitrogen cold trap. After the transfer process, the cold trap was heated and 222Rn transferred into Lucas cells. These cells were sealed for 3 h for 222Rn and its α-emitting daughter products to reach secular equilibrium. The α-activity was then measured by a 222Rn counting system (Ludlum Model 2000 Timer/Scaler, Ludlum Measurements Inc., USA) with uncertainty less than 10%. The system was calibrated using NIST-traceable 226Ra standard solutions. More details can be found in Guo et al. (2020).
Surface and bottom water 226Ra were sampled on board and measured in the laboratory (Waska et al., 2008). After 222Rn was sparged out of each sample, the water was filtered through a column filled with about 20 g (dry weight) of MnO2-coated acrylic fiber (Mn-fiber) that was made using the method proposed by Moore (1978). 226Ra in seawater is quantitatively adsorbed onto Mn-fibers (98%). After returning to the laboratory, Mn-fibers were washed to get rid of seawater salt and other content, then the ratio of water content to Mn-fiber was adjusted to approximately one. The Mn-fibers were thereafter stored for the ingrowth of 222Rn. The RaDeCC (Scientific Computer Instruments, USA) developed by Moore and Arnold (1996) was used to measure the activity of 226Ra. The analytical uncertainty was below 5%, which was determined by counting statistics within a 1-sigma confidence interval.
Dissolved oxygen was measured using Winkler titration method. Density was calculated and recorded throughout the water column by the CTD rosette (RBR Ltd., Canada). Wind data were collected onboard.
2.3
SGD estimations
Assuming steady state conditions, we can use a 222Rn mass balance model to evaluate the SGD fluxes of our study region. The sources of 222Rn in the water column include SGD, river inputs, and diffusive flux from sediments. The sinks include the natural decay of 222Rn, the oceanic output flux to the ECS, and 222Rn loss across the pycnocline layer or the atmosphere. Thus, the SGD flux can be estimated as follows:
where $ {F}_{\rm{SGD}} $ is the SGD flux (m3/(m2·d)); $ {F}_{\rm{decay}} $ (Bq/(m2·d)) is calculated by multiplying the inventory of unsupported 222Rn in the water column below the pycnocline ($ I $, Bq/m2) by the decay constant of 222Rn ($\text{λ}$ = 0.181 d−1), and unsupported 222Rn was calculated by subtracting supported 222Rn (226Ra) from total 222Rn; $ {F}_{\rm{pycnocline}} $ (Bq/(m2·d)) refers to the unsupported 222Rn loss through the pycnocline layer when the water column is strongly stratified; $ {F}_{\rm{atmosphere}} $ (Bq/(m2·d)) is the flux from surface water to the atmosphere when stratification does not exist; Fpycnocline/atmosphere means that either Fpycnocline or Fatmosphere should be considered under different circumstances; $ {F}_{\rm{mixing}} $ (Bq/(m2·d)) is the mixing flux from coastal waters to offshore waters. In this work, we considered the maximum negative $ {F}_{\rm{decay}} $ of each cruise as $ {F}_{\rm{mixing}} $, following the procedure proposed by Dulaiova et al. (2006). $ {F}_{\rm{diffusion}} $ (Bq/(m2·d)) represents the diffusive flux of radon from sediments; $ {F}_{\rm{river}} $ (Bq/(m2·d)) is the river input of 222Rn; $ {A}_{\rm{gw}} $ (Bq/m3) refers to the 222Rn activity in groundwater.
The term of $ {F}_{\rm{pycnocline}} $ or $ {F}_{\rm{atmosphere}} $ is separately considered in each calculation as it depends on whether the water column is stratified or not. In the CJE, there always exists a pycnocline in the water column during the summer season. This hinders convection and exchange of matter between the upper and lower layers of water column. As the wind strengthens and the sea surface temperature drops, the vertical convective mixing is intensified, the pycnocline begins to decline in autumn and eventually disappears during the winter. $ {F}_{\rm{atmosphere}} $ is taken into account when the water column is well mixed vertically, which is calculated as follows (MacIntyre et al., 1995):
where $ {C}_{\mathrm{w}\mathrm{a}\mathrm{t}\mathrm{e}\mathrm{r}} $ and $ {C}_{\mathrm{a}\mathrm{t}\mathrm{m}\mathrm{o}\mathrm{s}\mathrm{p}\mathrm{h}\mathrm{e}\mathrm{r}\mathrm{e}} $ refer to the activity of 222Rn in surface water and in air, respectively; $ {C}_{\mathrm{a}\mathrm{t}\mathrm{m}\mathrm{o}\mathrm{s}\mathrm{p}\mathrm{h}\mathrm{e}\mathrm{r}\mathrm{e}} $ is assumed to be 0; $ \alpha $ is the solubility coefficient of 222Rn ($\alpha =0.105+0.405{\rm{e}}^{-0.050\,2T}$; and $ T $ is the temperature of the water); $ k $ is the gas transfer velocity, calculated as Lambert and Burnett (2003):
where $ \mu $ is the wind speed (m/s); $ \beta $ = 0.666 7 for 1.5 m/s < $ \mu \leqslant$ 3.6 m/s, and $ \beta $ = 0.5 for $ \mu $ > 3.6 m/s; if $ \mu $ < 1.5 m/s, k remains constant (0.91). Sc is the temperature dependent Schmidt number for 222Rn. In this work the vertically well-mixed circumstances only occur in cruises in March and October, when Sc is calculated using temperature ($ T $, ℃) as Pilson (1998):
$$ Sc=3\;417.6{\rm{e}}^{-0.063\;4 T} . $$
(5)
3.
Results
3.1
222Rn distribution off the CJE
The activities of dissolved 222Rn in the surface water of the study area ranged from 0.88 Bq/m3 to 8.85 Bq/m3 in spring (March), from below detection limit (0.05 Bq/m3) to 21.25 Bq/m3 in summer (July and August), from 0.70 Bq/m3 to 19.50 Bq/m3 in autumn (October) (Table S1). As a noble gas, 222Rn dissolved in surface water escapes by gas-exchange to the atmosphere, which is mainly controlled by wind velocity and temperature (Schink et al., 1970).
The activities of dissolved 222Rn in the bottom water of the study area ranged from 0.03 Bq/m3 to 14.12 Bq/m3 in spring (March), from below detection limit to 35.15 Bq/m3 in summer (July and August), from 5.98 Bq/m3 to 19.72 Bq/m3 in autumn (October) (Table S1). For the average 222Rn level in bottom water, the lowest average activity occurred in winter ((4.62 ± 3.85) Bq/m3, March 2018), and the highest was found in summer ((21.13 ± 7.92) Bq/m3, August 2019).
The difference of 222Rn activities between surface water and bottom water was the greatest in summer than in other seasons (Fig. 2), due to seasonal stratification of water column. The 222Rn activity in the bottom layer was lower than that in the surface layer in winter, the season with most vertically well-mixed water, illustrating 222Rn flux supported by benthic boundary sources (e.g., SGD) may be the lowest in winter. In contrast to the winter cruises, the 222Rn activity in the bottom layer was higher than that in the surface layer in both the summer and autumn cruises. The activity of 222Rn in bottom water was about two orders of magnitudes lower than that in groundwater endmember (Chen et al., 2021). The seasonal variations in bottom water radon indicate the radon input at the sediment-water interface was stronger in summer and autumn.
Figure
2.
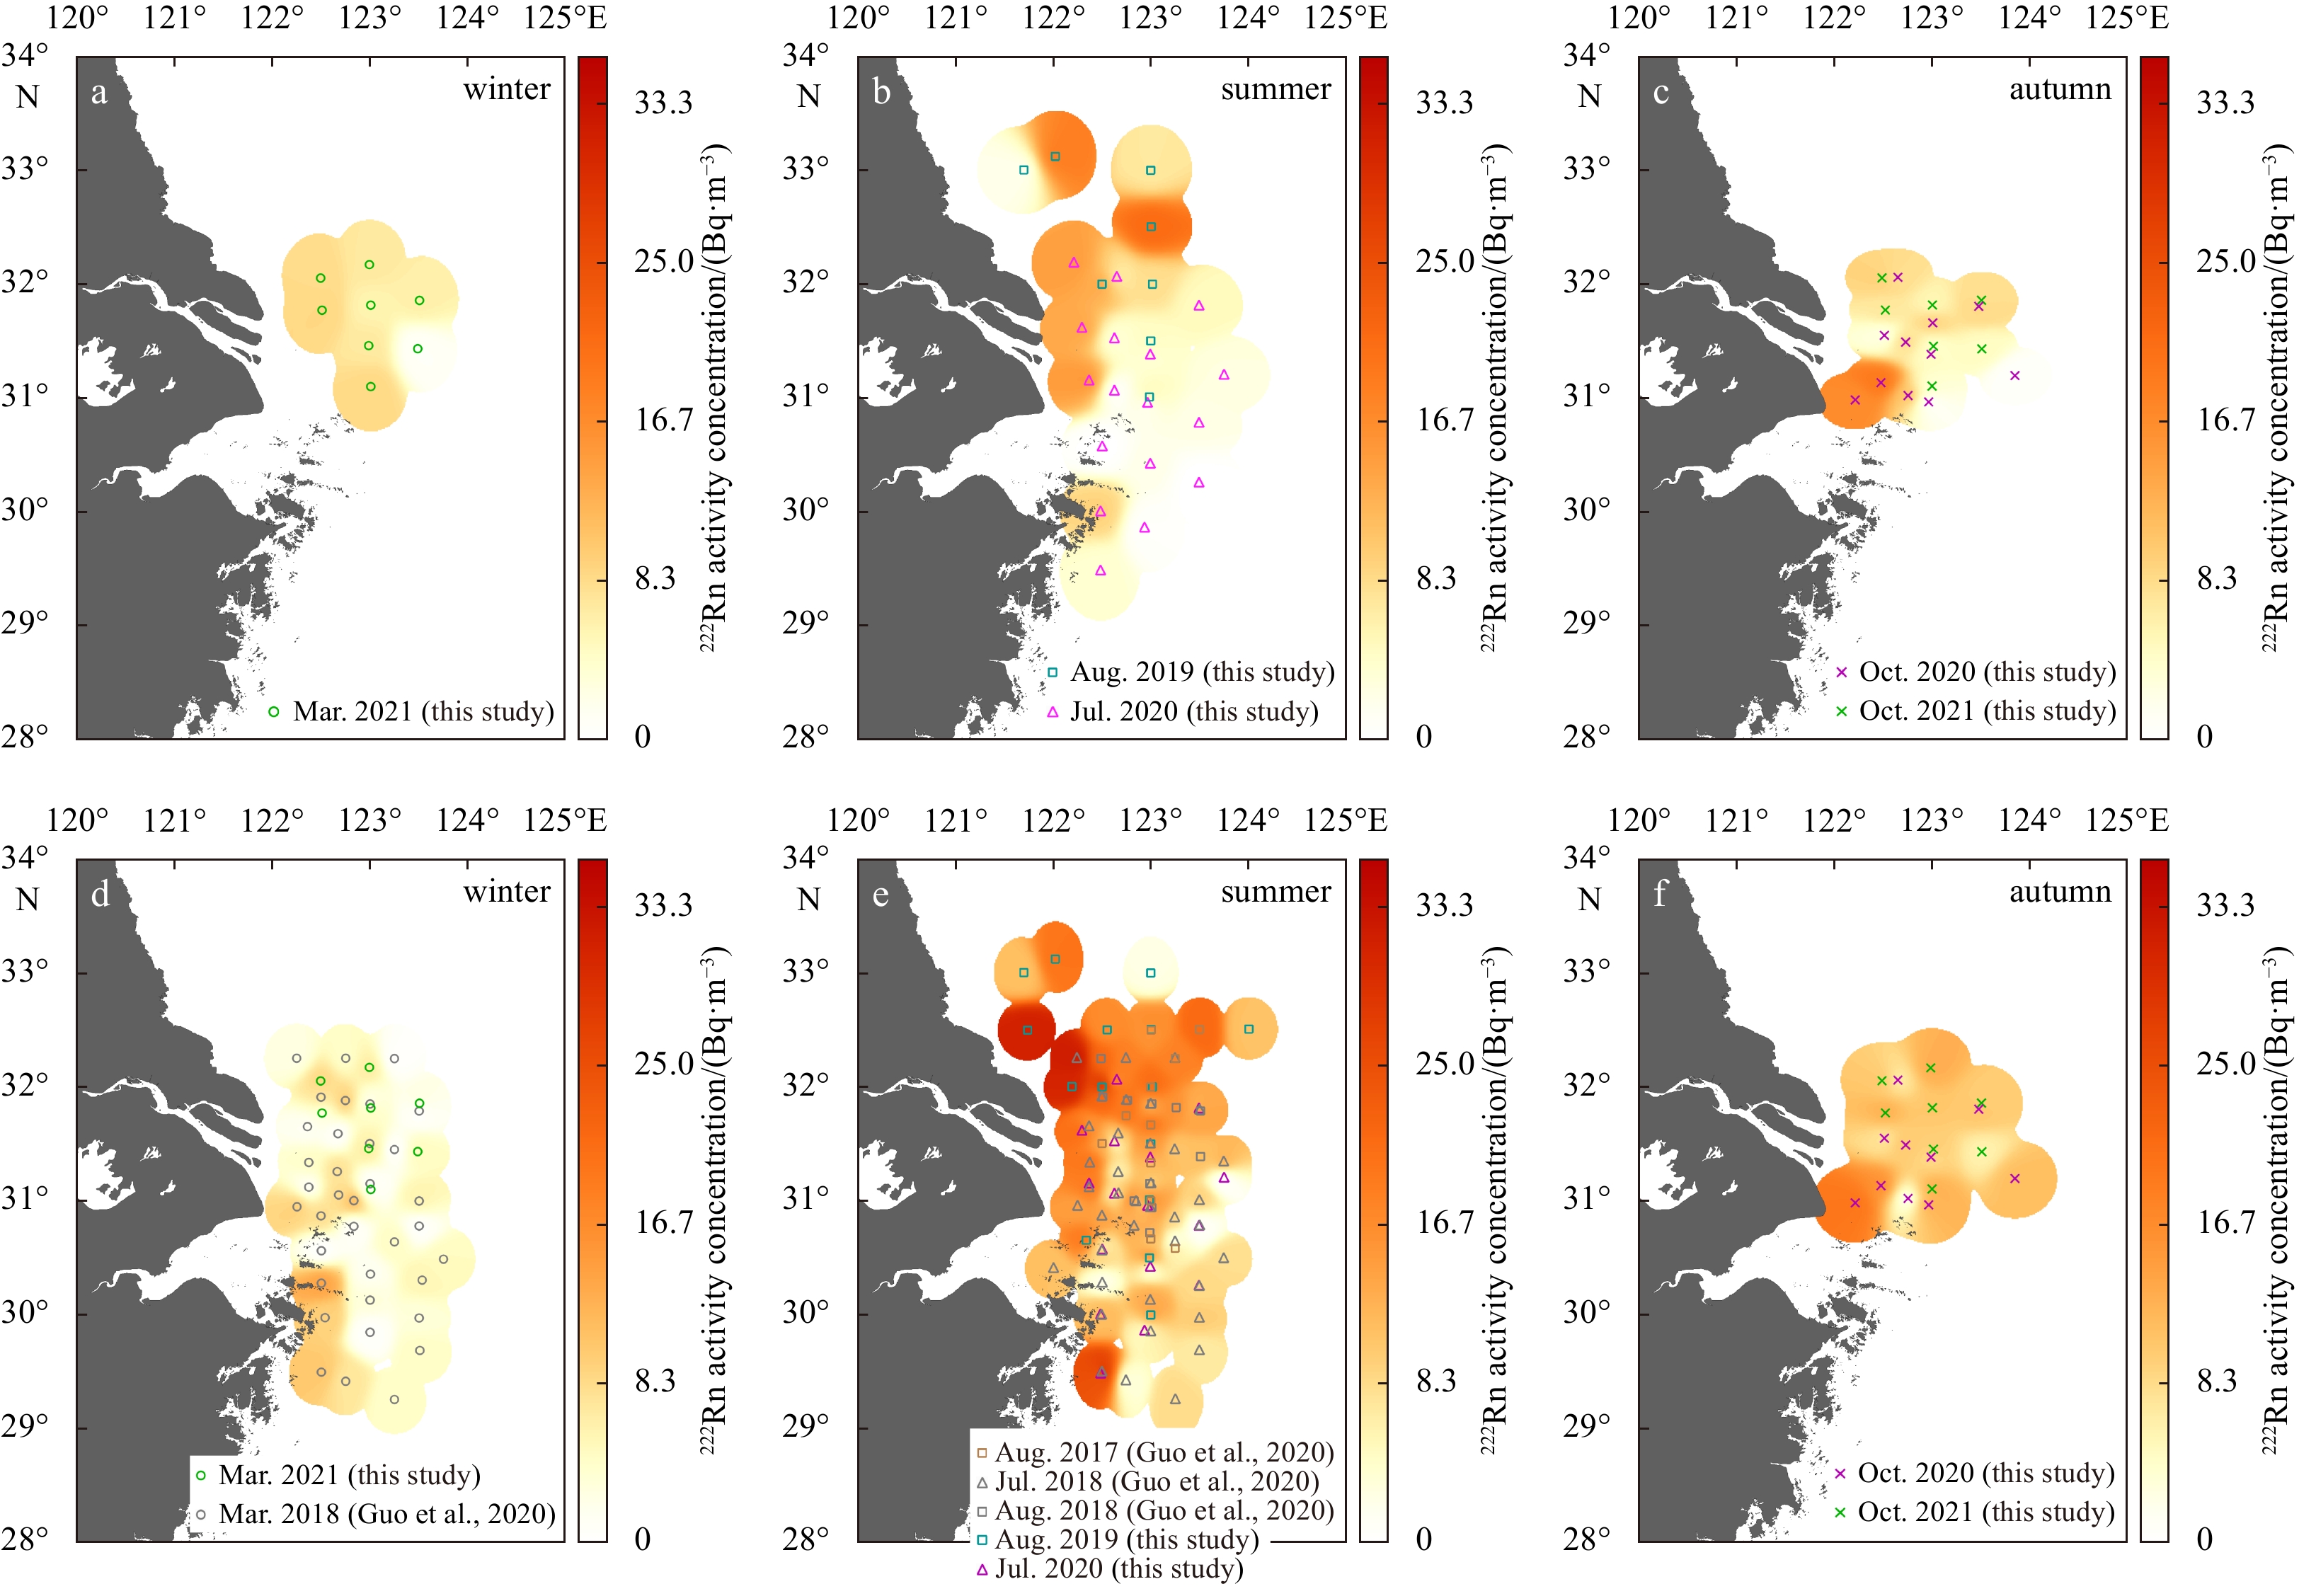
The distribution of 222Rn activity concentration (Bq/m3) in different seasons off the Changjiang River Estuary. a−c. 222Rn in surface waters; d−f. 222Rn in bottom water.
222Rn has a short half-life of 3.82 d, so it decays rapidly once it left its source. As shown in Fig. 2e, the highest activities were observed nearshore at the north of the Changjiang River mouth and the south of the Hangzhou Bay during the summer. Considering the long transport time of the Changjiang River water into the study area compared with the half-life of 222Rn (Guo et al., 2020), these 222Rn hotspots off the Changjiang River plume trajectories clearly were not supported by riverine input, thus most likely supported by SGD. The area with high 222Rn concentrations in the north extended much further offshore, implying a stronger and wider existence of the benthic radon sources.
3.2
SGD fluxes estimation
We used two approaches for the quantification of SGD off the CJE. We calculated the SGD flux at all sampling stations from summer cruises for mapping the spatial distribution of SGD dynamics. Meanwhile, to show the seasonal variation of SGD, we pooled all the data of the same season to estimate the weighted SGD flux with the mean value for each season. Considering the heterogenous nature of SGD dynamics, we constrained the spatial range for the seasonal estimates to a specific region (31.00°−32.25°N, 122.50°−123.50°E) to better compare the seasonal variation of SGD dynamics. The data used to estimate SGD were compiled from nine cruises, four of which were previously reported by Guo et al. (2020).
The unsupported 222Rn inventories were used to calculate the decay loss by the Eq. (2). The inventories were calculated depending on whether stratification existed. Stratification of water column was strong in summer, preventing 222Rn from being transported vertically. Here we used bottom water unsupported 222Rn activities multiplied with sub-pycnocline depths as the inventories. Pycnocline depths were determined from the vertical density profiles. Sub-pycnocline depths (from pycnocline to the bottom) were obtained by subtracting pycnocline depths from water depths. When the water column was well-mixed in autumn and winter, we obtained the inventories by multiplying bottom water unsupported 222Rn activities with water depths. It should be noted that in October, the intensity of stratification decreased and the spatial range of stratified water columns were reduced (Zou et al., 2001 ). However, there were still a few sampling stations with recognizable pycnoclines. As a result, the 222Rn inventories were calculated to be (−2.1 ± 139.3) Bq/m2 in winter, (333.4 ± 205.8) Bq/m2 in summer, and (156.7 ± 129.4) Bq/m2 in autumn. The apparent negative 222Rn inventory in winter is a result of more radon loss than input into the water column off the CJE.
Assuming 222Rn activity concentration in the air ($ {C}_{\mathrm{a}\mathrm{t}\mathrm{m}\mathrm{o}\mathrm{s}\mathrm{p}\mathrm{h}\mathrm{e}\mathrm{r}\mathrm{e}} $) is essentially zero, the atmospheric losses of 222Rn from surface water were calculated using Eq. (3), only for stations in March cruises and most stations with well-mixed water column in October cruises that this term was considered. The atmospheric loss was negligible in summer, due to the existence of well-defined stratification. The $ {F}_{\mathrm{a}\mathrm{t}\mathrm{m}\mathrm{o}\mathrm{s}\mathrm{p}\mathrm{h}\mathrm{e}\mathrm{r}\mathrm{e}} $ was (10.5 ± 3.8) Bq/(m2·d) in winter, and (10.0 ± 5.2) Bq/(m2·d) in autumn.
The mixing loss refers to the flux from nearshore relatively high 222Rn to offshore seawater with low 222Rn. To estimate SGD conservatively, considering total SGD must be positive values, we take the maximum negative flux after considering all other sources and sinks ($ {F}_{\mathrm{d}\mathrm{e}\mathrm{c}\mathrm{a}\mathrm{y}} $+$ {F}_{\mathrm{a}\mathrm{t}\mathrm{m}\mathrm{o}\mathrm{s}\mathrm{p}\mathrm{h}\mathrm{e}\mathrm{r}\mathrm{e}} $+$ {F}_{\mathrm{p}\mathrm{y}\mathrm{c}\mathrm{n}\mathrm{o}\mathrm{c}\mathrm{l}\mathrm{i}\mathrm{n}\mathrm{e}} $−$ {F}_{\mathrm{d}\mathrm{i}\mathrm{f}\mathrm{f}\mathrm{u}\mathrm{s}\mathrm{i}\mathrm{o}\mathrm{n}} $−$ {F}_{\mathrm{r}\mathrm{i}\mathrm{v}\mathrm{e}\mathrm{r}} $) as $ {F}_{\mathrm{m}\mathrm{i}\mathrm{x}\mathrm{i}\mathrm{n}\mathrm{g}} $ (Burnett et al., 2003; Peterson et al., 2008). The SGD flux was so estimated to be a conservative and minimum value. Our evaluated mixing fluxes were (37.7 ± 2.3) Bq/(m2·d) in winter, (41.4 ± 3.7) Bq/(m2·d) in summer, (29.5 ± 3.9) Bq/(m2·d) in autumn.
The transport time (20 d) of the Changjiang River water into the study area was five times longer than the half-life of 222Rn (Guo et al., 2020), therefore the radon contribution of river discharge to this region can be ignored.
$ {F}_{\mathrm{p}\mathrm{y}\mathrm{c}\mathrm{n}\mathrm{o}\mathrm{c}\mathrm{l}\mathrm{i}\mathrm{n}\mathrm{e}} $ is calculated using vertical eddy diffusion (${K}_{{\rm{v}}}$ = 3.4 × 10⁻⁴ cm2/s from Cable et al. (1996) and vertical concentration gradients of 222Rn as follows:
The resulting 222Rn loss fluxes across the pycnocline ranged from 1.7 × 10⁻⁴ Bq/(m2·d) to 3.6 × 10⁻³ Bq/(m2·d) (Table S2), which are negligible compared with other terms in the balance model.
$ {F}_{\mathrm{d}\mathrm{i}\mathrm{f}\mathrm{f}\mathrm{u}\mathrm{s}\mathrm{i}\mathrm{o}\mathrm{n}} $ and $ {A}_{\mathrm{g}\mathrm{w}} $ we used were from sediment equilibration experiments carried out by Guo et al. (2020). Samples were collected from the same study area during two seasons covering wet and dry season. No significant seasonal difference was found. Therefore, average values of $ {F}_{\mathrm{d}\mathrm{i}\mathrm{f}\mathrm{f}\mathrm{u}\mathrm{s}\mathrm{i}\mathrm{o}\mathrm{n}} $ and $ {A}_{\mathrm{g}\mathrm{w}} $ among all sites were used in our estimation. SGD fluxes were evaluated by Eq. (1) with all the terms mentioned above (Table 1). Our results showed that SGD fluxes in this specific region were (0.012 ± 0.010) m3/(m2·d) in winter, (0.034 ± 0.015) m3/(m2·d) in summer, and (0.020 ±0.010) m3/(m2·d) in autumn.
Table
1.
Parameters of 222Rn mass balance model used for submarine groundwater discharge (SGD) fluxes calculations
The uncertainties of SGD fluxes were mainly caused by estimations of the 222Rn activity of groundwater endmember, 222Rn inputs from sediment diffusion and unsupported 222Rn inventories. The selection of groundwater or porewater endmember is always an important source of uncertainty in the estimation of SGD flux (Taniguchi et al., 2019). In our work, we used the value from Guo et al. (2020) that was estimated using laboratory sediment equilibration experiments. The experiments were conducted under the assumption that 222Rn in groundwater was able to equilibrate with aquifer and associated sediments (Chanyotha et al., 2014). Therefore, this will be the maximum groundwater endmember value, again leading to a conservative (minimum) estimate of SGD flux.
Comparison of our results with previously reported works is shown in Table 2. Gu et al. (2012) estimated the SGD into the Changjiang River Effluent Plume in September 2009 to be 0.008−0.040 m3/(m2·d). Wang et al. (2018) evaluated the SGD flux in the ECS to be 0.0039 m3/(m2·d). Tan et al. (2018) suggested that the SGD flux in the continental shelf of the ECS to be 0.044−0.138 m3/(m2·d). Guo et al. (2020) calculated the SGD flux to be in the range of 0.002−0.022 m3/(m2·d). Our estimated SGD fluxes are comparable with these previous works.
Table
2.
Comparisons of submarine groundwater discharge fluxes (FSGD) in the East China Sea
According to the results in Section 3.2, the maximum SGD off the CJE was observed in summer, followed by autumn and then winter. The average 222Rn inventory in winter was found to be negative, indicating that the supply of 222Rn could not compensate for the losses in the box model. The low bottom 222Rn concentrations (lower than surface 222Rn) may imply that groundwater flux in winter was lowest among three seasons, considering the similar mixing losses in different seasons. On the other hand, the water column is mixed vertically during the winter, allowing more 222Rn from the bottom to escape into the atmosphere. The ECS and its coastal areas are obviously affected by the southeast monsoon in summer. Precipitation in this region shows significant seasonal variation. Therefore, the terrestrial hydraulic gradient, which is closely related to precipitation, might be an important reason for the seasonal variation of SGD off the CJE. Figure S1 showed the average monthly precipitation from 1981 to 2010 at three stations (Qidong, Chongming and Shengsi) near the CJE. High precipitation occurs during the wet season (from May to July) and typhoon seasons (from July to October). Precipitation increases rapidly from May to June, and decreases from August to October. In summer, the precipitation on land will lead to an increase of the water level and terrestrial hydraulic gradients, causing more fresh water flow through permeable sediments and discharge into coastal waters (Chen et al., 2018; Wang and Du, 2016). Therefore, higher precipitation in summer might intensify the exchange between land and ocean aquifer, contributing to higher SGD in summer, especially the terrestrial fresh groundwater input. In October, precipitation had already begun to decrease. The process of water flowed through aquifers into the sea is likely to cause the variations of SGD to lag behind variations of precipitation. Therefore, SGD remained significant but smaller than in summer. March belongs to dry seasons, during which precipitation was limited. As a response, the total discharge rate was the smallest. To recap, SGD is highest in wet season and the lowest in dry season.
4.2
Correlation between SGD and hypoxia off the CJE
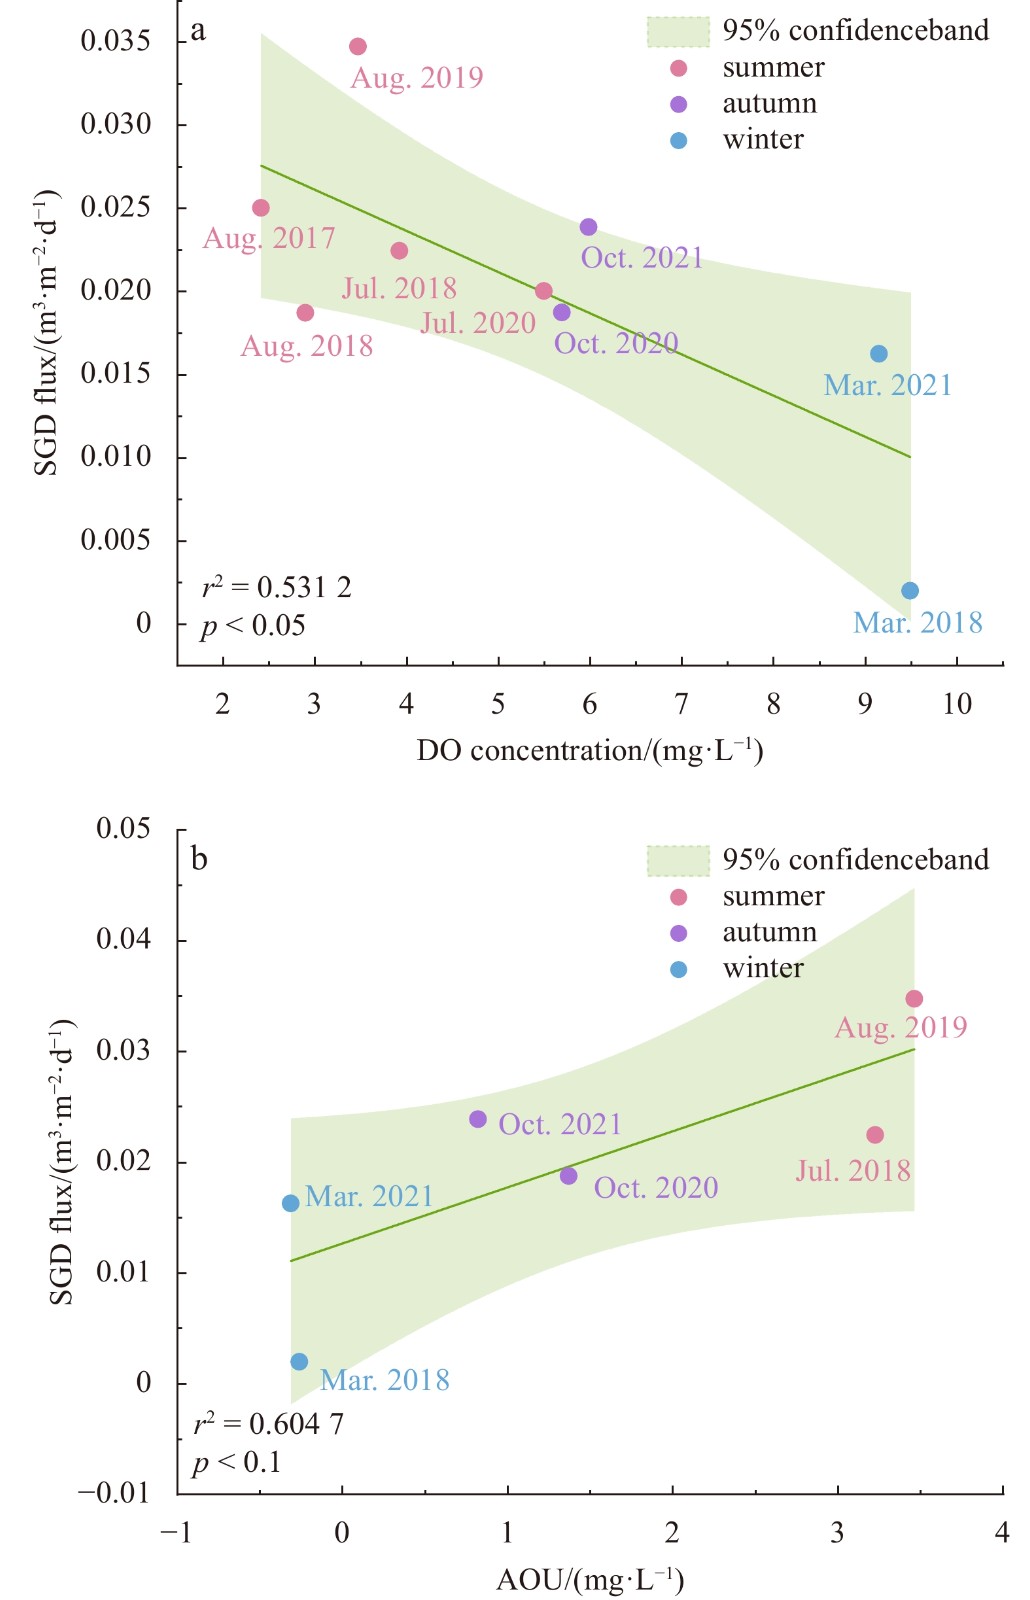
Our observed seasonal variations of DO were consistent with previous investigations (Li et al., 2011; Wang et al., 2012; Wei et al., 2015). Hypoxia off the CJE begins to develop in late spring and early summer. The hypoxic layer initially forms in the south-east of the CJE. It later spreads both south and north of the CJE and reaches its maximum severity in August, weakens in autumn and finally disappears in winter (Wang et al., 2012). The seasonal variation pattern of SGD fluxes is opposite of that of DO concentrations. A strong negative linear correlation between SGD and oxygen level was observed in the region of 31.00°−32.25°N, 122.50°−123.50°E, based on results from our five cruises and four previously reported cruises (Guo et al., 2020). Figure 3 showed the relationship between mean SGD and DO or apparent oxygen utilization (AOU, the difference between the saturation oxygen concentration and the observed oxygen concentration). The saturation oxygen concentration was calculated as Weiss (1970). With the increase of SGD fluxes, the oxygen level fell. When SGD fluxes were lowest in March, the dissolved oxygen in the bottom water was oversaturated (AOU < 0). Thus, SGD is an important contributor to hypoxia off the CJE.
Figure
3.
Correlations between submarine groundwater discharge (SGD) fluxes and oxygen level off the Changjiang River Estuary in different seasons. a. SGD flux vs. DO concentration; b. SGD flux vs. apparent oxygen utilization (AOU).
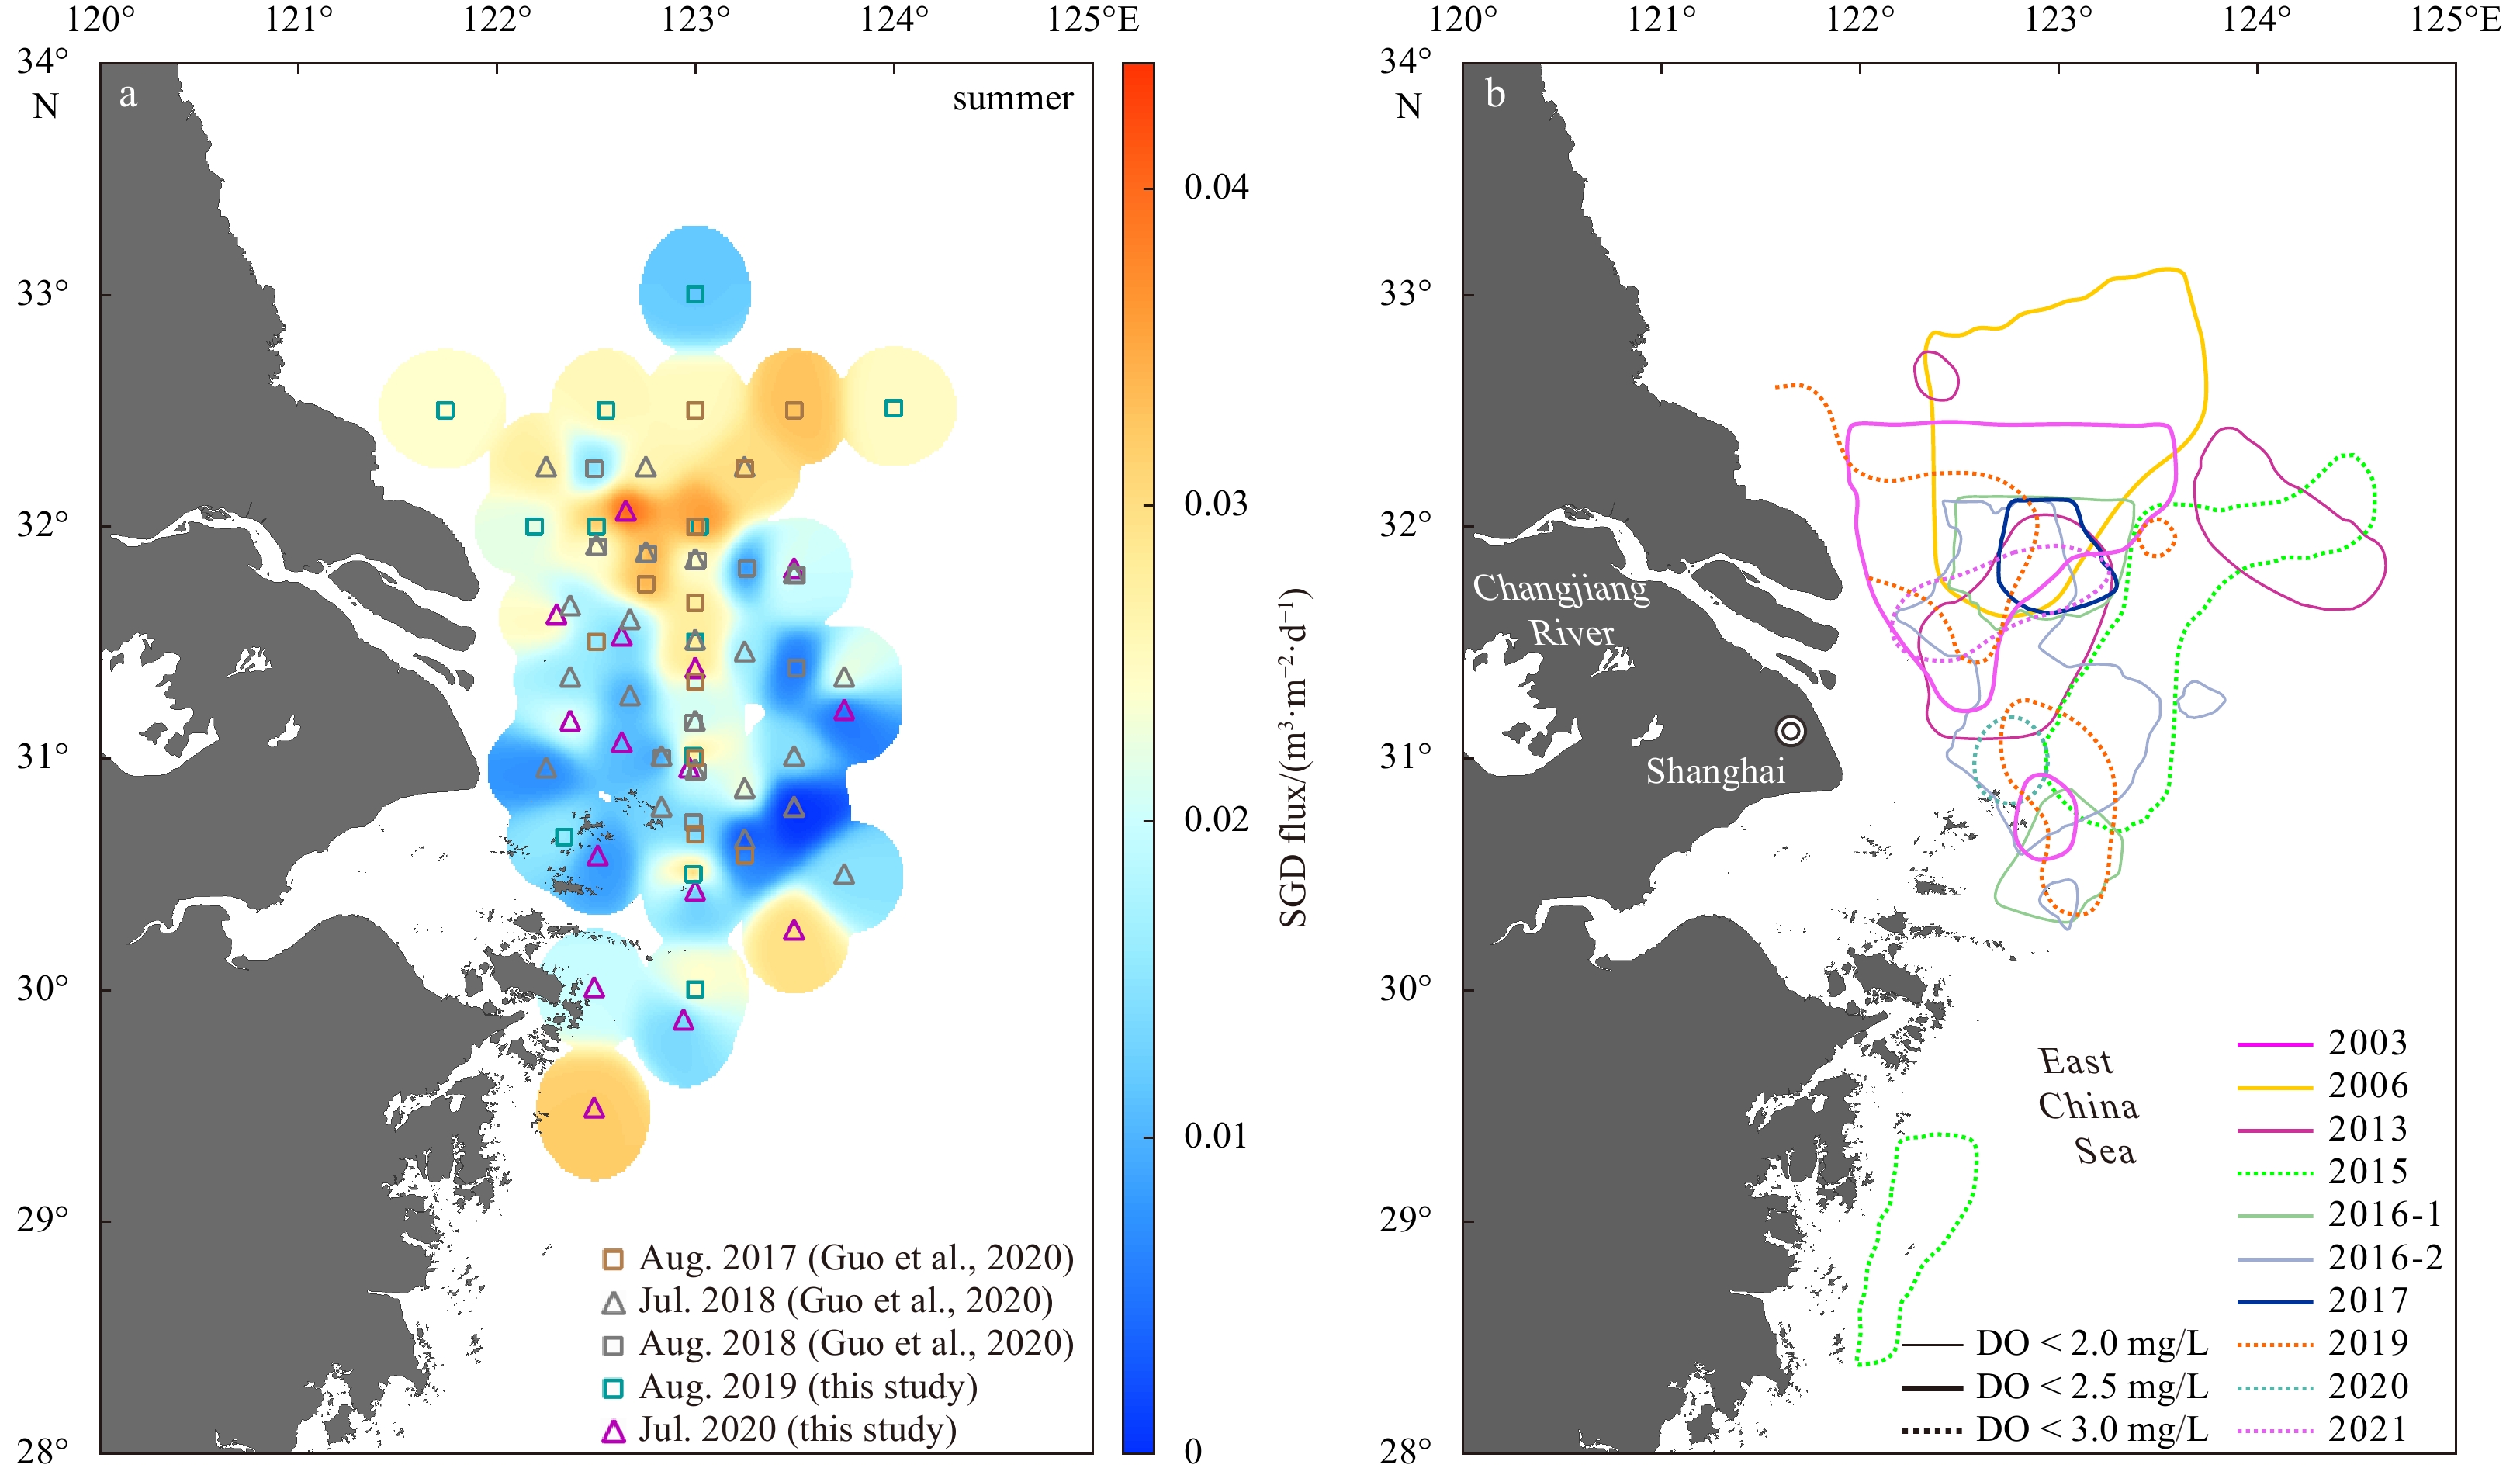
To give a direct reflection of the relationship between SGD and hypoxia in summer off the CJE, the distribution of SGD in summer and the distribution of hypoxia in past years were mapped as shown in Fig. 4. By comparing the two distribution patterns, one can see that the high SGD area in summer and the low oxygen hypoxic area were correspond to each other spatially. In general, summer hypoxic zones off the CJE mainly include two major parts: (1) hypoxic zone in the northeast of the CJE, which could extend to the northwest of the underwater valley, and (2) hypoxic zone along the Zhejiang coast in the south of the CJE (Wei et al., 2017). Figure 4 shows that there are two zones of high SGD fluxes off the CJE in summer. The high SGD zone in the northern part of our study area shaped like an inverted triangle is geographically similar to the hypoxic zone in the northeast of the CJE, with the southernmost tip located above the underwater valley (31°N, 123°E). High SGD fluxes may also exist in the south of 29.5 °N, which correspond to the southern hypoxic zone.
Assuming that the DO concentration in the groundwater endmember is 0, we evaluated the contribution of SGD to hypoxia in the bottom water through dilution using the method from Guo et al. (2020).
where $ {C}_{\mathrm{D}\mathrm{O}}^{\mathrm{\text{'}}} $ and $ {C}_{\mathrm{D}\mathrm{O}} $ represent the DO concentrations after and before dilution; $ D $ represents the bottom water column depth. Given that dilution is effective only under the pycnocline, $ D $ was taken as the average sub-pycnocline water thickness in summer, which is 26 m. $ {F}_{\mathrm{S}\mathrm{G}\mathrm{D}} $ in summer was estimated to be 0.034 m3/(m2·d). SGD could drop the DO in the bottom water by 12 mg/(m2·d). The water column mixed well vertically in autumn and winter, and the SGD flux was lower than that in summer. In that case, SGD could only drop the DO in the water column by 3 mg/(m2·d) and 6 mg/(m2·d) in winter and autumn, which is 25% and 50% of the DO decline rate in summer. Because of the well mixed water column in winter and autumn, the diluted DO would be immediately compensated by ventilation. In summer, however, the depth of vertical mixing of anoxic groundwater with ocean water is smaller than that in other seasons because of stratification. Therefore, higher SGD flux contributes more to the decrease of DO which can be preserved longer in summer. In March, bottom waters were enriched DO, with the concentrations of 6.5−10.1 mg/L. Bottom water DO levels had a seaward and southward decrease in the study area. DO concentrations decreased sharply to the underwater valley from its northwest. However, the 222Rn activities in the bottom waters of these regions in March were low, indicating the decreased DO phenomenon in this season was not mainly caused by SGD. In October, DO concentrations in the bottom water ranged from 2.1 mg/L to 8.6 mg/L, which is lower compared with summer. The hypoxic zone in the north kept shrinking and the hypoxic zone in the south retreated further south (Wang et al., 2012). Since the water column usually mixed well in October and March, oxygen-depleted water inputted by SGD could not cause severe hypoxia.
5.
Conclusions
We utilized a 222Rn mass balance model to estimate and compare the seasonal variation of SGD fluxes off the CJE among three seasons. The average SGD fluxes were estimated to be (0.012 ± 0.010) m3/(m2·d) in winter, (0.034 ± 0.015) m3/(m2·d) in summer, and (0.020 ± 0.010) m3/(m2·d) in autumn. Pooled DO and SGD fluxes were negatively correlated in our study region. In summer, groundwater with depleted DO fluxing into bottom waters would be prevented from mixing with surface waters because of density stratification. Thus, SGD contributed to the low DO concentrations of bottom water in the region off the CJE. The distribution patterns of SGD fluxes and hypoxic zones in the past years showed similar spatial distribution patterns, suggesting that SGD contributes to summer hypoxia off the CJE. In future investigations, we should further verify and refine the mechanisms by which SGD contributes to the formation of hypoxia.
Acknowledgements
We would like to thank Han Zhang, Haiming Nan, Shasha Song for their assistance during sample collection. Samples were collected onboard of R/V Runjiang1 and R/V Zheyuke implementing the open research cruises supported by Natural Science Foundation of China ship time sharing project.
Alorda-Kleinglass A, Garcia-Orellana J, Rodellas V, et al. 2019. Remobilization of dissolved metals from a coastal mine tailing deposit driven by groundwater discharge and porewater exchange. Science of the Total Environment, 688: 1359–1372. doi: 10.1016/j.scitotenv.2019.06.224
Burnett W C, Bokuniewicz H, Huettel M, et al. 2003. Groundwater and pore water inputs to the coastal zone. Biogeochemistry, 66(1–2): 3–33
Cable J E, Burnett W C, Chanton J P, et al. 1996. Estimating groundwater discharge into the northeastern Gulf of Mexico using radon-222. Earth and Planetary Science Letters, 144(3−4): 591–604. doi: 10.1016/S0012-821X(96)00173-2
Chanyotha S, Kranrod C, Burnett W C. 2014. Assessing diffusive fluxes and pore water radon activities via a single automated experiment. Journal of Radioanalytical and Nuclear Chemistry, 301(2): 581–588. doi: 10.1007/s10967-014-3157-3
Charette M A, Moore W S, Burnett W C. 2008. Uranium- and thorium-series nuclides as tracers of submarine groundwater discharge. Radioactivity in the Environment, 13: 155–191
Chen Xiaogang. 2019. Submarine groundwater discharge in mangroves, salt marshes, sandy beaches and karst ecosystems of typical coastal zones (in Chinese)[dissertation]. Shanghai: East China Normal University
Chen Xiaogang, Du Jinzhou, Yu Xueqing, et al. 2021. Porewater-derived dissolved inorganic carbon and nutrient fluxes in a saltmarsh of the Changjiang River Estuary. Acta Oceanologica Sinica, 40(8): 32–43. doi: 10.1007/s13131-021-1797-z
Chen Chung-Chi, Gong Gwo-Ching, Shiah Fuh-Kwo. 2007. Hypoxia in the East China Sea: one of the largest coastal low-oxygen areas in the world. Marine Environmental Research, 64(4): 399–408. doi: 10.1016/j.marenvres.2007.01.007
Chen Xiaogang, Lao Yanling, Wang Jinlong, et al. 2018. Submarine groundwater-borne nutrients in a tropical bay (Maowei Sea, China) and their impacts on the oyster aquaculture. Geochemistry, Geophysics, Geosystems, 19(3): 932–951
Chi Lianbao, Song Xiuxian, Yuan Yongquan, et al. 2017. Distribution and key influential factors of dissolved oxygen off the Changjiang River Estuary (CRE) and its adjacent waters in China. Marine Pollution Bulletin, 125(1−2): 440–450. doi: 10.1016/j.marpolbul.2017.09.063
Cho H M, Kim G, Kwon E Y, et al. 2018. Radium tracing nutrient inputs through submarine groundwater discharge in the global ocean. Scientific Reports, 8(1): 2439. doi: 10.1038/s41598-018-20806-2
Conley D J, Carstensen J, Vaquer-Sunyer R, et al. 2009. Ecosystem thresholds with hypoxia. In: Andersen J H, Conley D J, eds. Eutrophication in Coastal Ecosystems. Dordrecht: Springer, 21–29
Corbett D R, Chanton J, Burnett W, et al. 1999. Patterns of groundwater discharge into Florida Bay. Limnology and Oceanography, 44(4): 1045–1055. doi: 10.4319/lo.1999.44.4.1045
Diaz R J, Rosenberg R. 1995. Marine benthic hypoxia: a review of its ecological effects and the behavioural responses of benthic macrofauna. Oceanography and Marine Biology, 33: 245–303
Dulaiova H, Burnett W C, Chanton J P, et al. 2006. Assessment of groundwater discharges into West Neck Bay, New York, via natural tracers. Continental Shelf Research, 26(16): 1971–1983. doi: 10.1016/j.csr.2006.07.011
Emeis K C, Brüchert V, Currie B, et al. 2004. Shallow gas in shelf sediments of the Namibian coastal upwelling ecosystem. Continental Shelf Research, 24(6): 627–642. doi: 10.1016/j.csr.2004.01.007
Fennel K, Testa J M. 2019. Biogeochemical controls on coastal hypoxia. Annual Review of Marine Science, 11: 105–130. doi: 10.1146/annurev-marine-010318-095138
Gu Hongkan. 1980. The maximum value of dissolved oxygen in its vertical distribution in Yellow Sea. Haiyang Xuebao (in Chinese), 2(2): 70–80
Gu Hequan, Moore W S, Zhang Lei, et al. 2012. Using radium isotopes to estimate the residence time and the contribution of submarine groundwater discharge (SGD) in the Changjiang effluent plume, East China Sea. Continental Shelf Research, 35: 95–107. doi: 10.1016/j.csr.2012.01.002
Guo Xiaoyi, Xu Bochao, Burnett W C, et al. 2020. Does submarine groundwater discharge contribute to summer hypoxia in the Changjiang (Yangtze) River Estuary?. Science of the Total Environment, 719: 137450. doi: 10.1016/j.scitotenv.2020.137450
Ji Zhongqiang, Hu Dan, Weng Huanxin, et al. 2012. Temporal and spatial variations of 226Ra in coastal sea and the estimation of submarine groundwater discharge (SGD). Geochimica (in Chinese), 41(1): 15–22
Justić D, Rabalais N N, Turner R E. 2002. Modeling the impacts of decadal changes in riverine nutrient fluxes on coastal eutrophication near the Mississippi River Delta. Ecological Modelling, 152(1): 33–46. doi: 10.1016/S0304-3800(01)00472-0
Kim J, Kim J S, Kim G. 2010. Nutrient input from submarine groundwater discharge versus intermittent river-water discharge through an artificial dam in the Yeongsan River Estuary, Korea. Ocean Science Journal, 45(3): 179–186. doi: 10.1007/s12601-010-0016-1
Kim G, Ryu J W, Yang H S, et al. 2005. Submarine groundwater discharge (SGD) into the Yellow Sea revealed by 228Ra and 226Ra isotopes: implications for global silicate fluxes. Earth and Planetary Science Letters, 237(1−2): 156–166. doi: 10.1016/j.jpgl.2005.06.011
Knee K L, Paytan A. 2011. Submarine groundwater discharge: a source of nutrients, metals, and pollutants to the coastal ocean. Treatise on Estuarine and Coastal Science, 4: 205–233
Lambert M J, Burnett W C. 2003. Submarine groundwater discharge estimates at a Florida coastal site based on continuous radon measurements. Biogeochemistry, 66(1/2): 55–73. doi: 10.1023/B:BIOG.0000006057.63478.fa
Lee Y W, Hwang D W, Kim G, et al. 2009. Nutrient inputs from submarine groundwater discharge (SGD) in Masan Bay, an embayment surrounded by heavily industrialized cities, Korea. Science of the Total Environment, 407(9): 3181–3188. doi: 10.1016/j.scitotenv.2008.04.013
Lee J, Kim G. 2015. Dependence of coastal water pH increases on submarine groundwater discharge off a volcanic island. Estuarine, Coastal and Shelf Science, 163: 15–21
Li Xiangan, Yu Zhiming, Song Xiuxian, et al. 2011. The seasonal characteristics of dissolved oxygen distribution and hypoxia in the Changjiang Estuary. Journal of Coastal Research, 27(6A): 52–62
Li Daoji, Zhang Jing, Huang Daji, et al. 2002. Oxygen depletion off the Changjiang (Yangtze River) Estuary. Science in China Series D:Earth Sciences, 45(12): 1137–1146. doi: 10.1360/02yd9110
Liu Jianan, Du Jinzhou, Wu Ying, et al. 2018. Nutrient input through submarine groundwater discharge in two major Chinese estuaries: the Pearl River Estuary and the Changjiang River Estuary. Estuarine, Coastal and Shelf Science, 203: 17–28
MacIntyre S, Wanninkhof R H, Chanton J P. 1995. Trace gas exchange across the air-water interface in freshwater and coastal marine environments. In: Matson P A, Harris R C, eds. Methods in Ecology-Biogenic Trace Gases: Measuring Emissions from Soil and Water. New York: Blackwell Science Ltd. , 52–97
Montagna P A, Froeschke J. 2009. Long-term biological effects of coastal hypoxia in Corpus Christi Bay, Texas, USA. Journal of Experimental Marine Biology and Ecology, 381: S21–S30. doi: 10.1016/j.jembe.2009.07.006
Moore W S. 2010. The effect of submarine groundwater discharge on the ocean. Annual Review of Marine Science, 2: 59–88. doi: 10.1146/annurev-marine-120308-081019
Moore W S, Arnold R. 1996. Measurement of 223Ra and 224Ra in coastal waters using a delayed coincidence counter. Journal of Geophysical Research: Oceans, 101(C1): 1321–1329. doi: 10.1029/95JC03139
Moore W S, Vincent J, Pickney J L, et al. 2022. Predicted episode of submarine groundwater discharge onto the South Carolina, USA, continental shelf and its effect on dissolved oxygen. Geophysical Research Letters, 49(24): e2022GL100438. doi: 10.1029/2022GL100438
Peng Tong, Zhu Zhuoyi, Du Jinzhou, et al. 2021. Effects of nutrient-rich submarine groundwater discharge on marine aquaculture: a case in Lianjiang, East China Sea. Science of the Total Environment, 786: 147388. doi: 10.1016/j.scitotenv.2021.147388
Peterson R N, Burnett W C, Taniguchi M, et al. 2008. Radon and radium isotope assessment of submarine groundwater discharge in the Yellow River delta, China. Journal of Geophysical Research: Oceans, 113(C9): C09021
Peterson R N, Moore W S, Chappel S L, et al. 2016. A new perspective on coastal hypoxia: the role of saline groundwater. Marine Chemistry, 179: 1–11. doi: 10.1016/j.marchem.2015.12.005
Pilson M E Q. 1998. An Introduction to the Chemistry of the Sea. 2nd ed. Cambridge: Cambridge University Press
Sadat-Noori M, Santos I R, Tait D R, et al. 2016. Intermittently Closed and Open Lakes and/or Lagoons (ICOLLs) as groundwater-dominated coastal systems: evidence from seasonal radon observations. Journal of Hydrology, 535: 612–624. doi: 10.1016/j.jhydrol.2016.01.080
Sanial V, Moore W S, Shiller A M. 2021. Does a bottom-up mechanism promote hypoxia in the Mississippi Bight?. Marine Chemistry, 235: 104007. doi: 10.1016/j.marchem.2021.104007
Santos I R, Burnett W C, Chanton J, et al. 2009. Land or ocean?: assessing the driving forces of submarine groundwater discharge at a coastal site in the Gulf of Mexico. Journal of Geophysical Research: Oceans, 114(C4): C04012
Schink D R, Guinasso N L, Charnell R L, et al. 1970. Radon profiles in the sea: a measure of air-sea exchange. IEEE Transactions on Nuclear Science, 17(1): 184–193. doi: 10.1109/TNS.1970.4325579
Smith C G, Swarzenski P W. 2012. An investigation of submarine groundwater—borne nutrient fluxes to the west Florida shelf and recurrent harmful algal blooms. Limnology and Oceanography, 57(2): 471–485. doi: 10.4319/lo.2012.57.2.0471
Tan Ehui, Wang Guizhi, Moore W S, et al. 2018. Shelf-scale submarine groundwater discharge in the northern South China Sea and East China Sea and its geochemical impacts. Journal of Geophysical Research: Oceans, 123(4): 2997–3013. doi: 10.1029/2017JC013405
Taniguchi M, Dulai H, Burnett K M, et al. 2019. Submarine groundwater discharge: updates on its measurement techniques, geophysical drivers, magnitudes, and effects. Frontiers in Environmental Science, 7: 141. doi: 10.3389/fenvs.2019.00141
Wang Xilong, Baskaran M, Su Kaijun, et al. 2018. The important role of submarine groundwater discharge (SGD) to derive nutrient fluxes into river dominated ocean margins—the East China Sea. Marine Chemistry, 204: 121–132. doi: 10.1016/j.marchem.2018.05.010
Wang Xilong, Du Jinzhou. 2016. Submarine groundwater discharge into typical tropical lagoons: a case study in eastern Hainan Island, China. Geochemistry, Geophysics, Geosystems, 17(11): 4366–4382
Wang Baodong, Wei Qinsheng, Chen Jianfang, et al. 2012. Annual cycle of hypoxia off the Changjiang (Yangtze River) Estuary. Marine Environmental Research, 77: 1–5. doi: 10.1016/j.marenvres.2011.12.007
Waska H, Kim S, Kim G, et al. 2008. An efficient and simple method for measuring 226Ra using the scintillation cell in a delayed coincidence counting system (RaDeCC). Journal of Environmental Radioactivity, 99(12): 1859–1862. doi: 10.1016/j.jenvrad.2008.08.008
Wei Hao, He Yunchang, Li Qingji, et al., 2007. Summer hypoxia adjacent to the Changjiang Estuary. Journal of Marine Systems, 67(3–4): 292–303
Wei Qinsheng, Wang Baodong, Chen Jianfang, et al. 2015. Recognition on the forming-vanishing process and underlying mechanisms of the hypoxia off the Yangtze River Estuary. Science China:Earth Sciences, 58(4): 628–648. doi: 10.1007/s11430-014-5007-0
Wei Qinsheng, Wang Baodong, Yu Zhigang, et al. 2017. Mechanisms leading to the frequent occurrences of hypoxia and a preliminary analysis of the associated acidification off the Changjiang Estuary in summer. Science China: Earth Sciences, 60(2): 360–381. doi: 10.1007/s11430-015-5542-8
Wei Qinsheng, Yu Zhigang, Xia Changshui, et al. 2011. A preliminary analysis on the dynamic characteristics of the hypoxic zone adjacent to the Changjiang Estuary in summer. Haiyang Xuebao (in Chinese), 33(6): 100–109
Weiss R F. 1970. The solubility of nitrogen, oxygen and argon in water and seawater. Deep-Sea Research and Oceanographic Abstracts, 17(4): 721–735. doi: 10.1016/0011-7471(70)90037-9
Wen Tingyu, Du Jinzhou, Ji Tao, et al. 2014. Use of 222Rn to trace submarine groundwater discharge in a tidal period along the coast of Xiangshan, Zhejiang, China. Journal of Radioanalytical and Nuclear Chemistry, 299(1): 53–60. doi: 10.1007/s10967-013-2786-2
Wu Zijun, Zhou Huaiyang, Zhang Shuai, et al. 2013. Using 222Rn to estimate submarine groundwater discharge (SGD) and the associated nutrient fluxes into Xiangshan Bay, East China Sea. Marine Pollution Bulletin, 73(1): 183–191. doi: 10.1016/j.marpolbul.2013.05.024
Wu Hui, Zhu Jianrong, Shen Jian, et al. 2011. Tidal modulation on the Changjiang River plume in summer. Journal of Geophysical Research: Oceans, 116(C8): C08017
Zhang Wenxia, Wu Hui, Hetland Robert D, et al. 2019. On mechanisms controlling the seasonal hypoxia hot spots off the Changjiang River Estuary. Journal of Geophysical Research: Oceans, 124(12): 8683−8700
Zhou Feng, Huang Daji, Ni Xiaobo, et al. 2010. Hydrographic analysis on the multi-time scale variability of hypoxia adjacent to the Changjiang River Estuary. Acta Ecologica Sinica (in Chinese), 30(17): 4728−4740
Zhu Zhuoyi, Wu Hui, Liu Sumei, et al. 2017. Hypoxia off the Changjiang (Yangtze River) estuary and in the adjacent East China Sea: Quantitative approaches to estimating the tidal impact and nutrient regeneration. Marine pollution bulletin, 125(1−2): 103−114
Zhu Zhuoyi, Zhang Jing, Wu Ying, et al. 2011. Hypoxia off the Changjiang (Yangtze River) Estuary: oxygen depletion and organic matter decomposition. Marine Chemistry, 125(1−4): 108–116. doi: 10.1016/j.marchem.2011.03.005
Zou Emei, Xiong Xuejun, Guo Binghuo, et al. 2001. Characteristics and seasonal variations of the thermocline and halocline in the Huanghai Sea and the East China Sea. Journal of Oceanography of Huanghai & Bohai Seas (in Chinese), 19(3): 8–18
Hyekyung Park, Guebuem Kim, Nahyeon Kwon, et al. Large seasonal variations in distributions, sources, and fluxes of dissolved amino acids in the continental shelf water. Progress in Oceanography, 2025, 231: 103405. doi:10.1016/j.pocean.2024.103405
2.
Xin Lin, Xiao Chen, Fajin Chen, et al. Seasonal dynamics of submarine groundwater discharge in Zhanjiang Bay: an investigative study utilizing 222Rn as a tracer. Frontiers in Marine Science, 2024, 11 doi:10.3389/fmars.2024.1451533
3.
Zhe Zhang, Lixin Yi. Processes controlling seawater acidification in offshore aquaculture system of China. Regional Studies in Marine Science, 2024, 75: 103582. doi:10.1016/j.rsma.2024.103582
4.
Xiaoyi Guo, Ergang Lian, Huamao Yuan, et al. Proxies of hypoxia and submarine groundwater discharge in the coastal ocean: Foraminiferal shell chemical perspectives. Marine Chemistry, 2024, 265-266: 104434. doi:10.1016/j.marchem.2024.104434
5.
Shiping Lei, Dezhi Bu, Xianghui Guo, et al. Mitigation of hypoxia and ocean acidification on the inner East China Sea shelf impacted by the 2023 summer drought. Marine Pollution Bulletin, 2024, 207: 116830. doi:10.1016/j.marpolbul.2024.116830
Figure 1. Sampling stations and main water masses in the sea adjacent to the Changjiang River Estuary. Historical data were previously reported in Guo et al. (2020). The solid arrows represent paths of different water masses: Changjiang River Diluted Water (CDW), Yellow Sea Coastal Current (YSCC), Taiwan Warm Current (TWC), nearshore Kuroshio Branch Current (NKBC).
Figure 2. The distribution of 222Rn activity concentration (Bq/m3) in different seasons off the Changjiang River Estuary. a−c. 222Rn in surface waters; d−f. 222Rn in bottom water.
Figure 3. Correlations between submarine groundwater discharge (SGD) fluxes and oxygen level off the Changjiang River Estuary in different seasons. a. SGD flux vs. DO concentration; b. SGD flux vs. apparent oxygen utilization (AOU).


 DownLoad:


 DownLoad: