CAS Key Laboratory of Coastal Environmental Processes and Ecological Remediation, Yantai Institute of Coastal Zone Research, Chinese Academy of Sciences, Yantai 264003, China
2.
Shandong Key Laboratory of Coastal Environmental Processes, Yantai 264003, China
3.
University of Chinese Academy of Sciences, Beijing 100049, China
Funds:
The Chinese Academy of Sciences (CAS) Key Deployment Project of Centre for Ocean Mega-Research of Science under contract No. COMS2020Q07; the Open Fund Project of Key Laboratory of Marine Environmental Information Technology, Ministry of Natural Resources; the National Natural Science Foundation of China under contract No. 41901133.
Arctic sea ice is broadly regarded as an indicator and amplifier of global climate change. The rapid changes in Arctic sea ice have been widely concerned. However, the spatiotemporal changes in the horizontal and vertical dimensions of Arctic sea ice and its asymmetry during the melt and freeze seasons are rarely quantified simultaneously based on multiple sources of the same long time series. In this study, the spatiotemporal variation and freeze-thaw asymmetry of Arctic sea ice were investigated from both the horizontal and vertical dimensions during 1979–2020 based on remote sensing and assimilation data. The results indicated that Arctic sea ice was declining at a remarkably high rate of –5.4 × 10⁴ km2/a in sea ice area (SIA) and –2.2 cm/a in sea ice thickness (SIT) during 1979 to 2020, and the reduction of SIA and SIT was the largest in summer and the smallest in winter. Spatially, compared with other sub-regions, SIA showed a sharper declining trend in the Barents Sea, Kara Sea, and East Siberian Sea, while SIT presented a larger downward trend in the northern Canadian Archipelago, northern Greenland, and the East Siberian Sea. Regarding to the seasonal trend of sea ice on sub-region scale, the reduction rate of SIA exhibited an apparent spatial heterogeneity among seasons, especially in summer and winter, i.e., the sub-regions linked to the open ocean exhibited a higher decline rate in winter; however, the other sub-regions blocked by the coastlines presented a greater decline rate in summer. For SIT, the sub-regions such as the Beaufort Sea, East Siberian Sea, Chukchi Sea, Central Arctic, and Canadian Archipelago always showed a higher downward rate in all seasons. Furthermore, a striking freeze-thaw asymmetry of Arctic sea ice was also detected. Comparing sea ice changes in different dimensions, sea ice over most regions in the Arctic showed an early retreat and rapid advance in the horizontal dimension but late melting and gradual freezing in the vertical dimension. The amount of sea ice melting and freezing was disequilibrium in the Arctic during the considered period, and the rate of sea ice melting was 0.3 × 10⁴ km2/a and 0.01 cm/a higher than that of freezing in the horizontal and vertical dimensions, respectively. Moreover, there were notable shifts in the melting and freezing of Arctic sea ice in 1997/2003 and 2000/2004, respectively, in the horizontal/vertical dimension.
As an important cold source of the earth, the Arctic profoundly impacts the global climate and ecosystems (Chen et al., 2019). Over the past few decades, the Arctic has become the region with the most dramatic temperature changes on the planet (Wu et al., 2021; You et al., 2021). Especially in the first two decades of the 21st century, the Arctic is warming at more than four times the global warming rate, known as “Arctic amplification” (Chylek et al., 2022). Arctic sea ice, an essential component of a polar system, regulates heat and momentum between the atmosphere and the polar ocean (Stroeve and Notz, 2018; Zhang et al., 2022). Previous studies have demonstrated that Arctic sea ice is the key driving factor for Arctic amplification (Chen and Zhao, 2017; Kumar et al., 2021). The accelerated melting of Arctic sea ice reduces the surface albedo, leading to greater absorption of solar radiation by the sea surface. This positive feedback process amplifies the Arctic air temperature (Feng et al., 2022; Kumar et al., 2020), and Arctic sea ice is therefore recognized not only as an indicator but also as an amplifier of global climate change (Cai et al., 2021).
The particularity of the geographical location of the Arctic has always posed great challenges to Arctic sea ice research based on field measurements (Li et al., 2020). However, the remote sensing satellites that provide long-term and consistent records of sea ice (since 1979) facilitate the monitoring of polar sea ice changes from a large-scale perspective (Dong et al., 2023; Parkinson et al., 1999; Tilling et al., 2018; Wang et al., 2020; Xiao et al., 2021). In the early stage, several studies were conducted to explore the spatiotemporal variation of Arctic sea ice based on multi-channel passive microwave sensors (Scanning Multichannel Microwave Radiometer (SMMR), Special Sensor Microwave Imager (SSM/I), Special Sensor Microwave Imager/Sounder (SSMIS)). Sea ice parameters, such as sea ice area (SIA) and sea ice extent (SIE), both of which characterize the horizontal dimension of sea ice, have received significant attention (Perovich and Richter-Menge, 2009). For example, based on SMMR, SSM/I, and SSMIS data, Parkinson et al. (1999) observed that the SIA and SIE declined at the rates of –2.93 × 10⁴ km2/a and –2.43 × 10⁴ km2/a during 1979 to 1996, respectively. Next, Cavalieri and Parkinson (2012) revealed the SIA/SIE showed a sharper downward trend, with rates of –4.96 × 10⁴ km2/a and –5.15 × 10⁴ km2/a during 1979 to 2010, respectively. Subsequently, Onarheim et al. (2018) focused on seasonal changes in Arctic sea ice, indicating that summer sea ice variability dominates in the perennial ice-covered Beaufort, Chukchi, East Siberian, Laptev, and Kara Seas. Recently, Parkinson and DiGirolamo (2021) demonstrated the Arctic’s lowest September monthly average sea ice extent (in 2012) was 53% lower than its highest September monthly average sea ice extent (in 1980) based on 42-year satellite dataset. With the rapid development of remote sensing technology, the availability of synthetic aperture radar has allowed the refined study of Arctic sea ice (Dammann et al., 2018; Johansson et al., 2017; Wang et al., 2021). However, the finite time series of such satellite products makes it difficult to reveal the sea ice variation on a long-time scale.
Furthermore, sea ice thickness (SIT), which depicts the sea ice changes in the vertical dimension, is another crucial parameter (Chen et al., 2020; Perovich and Richter-Menge, 2009; Shamshiri et al., 2022). Generally, in situ measurements of SIT are spotty in time and space, and the series of satellite-based retrievals of SIT are commonly short. Consequently, long-term changes in SIT have not received as much attention as SIA/SIE (Lang et al., 2017; Schweiger et al., 2011). Currently, the CryoSat-2 satellite (launched by European Space Agency (ESA) in 2010) with high spatial resolution and wide coverage is extensively used for detecting polar sea ice thickness. For example, Kwok and Cunningham (2015) analyzed seasonal variations of SIT in the Arctic, revealing that the monthly mean ice thickness ranged from 1.27 m in October to 2.32 m in May during 2010 to 2014. Xiao et al. (2021) observed that the growth rate of Arctic SIT showed a decreasing trend in each sea ice growth season during 2010 to 2019, and the declining trend was particularly prominent in 2012 and 2013. Moreover, some researchers focused on improving the accuracy of CryoSat-2 thickness data by developing novel retrieval algorithms or merging multi-source data (Ricker et al., 2017; Shi et al., 2023). However, the CryoSat-2 product can only reveal the changes in SIT over the last decade and is insufficient to study long-term trends in SIT over historical periods. Another effective approach to estimate the long-term changes in SIT is to use a coupled ice-ocean model. Some researchers have demonstrated that the Pan-Arctic Ice-Ocean Modeling and Assimilation System (PIOMAS) can realistically reproduce the spatial distribution of SIT. For example, Schweiger et al. (2011) documented that the PIOMAS spatial thickness patterns agreed well with ICESat thickness estimates, with a pattern correlation above 0.8. Also, Labe et al. (2018) revealed the average difference in thickness between PIOMAS and various observational products such as submarine, Ice, Cloud,and land Elevation Satellite (ICESat), and CryoSat-2 was all less than 0.4 m. Particularly, Landy et al. (2022) generated the first record of SIT from CryoSat-2 during the Arctic melt period, and demonstrated that the PIOMAS product could generally replicate the seasonal cycle and magnitude of CryoSat-2 SIT. By applying the PIOMAS ice thickness data, Stroeve and Notz (2018) demonstrated that the mean April sea ice thickness in the Arctic declined by −28 cm/decade since 1979, and Xiao et al. (2021) revealed that the Arctic annual ice thickness decreased by −2.0 cm/a during 1979 to 2019.
Although previous studies have improved the understanding of Arctic sea ice changes at various spatial and temporal scales (Årthun et al., 2019; Chen and Zhao, 2017; Dawson et al., 2022; Dörr et al., 2021; Stroeve and Notz, 2018), the variation of Arctic sea ice in both the horizontal (SIA) and vertical (SIT) dimensions over the same long time series is rarely quantified simultaneously to our knowledge. Specifically, the regional differences of Arctic sea ice variability, the asymmetric characteristics of sea ice during the freeze and melt season, as well as the disequilibrium between the amount of sea ice melting and freezing in multiple dimensions since 1979 are all still unknown. Therefore, the objectives of this study are as follows: (1) to reveal the spatiotemporal variation of Arctic sea ice in the horizontal and vertical dimensions during 1979 to 2020, and (2) to identify the freeze-thaw asymmetry of sea ice in the freeze and melt seasons on the Arctic and its sub-regional scale. Results in this study are anticipated to provide insights for long-term spatiotemporal changes and freeze-thaw asymmetry of Arctic sea ice from a multi-dimensional perspective as well as to supply references for implementing climate actions such as climate mitigation and adaptation in response to global warming.
2.
Materials and methods
2.1
Study area
The Arctic comprises the Arctic Ocean, adjacent seas, and surrounding land (Wang et al., 2019). The Arctic is rich in resources because of its unique natural environment, including minerals, organisms, and sea ice. As the only “white ocean” on earth, most of the Arctic is covered by sea ice all year round. However, sea ice in different regions of the Arctic is subject to different conditions in ocean currents, atmospheric circulation, and even coastlines. Therefore, to highlight the regional differences of Arctic sea ice changes, the Arctic was classified into 12 sub-regions in this study based on the geographic location of seas, including the Beaufort Sea, Chukchi Sea, East Siberian Sea, Laptev Sea, Kara Sea, Barents Sea, Greenland Sea, Baffin Bay & Gulf of St. Lawrence Sea, Canadian Archipelago, Hudson Bay, Central Arctic, and Bering Sea & Sea of Okhotsk (Fig. 1).
Figure
1.
Location map of sub-regions in the Arctic. 1. Beaufort Sea, 2. Chukchi Sea, 3. East Siberian Sea, 4. Laptev Sea, 5. Kara Sea, 6. Barents Sea, 7. Greenland Sea, 8. Baffin Bay & Gulf of St. Lawrence Sea, 9. Canadian Archipelago, 10. Hudson Bay, 11. Central Arctic, and 12. Bering Sea & Sea of Okhotsk.
The SIC data during 1979 to 2020 is provided by the National Snow and Ice Data Center (https://nsidc.org/data, accessed on 22 March 2021), with the spatial resolution of 25 km × 25 km. The acquisition of data sets relies on multiple microwave radiometers, such as the SMMR onboard the Nimbus-7 satellite, the SSM/I and SSMIS carried on the U.S. Defense Meteorological Program satellites (Cavalieri and Parkinson, 2012). The SIC data used in this study were produced by the National Aeronautics and Space Administration (NASA) Team algorithm, which converted the brightness temperatures to the gridded ice concentration estimates. Considering that the satellite-borne instruments collecting the brightness temperature data to create the SIC do not image a circular area over the North Pole due to the orbit inclination, it is assumed that the regions near the North Pole without SIC data are covered by ice with a concentration of 100% (Parkinson and Cavalieri, 2008; Parkinson et al., 1999). The SIA is defined as the cumulative area of ice coverage, calculated as the sum of the pixel area (ice concentration ≥ 15%) multiplied by its ice concentration (Cavalieri and Parkinson, 2012).
2.2.2
Sea ice thickness
The PIOMAS ice thickness data during 1979 to 2020 is obtained from the University of Washington Polar Science Center (http://psc.apl.uw.edu, accessed on 20 September 2021). PIOMAS is a coupled ice-ocean model assimilation system (Zhang and Rothrock, 2003), simulating ice thickness variations by modeling the thermodynamic and dynamic processes that influence sea ice variations (Schweiger et al., 2011; Zhang et al., 2010). The system constrains the model solution to improve simulation accuracy by assimilating observational data, such as SIC and sea surface temperature (Laxon et al., 2013; Schweiger et al., 2011). The PIOMAS monthly thickness data covering the area from 45°–90°N with a grid size of 360 × 120 was selected in this study.
2.3
Methods
Mann-Kendall trend test with Sen’s slope estimator was applied to detect the spatiotemporal variation of SIA and SIT in the Arctic during 1979 to 2020 in this study, and a trend was considered to be statistically significant at the 95% confidence level (Kendall, 1975). Moreover, the Mann-Kendall mutation test (Wei, 2007) was used to identify the mutation time of the changes in sea ice melting and freezing amounts during 1980 to 2020. As a non-parametric test method, Mann-Kendall test neither requires samples to follow a specific distribution nor is affected by a few outliers (Gocic and Trajkovic, 2013; Hamed and Rao, 1998), and is extensively applied for trend detection and mutation identification of hydrological, meteorological, and other long time series data (Geng et al., 2021; Wang et al., 2017, 2020).
Regarding the definition of season, January–March, April–June, July–September, and October–December, are regarded as traditional winter, spring, summer, and autumn in the Arctic, respectively (Stroeve and Notz, 2018). To further quantify the freeze-thaw asymmetry and disequilibrium of Arctic sea ice, we defined the melt season as the month between the sea ice maximum and a minimum of the current year, and the freeze season as the month between the sea ice minimum (the previous year) and maximum (the current year).
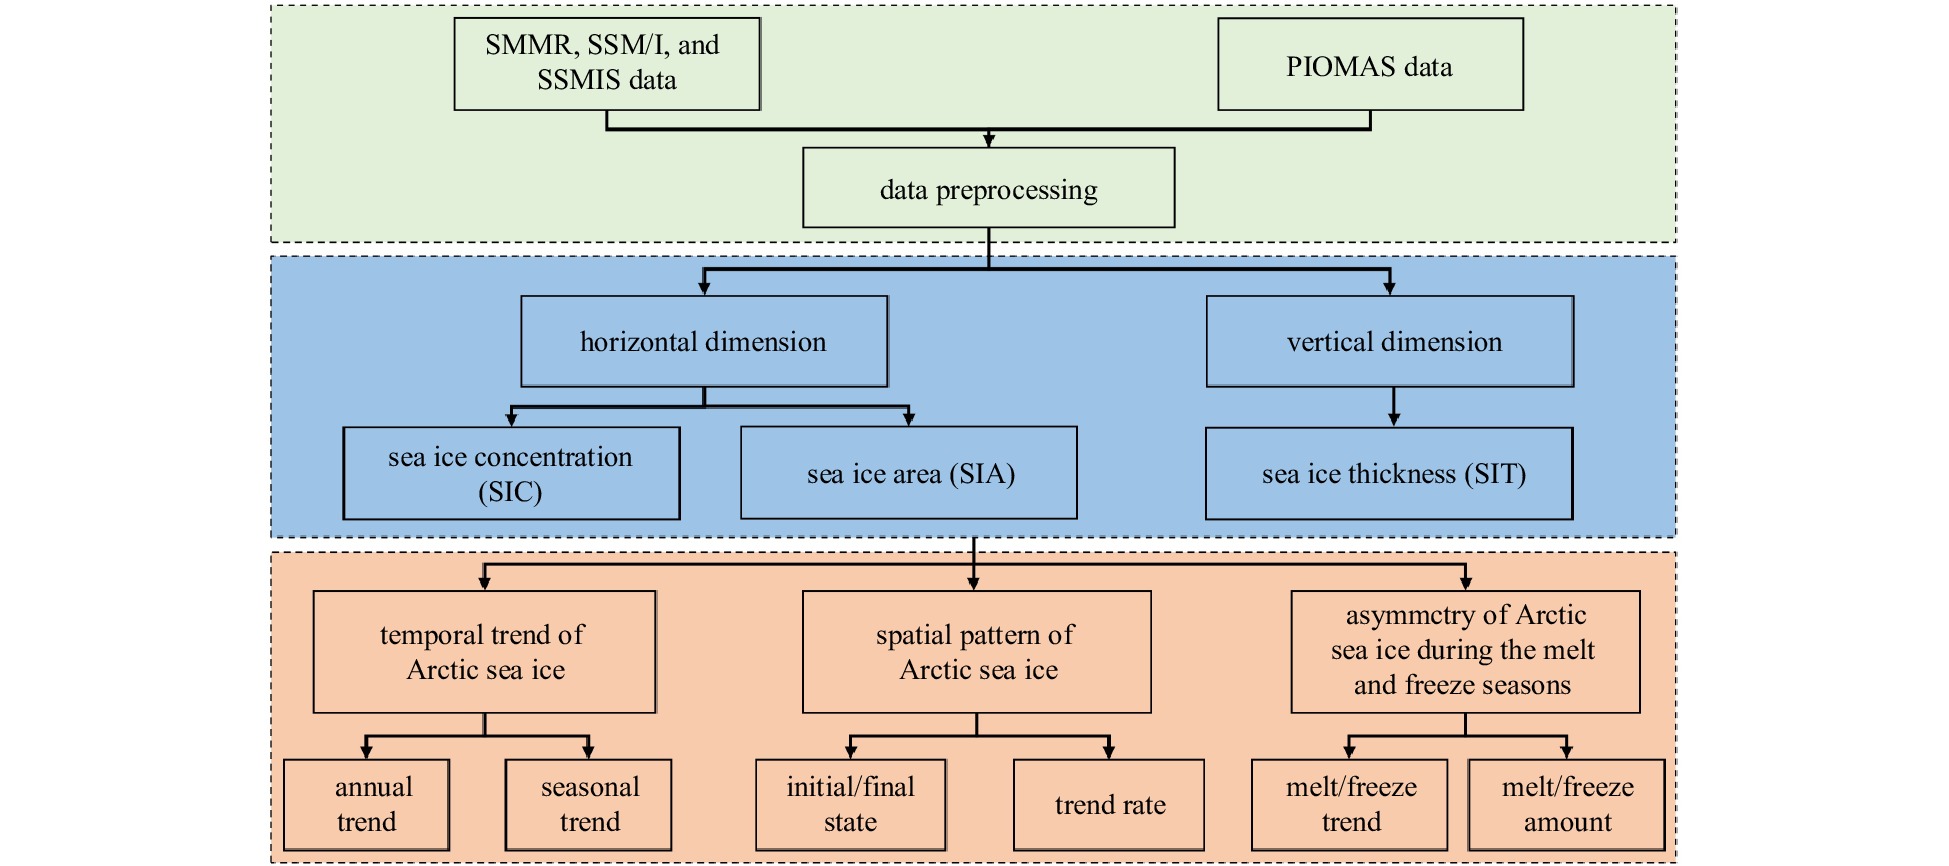
Data processing, including data format conversion, projection conversion, and raster operations, was accomplished through the utilization of Python and ArcGIS software. Additionally, Origin and Python were used to draw graphics. The technical flow chart of this study is illustrated in Fig. 2.
3.1.1
Temporal trend of sea ice in the horizontal dimension
The annual and seasonal variations in SIA during 1979 to 2020 are shown in Fig. 3. The SIA presented a significant declining trend of −5.4 × 10⁴ km2/a (P < 0.05, where P represents the significance level) during 1979 to 2020 (Fig. 3a). It was observed that SIA reached an unusually low value in 2016 (8.1 × 10⁶ km2). Moreover, the SIA decreased significantly in all seasons (P < 0.05) (Figs 3b–e). The highest decline rate of SIA was observed in summer (−7.0 × 10⁴ km2/a), followed by autumn (−6.1 × 10⁴ km2/a) and spring (−4.3 × 10⁴ km2/a), and the least in winter (−3.8 × 10⁴ km2/a).
Figure
3.
The annual (a) and seasonal (b–e) variations of sea ice area (SIA) during 1979 to 2020. The red dashed line represents the trend line.
The annual and seasonal trend rates of SIA for the four periods, i.e., 1979–1990, 1991–2000, 2001–2010, and 2011–2020, are displayed in Table 1. The SIA showed a primary decreasing trend in most periods as a whole. At the annual scale, a significant and largest downward trend of SIA was observed during 2001 to 2010, with a rate of −8.8 × 10⁴ km2/a (P < 0.05). In terms of seasonal scale, the SIA downward trend rate in the summer of 2001–2010 (−13.4 × 10⁴ km2/a) was the highest, followed by the autumn of 2011–2020 (−13.0 × 10⁴ km2/a), and then the autumn of 2001–2010 (−11.0 × 10⁴ km2/a), which all exceeded 1.0 × 10⁵ km2/a.
Table
1.
The annual and seasonal trend rates of SIA in different periods
Time scale
Trend rate of SIA/(104 km2 · a–1)
1979–1990
1991–2000
2001–2010
2011–2020
Winter
−2.5
−2.4
−5.4
−2.8
Spring
−4.8
−4.1
−7.2
−5.0
Summer
−4.2
−4.6
−13.4
−3.8
Autumn
0.7
−8.9
−11.0
−13.0
Annual
−3.4
−5.1
−8.8
−7.8
Note: The bold numbers indicate that the trends are significant at the 95% confidence level.
Regarding sub-regions, the annual and seasonal trend rates and mean of SIA during 1979 to 2020 are presented in Table 2. Annually, the highest decline rate of SIA occurred in the Barents Sea (−8.1 × 10³ km2/a). Meanwhile, it was also the sub-region with the lowest mean value of SIA in the Arctic (29.8 × 10⁴ km2). The SIA decline rate in the Kara Sea (−5.3 × 10³ km2/a) was second only to the Barents Sea. Moreover, the Baffin Bay & Gulf of St. Lawrence Sea and East Siberian Sea also demonstrated an obvious decreasing trend of SIA, at a rate of more than −5.0 × 10³ km2/a. The lowest decline rate of SIA was particularly observed in the Canadian Archipelago (−1.2 × 10³ km2/a).
Table
2.
The annual and seasonal trend rates and mean of SIA in the sub-regions of the Arctic from 1979 to 2020
Region
Trend rate of SIA/(103 km2 · a−1) and mean SIA/ (104 km2)
Annual
Winter
Spring
Summer
Autumn
Trend
Mean
Trend
Mean
Trend
Mean
Trend
Mean
Trend
Mean
Beaufort Sea
−3.3
83.7
0.6
100.3
−1.4
92.9
−9.5
53.7
−2.9
88.0
Chukchi Sea
−4.6
66.0
0.2
89.5
−2.1
81.9
−9.3
32.1
−7.5
60.5
East Siberian Sea
−5.0
84.4
0.3
103.4
−1.2
98.1
−12.8
47.7
−6.4
88.4
Laptev Sea
−3.8
63.6
−0.4
80.0
−7.2
43.7
−7.5
50.0
−0.2
80.8
Kara Sea
−5.3
56.9
−1.4
81.5
−4.0
72.9
−7.6
19.3
−7.8
53.9
Barents Sea
−8.1
29.8
−11.4
52.9
−10.7
41.3
−1.7
4.1
−7.5
20.9
Greenland Sea
−3.4
34.8
−5.0
49.1
−3.1
43.2
−2.1
13.7
−3.0
33.1
Baffin Bay & Gulf of St. Lawrence Sea
−5.1
59.1
−7.6
113.9
−5.4
77.2
−2.3
7.5
−4.8
38.0
Canadian Archipelago
−1.2
58.5
0.6
71.1
−0.7
66.6
−3.1
34.2
−1.5
62.2
Hudson Bay
−2.5
66.9
−0.3
121.7
−3.1
99.3
−1.5
7.4
−4.1
39.1
Central Arctic
−4.9
281.6
−0.9
296.0
−1.3
294.9
−12.1
253.3
−4.8
282.1
Bering Sea & Sea of Okhotsk
−4.4
43.6
−10.2
118.8
−5.1
42.2
0.0
0.0
−2.0
12.9
Note: The bold numbers indicate that the trends are significant at the 95% confidence level.
Regarding seasonal changes, the reduction rates of SIA presented obvious spatial heterogeneity in different seasons (Table 2). For instance, in winter, a higher decline rate of SIA was observed in the Barents Sea, Bering Sea & Sea of Okhotsk, Baffin Bay & Gulf of St. Lawrence Sea, and Greenland Sea. In spring, a higher decline rate of SIA occurred in the Barents Sea, Laptev Sea, Baffin Bay & Gulf of St. Lawrence Sea, and Bering Sea &Sea of Okhotsk. In summer, a higher decline rate of SIA was found in the East Siberian, Central Arctic, Beaufort, and Chukchi Seas. And in autumn, the Kara, Chukchi, Barents, and East Siberian Seas presented a larger downward trend of SIA.
Interestingly, we observed that the Barents Sea witnessed the highest decline rate of SIA, mainly contributed by the sea ice reduction in winter (−11.4 × 10³ km2/a) and spring (−10.7 × 10³ km2/a). However, the Kara Sea, being geographically adjacent to the Barents Sea, was observed to have the second largest decline rate of SIA, mainly related to the sea ice decline in autumn (−7.8 × 10³ km2/a) and summer (−7.6 × 10³ km2/a). Additionally, the highest mean SIA was found in the Central Arctic, where the decline of SIA mainly occurred in summer (−12.1 × 10³ km2/a). More importantly, we noticed that the sub-regions linked to the open ocean experienced a more pronounced reduction in SIA in winter, while the other sub-regions blocked by coastlines demonstrated a higher rate of SIA decline in summer.
3.1.2
Temporal trend of sea ice in the vertical dimension
Figure 4 reveals the annual and seasonal variations in SIT from 1979 to 2020. SIT showed a significant declining trend of −2.2 cm/a (P < 0.05) over the past 42 years (Fig. 4a). Obviously, SIT reached an unusually low value in 2012 (1.19 m). The SIT also exhibited a downward trend in all seasons (P < 0.05) (Fig. 4b–e). The highest decline rate of SIT was observed in summer (−2.5 cm/a), followed by autumn (−2.3 cm/a) and spring (−2.0 cm/a), and the lowest in winter (−1.9 cm/a).
Figure
4.
The annual (a) and seasonal (b−e) variations of sea ice thickness (SIT) during 1979 to 2020. The red dashed line represents the trend line.
The trend rates of SIT at the annual and seasonal scales for the four periods, i.e., 1979–1990, 1991–2000, 2001–2010, and 2011–2020, are presented in Table 3. The SIT generally showed an obvious downward trend in most periods. Regarding the annual scale, there was a significant decline in SIT between 1991–2000 and 2001–2010, with a greater reduction in the latter (−4.1 cm/a, P < 0.05). Moreover, there was an increasing trend in SIT from 1979–1990 and 2011–2020, respectively; however, the tendency was insignificant. Seasonally, the downward trends of SIT were all significant from 1991–2000 and 2001–2010 in the four seasons (P < 0.05). Obviously, the decline rate of SIT in autumn from 2001–2010 (−5.1 cm/a) was the highest, followed by summer (−4.4 cm/a) in the same period.
Table
3.
The annual and seasonal trend rates of SIT in different periods
Time scale
Trend rate of SIT/(cm · a–1)
1979–1990
1991–2000
2001–2010
2011–2020
Winter
−0.5
−2.9
−3.2
0.1
Spring
0.2
−2.9
−3.4
0.7
Summer
−0.3
−3.5
−4.4
−0.2
Autumn
0.0
−3.8
−5.1
−1.1
Annual
0.2
−2.9
−4.1
0.1
Note: The bold numbers indicate that the trends are significant at the 95% confidence level.
Table 4 presents the annual and seasonal trend rates and mean of SIT in the sub-regions of the Arctic from 1979 to 2020. Annually, the higher decline rate of SIT occurred in the Beaufort Sea (−3.6 cm/a), East Siberian Sea (−3.5 cm/a), Chukchi Sea (−3.4 cm/a), Central Arctic (−3.2 cm/a), and the Canadian Archipelago (−2.4 cm/a), all of which presented high mean SIT values (above 1.4 m). Moreover, a lower decline rate of SIT was observed at low latitude regions, such as the Hudson Bay (−0.4 cm/a), Baffin Bay & Gulf of St. Lawrence Sea (−0.3 cm/a), Greenland Sea (−0.2 cm/a), and Bering Sea &Sea of Okhotsk (−0.2 cm/a). Interestingly, the Bering Sea &Sea of Okhotsk, which was covered with the thinnest sea ice (0.1 m) in the Arctic, was the sub-region with the lowest reduction rate of SIT.
Table
4.
The annual and seasonal trend rates and mean of SIT in the sub-regions of the Arctic during 1979 to 2020
Region
Trend rate (cm/a) and mean (m) of SIT
Annual
Winter
Spring
Summer
Autumn
Trend
Mean
Trend
Mean
Trend
Mean
Trend
Mean
Trend
Mean
Beaufort Sea
−3.6
2.1
−3.0
2.4
−3.5
2.6
−4.5
1.6
−3.7
1.7
Chukchi Sea
−3.4
1.6
−2.8
2.1
−3.4
2.3
−4.0
1.0
−3.5
1.1
East Siberian Sea
−3.5
1.7
−2.7
2.0
−3.3
2.3
−4.5
1.1
−3.7
1.2
Laptev Sea
−1.8
1.3
−1.3
1.5
−1.6
1.8
−2.5
0.7
−2.1
1.0
Kara Sea
−2.0
0.9
−1.8
1.3
−2.5
1.4
−1.9
0.4
−1.7
0.6
Barents Sea
−0.9
0.3
−1.3
0.5
−1.4
0.5
−0.4
0.1
−0.7
0.2
Greenland Sea
−0.2
0.2
−0.3
0.3
−0.1
0.3
−0.2
0.1
−0.3
0.2
Baffin Bay & Gulf of St. Lawrence Sea
−0.3
0.3
−0.3
0.6
−0.4
0.5
−0.3
0.1
−0.3
0.2
Canadian Archipelago
−2.4
1.4
−1.9
1.7
−2.1
1.8
−3.2
1.0
−2.4
1.2
Hudson Bay
−0.4
0.6
−0.1
1.1
−0.7
1.1
−0.3
0.1
−0.2
0.2
Central Arctic
−3.2
2.5
−3.1
2.6
−2.9
2.9
−3.6
2.2
−3.5
2.2
Bering Sea & Sea of Okhotsk
−0.2
0.1
−0.4
0.4
−0.3
0.2
0.0
0.0
−0.1
0.0
Note: The bold numbers indicate that the trends are significant at the 95% confidence level.
Comparing seasonal variability of sea ice among different sub-regions, the sub-regions, such as the Beaufort, East Siberian, and Chukchi Seas, Central Arctic, and Canadian Archipelago always presented a higher decline rate in SIT in all seasons. In contrast, Hudson Bay, Baffin Bay & Gulf of St. Lawrence Sea, Greenland Sea, and Bering Sea &Sea of Okhotsk constantly showed a lower decline rate of SIT in all seasons. In winter, the decline rate of SIT was the highest in Central Arctic and lowest in Hudson Bay. In spring, the highest SIT decline rate was observed in the Beaufort Sea, whereas the lowest occurred in the Greenland Sea. In summer and autumn, however, the SIT decline rate was the highest in the Beaufort Sea and lowest in the Bering Sea & Sea of Okhotsk.
3.2
Spatial pattern of Arctic sea ice
3.2.1
Spatial pattern of sea ice in the horizontal dimension
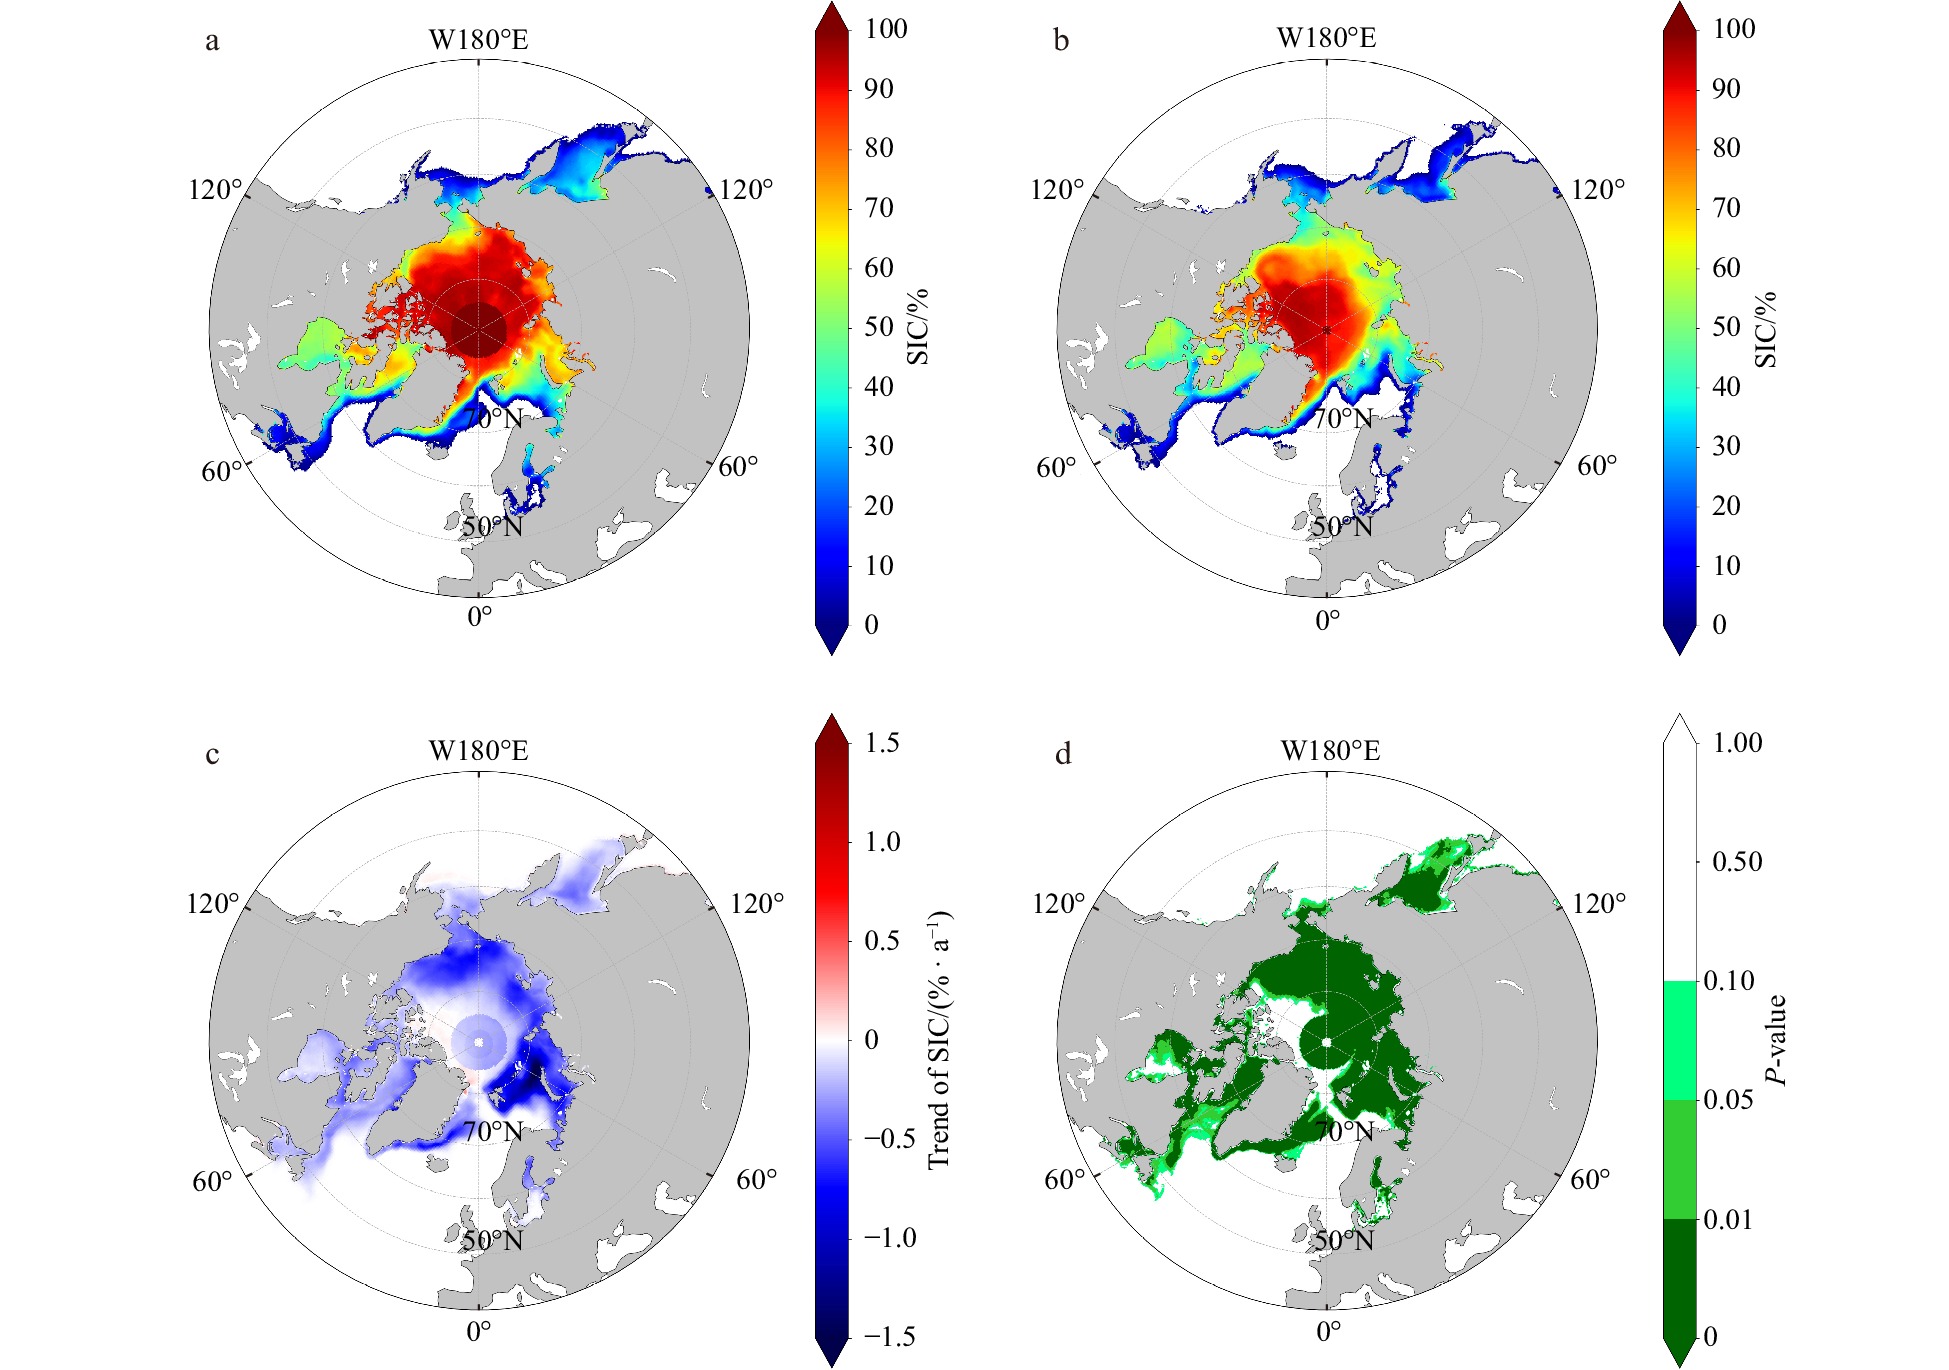
SIC is used to depict the spatial pattern of sea ice in the horizontal dimension in this study. Figure 5 shows the spatial patterns of Arctic SIC in 1979 (initial state), 2020 (final state), and the annual trend rate of SIC at the pixel scale during 1979 to 2020. The SIC in 1979 was higher in the regions at high latitudes, such as the Central Arctic, Canadian Archipelago, Beaufort Sea, Chukchi Sea, East Siberian Sea, and Laptev Sea, where the SIC all exceeded 80% (Fig. 5a). However, the SIC in 2020 maintained high values (exceeded 80%) only in the Central Arctic and Canadian Arctic Archipelago (Fig. 5b).
Figure
5.
Spatial patterns of Arctic sea ice concentration (SIC). a and b indicate the initial and final states of SIC in 1979 and 2020, respectively, and c and d represent the annual trend rate of SIC and its P-value of significance test, respectively.
As shown in Figs 5c and d, the annual trend of SIC varied across the Arctic over the past 42 years, and most parts presented a significant downward trend of SIC at the 95% level. The highest decline rate of SIC was observed in the Barents and Kara Seas, with a downward rate of about −1.5%/a. The SIC in the Chukchi, East Siberian, and Beaufort Seas also showed an obvious decreasing trend, at about −0.5%/a to 0.1%/a. However, there was no obvious trend in SIC in the Central Arctic, Canadian Archipelago, and low-latitude seas. Notably, there was a slight increase in SIC only in parts of northern Greenland (P > 0.1). We observed that the Beaufort, Chukchi, East Siberian, and Laptev Seas presented a higher initial value and a greater declining trend of SIC compared with other sub-regions. The Central Arctic and Canadian Archipelago also exhibited a higher initial value of SIC, but the downward trend was generally small and insignificant. Note that the Barents and Kara Seas having a low initial SIC experienced the largest SIC reduction from 1979 to 2020.
3.2.2
Spatial pattern of sea ice in the vertical dimension
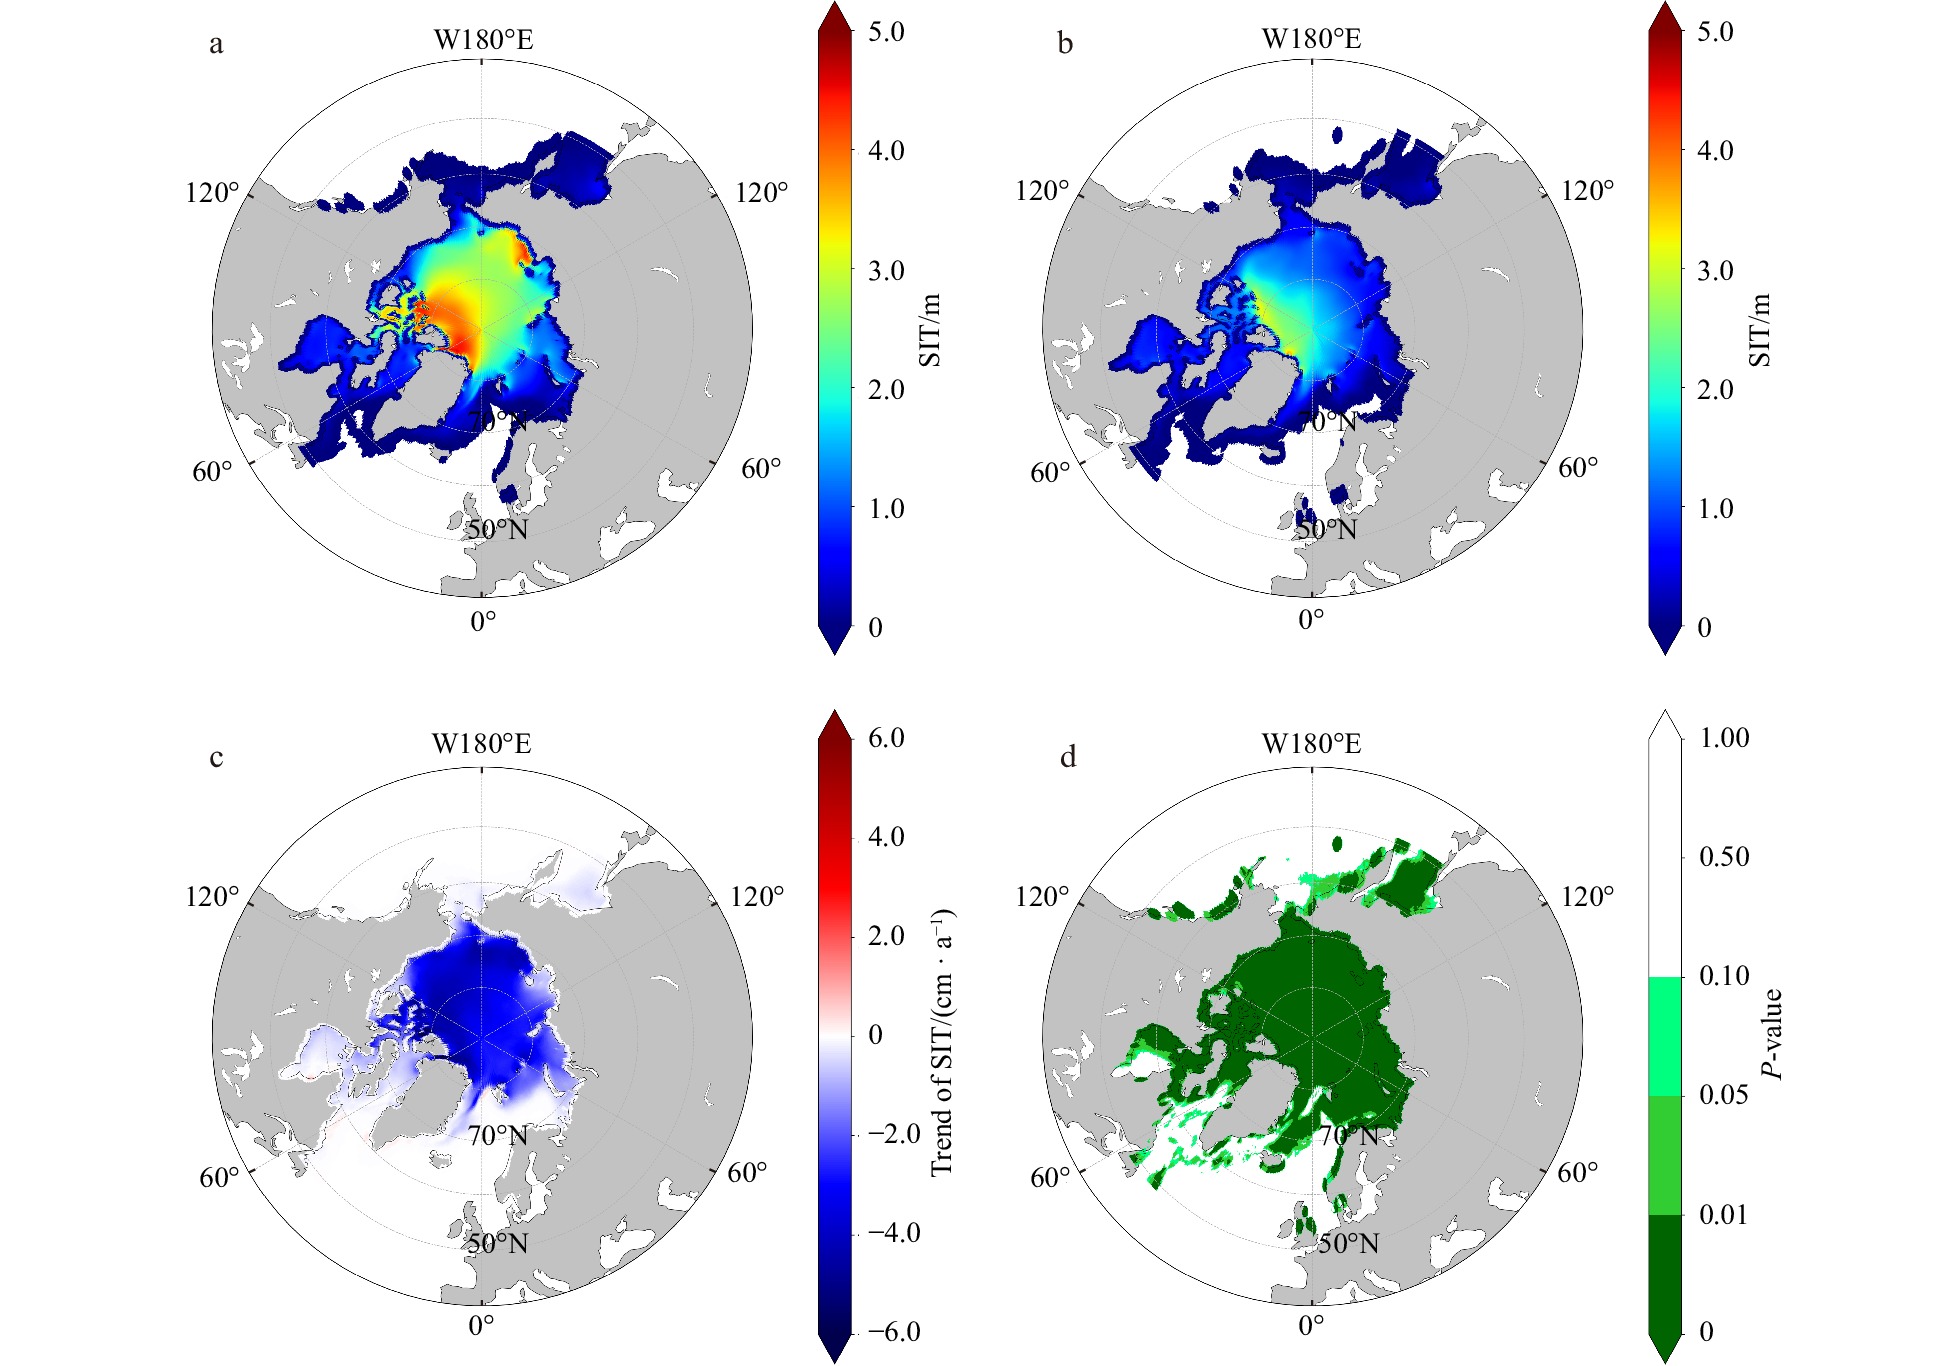
Figure 6 illustrates the spatial patterns of Arctic SIT in 1979 (initial state), 2020 (final state), and the annual trend rate of SIT at the pixel scale during 1979 to 2020. The SIT in 1979 was higher in the high-latitude regions (Fig. 6a), especially in the northern Canadian Archipelago, northern Greenland, and East Siberian Sea (above 4 m). In contrast, the Barents and Kara Seas witnessed a low initial SIT (less than 2 m). However, the sub-regions that presented a high value of SIT (above 2 m) in 2020 were the northern Canadian Archipelago and northern Greenland (Fig. 6b). As shown in Figs 6c and d, SIT declined significantly in the region north of 70°N (P < 0.01), especially in the northern Canadian Archipelago, northern Greenland, and East Siberian Sea, with a decline rate of over −4 cm/a. Notably, the thickest region of Arctic sea ice in 1979 had undergone the largest thinning during the considered period.
Figure
6.
Spatial patterns of Arctic Sea ice thickenss (SIT). a and b indicate the initial and final states of SIT in 1979 and 2020, respectively; c and d represent the annual trend rate of SIT and its P-value of significance test, respectively.
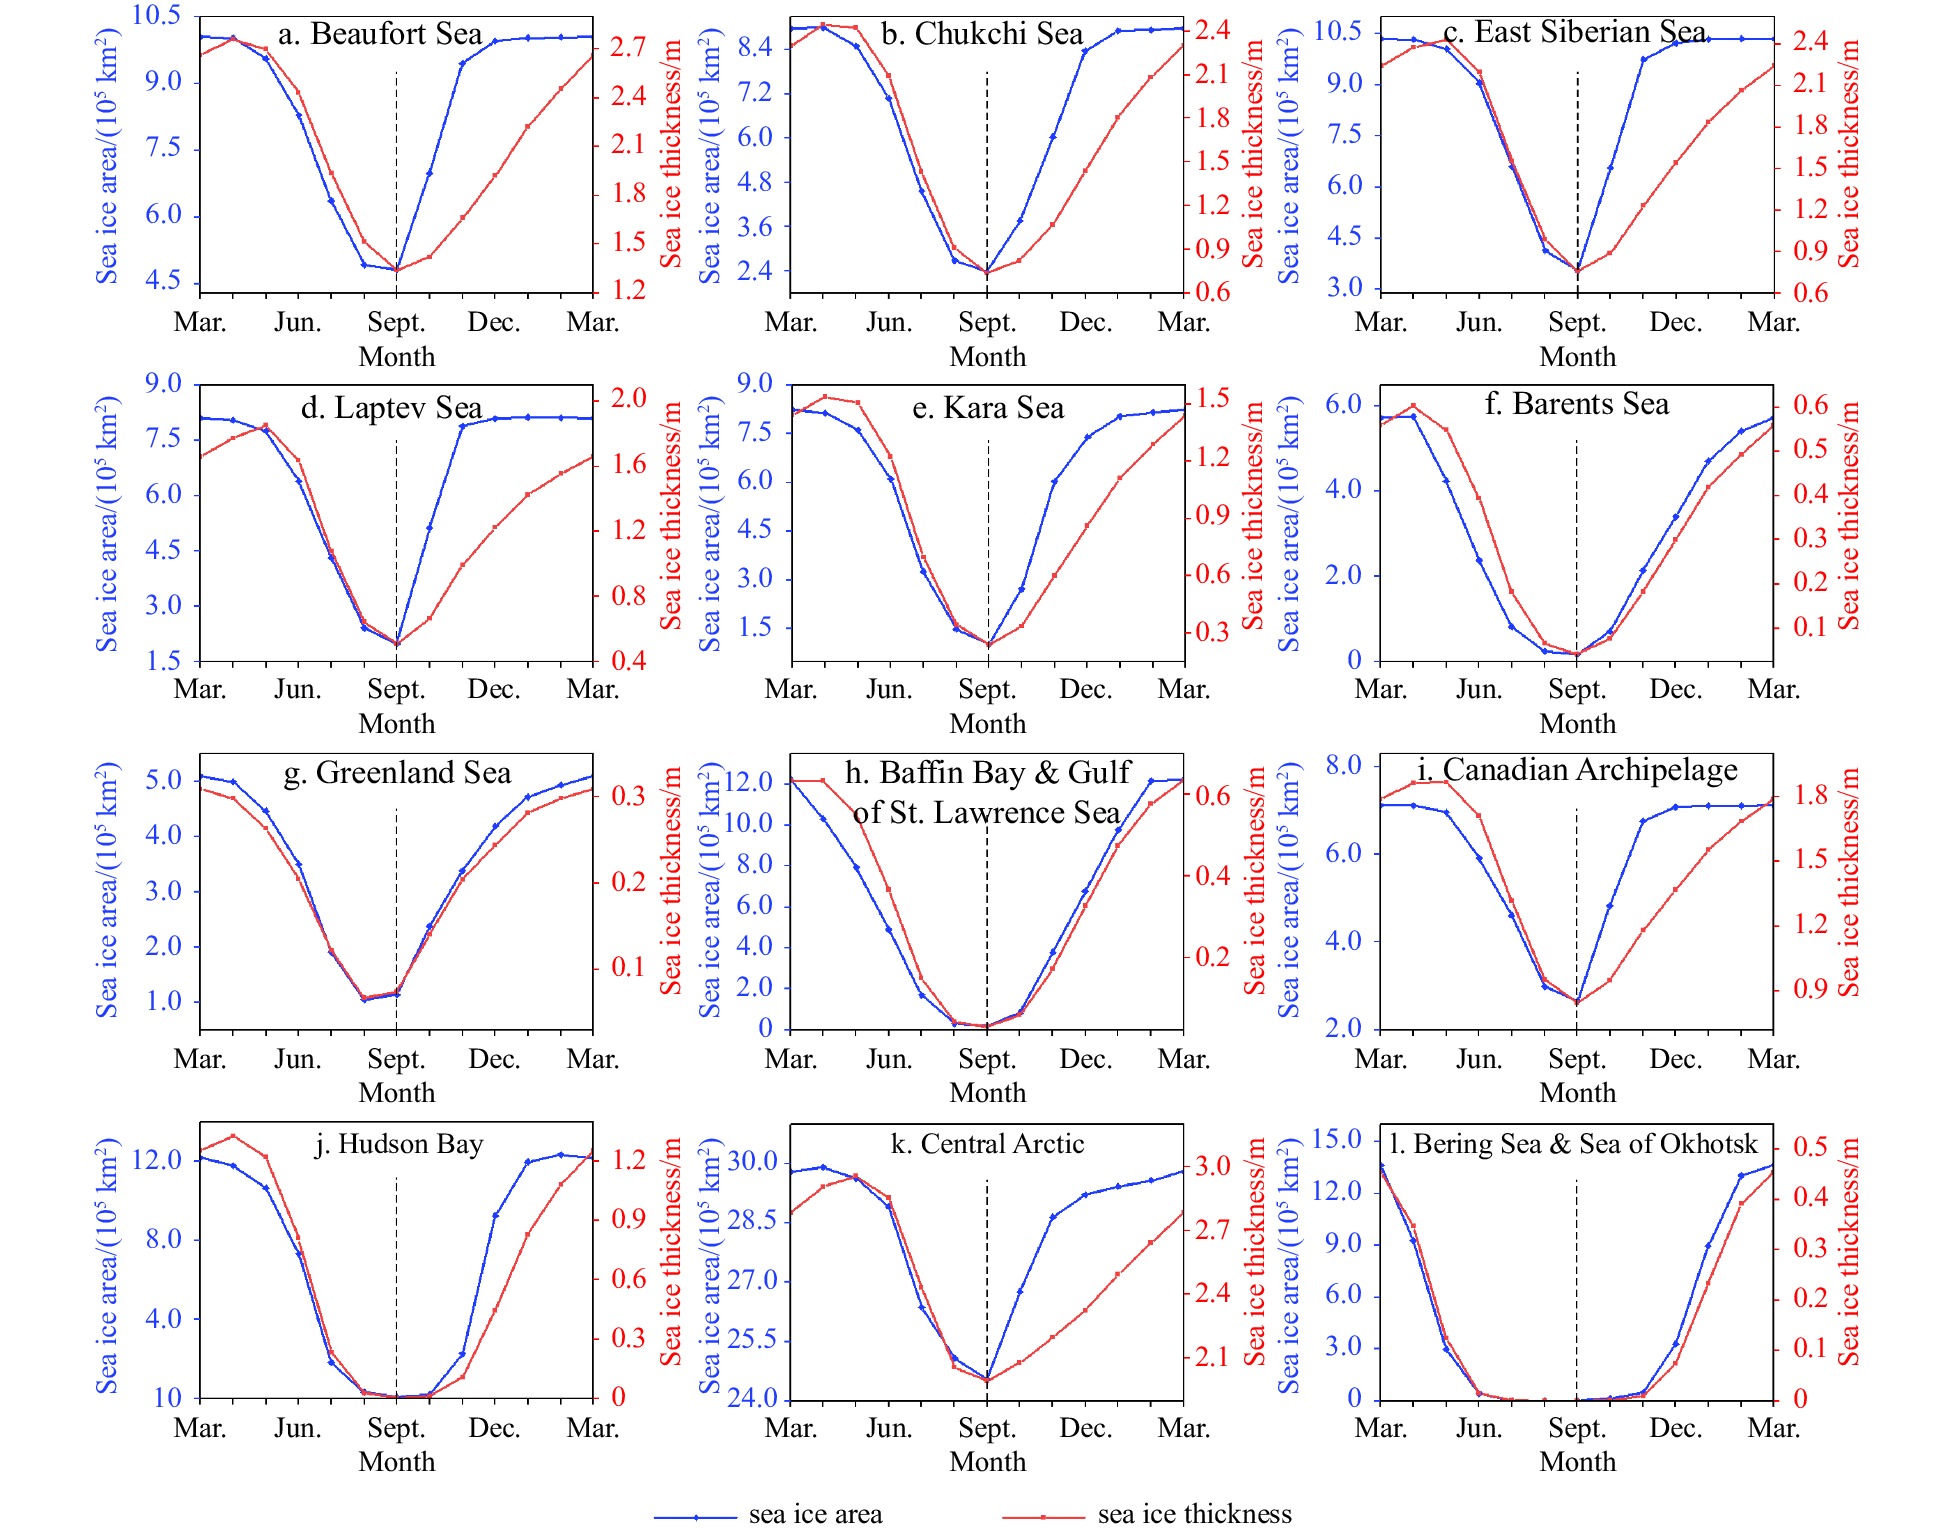
The monthly changes of SIA and SIT in the 12 sub-regions during 1979 to 2020 are shown in Fig. 7. As the month corresponding to the lowest SIA and SIT, September was selected as the center month to capture the trend of sea ice melting (left of the central axis) and freezing (right of the central axis). Generally, the SIA reached a maximum in March or April, while SIT reached its maximum in April or May. As the temperature increased, sea ice gradually melted and fell to the minimum around September, and then it froze progressively as the temperature dropped from October. Consequently, the monthly changes of SIT and SIA followed a “V” shape during the year.
Figure
7.
The monthly changes of sea ice area and sea ice thickness in the 12 sub-regions from 1979 to 2020. a. Beaufort Sea, b. Chukchi Sea, c. East Siberian Sea, d. Laptev Sea, e. Kara Sea, f. Barents Sea, g. Greenland Sea, h. Baffin Bay & Gulf of St. Lawrence Sea, i. Canadian Archipelago, j. Hudson Bay, k. Central Arctic, and l. Bering Sea & Sea of Okhotsk.
More importantly, the variabilities of Arctic sea ice were characterized as a striking asymmetry in both horizontal (SIA) and vertical dimensions (SIT) during the melt and freeze seasons. For the melt season, sea ice in the horizontal dimension began to retreat in March or April, whereas sea ice in the vertical dimension started to melt in April or May. Interestingly, the melt season of sea ice in the horizontal dimension was longer and earlier than that of the vertical dimension. For the freeze season, sea ice in both the horizontal and vertical dimensions began to refreeze in September; however, there were differences in the freezing rates. In the vertical dimension, sea ice slowly froze in all sub-regions. Nevertheless, in the horizontal dimension, sea ice in most regions, such as the Beaufort Sea (Fig. 7a), Chukchi Sea (Fig. 7b), East Siberian Sea (Fig. 7c), Laptev Sea (Fig. 7d), Kara Sea (Fig. 7e), Canadian Archipelago (Fig. 7i), Hudson Bay (Fig. 7j), and Central Arctic (Fig. 7k), froze rapidly within two or three months.
Thus, the results suggest that sea ice was generally characterized by early melting and rapid freezing in the horizontal dimension but late melting and gradual freezing in the vertical dimension over most regions of the Arctic. For the other sub-regions, such as the Barents Sea (Fig. 7f), Greenland Sea (Fig. 7g), Baffin Bay & Gulf of St. Lawrence Sea (Fig. 7h), and Bering Sea & Sea of Okhotsk (Fig. 7l); however, the freezing rates of sea ice in the horizontal and vertical dimensions were similar.
Figure 8 reveals the annual sea ice changes during the melt and freeze seasons during 1980 to 2020. Negative values were used to indicate the sea ice amount during the melt season to better distinguish the changes in sea ice melting and freezing. It was observed that the sea ice amount during the melt and freeze seasons presented an increasing trend in both the horizontal and vertical dimensions from 1980 to 2020. The melting rate of sea ice (−3.7 × 10⁴ km2/a for SIA, −0.74 cm/a for SIT) was higher than that of freezing (3.4 × 10⁴ km2/a for SIA, 0.73 cm/a for SIT). Obviously, the rate of sea ice melting was 0.3 × 10⁴ km2/a and 0.01 cm/a higher than that of freezing in the horizontal and vertical dimensions, respectively, suggesting that there was an absence of an equivalent ice freeze supplement after sea ice melted in the Arctic during 1980 to 2020. Briefly, more ice was lost during the melt season in the current year, and more ice was gained during the freeze season in the following year, but the difference between the amount of sea ice lost and gained was generally increasing, and the annual range amplitude (ARA) of sea ice was gradually greater than ever before.
Figure
8.
The annual variation of sea ice melting and freezing amount in the horizontal dimension (a) and vertical dimension (b) during 1980 to 2020.
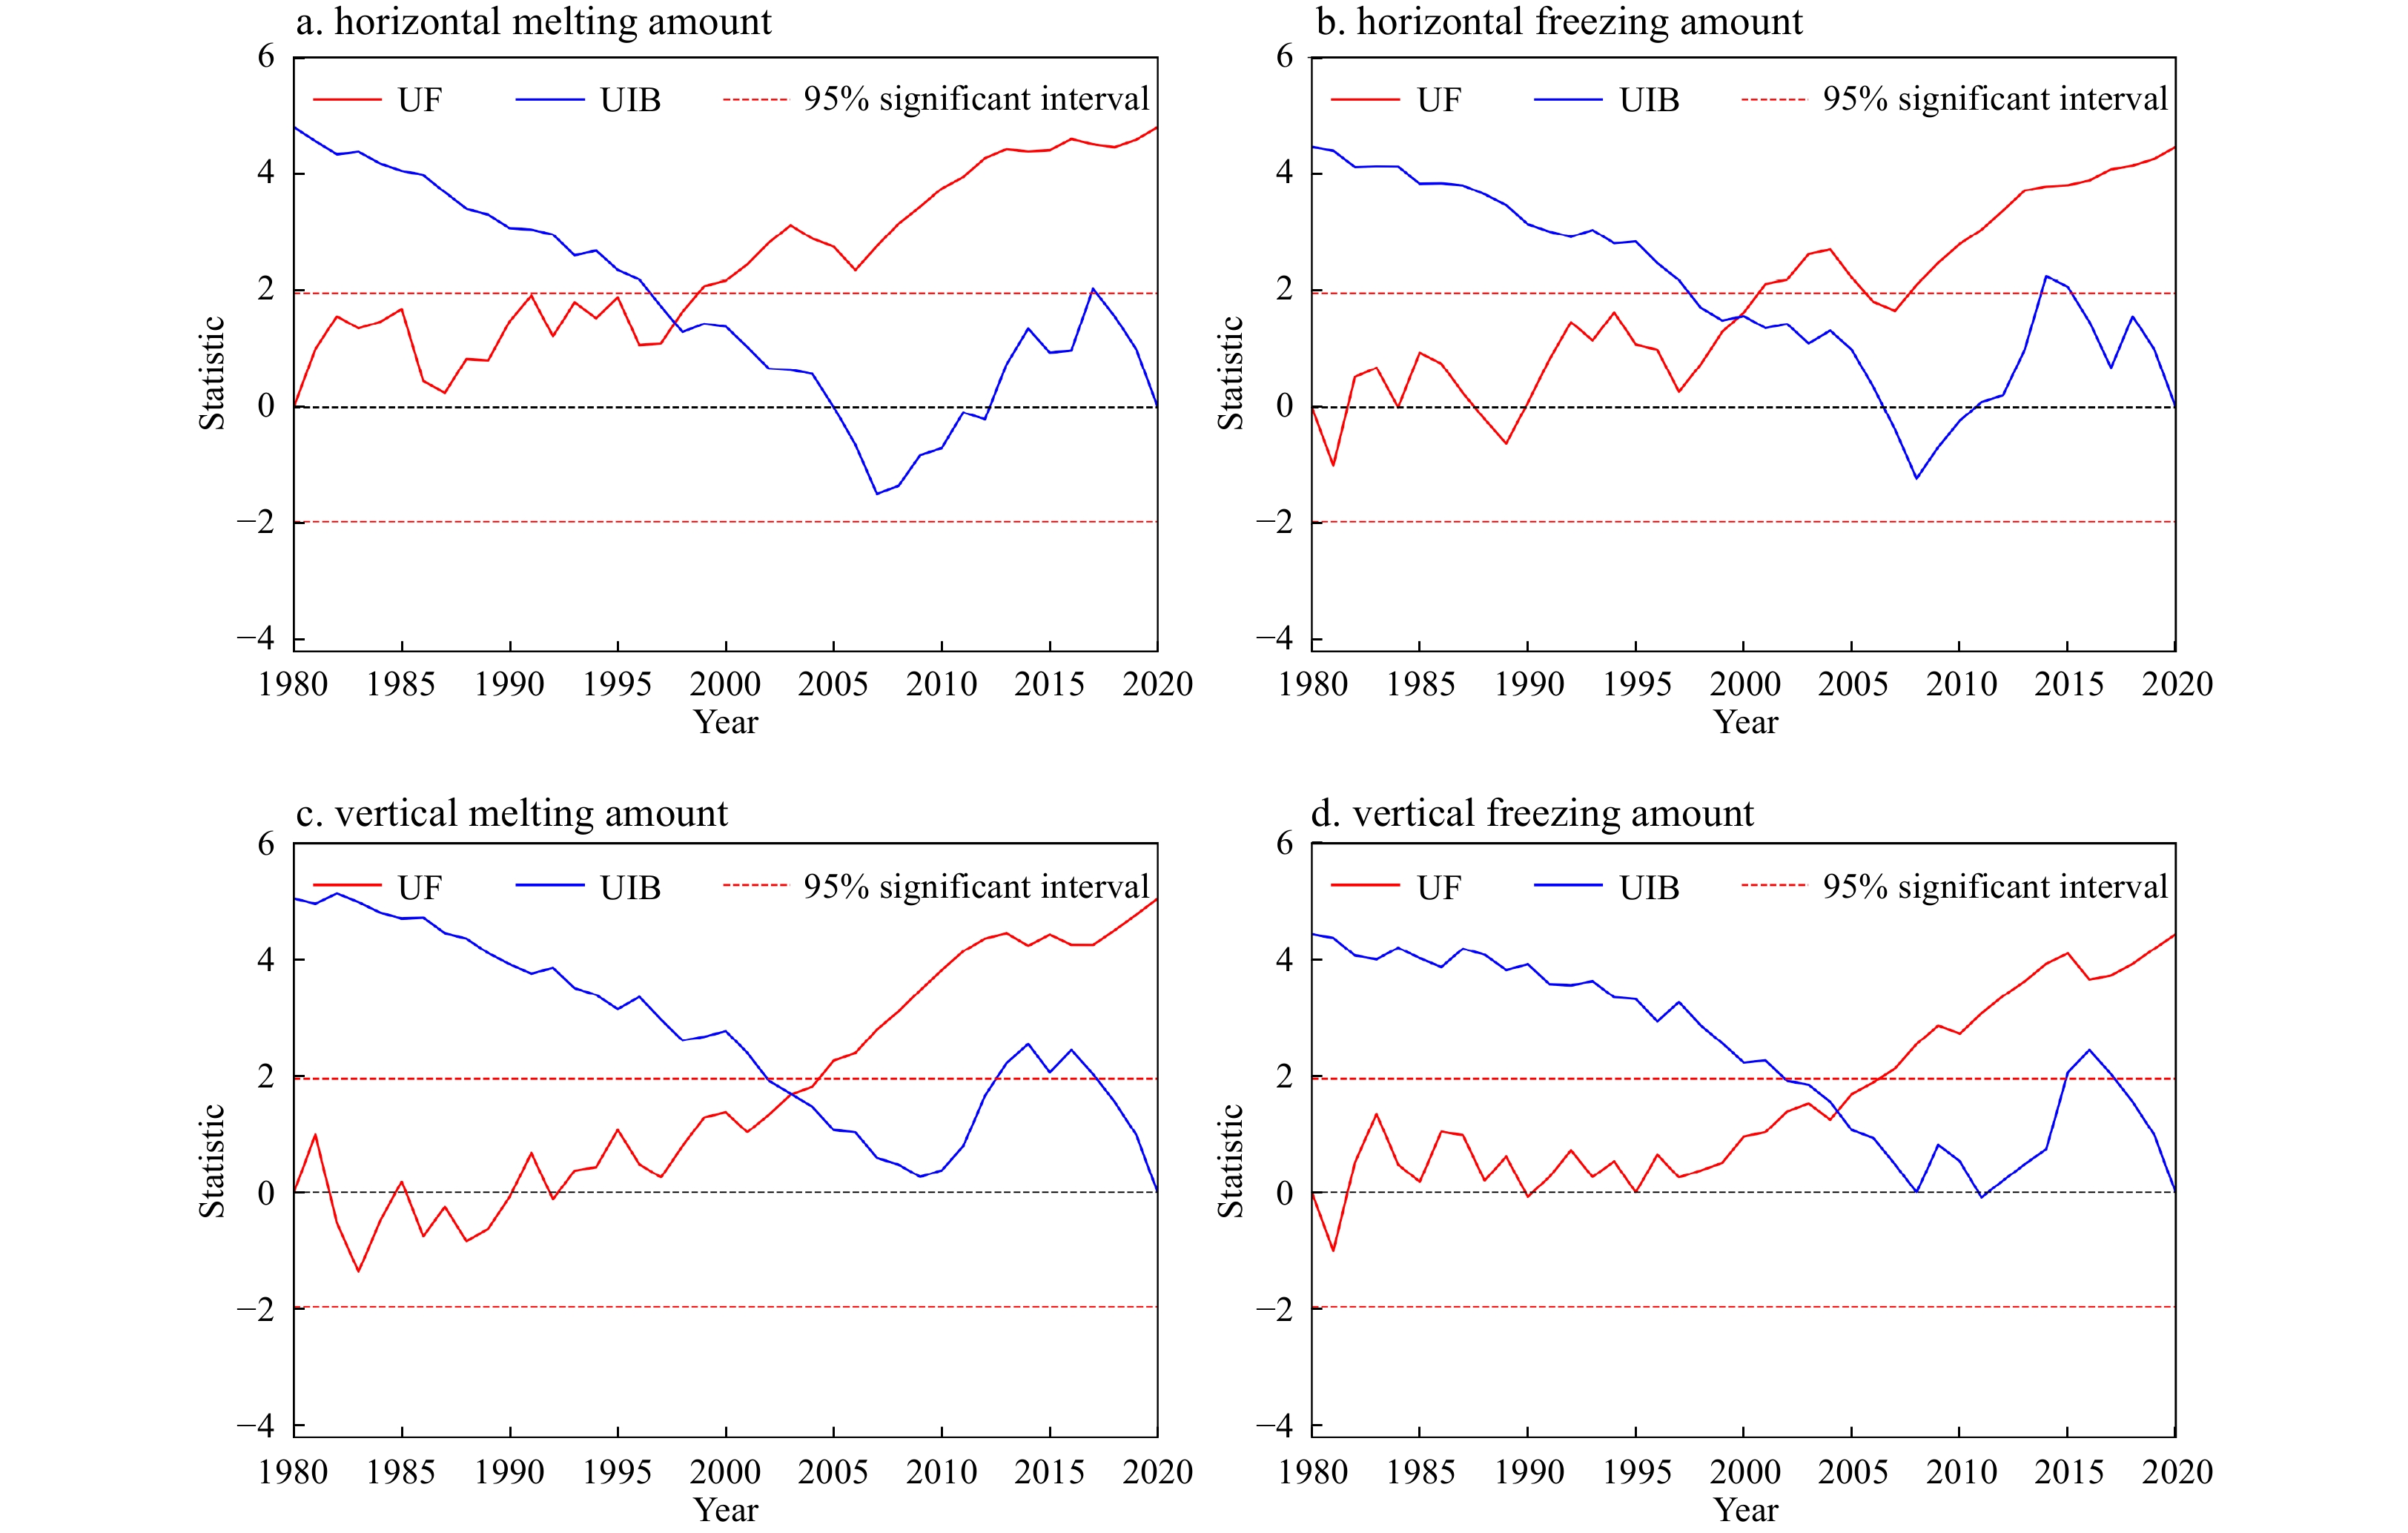
The M-K mutation test for the changes in the amount of sea ice melting and freezing in the horizontal and vertical dimensions during 1980 to 2020 is presented in Fig. 9. And Table 5 shows the mutation years and rates of sea ice melting and freezing amount changes before and after the mutation. In the horizontal dimension, the UF and UB curves have an intersection in 1997 within the 95% confidence interval for the melting amount, indicating that the melting amount change of sea ice in the horizontal direction had a significant shift in 1997 (Fig. 9a), which is further verified by the dissimilar sea ice melt rates during 1980–1996 (−2.5 × 10⁴ km2/a) and 1997–2020 (−2.9 × 10⁴ km2/a) (Table 5). For the change in the amount of sea ice freezing, the mutation occurred around 2000 (Fig. 9b), and sea ice froze slowly during 1980 to 1999 (2.3 × 10⁴ km2/a) but much faster during 2000 to 2020 (3.2 × 10⁴ km2/a) (Table 5).
Figure
9.
M-K mutation test for the changes in the amount of sea ice melting and freezing in the horizontal (a and b) and vertical dimensions (c and d) from 1980 to 2020.
Furthermore, in the vertical dimension, a shift in the sea ice melting amount was observed in 2003 (Fig. 9c), before which the sea ice melted slowly (−0.4 cm/a) and after which it melted more rapidly (−0.7 cm/a). In 2004, there was a significant mutation in the change of sea ice freezing amount (Fig. 9d), which increased slowly during 1980–2003 (0.4 cm/a) but more rapidly from 2004 to 2020 (1.0 cm/a). Notably, the mutation time of sea ice changes in the vertical dimension always lagged behind that in the horizontal dimension.
4.
Discussion
4.1
Long-term changes in Arctic sea ice
We found the SIA in the Arctic declined at a remarkably high rate during 1979 to 2020, with a trend rate of −5.4 × 10⁴ km2/a (Fig. 3), which is much higher than the change rate of SIA from 1979 to 2010 reported by Cavalieri and Parkinson (2012). It observed that the change rate of SIA from 2011 to 2020 was −7.8 × 10⁴ km2/a (Table 1), accounting for the faster decline in SIA from 1979 to 2020 observed in this study than that reported by Cavalieri and Parkinson (2012). This outcome further clarifies that the reduction in the SIA in the Arctic was accelerating over time. Spatially, SIC/SIA showed a sharper declining trend in the Barents, Kara, and East Siberian seas compared with other sub-regions (Fig. 5c and Table 2), being highly consistent with that of Kumar et al. (2021) and Wang et al. (2020).
Seasonally, the decline rate for SIA was highest in summer (−7.0 × 10⁴ km2/a) and lowest in winter (−3.8 × 10⁴ km2/a) during 1979 to 2020 (Fig. 3), which is slightly larger than the reduction rate of SIA discovered by Cavalieri and Parkinson (2012), who also revealed that the highest and lowest decline rate for SIA was respectively in summer (−6.9 × 10⁴ km2/a) and winter (−3.1 × 10⁴ km2/a) during 1979 to 2010. Moreover, we noticed that the reduction rate of SIA exhibited an apparent spatial heterogeneity among seasons, especially in summer and winter (Table 2). For instance, in winter, a higher decline rate of SIA was observed in the Barents Sea, Bering Sea and Sea of Okhotsk, Baffin Bay & Gulf of St. Lawrence Sea, and Greenland Sea. In summer, a higher decline rate of SIA was found in the East Siberian, Central Arctic, Beaufort, and Chukchi Seas. It revealed that sub-regions connected to the open ocean and those blocked by the coastlines exhibited higher decline rates of SIA in winter and summer, respectively, which is infrequently documented by previous studies considering the Arctic sea ice changes.
This study discovered the SIT showed a significant declining trend of −2.2 cm/a during 1979 to 2020 in the Arctic (Fig. 4), similar to the findings by Xiao et al. (2021), who revealed that the annual ice thickness from PIOMAS decreased by −2.0 cm/a during 1979 to 2019. In spatial, SIT presented a pronounced decreasing trend in the seas north of 70°N, especially in the northern Canadian Archipelago, northern Greenland, and East Siberian Sea (Fig. 6c); and the region with the thickest sea ice in 1979 was observed to experience the greatest thinning, particularly in line with Blanchard-Wrigglesworth and Bitz (2014) and Labe et al. (2018).
Seasonally speaking, the decline rate for SIT was highest in summer (−2.5 cm/a) and lowest in winter (−1.9 cm/a) in the Arctic (Fig. 4), which was rarely documented by previous studies due to the limited availability of summer sea ice thickness data (Wang et al., 2020). Regarding the sub-regions, we found the Beaufort, East Siberian, Chukchi Seas, Central Arctic, and Canadian Archipelago always presented a higher decline rate of SIT in all seasons (Table 4). Comparing the seasonal trends of sea ice in the horizontal and vertical dimensions, we found that the sharp decline of SIA and SIT showed significant spatial differences (Tables 2 and 4), i.e., sub-regions with a large decline in SIA were quite different in summer and winter, while sub-regions with a high reduction in SIT were roughly the same across all seasons.
Notably, due to the influences of sensors, atmospshere, retrieval algorithms and so on, it is inevitable that the SIC extraction could introduce some uncertainties in sea ice change trends detection. And the threshold setting for ice concertration might also creat uncertainties. Additionally, although the PIOMAS spatial thickness pattern is considered to be in good agreement with various observational products (Collow et al., 2015; Labe et al., 2018; Wang et al., 2016), PIOMAS appears to overestimate thin ice thickness and underestimate thick ice, yielding a smaller downward trend than that reconstructed from observations (Schweiger et al., 2011). In the future, more accurate sea ice data, such as concentration and thickness retrieved from synthetic aperture radar (SAR) imagery, should be further applied for refined research on the sea ice area and thickness change in the Arctic.
4.2
Driving forces of Arctic sea ice changes
Generally, long-term changes in Arctic sea ice are driven by natural forcing, anthropogenic forcing, internal variability, and internal feedback (Cai et al., 2021; Deser and Teng, 2008; Huang et al., 2019; Xiao et al., 2022; You et al., 2022). For example, previous studies have documented that the accelerated loss of sea ice is closely related to global warming and CO2 emissions (Cai et al., 2021; Kumar et al., 2020; Notz and Community, 2020). The continued increase in human emissions of greenhouse gases has led to a global warming trend and thus triggered a massive reduction in Arctic sea ice (Al-Ghussain, 2019; Kumar et al., 2020). Subsequently, the Arctic temperature is further amplified under the regulation of ice-albedo positive feedback, greatly accelerating the sea ice loss in the past few decades (Carvalho and Wang, 2020; Ono et al., 2022). Additionally, we observed that Arctic sea ice not only showed a long-term trend of decline but also manifested an obvious interannual oscillation, which could be regulated by the effects of natural forcing and internal variability (Perovich and Richter-Menge, 2009; Xiao et al., 2022).
Furthermore, it is found that the dominant driving mechanism of Arctic sea ice changes varies in different dimensions. Regarding the horizontal dimension, the retreat of sea ice is more likely to be modulated by ocean-atmosphere factors; for example, Kumar et al. (2021) demonstrated that the prominent decline rate of SIA in the Barents and Kara seas was directly affected by the inflow of warm water from the North Atlantic. Additionally, previous studies have demonstrated that the Beaufort Gyre and the Transpolar Drift Stream dominated the mean circulation of the Arctic (Serreze and Meier, 2019). Sea ice from the East Siberian Sea driven by the streams and winds was more likely transported to the Atlantic Ocean through Fram Strait in the form of ice floes along the Transpolar Drift Stream, thus contributing to the large decrease in SIA in the East Siberian Sea (Serreze et al., 2007; Wang et al., 2009). Dethleff and Kuhlmann (2010) found the Fram Strait sea-ice sediments were statistically similar to East Siberian shelf sources, suggesting that ice floes from the East Siberian Sea were one of the main sources of ice exported to the Fram Strait. Regarding the sea ice variation in the vertical dimension, Bitz and Roe (2004) documented the thinning of sea ice is largely regulated by its thermodynamic property, indicating that sea ice returned to its equilibrium thickness by adjusting its growth rate when disturbed, which is known as growth-thickness feedback. Specifically, the growth rate of thinner ice is so fast that it does not need to be too thin to reach the new equilibrium thickness, but thicker ice must be thinner enough to establish its equilibrium, resulting in the greatest thinning occurring in the region where the sea ice is initially thickest (Bitz and Roe, 2004; Blanchard-Wrigglesworth and Bitz, 2014; Labe et al., 2018).
For the seasonal fluctuations of Arctic sea ice, the current study found the rate of decline in both SIA and SIT was highest in summer and lowest in winter. It documented that the melting of sea ice resulted in thinner ice and open water in summer, which allowed an increase of solar heat input to the ice-ocean system and thus led to amplified ice melting in this season (Zhang et al., 2008; Markus et al., 2009). Moreover, Lei et al. (2016) found the Arctic dipole anomaly could be also partly responsible for the rapid loss of summer ice in the Arctic by influencing the warmer air masses direction. And during the ice freeze season, especially in winter, it is thought that the wide and smooth surface of sea ice not only weakens the exchange of energy between sea water and atmosphere but also reflects more solar radiation (Wu et al., 2014), helping to reduce the loss of sea ice and thus resulting in the smallest reduction of polar sea ice during winter. Eventually, under the context of global warming that results in a total decline trend of sea ice in the Arctic, the ice-albedo feedback and Arctic Dipole Anomaly further exacerbate the trend differences of sea ice in summer and winter.
Additionally, we also observed that the reduction rate of SIA presented a clear spatial heterogeneity in summer and winter (Table 2). Eisenman (2010) documented that the blocking effect by coastlines, which is known as “geographic muting”, could be responsible for the spatial pattern of trends in SIA in winter. Specifically, the coastlines block the sea ice from extending southward in winter in most regions of the Arctic and consequently mute the changes in SIA in those regions. In contrast, the sea ice over the regions linked to the open ocean, such as the Barents Sea, Bering Sea & Sea of Okhotsk, Baffin Bay & Gulf of St. Lawrence Sea, and Greenland Sea, can extend further southward in winter and thus experience higher SIA variability. Regarding the driving force of SIA spatial pattern in summer, further studies in combination with climatology, physical oceanography, and geography are urgently needed in the future. For SIT, we found the sub-regions with higher initial ice thickness, such as the Beaufort Sea, East Siberian Sea, Chukchi Sea, Central Arctic, and Canadian Archipelago, always exhibited significant reduction rates in all seasons (Table 4). This could be attributed to the thermodynamic properties of sea ice, which play a dominant role in determining the mean state of sea ice thickness at the pan-Arctic and regional scales (Bitz and Roe, 2004; Polyakov et al., 2022).
4.3
Attribution of freeze-thaw asymmetry of Arctic sea ice
Regarding the sea ice melting and freezing seasons, we observed that sea ice in most parts of the Arctic was generally characterized by early melting and rapid freezing in the horizontal dimension but presented a feature as late melting and gradual freezing in the vertical dimension, which not only confirms the asymmetry change of SIA observed by recent studies (Huang et al., 2017; Onarheim et al., 2018; Roach et al., 2022) but also highlights the striking asymmetry in the seasonal cycle of SIT in the Arctic for the first time. Onarheim et al. (2018) indicated that the asymmetry change of SIE was associated with regional climate forcing and strong salinity stratification, which provided a possibility to explain the rapid freezing of sea ice in the horizontal dimension. Additionally, considering the sub-regions (Figs 7f, g, h, and l) presented a similar sea ice freezing trend in the horizontal and vertical dimensions, it suggests that the geometric consequence of continental distribution may be responsible for the asymmetry change of SIA in the regions linked to the open ocean (Eisenman, 2010). For SIT, the onset and rate of freeze and melt are closely related to heat exchange within the sea ice as well as between the top and bottom of the ice. The thermodynamic growth and decay dominated the seasonal cycle of sea ice thickness and thus impacted the striking freeze-thaw asymmetry of sea ices in vertical dimension (Lei et al., 2022; Von Albedyll et al., 2022).
We observed that the amount of sea ice melting and freezing was disequilibrium in the Arctic during the considered period. The rate of sea ice melting was 0.3 × 10⁴ km2/a and 0.01 cm/a higher than that of freezing in the horizontal and vertical dimensions (Fig. 8), indicating an absence of an equivalent ice freeze supplement after sea ice melted in the Arctic. Moreover, it’s found that the annual melting and freezing amount of Arctic sea ice increased during 1980 to 2020 and the annual range amplitude of sea ice was gradually greater than ever before, which is consistent with the result simulated by CMIP5 models (Huang et al., 2017). In addition, this study also revealed that there were notable shifts in the melting and freezing of Arctic sea ice in 1997/2003 and 2000/2004, respectively, in the horizontal/vertical dimension (Fig. 9 and Table 5), and the melting and freezing rates of sea ice in both horizontal and vertical dimensions after the mutation time were higher than those before the mutation, further revealing the effective feedback of Arctic sea ice to accelerating warming ocean (Chen et al., 2019; Yadav et al., 2020).
5.
Conclusions
Based on satellite and assimilation data, this study investigated the spatiotemporal variation and freeze-thaw asymmetry of Arctic sea ice in the horizontal and vertical dimensions from 1979 to 2020. The main conclusions are as follows.
(1) Arctic sea ice was declining at a remarkably high rate of −5.4 × 10⁴ km2/a in SIA and −2.2 cm/a in SIT during 1979 to 2020, and the reduction of SIA and SIT was the largest in summer and the smallest in winter. Spatially, compared with other sub-regions, the SIA showed a sharper declining trend in the Barents Sea, Kara Sea, and the East Siberian Sea, while SIT presented a larger downward trend in the northern Canadian Archipelago, northern Greenland, and the East Siberian Sea.
(2) The reduction rate of SIA exhibited a clear spatial heterogeneity among seasons, especially in summer and winter, i.e., the sub-regions linked to the open ocean exhibited a higher decline rate in winter. In comparison, the other sub-regions blocked by the coastlines demonstrated a greater decline rate in summer. For SIT, the sub-regions, such as the Beaufort, East Siberian, and Chukchi Seas, Central Arctic, and Canadian Archipelago always exhibited a higher decline rate in all seasons.
(3) A striking freeze-thaw asymmetry of Arctic sea ice was also observed. Comparatively, sea ice in the horizontal dimension was characterized by early ice retreat and rapid ice advance over most parts of the Arctic. In contrast, sea ice in the vertical dimension demonstrated a feature of late melting and gradual freezing. Additionally, the amount of sea ice melting and freezing was disequilibrium in the Arctic during the considered period, and the rate of sea ice melting was 0.3 × 10⁴ km2/a and 0.01 cm/a higher than that of freezing in the horizontal and vertical dimensions, respectively.
(4) In the horizontal/vertical dimension, there were notable shifts in the melting and freezing of Arctic sea ice in 1997/2003 and 2000/2004, respectively. And the melting and freezing rates of sea ice in both horizontal and vertical dimensions after the mutation time were higher than those before the mutation.
Al-Ghussain L. 2019. Global warming: review on driving forces and mitigation. Environmental Progress & Sustainable Energy, 38(1): 13–21, doi: 10.1002/ep.13041
Årthun M, Eldevik T, Smedsrud L H. 2019. The role of atlantic heat transport in future arctic winter sea ice loss. Journal of Climate, 32(11): 3327–3341, doi: 10.1175/jcli-d-18-0750.1
Bitz C M, Roe G H. 2004. A mechanism for the high rate of sea ice thinning in the Arctic Ocean. Journal of Climate, 17(18): 3623–3632, doi: 10.1175/1520-0442(2004)017<3623:Amfthr>2.0.Co;2
Blanchard-Wrigglesworth E, Bitz C M. 2014. Characteristics of Arctic sea-ice thickness variability in GCMs. Journal of Climate, 27(21): 8244–8258, doi: 10.1175/jcli-d-14-00345.1
Cai Qiongqiong, Wang Jia, Beletsky D, et al. 2021. Accelerated decline of summer Arctic sea ice during 1850–2017 and the amplified Arctic warming during the recent decades. Environmental Research Letters, 16(3): 034015, doi: 10.1088/1748-9326/abdb5f
Carvalho K S, Wang Shuo. 2020. Sea surface temperature variability in the Arctic Ocean and its marginal seas in a changing climate: Patterns and mechanisms. Global and Planetary Change, 193: 103265, doi: 10.1016/j.gloplacha.2020.103265
Cavalieri D J, Parkinson C L. 2012. Arctic sea ice variability and trends, 1979–2010. The Cryosphere, 6(4): 881–889, doi: 10.5194/tc-6-881-2012
Chen Jinlei, Kang Shichang, Chen Changsheng, et al. 2020. Changes in sea ice and future accessibility along the Arctic Northeast Passage. Global and Planetary Change, 195: 103319, doi: 10.1016/j.gloplacha.2020.103319
Chen Jinlei, Kang Shichang, Meng Xianhong, et al. 2019. Assessments of the Arctic amplification and the changes in the Arctic sea surface. Advances in Climate Change Research, 10(4): 193–202, doi: 10.1016/j.accre.2020.03.002
Chen Ping, Zhao Jinping. 2017. Variation of sea ice extent in different regions of the Arctic Ocean. Acta Oceanologica Sinica, 36(8): 9–19, doi: 10.1007/s13131-016-0886-x
Chylek P, Folland C, Klett J D, et al. 2022. Annual mean arctic amplification 1970–2020: observed and simulated by CMIP6 climate models. Geophysical Research Letters, 49(13): e2022GL099371, doi: 10.1029/2022gl099371
Collow T W, Wang Wanqiu, Kumar A, et al. 2015. Improving arctic sea ice prediction using PIOMAS initial sea ice thickness in a coupled ocean-atmosphere model. Monthly Weather Review, 143(11): 4618–4630, doi: 10.1175/mwr-d-15-0097.1
Dammann D O, Eriksson L E B, Mahoney A R, et al. 2018. Mapping arctic bottomfast sea ice using SAR interferometry. Remote Sensing, 10(5): 720, doi: 10.3390/rs10050720
Dawson G, Landy J, Tsamados M, et al. 2022. A 10-year record of Arctic summer sea ice freeboard from CryoSat-2. Remote Sensing of Environment, 268: 112744, doi: 10.1016/j.rse.2021.112744
Deser C, Teng Haiyan. 2008. Evolution of Arctic sea ice concentration trends and the role of atmospheric circulation forcing, 1979–2007. Geophysical Research Letters, 35(2): L02504, doi: 10.1029/2007GL032023
Dethleff D, Kuhlmann G. 2010. Fram Strait sea-ice sediment provinces based on silt and clay compositions identify Siberian Kara and Laptev seas as main source regions. Polar Research, 29(3): 265–282, doi: 10.1111/j.1751-8369.2010.00149.x
Dong Chunming, Luo Xiaofan, Nie Hongtao, et al. 2023. Effect of compressive strength on the performance of the NEMO-LIM model in Arctic Sea ice simulation. Journal of Oceanology and Limnology, 41(1): 1–16, doi: 10.1007/s00343-022-1241-z
Dörr J, Årthun M, Eldevik T, et al. 2021. Mechanisms of regional winter sea-ice variability in a warming arctic. Journal of Climate, 34(21): 8635–8653, doi: 10.1175/jcli-d-21-0149.1
Eisenman I. 2010. Geographic muting of changes in the Arctic sea ice cover. Geophysical Research Letters, 37(6): L16501, doi: 10.1029/2010gl043741
Feng Jiajun, Zhang Yuanzhi, Cheng Qiuming, et al. 2022. Pan-Arctic melt pond fraction trend, variability, and contribution to sea ice changes. Global and Planetary Change, 217: 103932, doi: 10.1016/j.gloplacha.2022.103932
Geng Mingming, Wang Kelin, Yang Nan, et al. 2021. Evaluation and variation trends analysis of water quality in response to water regime changes in a typical river-connected lake (Dongting Lake), China. Environmental Pollution, 268: 115761, doi: 10.1016/j.envpol.2020.115761
Gocic M, Trajkovic S. 2013. Analysis of changes in meteorological variables using Mann-Kendall and Sen’s slope estimator statistical tests in Serbia. Global and Planetary Change, 100: 172–182, doi: 10.1016/j.gloplacha.2012.10.014
Hamed K H, Rao A R. 1998. A modified Mann-Kendall trend test for autocorrelated data. Journal of Hydrology, 204(1–4): 182–196, doi: 10.1016/s0022-1694(97)00125-x
Huang Yiyi, Dong Xiquan, Bailey D A, et al. 2019. Thicker clouds and accelerated Arctic sea ice decline: The atmosphere-sea ice interactions in spring. Geophysical Research Letters, 46(12): 6980–6989, doi: 10.1029/2019GL082791
Huang Fei, Zhou Xiao, Wang Hong. 2017. Arctic sea ice in CMIP5 climate model projections and their seasonal variability. Acta Oceanologica Sinica, 36(8): 1–8, doi: 10.1007/s13131-017- 1029-8
Johansson A M, King J A, Doulgeris A P, et al. 2017. Combined observations of Arctic sea ice with near-coincident colocated X-band, C-band, and L-band SAR satellite remote sensing and helicopter-borne measurements. Journal of Geophysical Research: Oceans, 122(1): 669–691, doi: 10.1002/2016jc012273
Kendall M G. 1975. Rank Correlation Methods. 4th ed. London: Charles Griffin
Kumar A, Yadav J, Mohan R. 2020. Global warming leading to alarming recession of the Arctic sea-ice cover: Insights from remote sensing observations and model reanalysis. Heliyon, 6(7): e04355, doi: 10.1016/j.heliyon.2020.e04355
Kumar A, Yadav J, Mohan R. 2021. Spatio-temporal change and variability of Barents-Kara sea ice, in the Arctic: Ocean and atmospheric implications. Science of the Total Environment, 753: 142046, doi: 10.1016/j.scitotenv.2020.142046
Kwok R, Cunningham G F. 2015. Variability of Arctic sea ice thickness and volume from CryoSat-2. Philosophical Transactions of the Royal Society A-Mathematical, Physical and Engineering Sciences, 373(2045): 20140157, doi: 10.1098/rsta.2014.0157
Labe Z, Magnusdottir G, Stern H. 2018. Variability of arctic sea ice thickness using PIOMAS and the CESM large ensemble. Journal of Climate, 31(8): 3233–3247, doi: 10.1175/jcli-d-17-0436.1
Landy J C, Dawson G J, Tsamados M, et al. 2022. A year-round satellite sea-ice thickness record from CryoSat-2. Nature, 609(7927): 517–522, doi: 10.1038/s41586-022-05058-5
Lang A, Yang Shuting, Kaas E. 2017. Sea ice thickness and recent Arctic warming. Geophysical Research Letters, 44(1): 409–418, doi: 10.1002/2016gl071274
Laxon S W, Giles K A, Ridout A L, et al. 2013. CryoSat-2 estimates of Arctic sea ice thickness and volume. Geophysical Research Letters, 40(4): 732–737, doi: 10.1002/grl.50193
Lei Ruibo, Cheng Bin, Hoppmann M, et al. 2022. Seasonality and timing of sea ice mass balance and heat fluxes in the Arctic transpolar drift during 2019–2020. Elementa-Science of the Anthropocene, 10(1): 000089, doi: 10.1525/elementa.2021.000089
Lei Ruibo, Tian-Kunze X, Leppäranta M, et al. 2016. Changes in summer sea ice, albedo, and portioning of surface solar radiation in the Pacific sector of Arctic Ocean during 1982–2009. Journal of Geophysical Research: Oceans, 121(8): 5470–5486, doi: 10.1002/2016JC011831
Li Zixuan, Zhao Jiechen, Su Jie, et al. 2020. Spatial and temporal variations in the extent and thickness of arctic landfast ice. Remote Sensing, 12(1): 64, doi: 10.3390/rs12010064
Markus T, Stroeve J C, Miller J. 2009. Recent changes in Arctic sea ice melt onset, freezeup, and melt season length. Journal of Geophysical Research: Oceans, 114(C12): C12024, doi: 10.1029/2009jc005436
Notz D, Community S. 2020. Arctic sea ice in CMIP6. Geophysical Research Letters, 47(10): e2019GL086749, doi: 10.1029/2019gl086749
Onarheim I H, Eldevik T, Smedsrud L H, et al. 2018. Seasonal and regional manifestation of Arctic Sea Ice loss. Journal of Climate, 31(12): 4917–4932, doi: 10.1175/jcli-d-17-0427.1
Ono J, Watanabe M, Komuro Y, et al. 2022. Enhanced Arctic warming amplification revealed in a low-emission scenario. Communications Earth & Environment, 3(1): 27, doi: 10.1038/s43247-022-00354-4
Parkinson C L, Cavalieri D J. 2008. Arctic sea ice variability and trends, 1979–2006. Journal of Geophysical Research: Oceans, 113(C7): C07003, doi: 10.1029/2007JC004558
Parkinson C L, Cavalieri D J, Gloersen P, et al. 1999. Arctic sea ice extents, areas, and trends, 1978–1996. Journal of Geophysical Research: Oceans, 104(C9): 20837–20856, doi: 10.1029/1999jc900082
Parkinson C L, DiGirolamo N E. 2021. Sea ice extents continue to set new records: Arctic, Antarctic, and global results. Remote Sensing of Environment, 267: 112753, doi: 10.1016/j.rse.2021.112753
Perovich D K, Richter-Menge J A. 2009. Loss of sea ice in the Arctic. Annual Review of Marine Science, 1: 417–441, doi: 10.1146/annurev.marine.010908.163805
Polyakov I V, Mayer M, Tietsche S, et al. 2022. Climate change fosters competing effects of dynamics and thermodynamics in seasonal predictability of Arctic sea ice. Journal of Climate, 35(9): 2849–2865, doi: 10.1175/jcli-d-21-0463.1
Ricker R, Hendricks S, Kaleschke L, et al. 2017. A weekly Arctic sea-ice thickness data record from merged CryoSat-2 and SMOS satellite data. The Cryosphere, 11(4): 1607–1623, doi: 10.5194/tc-11-1607-2017
Roach L A, Eisenman I, Wagner T J W, et al. 2022. Asymmetry in the seasonal cycle of Antarctic sea ice driven by insolation. Nature Geoscience, 15(4): 277–281, doi: 10.1038/s41561-022-00913-6
Schweiger A, Lindsay R, Zhang Jinlun, et al. 2011. Uncertainty in modeled Arctic sea ice volume. Journal of Geophysical Research: Oceans, 116(C8): C00D06, doi: 10.1029/2011jc007084
Serreze M C, Holland M M, Stroeve J. 2007. Perspectives on the Arctic’s shrinking sea-ice cover. Science, 315(5818): 1533–1536, doi: 10.1126/science.1139426
Serreze M C, Meier W N. 2019. The Arctic’s sea ice cover: trends, variability, predictability, and comparisons to the Antarctic. Annals of the New York Academy of Sciences, 1436(1): 36–53, doi: 10.1111/nyas.13856
Shamshiri R, Eide E, Høyland K V. 2022. Spatio-temporal distribution of sea-ice thickness using a machine learning approach with Google Earth Engine and Sentinel-1 GRD data. Remote Sensing of Environment, 270: 112851, doi: 10.1016/j.rse.2021.112851
Shi H, Lee S M, Sohn B J, et al. 2023. Estimation of arctic winter snow depth, sea ice thickness and bulk density, and ice freeboard by combining CryoSat-2, AVHRR, and AMSR measurements. IEEE Transactions on Geoscience and Remote Sensing, 61: 4300718, doi: 10.1109/tgrs.2023.3265274
Stroeve J, Notz D. 2018. Changing state of Arctic sea ice across all seasons. Environmental Research Letters, 13(10): 103001, doi: 10.1088/1748-9326/aade56
Tilling R L, Ridout A, Shepherd A. 2018. Estimating Arctic sea ice thickness and volume using CryoSat-2 radar altimeter data. Advances in Space Research, 62(6): 1203–1225, doi: 10.1016/j.asr.2017.10.051
Von Albedyll L, Hendricks S, Grodofzig R, et al. 2022. Thermodynamic and dynamic contributions to seasonal Arctic sea ice thickness distributions from airborne observations. Elementa: Science of the Anthropocene, 10(1), doi: 10.1525/elementa.2021.00074
Wang Yunhe, Bi Haibo, Huang Haijun, et al. 2019. Satellite-observed trends in the Arctic sea ice concentration for the period 1979–2016. Journal of Oceanology and Limnology, 37(1): 18–37, doi: 10.1007/s00343-019-7284-0
Wang Xiaoli, Hou Xiyong, Wang Yuandong. 2017. Spatiotemporal variations and regional differences of extreme precipitation events in the Coastal area of China from 1961 to 2014. Atmospheric Research, 197: 94–104, doi: 10.1016/j.atmosres.2017.06.022
Wang Xuanji, Key J, Kwok R, et al. 2016. Comparison of Arctic Sea Ice thickness from satellites, aircraft, and PIOMAS data. Remote Sensing, 8(9): 713, doi: 10.3390/rs8090713
Wang Mingfeng, König M, Oppelt N. 2021. Partial shape recognition for sea ice motion retrieval in the marginal ice zone from Sentinel-1 and Sentinel-2. Remote Sensing, 13(21): 4473, doi: 10.3390/rs13214473
Wang Zongliang, Li Zhen, Zeng Jiangyuan, et al. 2020. Spatial and temporal variations of Arctic sea ice from 2002 to 2017. Earth and Space Science, 7(9): e2020EA001278, doi: 10.1029/2020ea001278
Wang Jia, Zhang Jinlun, Watanabe E, et al. 2009. Is the dipole anomaly a major driver to record lows in Arctic summer sea ice extent?. Geophysical Research Letters, 36(5): L05706, doi: 10.1029/2008GL036706
Wei Fengying. 2007. Modern Climatic Statistical Diagnosis and Prediction Technology (in Chinese). 2nd ed. Beijing: China Meteorological Press, 1–256
Wu Fengmin, He Jinhai, Qi Li, et al. 2014. The seasonal difference of Arctic warming and it’s mechanism under sea ice cover diminishing. Haiyang Xuebao (in Chinese), 36(3): 39–47, doi: 10.3969/j.issn.0253-4193.2014.03.005
Wu Hongqian, Zhang Ren, Wang Yangjun, et al. 2021. Analyzing the effects of sea ice melting and atmospheric heat transport on the warming around arctic based on comparable analysis and coupling modes. Atmospheric Research, 258: 105630, doi: 10.1016/j.atmosres.2021.105630
Xiao Cunde, Yang Jiao, Zhang Tong, et al. 2022. The predictability, irreversibility and deep uncertainty of cryospheric change. Climate Change Research (in Chinese), 18(1): 1–11, doi: 10.12006/j.issn.1673-1719.2021.247
Xiao Feng, Zhang Shengkai, Li Jiaxing, et al. 2021. Arctic sea ice thickness variations from CryoSat-2 satellite altimetry data. Science China Earth Sciences, 64(7): 1080–1089, doi: 10.1007/s11430-020-9777-9
Yadav J, Kumar A, Mohan R. 2020. Dramatic decline of Arctic sea ice linked to global warming. Natural Hazards, 103(2): 2617–2621, doi: 10.1007/s11069-020-04064-y
You Qinglong, Cai Ziyi, Pepin N, et al. 2021. Warming amplification over the Arctic Pole and Third Pole: Trends, mechanisms and consequences. Earth-science Reviews, 217: 103625, doi: 10.1016/j.earscirev.2021.103625
You Jia, Xu Zhenhua, Robertson R, et al. 2022. Geographical inhomogeneity and temporal variability of mixing property and driving mechanism in the Arctic Ocean. Journal of Oceanology and Limnology, 40(3): 846–869, doi: 10.1007/s00343-021-1037-6
Zhang Peiwen, Li Qun, Xu Zhenhua, et al. 2022. Internal solitary wave generation by the tidal flows beneath ice keel in the Arctic Ocean. Journal of Oceanology and Limnology, 40(3): 831–845, doi: 10.1007/s00343-021-1052-7
Zhang Jinlun, Lindsay R, Steele M, et al. 2008. What drove the dramatic retreat of arctic sea ice during summer 2007?. Geophysical Research Letters, 35(11): L11505, doi: 10.1029/2008GL034005
Zhang Jinlun, Rothrock D A. 2003. Modeling global sea ice with a thickness and enthalpy distribution model in generalized curvilinear coordinates. Monthly Weather Review, 131(5): 845–861, doi: 10.1175/1520-0493(2003)131<0845:Mgsiwa>2.0.Co;2
Zhang Jinlun, Steele M, Schweiger A. 2010. Arctic sea ice response to atmospheric forcings with varying levels of anthropogenic warming and climate variability. Geophysical Research Letters, 37(20): L20505, doi: 10.1029/2010gl044988
Figure 1. Location map of sub-regions in the Arctic. 1. Beaufort Sea, 2. Chukchi Sea, 3. East Siberian Sea, 4. Laptev Sea, 5. Kara Sea, 6. Barents Sea, 7. Greenland Sea, 8. Baffin Bay & Gulf of St. Lawrence Sea, 9. Canadian Archipelago, 10. Hudson Bay, 11. Central Arctic, and 12. Bering Sea & Sea of Okhotsk.
Figure 2. Technical flow chart of this study.
Figure 3. The annual (a) and seasonal (b–e) variations of sea ice area (SIA) during 1979 to 2020. The red dashed line represents the trend line.
Figure 4. The annual (a) and seasonal (b−e) variations of sea ice thickness (SIT) during 1979 to 2020. The red dashed line represents the trend line.
Figure 5. Spatial patterns of Arctic sea ice concentration (SIC). a and b indicate the initial and final states of SIC in 1979 and 2020, respectively, and c and d represent the annual trend rate of SIC and its P-value of significance test, respectively.
Figure 6. Spatial patterns of Arctic Sea ice thickenss (SIT). a and b indicate the initial and final states of SIT in 1979 and 2020, respectively; c and d represent the annual trend rate of SIT and its P-value of significance test, respectively.
Figure 7. The monthly changes of sea ice area and sea ice thickness in the 12 sub-regions from 1979 to 2020. a. Beaufort Sea, b. Chukchi Sea, c. East Siberian Sea, d. Laptev Sea, e. Kara Sea, f. Barents Sea, g. Greenland Sea, h. Baffin Bay & Gulf of St. Lawrence Sea, i. Canadian Archipelago, j. Hudson Bay, k. Central Arctic, and l. Bering Sea & Sea of Okhotsk.
Figure 8. The annual variation of sea ice melting and freezing amount in the horizontal dimension (a) and vertical dimension (b) during 1980 to 2020.
Figure 9. M-K mutation test for the changes in the amount of sea ice melting and freezing in the horizontal (a and b) and vertical dimensions (c and d) from 1980 to 2020.


 DownLoad:


 DownLoad:


 DownLoad: