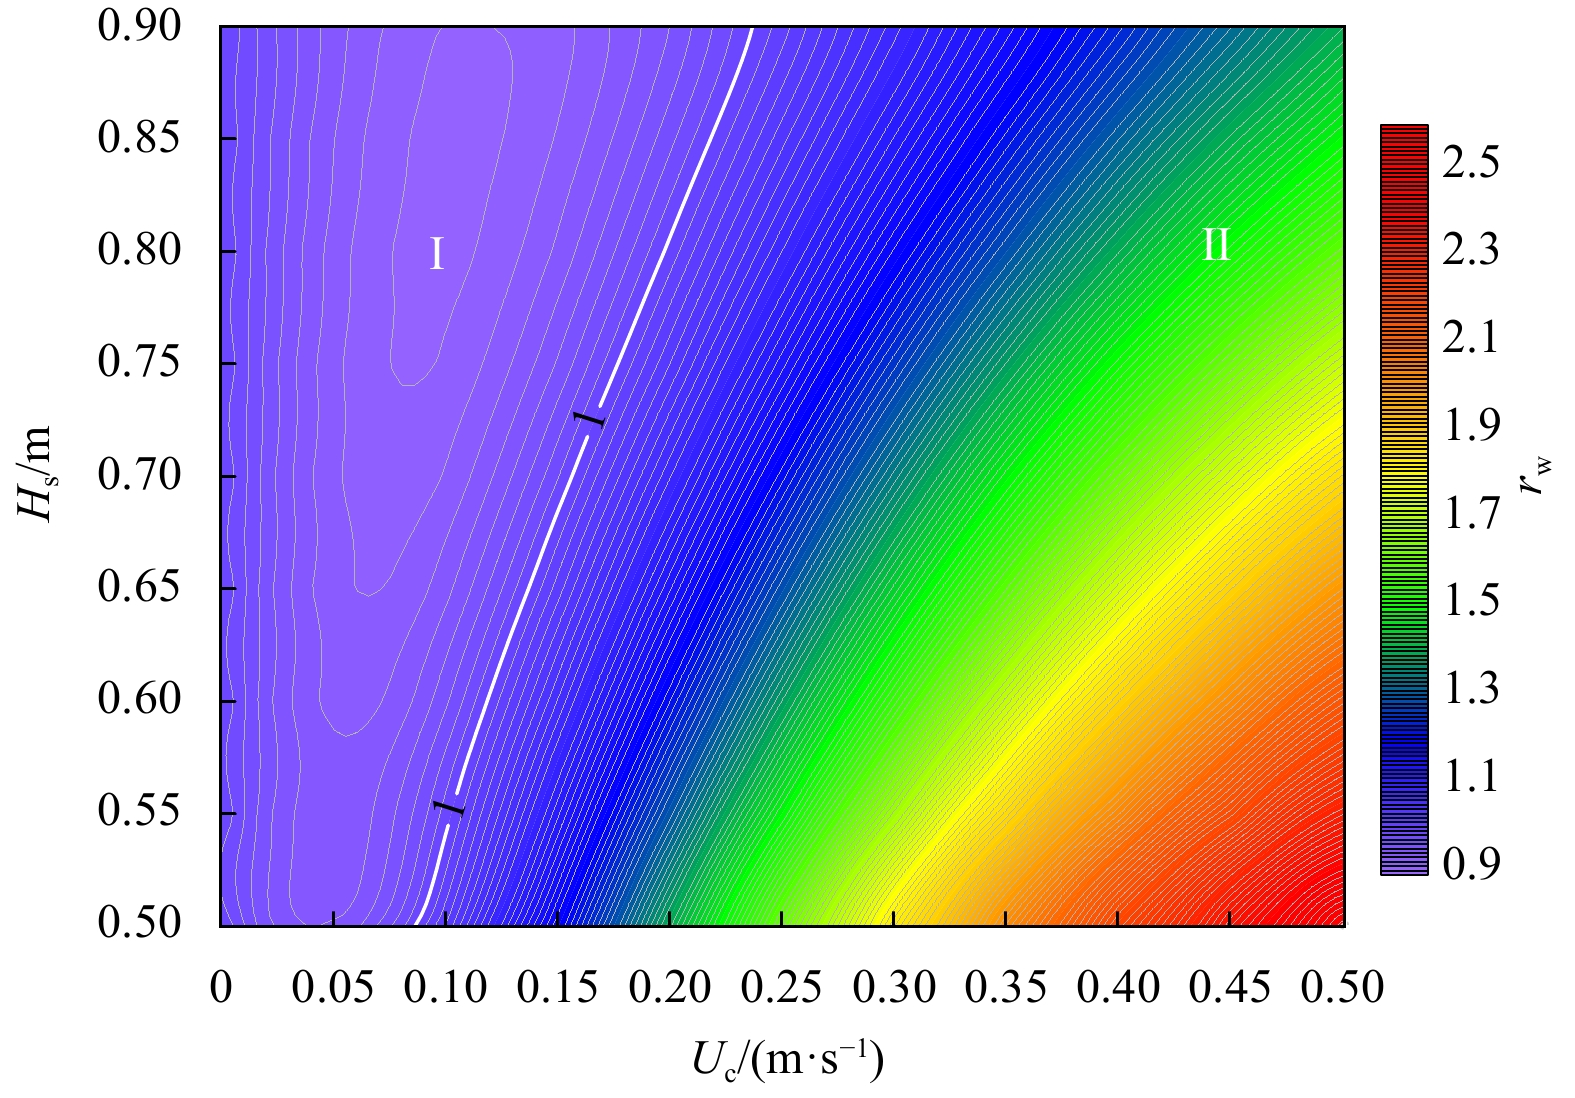
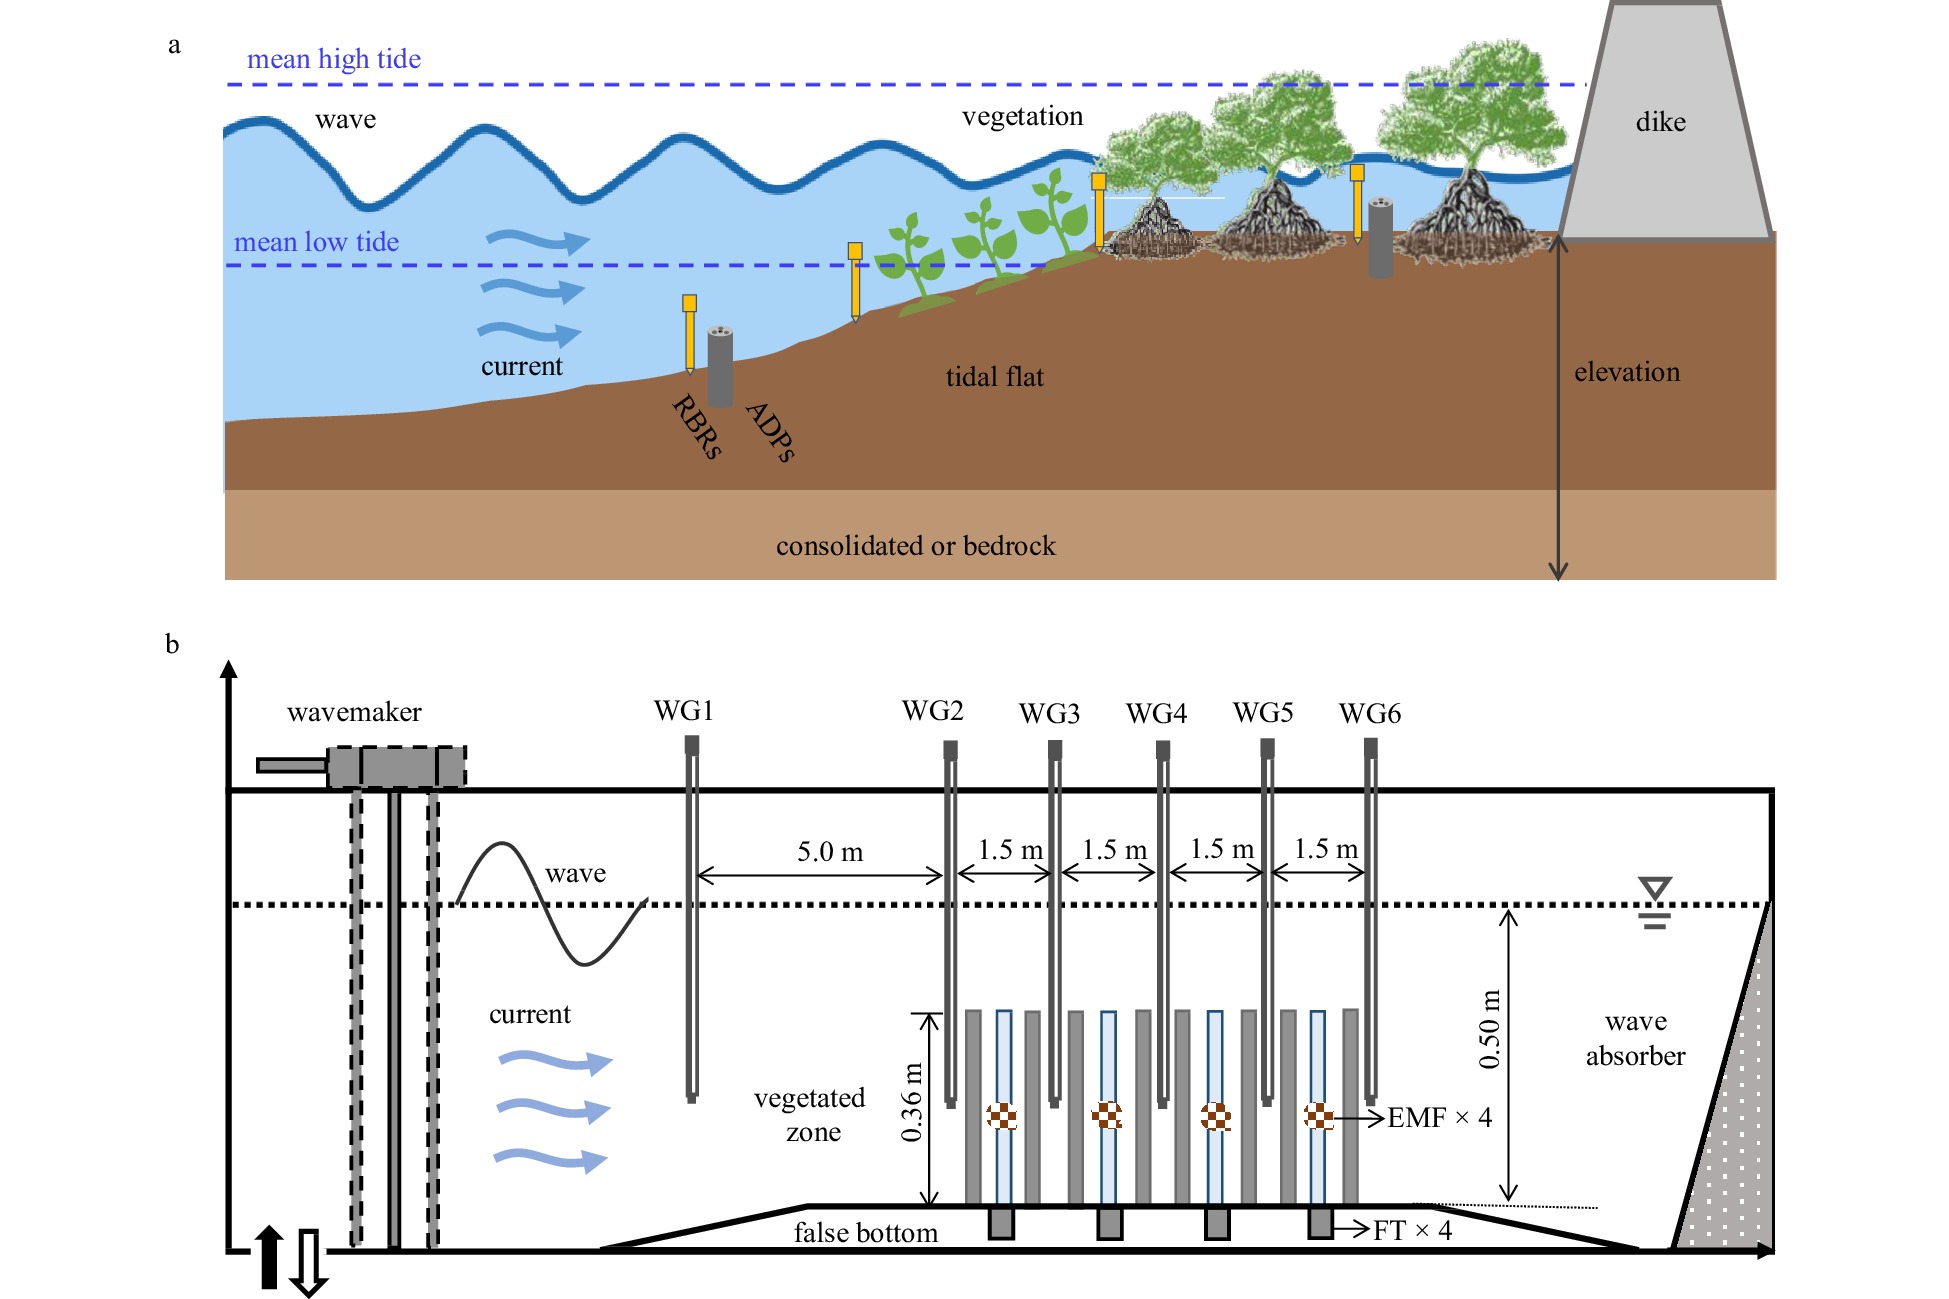
| Citation: | Hong Wang, Zhan Hu. Modeling wave attenuation by vegetation with accompanying currents in SWAN[J]. Acta Oceanologica Sinica, 2023, 42(12): 63-76. doi: 10.1007/s13131-023-2199-1

|

|
Baron-Hyppolite C, Lashley C H, Garzon J, et al. 2019. Comparison of implicit and explicit vegetation representations in SWAN hindcasting wave dissipation by coastal wetlands in Chesapeake Bay. Geosciences, 9(1): 8. doi: 10.3390/geosciences9010008
|
|
Cao Haijin, Feng Weibing, Hu Zhan, et al. 2015. Numerical modeling of vegetation-induced dissipation using an extended mild-slope equation. Ocean Engineering, 110: 258–269. doi: 10.1016/j.oceaneng.2015.09.057
|
|
Chen Ming, Lou Sha, Liu Shuguang, et al. 2020. Velocity and turbulence affected by submerged rigid vegetation under waves, currents and combined wave-current flows. Coastal Engineering, 159: 103727. doi: 10.1016/j.coastaleng.2020.103727
|
|
Chen Hui, Ni Yan, Li Yulong, et al. 2018. Deriving vegetation drag coefficients in combined wave-current flows by calibration and direct measurement methods. Advances in Water Resources, 122: 217–227. doi: 10.1016/j.advwatres.2018.10.008
|
|
Dai Zhijun, Ge Zhenming. 2022. Research and Practice of Green Ecological Coastal Defense. Beijing: Science Press, 104–130
|
|
Dalrymple R A, Kirby J T, Hwang P A. 1984. Wave diffraction due to areas of energy dissipation. Journal of Waterway, Port, Coastal, and Ocean Engineering, 110(1): 67–79
|
|
De Dominicis M, Wolf J, van Hespen R, et al. 2023. Mangrove forests can be an effective coastal defence in the Pearl River Delta, China. Communications Earth & Environment, 4(1): 13. doi: 10.1038/s43247-022-00672-7
|
|
Garzon J L, Maza M, Ferreira C M, et al. 2019. Wave attenuation by Spartina saltmarshes in the Chesapeake Bay under storm surge conditions. Journal of Geophysical Research: Oceans, 124(7): 5220–5243. doi: 10.1029/2018JC014865
|
|
Hoque A, Husrin S, Oumeraci H. 2018. Laboratory studies of wave attenuation by coastal forest under storm surge. Coastal Engineering Journal, 60(2): 225–238. doi: 10.1080/21664250.2018.1486268
|
|
Hu Zhan, Lian Simei, Wei Huaiyu, et al. 2021. Laboratory data on wave propagation through vegetation with following and opposing currents. Earth System Science Data, 13(10): 4987–4999. doi: 10.5194/essd-13-4987-2021
|
|
Hu Zhan, Lian Simei, Zitman T, et al. 2022. Wave breaking induced by opposing currents in submerged vegetation canopies. Water Resources Research, 58(4): e2021WR031121. doi: 10.1029/2021WR031121
|
|
Hu Zhan, Suzuki T, Zitman T, et al. 2014. Laboratory study on wave dissipation by vegetation in combined current-wave flow. Coastal Engineering, 88: 131–142. doi: 10.1016/j.coastaleng.2014.02.009
|
|
Hu Zhan, Zhou Juanling, Wang Chen, et al. 2020. A novel instrument for bed dynamics observation supports machine learning applications in mangrove biogeomorphic processes. Water Resources Research, 56(7): e2020WR027257. doi: 10.1029/2020WR027257
|
|
Hudspeth R T, Sulisz W. 1991. Stokes drift in two-dimensional wave flumes. Journal of Fluid Mechanics, 230: 209–229. doi: 10.1017/S0022112091000769
|
|
Lara J L, Maza M, Ondiviela B, et al. 2016. Large-scale 3-D experiments of wave and current interaction with real vegetation. Part 1: Guidelines for physical modeling. Coastal Engineering, 107: 70–83. doi: 10.1016/j.coastaleng.2015.09.012
|
|
Li C W, Yan K. 2007. Numerical investigation of wave-current-vegetation interaction. Journal of Hydraulic Engineering, 133(7): 794–803. doi: 10.1061/(ASCE)0733-9429(2007)133:7(794
|
|
Loder N M, Irish J L, Cialone M A G, et al. 2009. Sensitivity of hurricane surge to morphological parameters of coastal wetlands. Estuarine, Coastal and Shelf Science, 84(4): 625–636
|
|
Longuet-Higgins M S, Stewart R W. 1960. Changes in the form of short gravity waves on long waves and tidal currents. Journal of Fluid Mechanics, 8(4): 565–583. doi: 10.1017/S0022112060000803
|
|
Longuet-Higgins M S, Stewart R W. 1961. The changes in amplitude of short gravity waves on steady non-uniform currents. Journal of Fluid Mechanics, 10(4): 529–549. doi: 10.1017/S0022112061000342
|
|
Losada I J, Maza M, Lara J L. 2016. A new formulation for vegetation-induced damping under combined waves and currents. Coastal Engineering, 107: 1–13. doi: 10.1016/j.coastaleng.2015.09.011
|
|
Maza M, Lara J L, Losada I J, et al. 2015. Large-scale 3-D experiments of wave and current interaction with real vegetation. Part 2: Experimental analysis. Coastal Engineering, 106: 73–86. doi: 10.1016/j.coastaleng.2015.09.010
|
|
Mendez F J, Losada I J. 2004. An empirical model to estimate the propagation of random breaking and nonbreaking waves over vegetation fields. Coastal Engineering, 51(2): 103–118. doi: 10.1016/j.coastaleng.2003.11.003
|
|
Möller I, Kudella M, Rupprecht F, et al. 2014. Wave attenuation over coastal salt marshes under storm surge conditions. Nature Geoscience, 7(10): 727–731. doi: 10.1038/NGEO2251
|
|
Morison J R, Johnson J W, Schaaf S A. 1950. The force exerted by surface waves on piles. Journal of Petroleum Technology, 2(5): 149–154. doi: 10.2118/950149-g
|
|
Neumann J E, Emanuel K A, Ravela S, et al. 2015. Risks of coastal storm surge and the effect of sea level rise in the Red River Delta, Vietnam. Sustainability, 7(6): 6553–6572. doi: 10.3390/su7066553
|
|
Ota T, Kobayashi N, Kirby J T. 2004. Wave and current interactions with vegetation. In: Coastal Engineering 2004. Lisbon, Portugal: World Scientific, 508–520,
|
|
Paul M, Bouma T J, Amos C L. 2012. Wave attenuation by submerged vegetation: Combining the effect of organism traits and tidal current. Marine Ecology Progress Series, 444: 31–41. doi: 10.3354/meps09489
|
|
Rupprecht F, Möller I, Paul M, et al. 2017. Vegetation-wave interactions in salt marshes under storm surge conditions. Ecological Engineering, 100: 301–315. doi: 10.1016/j.ecoleng.2016.12.030
|
|
Sheng Y P, Lapetina A, Ma Gangfeng. 2012. The reduction of storm surge by vegetation canopies: Three-dimensional simulations. Geophysical Research Letters, 39(20): L20601. doi: 10.1029/2012GL053577
|
|
Suzuki T, Zijlema M, Burger B, et al. 2012. Wave dissipation by vegetation with layer schematization in SWAN. Coastal Engineering, 59(1): 64–71. doi: 10.1016/j.coastaleng.2011.07.006
|
|
Tanaka N. 2009. Vegetation bioshields for tsunami mitigation: review of effectiveness, limitations, construction, and sustainable management. Landscape and Ecological Engineering, 5(1): 71–79. doi: 10.1007/s11355-008-0058-z
|
|
Tanaka N, Jinadasa K B S N, Mowjood M I M, et al. 2011. Coastal vegetation planting projects for tsunami disaster mitigation: effectiveness evaluation of new establishments. Landscape and Ecological Engineering, 7(1): 127–135. doi: 10.1007/s11355-010-0122-3
|
|
Temmerman S, Meire P, Bouma T J, et al. 2013. Ecosystem-based coastal defence in the face of global change. Nature, 504(7478): 79–83. doi: 10.1038/nature12859
|
|
The WAMDI Group. 1988. The WAM model—A third generation ocean wave prediction model. Journal of Physical Oceanography, 18(12): 1775–1810. doi: 10.1175/1520-0485(1988)018<1775:TWMTGO>2.0.CO;2
|
|
Vandenbruwaene W, Temmerman S, Bouma T J, et al. 2011. Flow interaction with dynamic vegetation patches: Implications for biogeomorphic evolution of a tidal landscape. Journal of Geophysical Research: Earth Surface, 116(F1): F01008. doi: 10.1029/2010JF001788
|
|
van Loon-Steensma J M, Hu Zhan, Slim P A. 2016. Modelled impact of vegetation heterogeneity and salt-marsh zonation on wave damping. Journal of Coastal Research, 32(2): 241–252. doi: 10.2112/JCOASTRES-D-15-00095.1
|
|
van Loon-Steensma J M, Slim P A, Decuyper M, et al. 2014. Salt-marsh erosion and restoration in relation to flood protection on the Wadden Sea barrier island Terschelling. Journal of Coastal Conservation, 18(4): 415–430. doi: 10.1007/s11852-014-0326-z
|
|
Vuik V, Jonkman S N, Borsje B W, et al. 2016. Nature-based flood protection: The efficiency of vegetated foreshores for reducing wave loads on coastal dikes. Coastal Engineering, 116: 42–56. doi: 10.1016/j.coastaleng.2016.06.001
|
|
Wang Jun, Yi Si, Li Mengya, et al. 2018. Effects of sea level rise, land subsidence, bathymetric change and typhoon tracks on storm flooding in the coastal areas of Shanghai. Science of the Total Environment, 621: 228–234. doi: 10.1016/j.scitotenv.2017.11.224
|
|
Wu Weicheng, Ma Gangfeng, Cox D T. 2016. Modeling wave attenuation induced by the vertical density variations of vegetation. Coastal Engineering, 112: 17–27. doi: 10.1016/j.coastaleng.2016.02.004
|
|
Yang Yongqian, Irish J L. 2018. Evolution of wave spectra in mound-channel wetland systems. Estuarine, Coastal and Shelf Science, 207: 444–456,
|
|
Yang Yongqian, Irish J L, Socolofsky S A. 2015. Numerical investigation of wave-induced flow in mound-channel wetland systems. Coastal Engineering, 102: 1–12. doi: 10.1016/j.coastaleng.2015.05.002
|
|
Yin Zegao, Wang Yanxu, Liu Yong, et al. 2020. Wave attenuation by rigid emergent vegetation under combined wave and current flows. Ocean Engineering, 213: 107632. doi: 10.1016/j.oceaneng.2020.107632
|
|
Zainali A, Marivela R, Weiss R, et al. 2018. Numerical simulation of nonlinear long waves in the presence of discontinuous coastal vegetation. Marine Geology, 396: 142–149. doi: 10.1016/j.margeo.2017.08.001
|
|
Zhang Wei, Ge Zhenming, Li Shihua, et al. 2022. The role of seasonal vegetation properties in determining the wave attenuation capacity of coastal marshes: implications for building natural defenses. Ecological Engineering, 175: 106494. doi: 10.1016/j.ecoleng.2021.106494
|
|
Zhang Xiaoxia, Lin Pengzhi, Nepf H. 2021. A simple-wave damping model for flexible marsh plants. Limnology and Oceanography, 66(12): 4182–4196. doi: 10.1002/lno.11952
|
|
Zhang Xiaoxia, Nepf H. 2021. Wave damping by flexible marsh plants influenced by current. Physical Review Fluids, 6(10): 100502. doi: 10.1103/PhysRevFluids.6.100502
|
|
Zhao Haihong, Chen Qin. 2014. Modeling attenuation of storm surge over deformable vegetation: methodology and verification. Journal of Engineering Mechanics, 140(12): 04014090. doi: 10.1061/(ASCE)EM.1943-7889.0000704
|
|
Zhao Chuyan, Tang Jun, Shen Yongming, et al. 2021. Study on wave attenuation in following and opposing currents due to rigid vegetation. Ocean Engineering, 236: 109574. doi: 10.1016/j.oceaneng.2021.109574
|
|
Zhao Chuyan, Zhang Yan, Tang Jun, et al. 2020. Numerical investigation of solitary wave run-up attenuation by patchy vegetation. Acta Oceanologica Sinica, 39(5): 105–114. doi: 10.1007/s13131-020-1572-6
|
|
Zhou Xiaoyan, Dai Zhijun, Pang Wenhong, et al. 2022. Wave attenuation over mangroves in the Nanliu Delta, China. Frontiers in Marine Science, 9: 874818. doi: 10.3389/fmars.2022.874818
|
|
Zheng Jinhai, Xu Wei, Tao Aifeng, et al. 2023. Synergy between coastal ecology and disaster mitigation in China: Policies, practices, and prospects. Ocean & Coastal Management, 245: 106866. doi: https://doi.org/10.1016/j.ocecoaman.2023.106866
|
Figures(9) / Tables(1)

Supported by:
Beijing Renhe Information Technology Co. Ltd


 DownLoad: