Biodiversity and Conservation Group (BIOCON), Instituto Universitario de Investigación en Acuicultura Sostenible y Ecosistemas Marinos (IU-ECOAQUA), Las Palmas de Gran Canaria 35001, Spain
Fragmentation entails the disruption of habitat continuity, leading to anticipated species mobility as a consequence of inter-patch connectivity. Variability in species richness and individual abundances is a natural outcome in such scenarios. Our objective was to examine the edge effect within fragmented intertidal macroalgae habitats, employing the associated epifauna as a study model. This study reveals disparities in both species richness and individual abundance within the epifauna community inhabiting intertidal macroalgae during the spring season. Samples were obtained from two distinct coastal locations characterized by fragmented habitats. This enabled us to assess the distinctions in communities impacted by the edge effect as well as spatial variations. The results indicate a trend where abundance tends to be higher in the innermost regions of the patch zone in one location, while species richness remains relatively consistent across different patch zones, i.e., edge, near-edge, and inner areas by descriptive univariate analysis and ANOVA. Margalef richness and Simpson dominance are consistently higher from inner areas to edge, whilst Pielou evenness showed the contrasting trend, being higher from edge to inner areas. The patch effect seems to be a primary driver of differences among epifaunal communities. Additionally, spatial variations contribute significantly to the variability observed in these communities by the permutational multivariate analysis of variance (PERMANOVA) and non-metric multidimensional scaling (n-MDS). To gain a comprehensive understanding of the edge effect, further investigations examining other substrates, different months, or additional locations are warranted.
Figure 1. Map of the island of Gran Canaria, showing the study locations.
Figure 2. An intertidal sampled patch showing the three parts (edge, near edge and inner area).
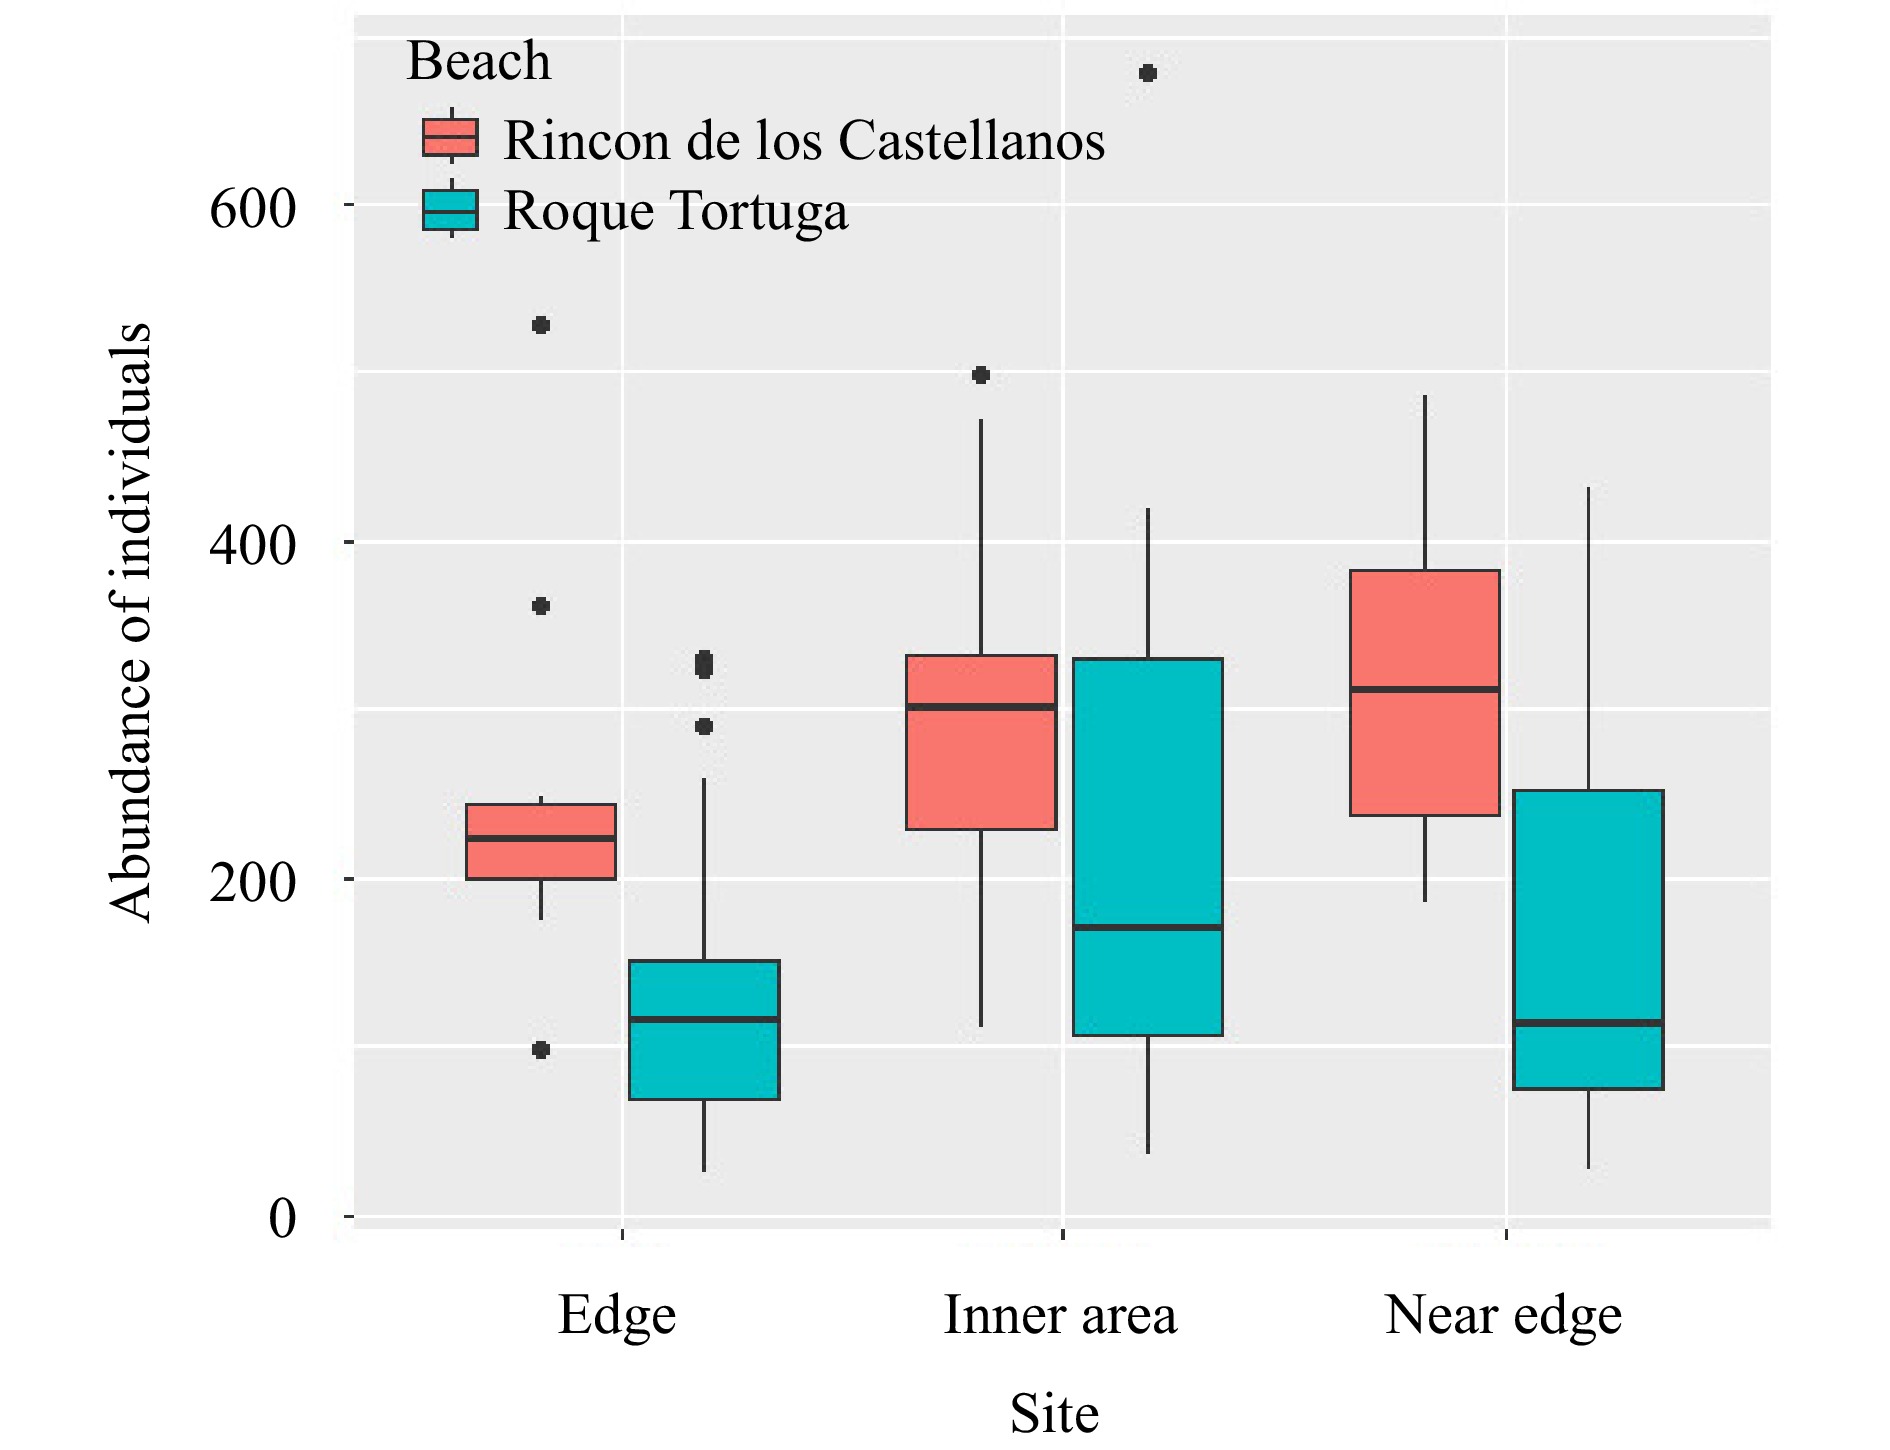
Figure 3. Individual abundance of epifauna at both sites.
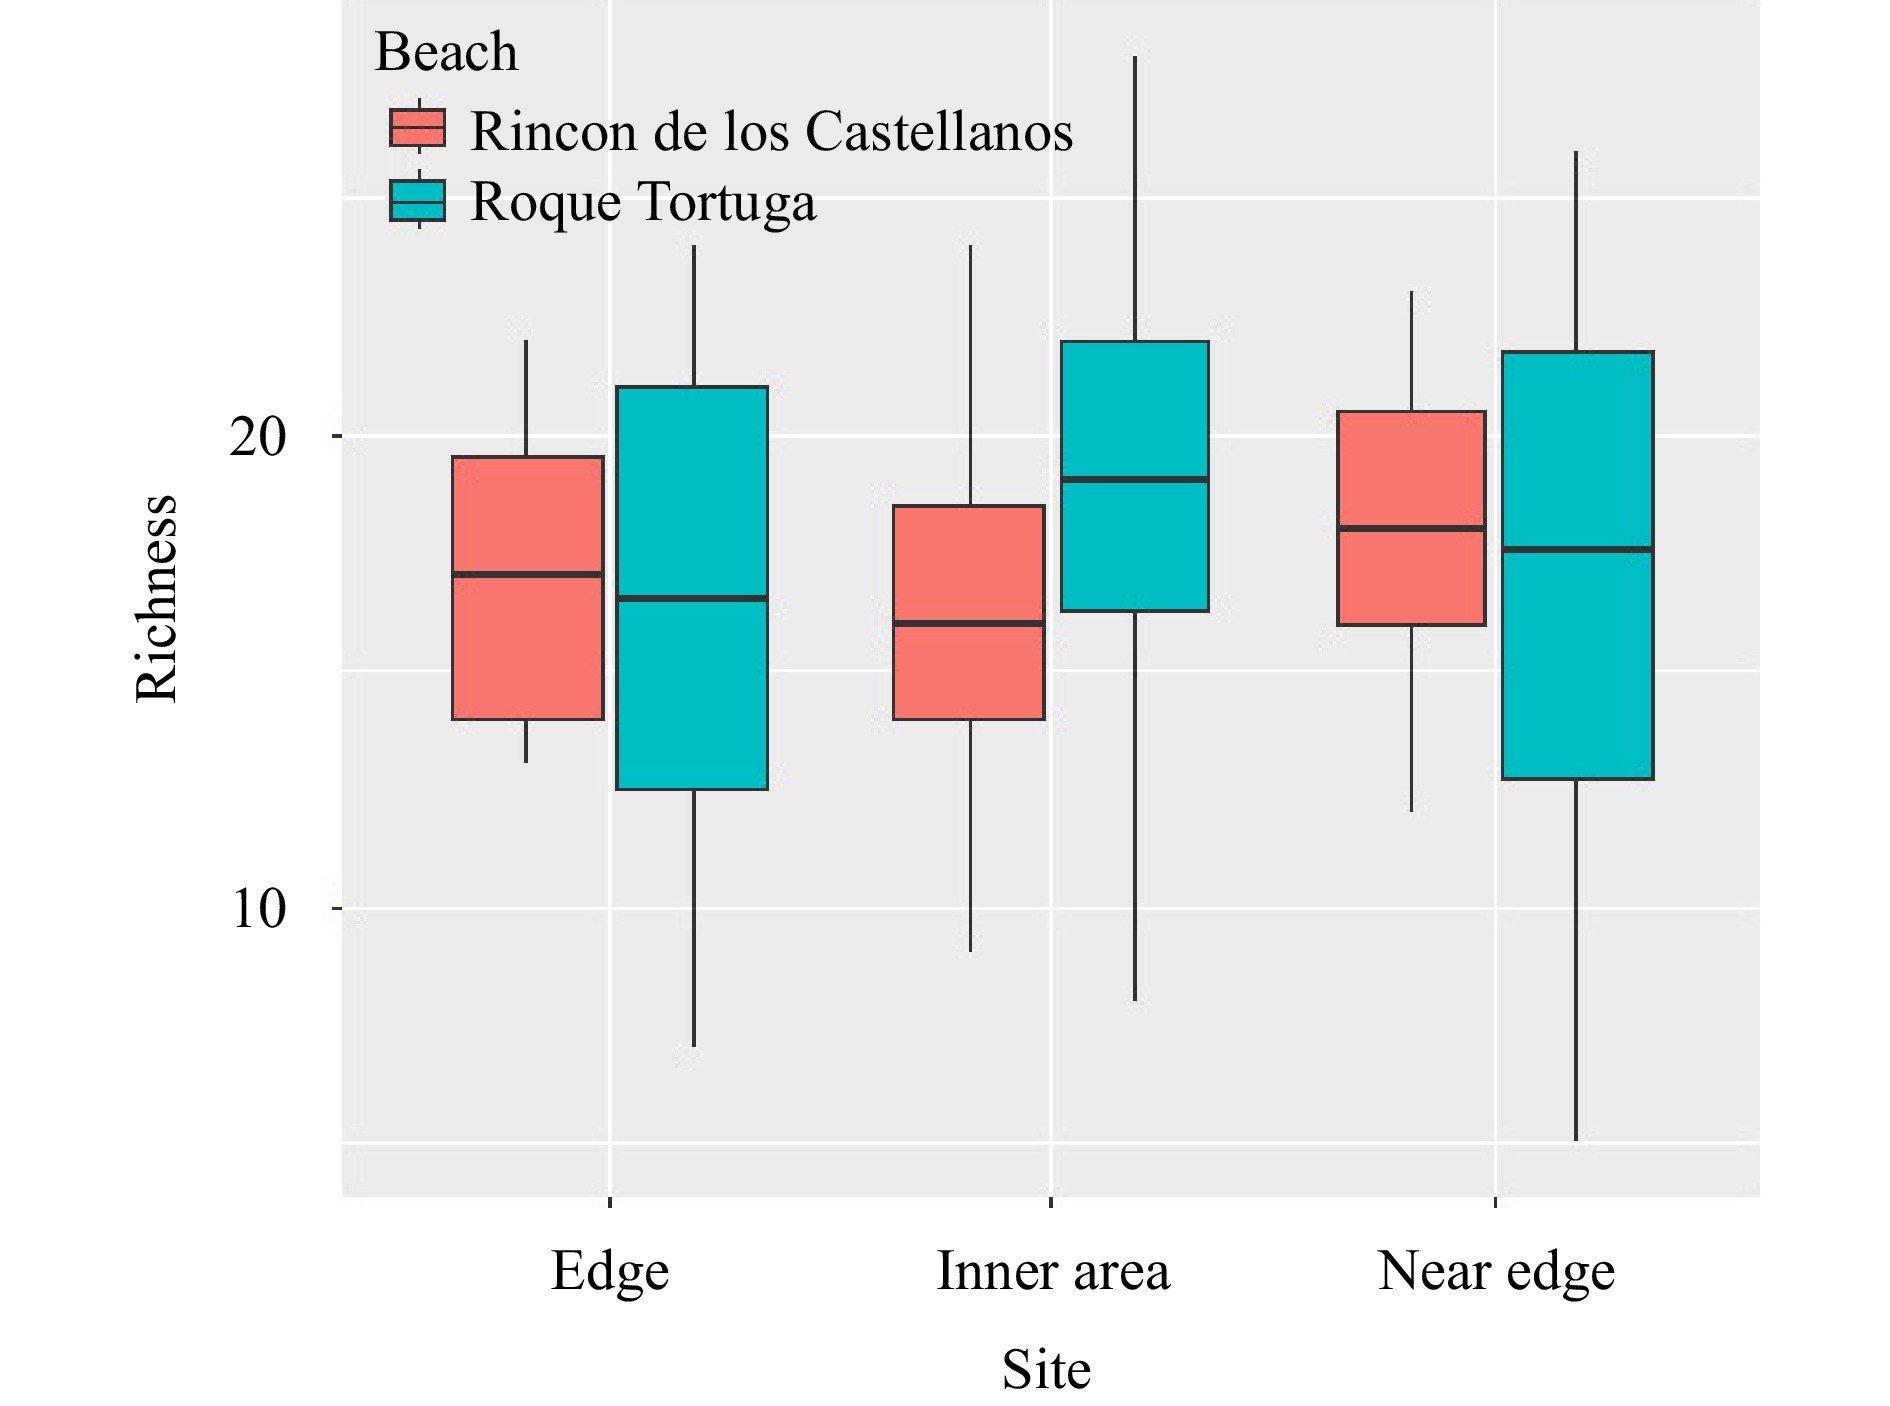
Figure 4. Species richness of epifauna at both sites.
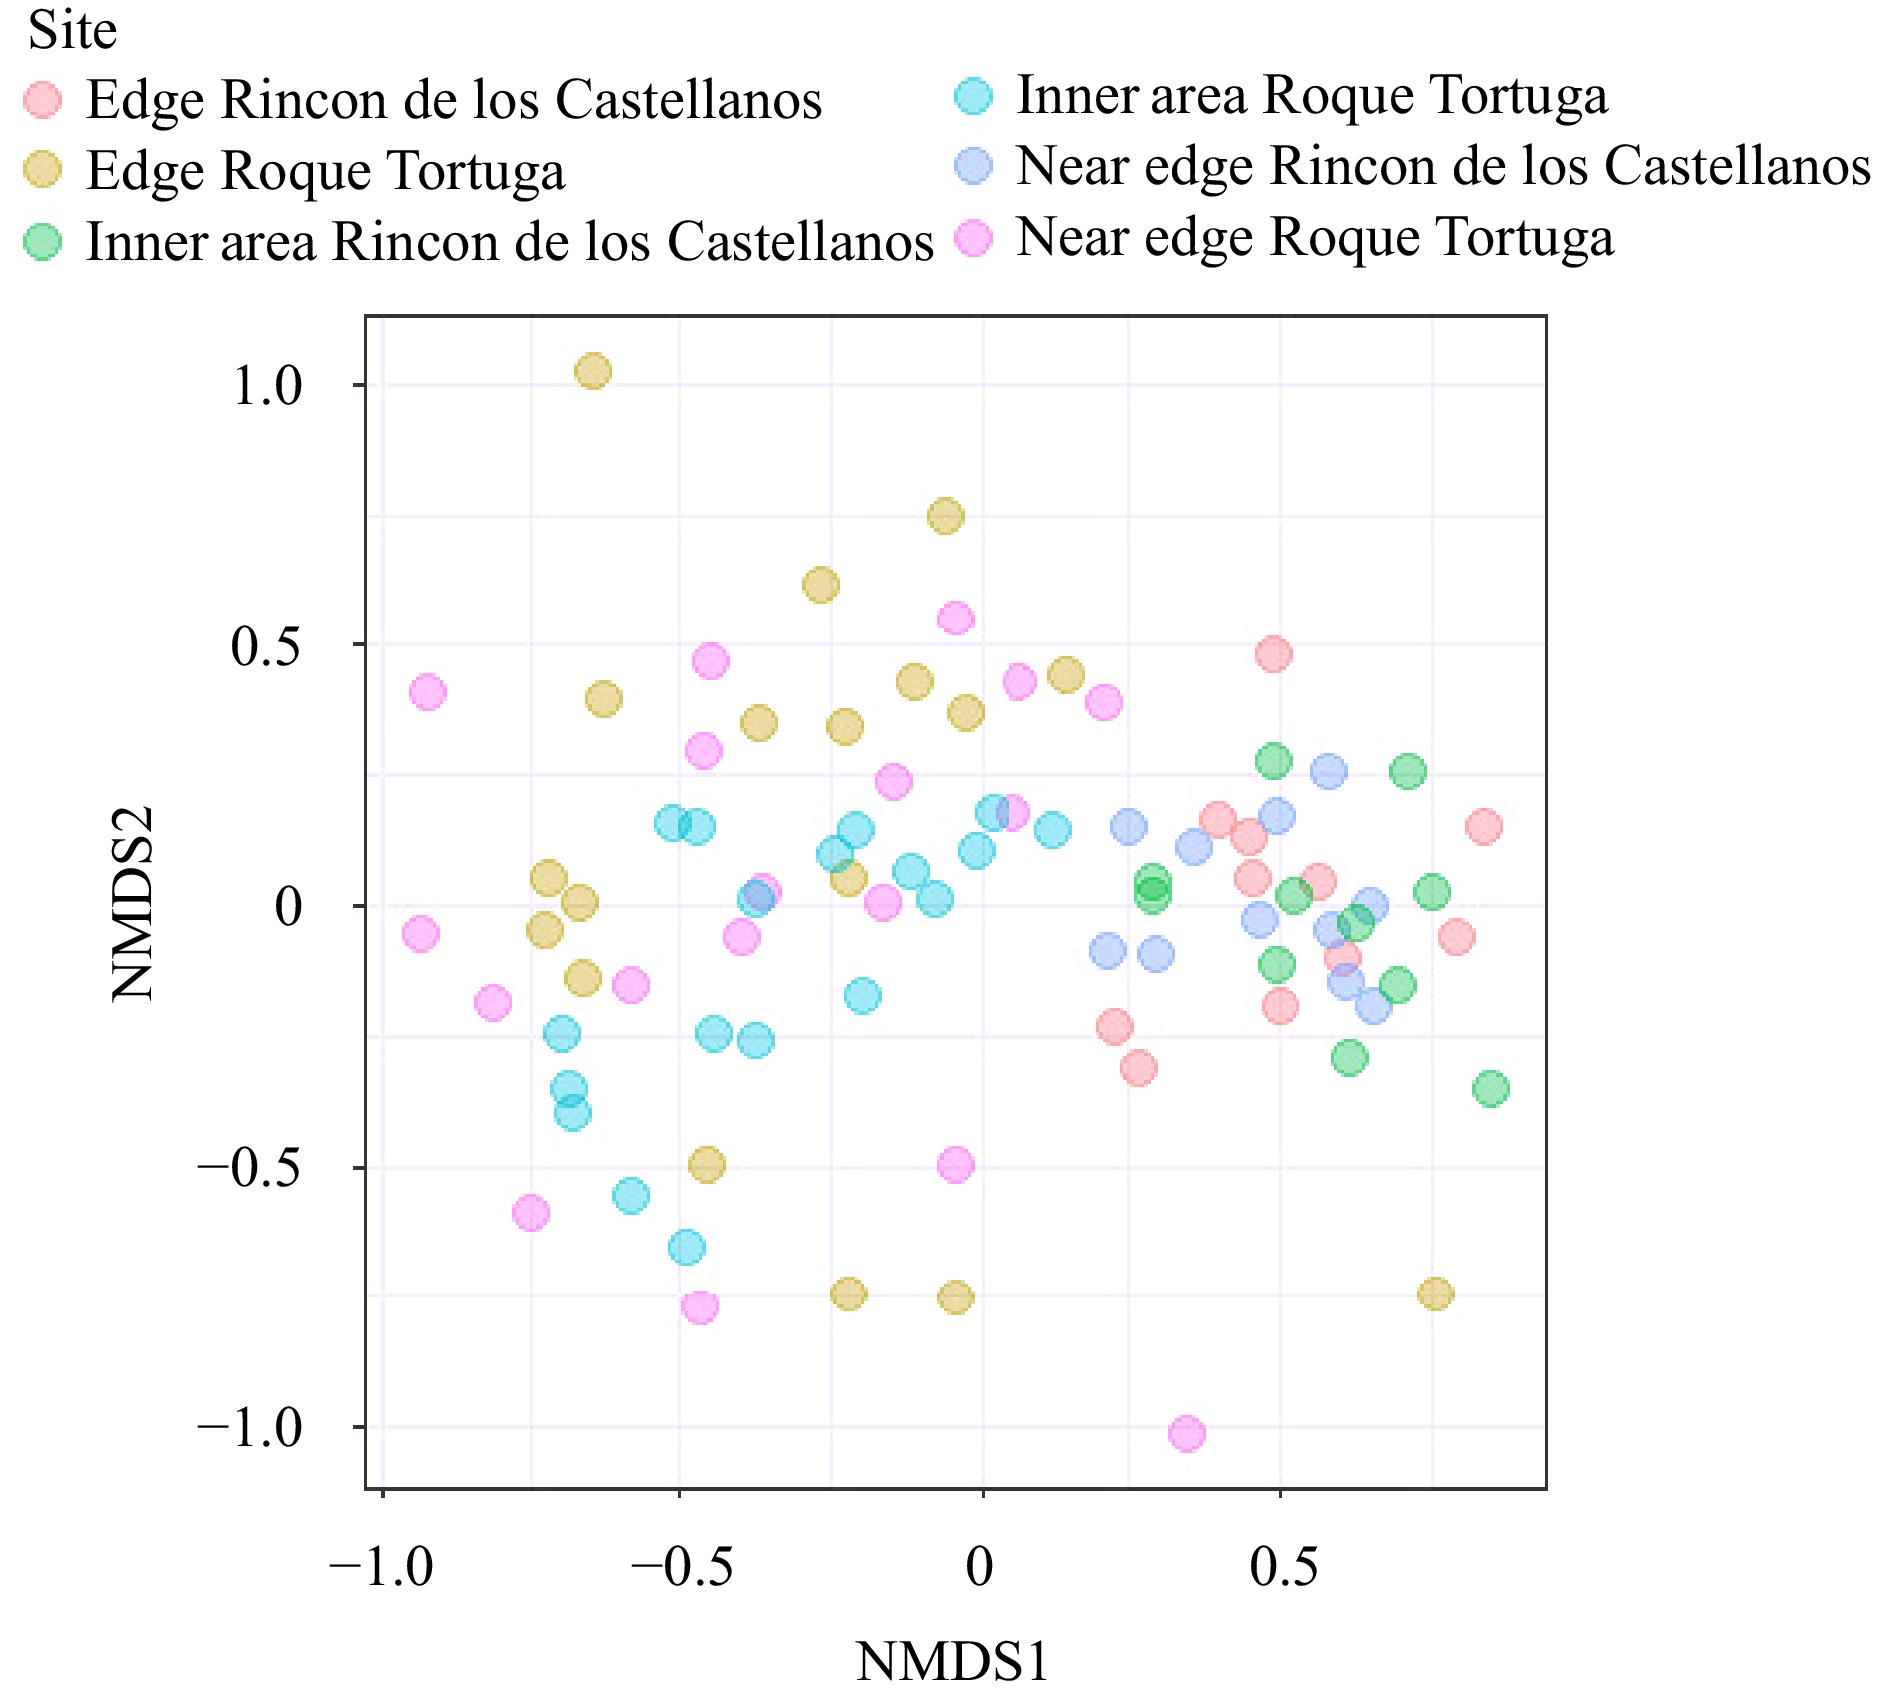
Figure 5. NMDS showing the patch sites (edge, near edge and inner area) at both sampling sites (Roque Tortuga and Rincón de Los Castellanos).
Figure 6. SIMPER results carried out with their respective species. Comparative species contribution in the patch sites. The eight most important species explaining the dissimilarity between both patch sites are shown. cumsum represents cumulative dissimilarity.


 DownLoad: