Marine Heatwave (MHW) events refer to periods of significantly elevated sea surface temperatures (SST), persisting from days to months, with significant impacts on marine ecosystems, including increased mortality among marine life and coral bleaching. Forecasting MHW events is crucial to mitigate their harmful effects. This study presents a two-step forecasting process: short-term SST prediction followed by MHW event detection based on the forecasted SST. Firstly, we developed the “SST-MHW-DL” model using the ConvLSTM architecture, which incorporates an attention mechanism to enhance both SST forecasting and MHW event detection. The model utilizes SST data from the preceding 60 days to forecast SST and detect MHW events for the subsequent 15 days. Verification results for SST forecasting demonstrate a Root Mean Square Error (RMSE) of 0.64℃, a Mean Absolute Percentage Error (MAPE) of 2.05%, and a coefficient of determination (R²) of 0.85, indicating the model’s ability to accurately predict future temperatures by leveraging historical sea temperature information. For MHW event detection using forecasted SST, the evaluation metrics of “accuracy,” “precision,” and “recall” achieved values of 0.77, 0.73, and 0.43, respectively, demonstrating the model’s capability to capture the occurrence of MHW events accurately. Furthermore, the attention-enhanced mechanism reveals that recent SST variations within the past 10 days have the most significant impact on forecasting accuracy, while variations in deep-sea regions and along the Taiwan Strait significantly contribute to the model’s efficacy in capturing spatial characteristics. Additionally, the proposed model and temporal mechanism were applied to detect MHWs in the Atlantic Ocean. By inputting 30 days of SST data, the model predicted SST with an RMSE of 1.02℃ and an R² of 0.94. The accuracy, precision, and recall for MHW detection were 0.79, 0.78, and 0.62, respectively, further demonstrating the model’s robustness and usability.
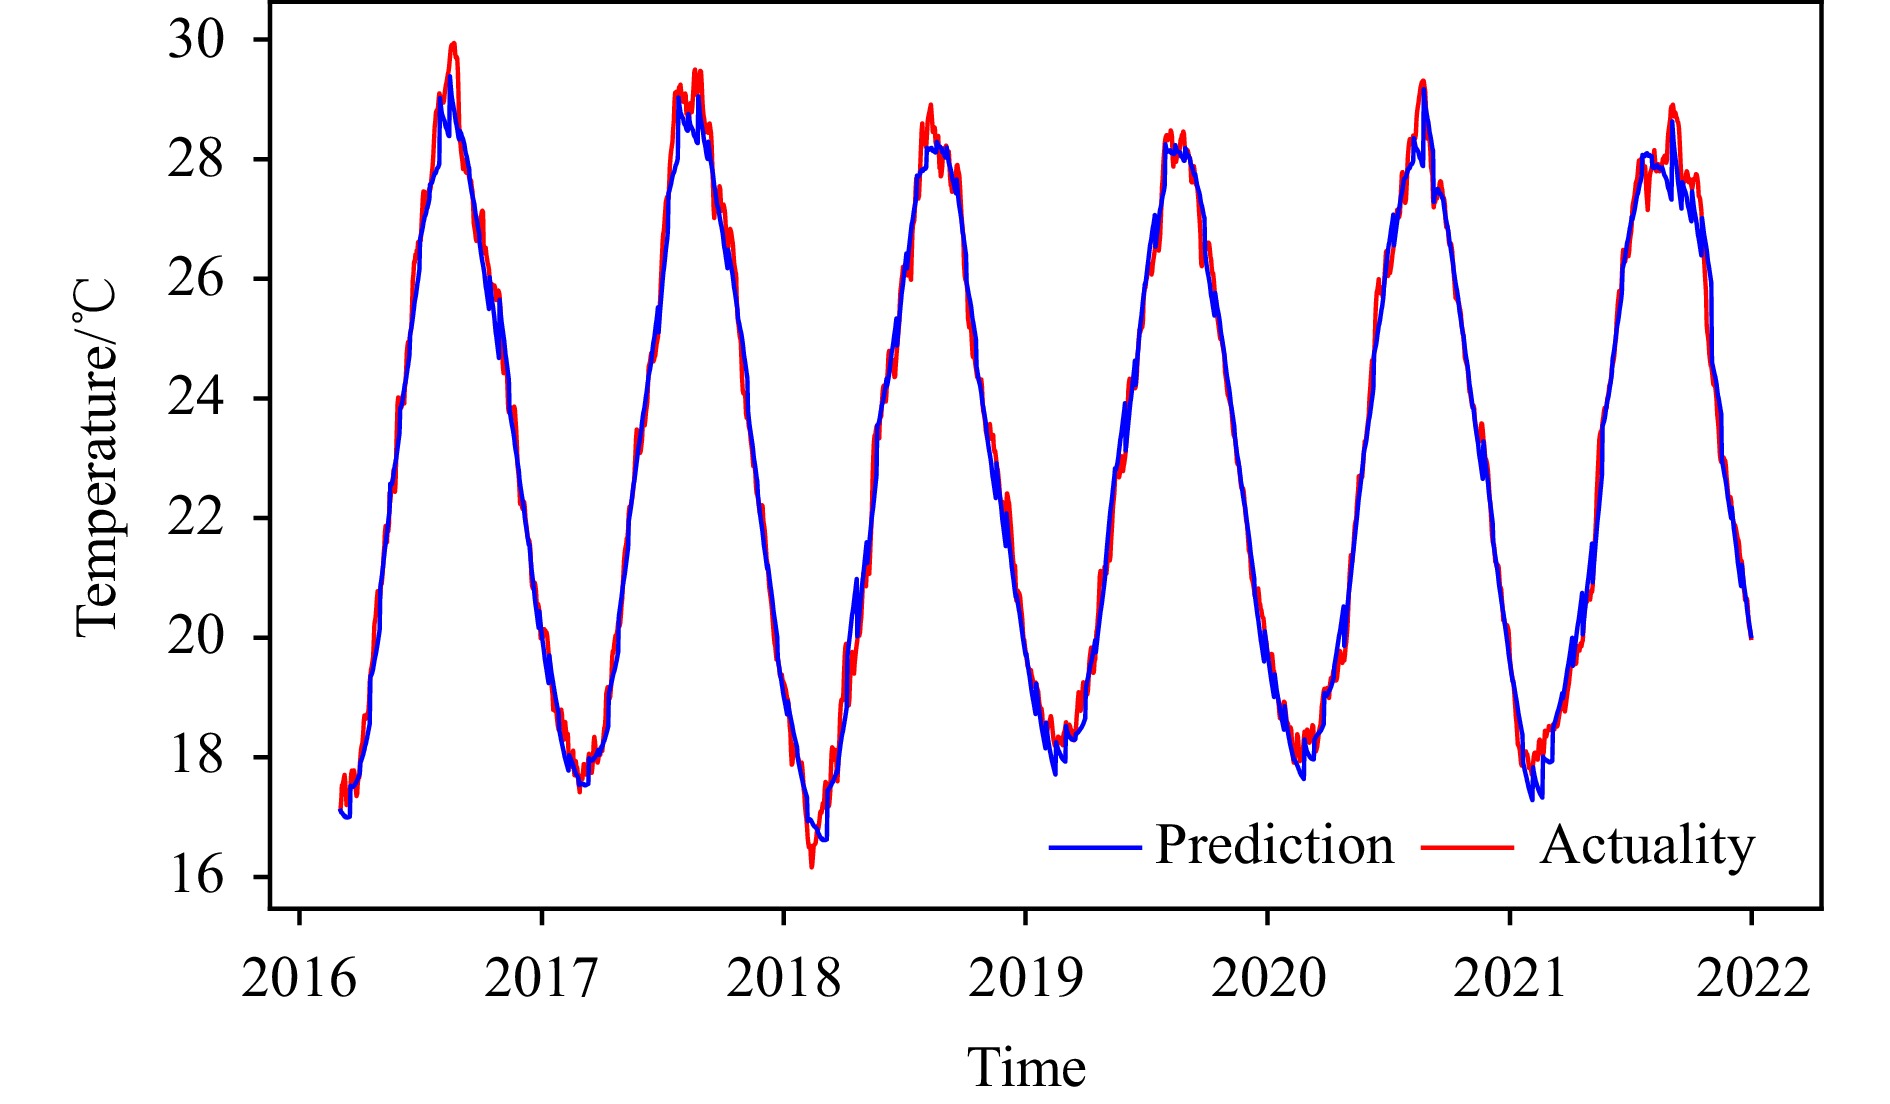
Figure 1. Study area. (a) Topography of the ECS and its primary ocean currents, (b) SST variations in the ECS from 2016 to 2021.
Figure 2. Different methods for MHW detection.
Figure 3. Structural diagram of the proposed SST-MHW-DL model (the red box highlights our improvement and analysis part).
Figure 4. Schematic representation of ground truth generation.
Figure 5. SST forecast accuracy of the SST-MHW-DL model. (a) RMSE, (b) MAPE, (c) R².
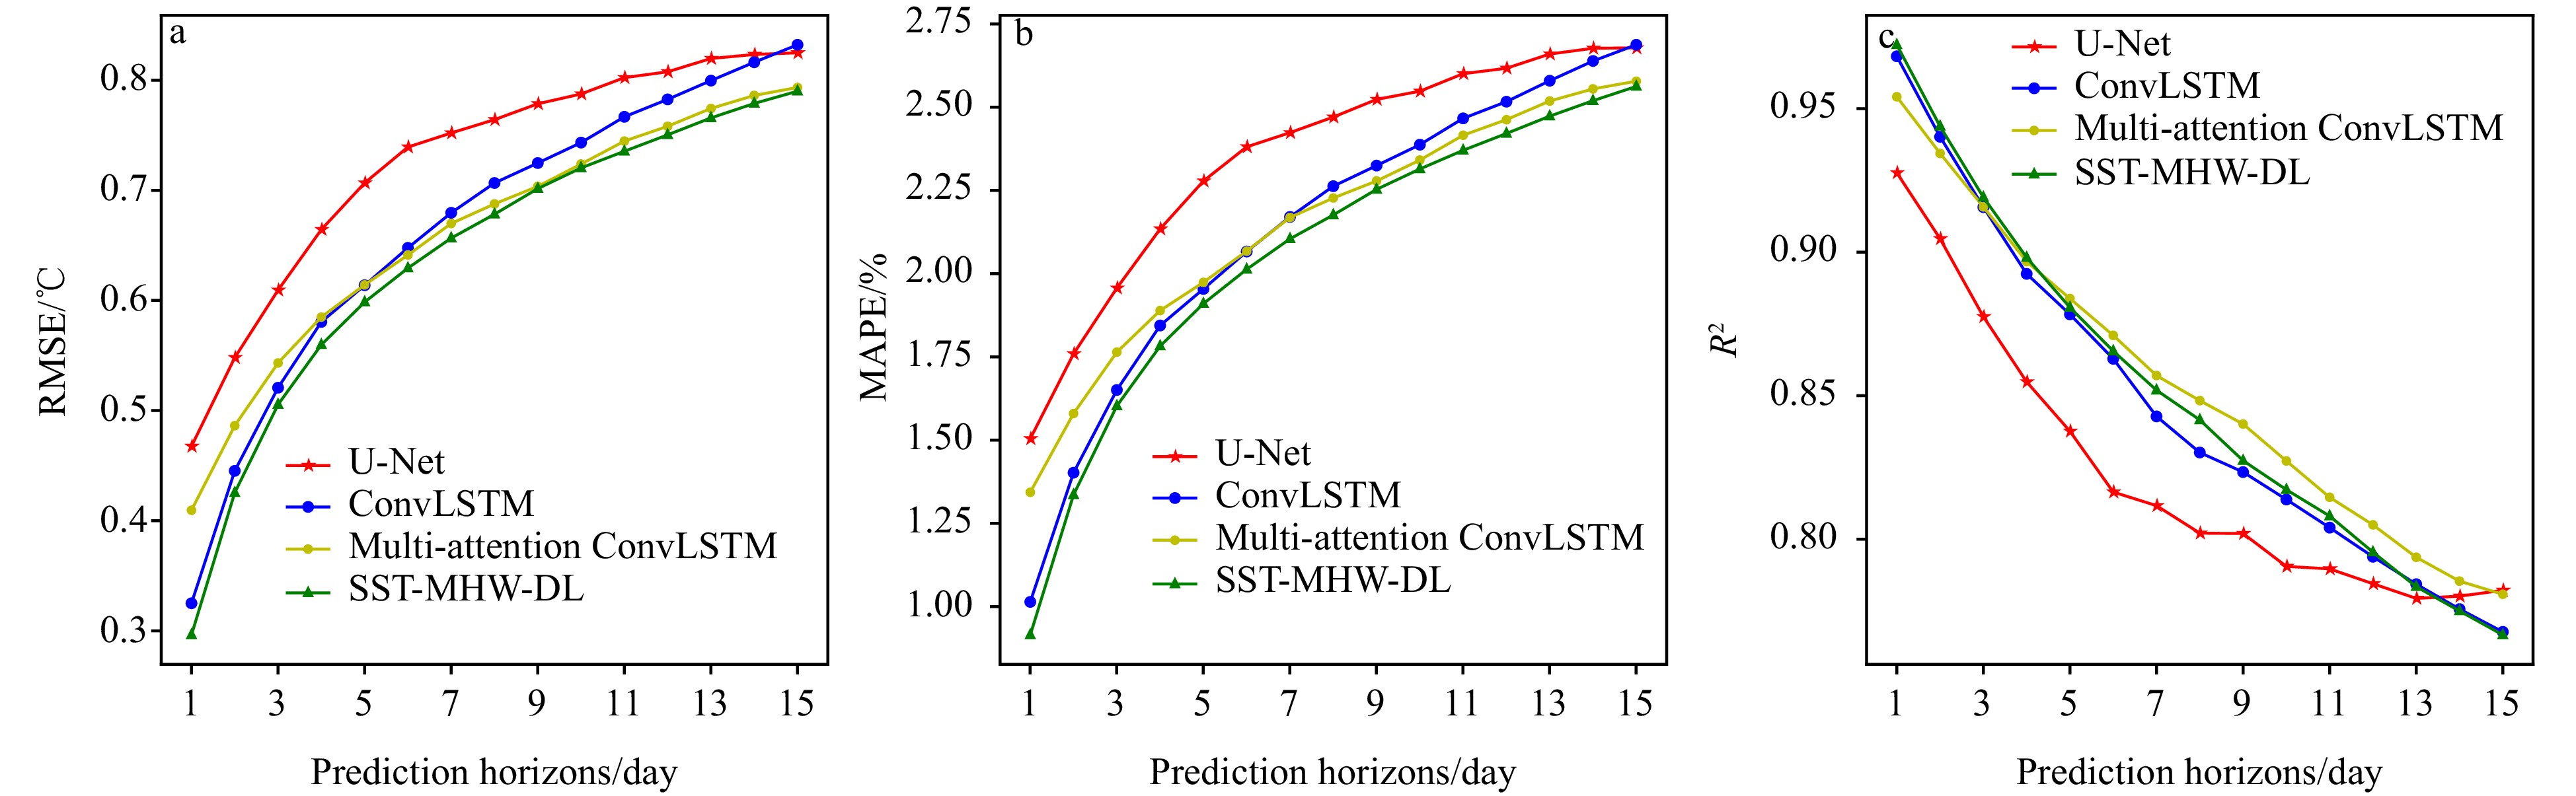
Figure 6. Comparison between the SST-MHW-DL model and several state-of-the-art models. (a) Comparison of study areas, (b) accuracy comparison for different forecast durations.
Figure 7. Spatiotemporal variations in SST forecast errors by the SST-MHW-DL model in the ECS region. (a) Difference and (b) RMSE of the predicted SST and ground truth.
Figure 8. Forecast effectiveness evaluation of the SST-MHW-DL model
Figure 9. Visualization of channel (temporal) attention weights in the SST-MHW-DL model.
Figure 10. Spatial attention in the SST-MHW-DL model. (a) Weight distribution of the SST-MHW-DL model, (b) spring and (c) autumn temperature.
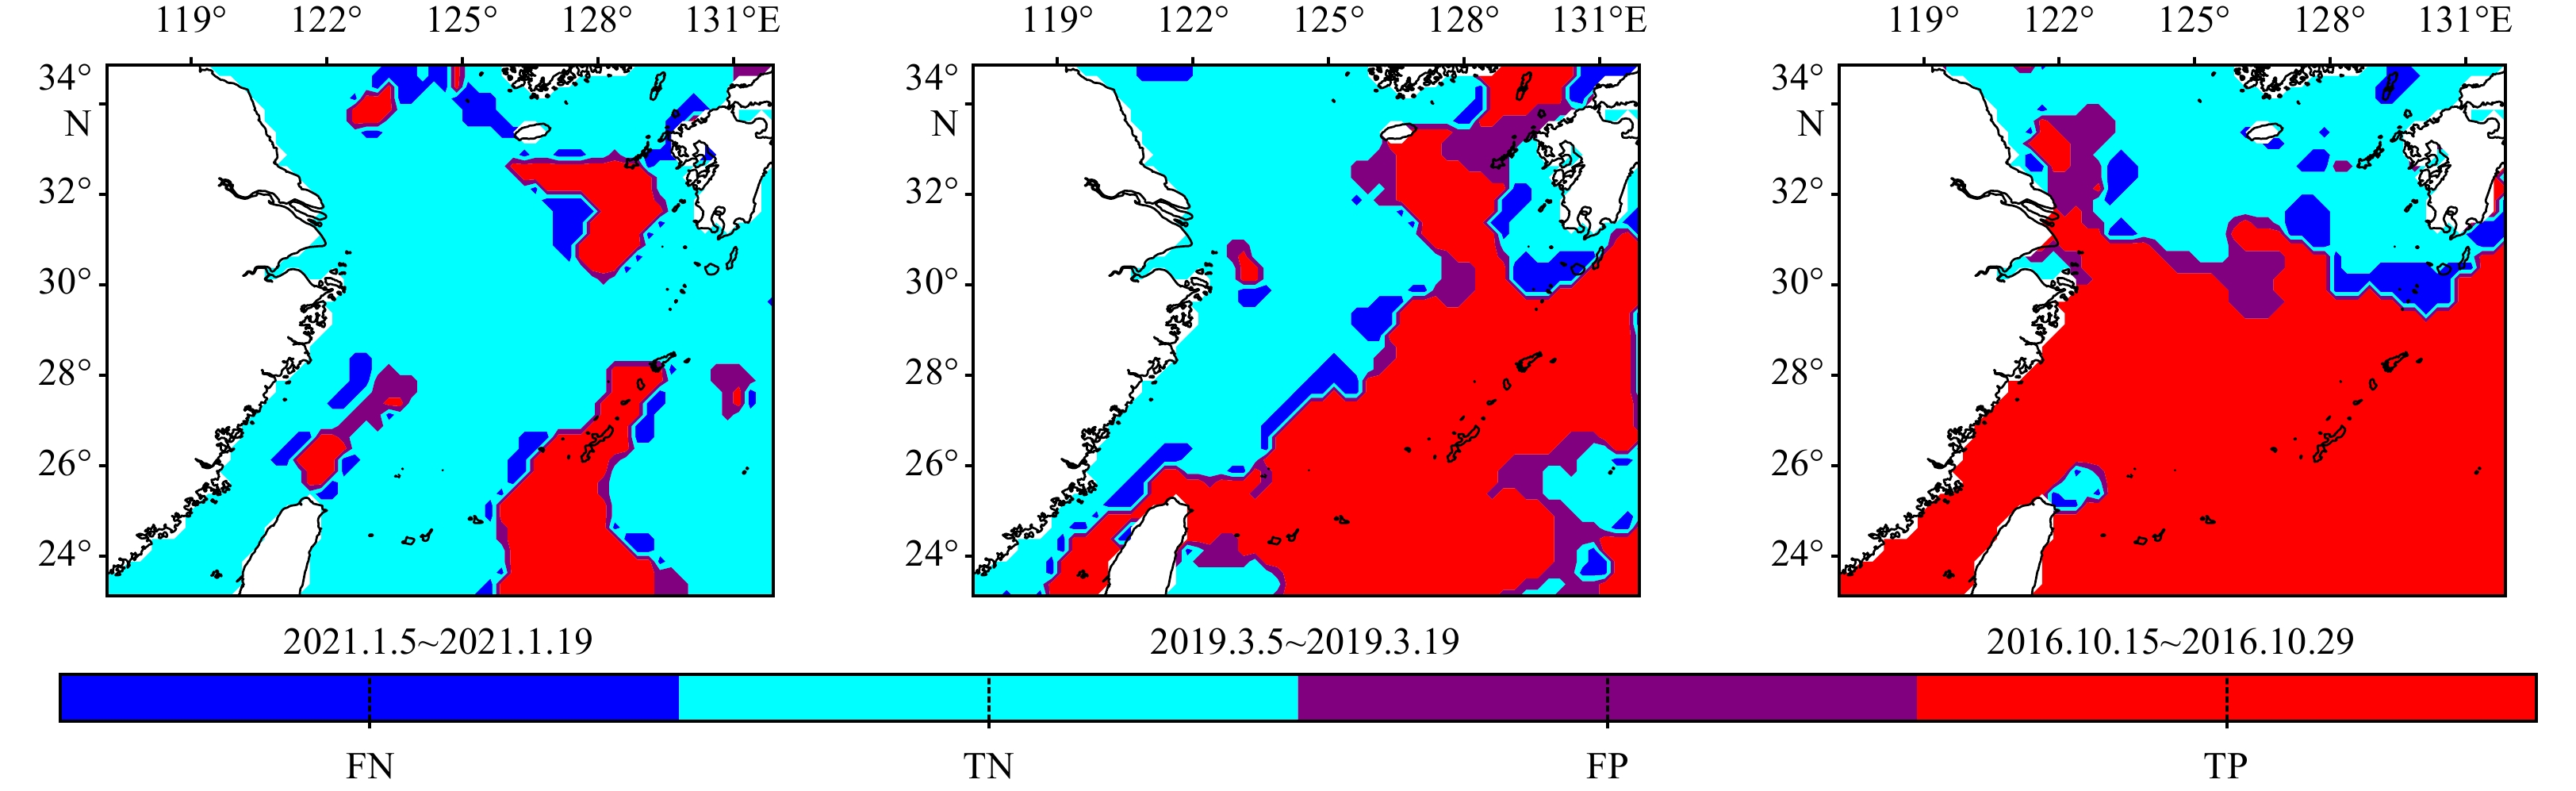
Figure 11. Detection of MHW with different occurrence scales of 25%, 50%, and 75% in the ECS. TP and TN denote correctly predicted MHW sea areas.
Figure 12. Spatiotemporal statistics of MHW occurrence in the ECS from 2016 to 2021. (a) average intensity (℃), (b) occurrence duration of the MHW events (days), and (c) annual average occurrence frequency (counts/year).
Figure 13. Test area. (a) Topography of the NWA, (b) SST variations in the NWA from 2016 to 2021.
Figure 14. Spatiotemporal statistics of MHW occurrence in the NWA from 2016 to 2021. (a) average intensity (℃), (b) occurrence duration of the MHW events (days), (c) annual average occurrence frequency (counts/year).
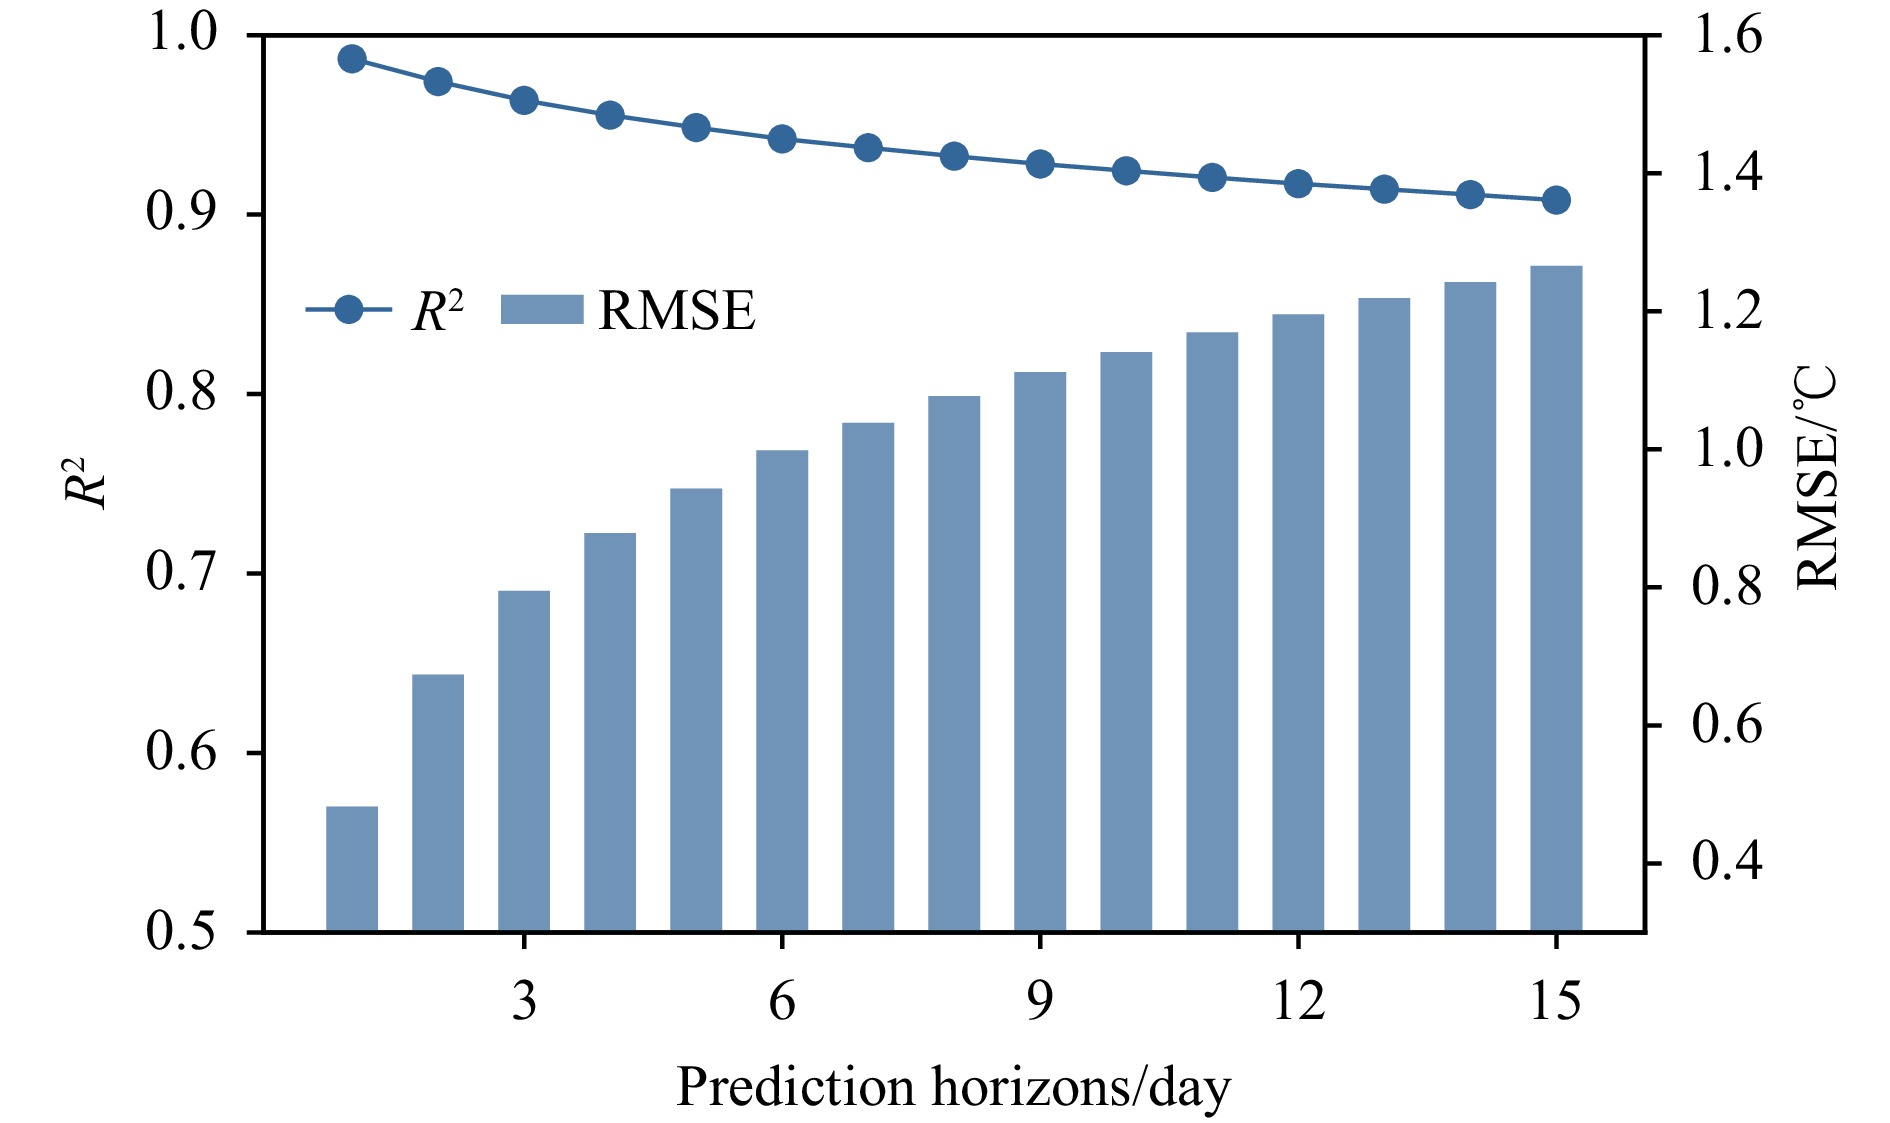
Figure 15. RMSE and R² of SST forecast.
Figure 16. Spatial distribution of (a) RMSE (℃) and (b) R² predicted by SST, as well as (c) the effectiveness evaluation of the model’s predictions.


 DownLoad: