Luo Manman, Zhou Chunxia, Li Mingci. Sea ice volume variability and its influencing factors in the Greenland Sea during 1979–2022[J]. Acta Oceanologica Sinica. doi: 10.1007/s13131-024-2389-5
Citation:
Luo Manman, Zhou Chunxia, Li Mingci. Sea ice volume variability and its influencing factors in the Greenland Sea during 1979–2022[J]. Acta Oceanologica Sinica. doi: 10.1007/s13131-024-2389-5
Luo Manman, Zhou Chunxia, Li Mingci. Sea ice volume variability and its influencing factors in the Greenland Sea during 1979–2022[J]. Acta Oceanologica Sinica. doi: 10.1007/s13131-024-2389-5
Citation:
Luo Manman, Zhou Chunxia, Li Mingci. Sea ice volume variability and its influencing factors in the Greenland Sea during 1979–2022[J]. Acta Oceanologica Sinica. doi: 10.1007/s13131-024-2389-5
Chinese Antarctic Center of Surveying and Mapping, Wuhan University, Wuhan 430079, China
2.
Key Laboratory of Polar Environment Monitoring and Public Governance (Wuhan University), Ministry of Education, Wuhan 430079, China
3.
School of Geodesy and Geomatics, Wuhan University
Funds:
The National Key Research and Development Program of China under contract Nos 2021YFC2803303 and 2021YFC2803302, the National Natural Science Foundation of China under contract Nos 42171133, the Fundamental Research Funds for the Central Universities, China under contract Nos 2042022dx0001.
Arctic sea ice is an essential component of the climate system and plays an important role in global climate change. This study calculates the volume flux through Fram Strait (FS) and the sea ice volume in the Greenland Sea (GS) from 1979 to 2022, and analyzes trends before and after 2000. In addition, the contributions of advection and local processes to sea ice volume variations in the GS during different seasons are compared. The influence of the surface air temperature (SAT) and the sea surface temperature (SST) on sea ice volume variations is discussed, as well as the impact of atmospheric circulation on sea ice. Results indicate no significant trend in the sea ice volume flux through FS from 1979 to 2022. However, the sea ice volume in the GS exhibited a notable decreasing trend. Compared with the period of 1979–2000, the sea ice volume decreasing trend accelerated significantly during the period of 2001–2022. During winter, ice advection from the central Arctic Ocean exert a strong influence on the sea ice volume variations in the GS, whereas during summer, local processes, including the interactions with the atmosphere and ocean, as well as the dynamic process of sea ice itself, exert a considerable impact. The sea ice volume in the GS declined rapidly after 2000. Furthermore, the effects of local processes on sea ice have intensified, with the SST exerting a stronger influence on the sea ice volume variations in the GS than the SAT. The positive Arctic oscillation and dipole anomaly are important drivers for the transport of Arctic sea ice to the GS. The Winter North Atlantic oscillation intensifies ocean heat content, affecting sea ice in the GS.
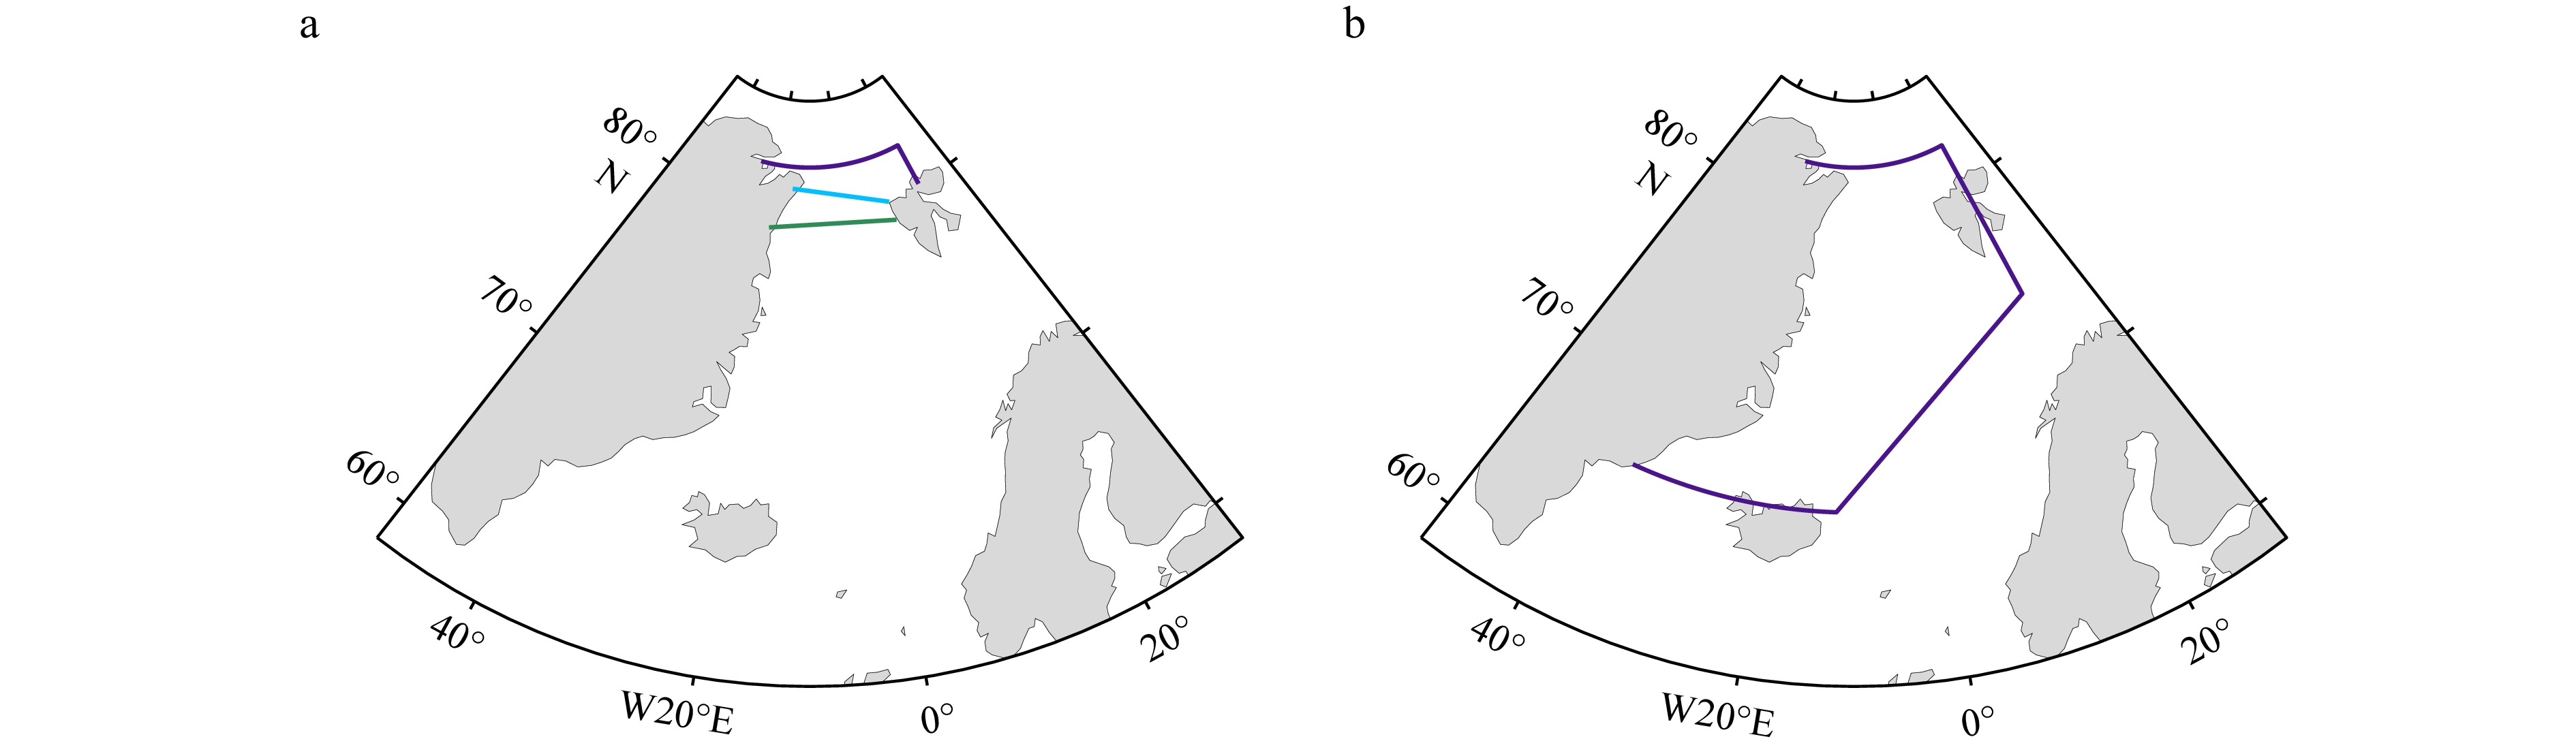
Figure 1. The flux gate (a) and the research area (b). The Purple line denotes flux gate of this paper and Ricker et al. (2018), while green line is Kwok et al. (2004) and blue line is Li (2021).
Figure 2. Comparison of sea ice volume fluxes with other studies (Kwok et al. (2004), Ricker et al. (2018); Li (2021)). The line is the monthly volume flux, the circle is the monthly volume flux in winter.
Figure 3. Annual volume flux through FS (a), monthly volume through FS in 1979–2022 ((b)–(m)), representing January to December. The solid trend lines denote passing significant test.
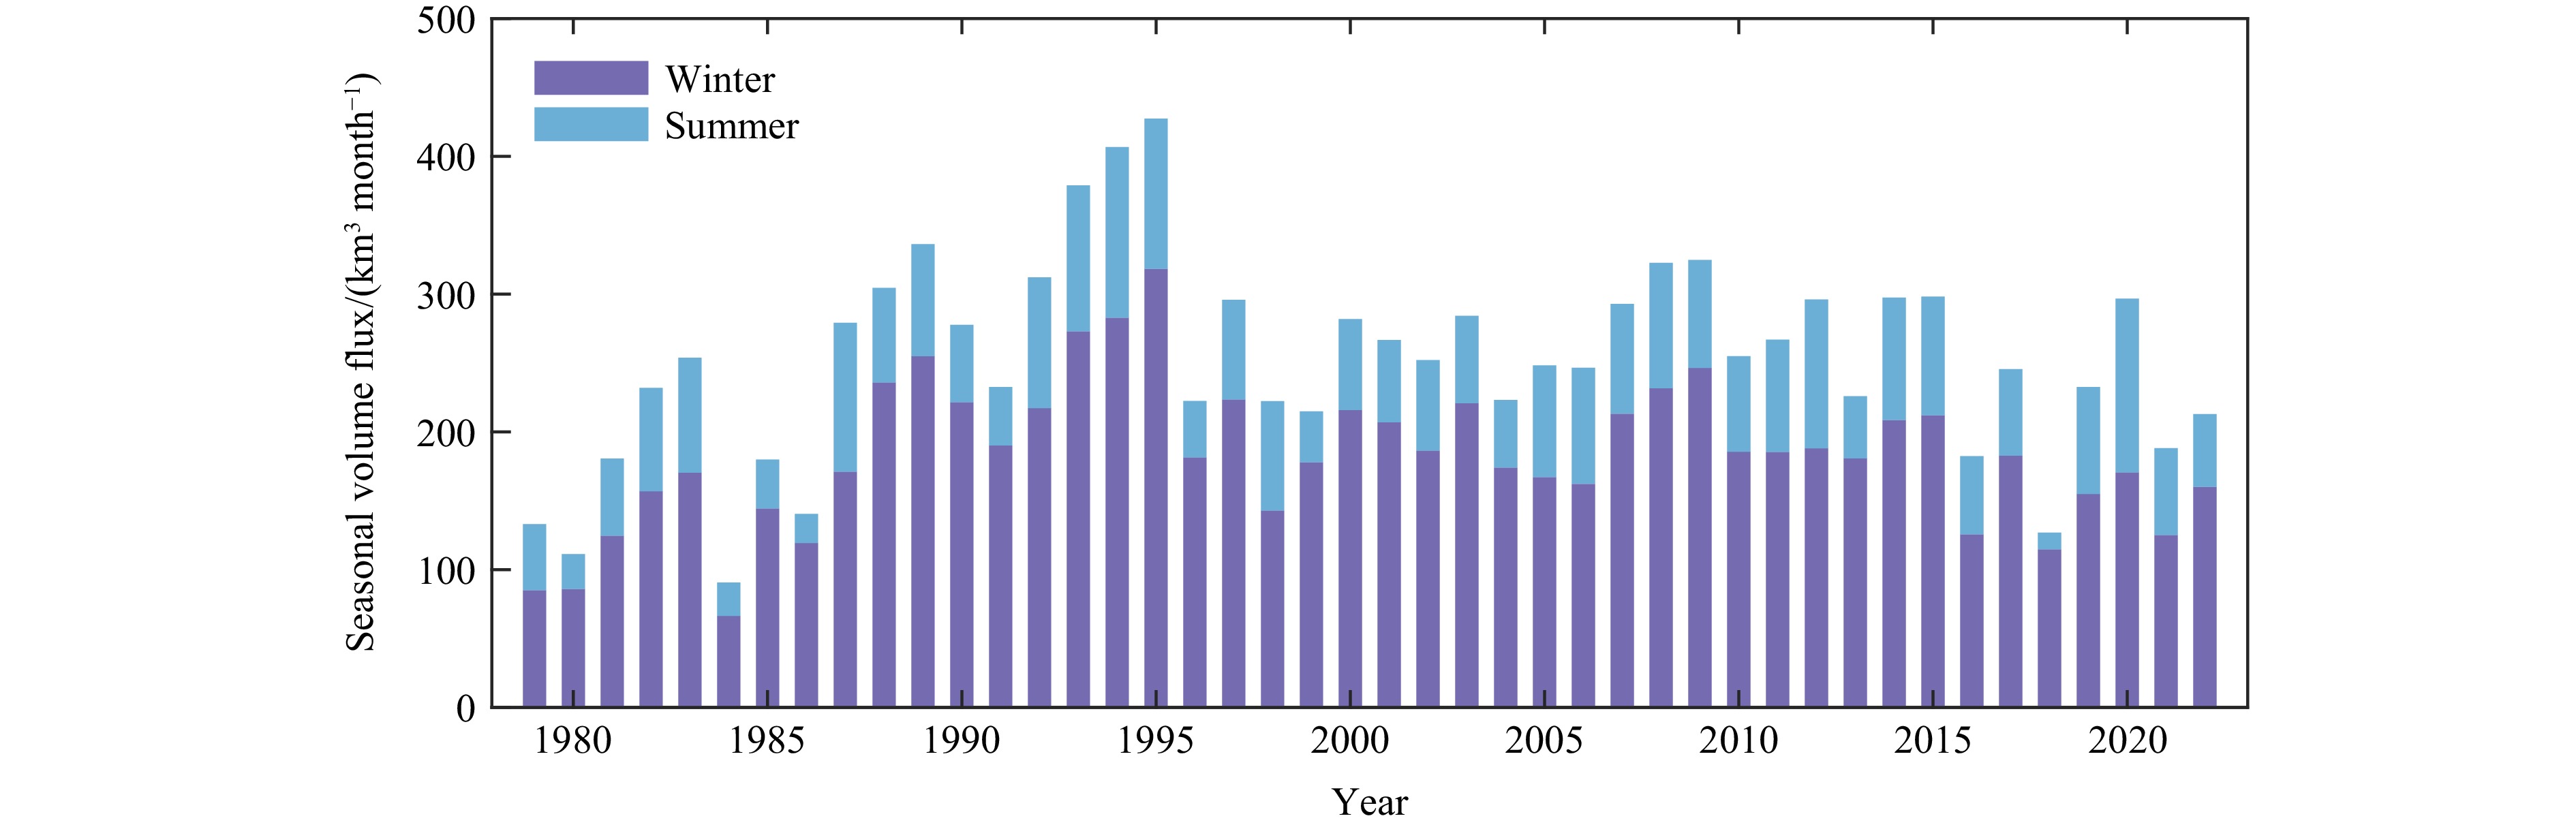
Figure 4. Seasonal volume flux through FS during 1979–2022
Figure 5. Annual sea ice volume in the GS (a), monthly sea ice volume in the GS in 1979–2022 ((b)–(m)), representing January to December. The solid trend lines denote passing significant test.
Figure 6. Spatial distribution of effective SIT in the GS during 1979–2022 (a), 1979–2000 (b), and 2001–2022 (c).
Figure 7. Spatial distribution of effective SIT change rate in the GS during 1979–2022 (a), 1979–2000 (b), and 2001–2022 (c).
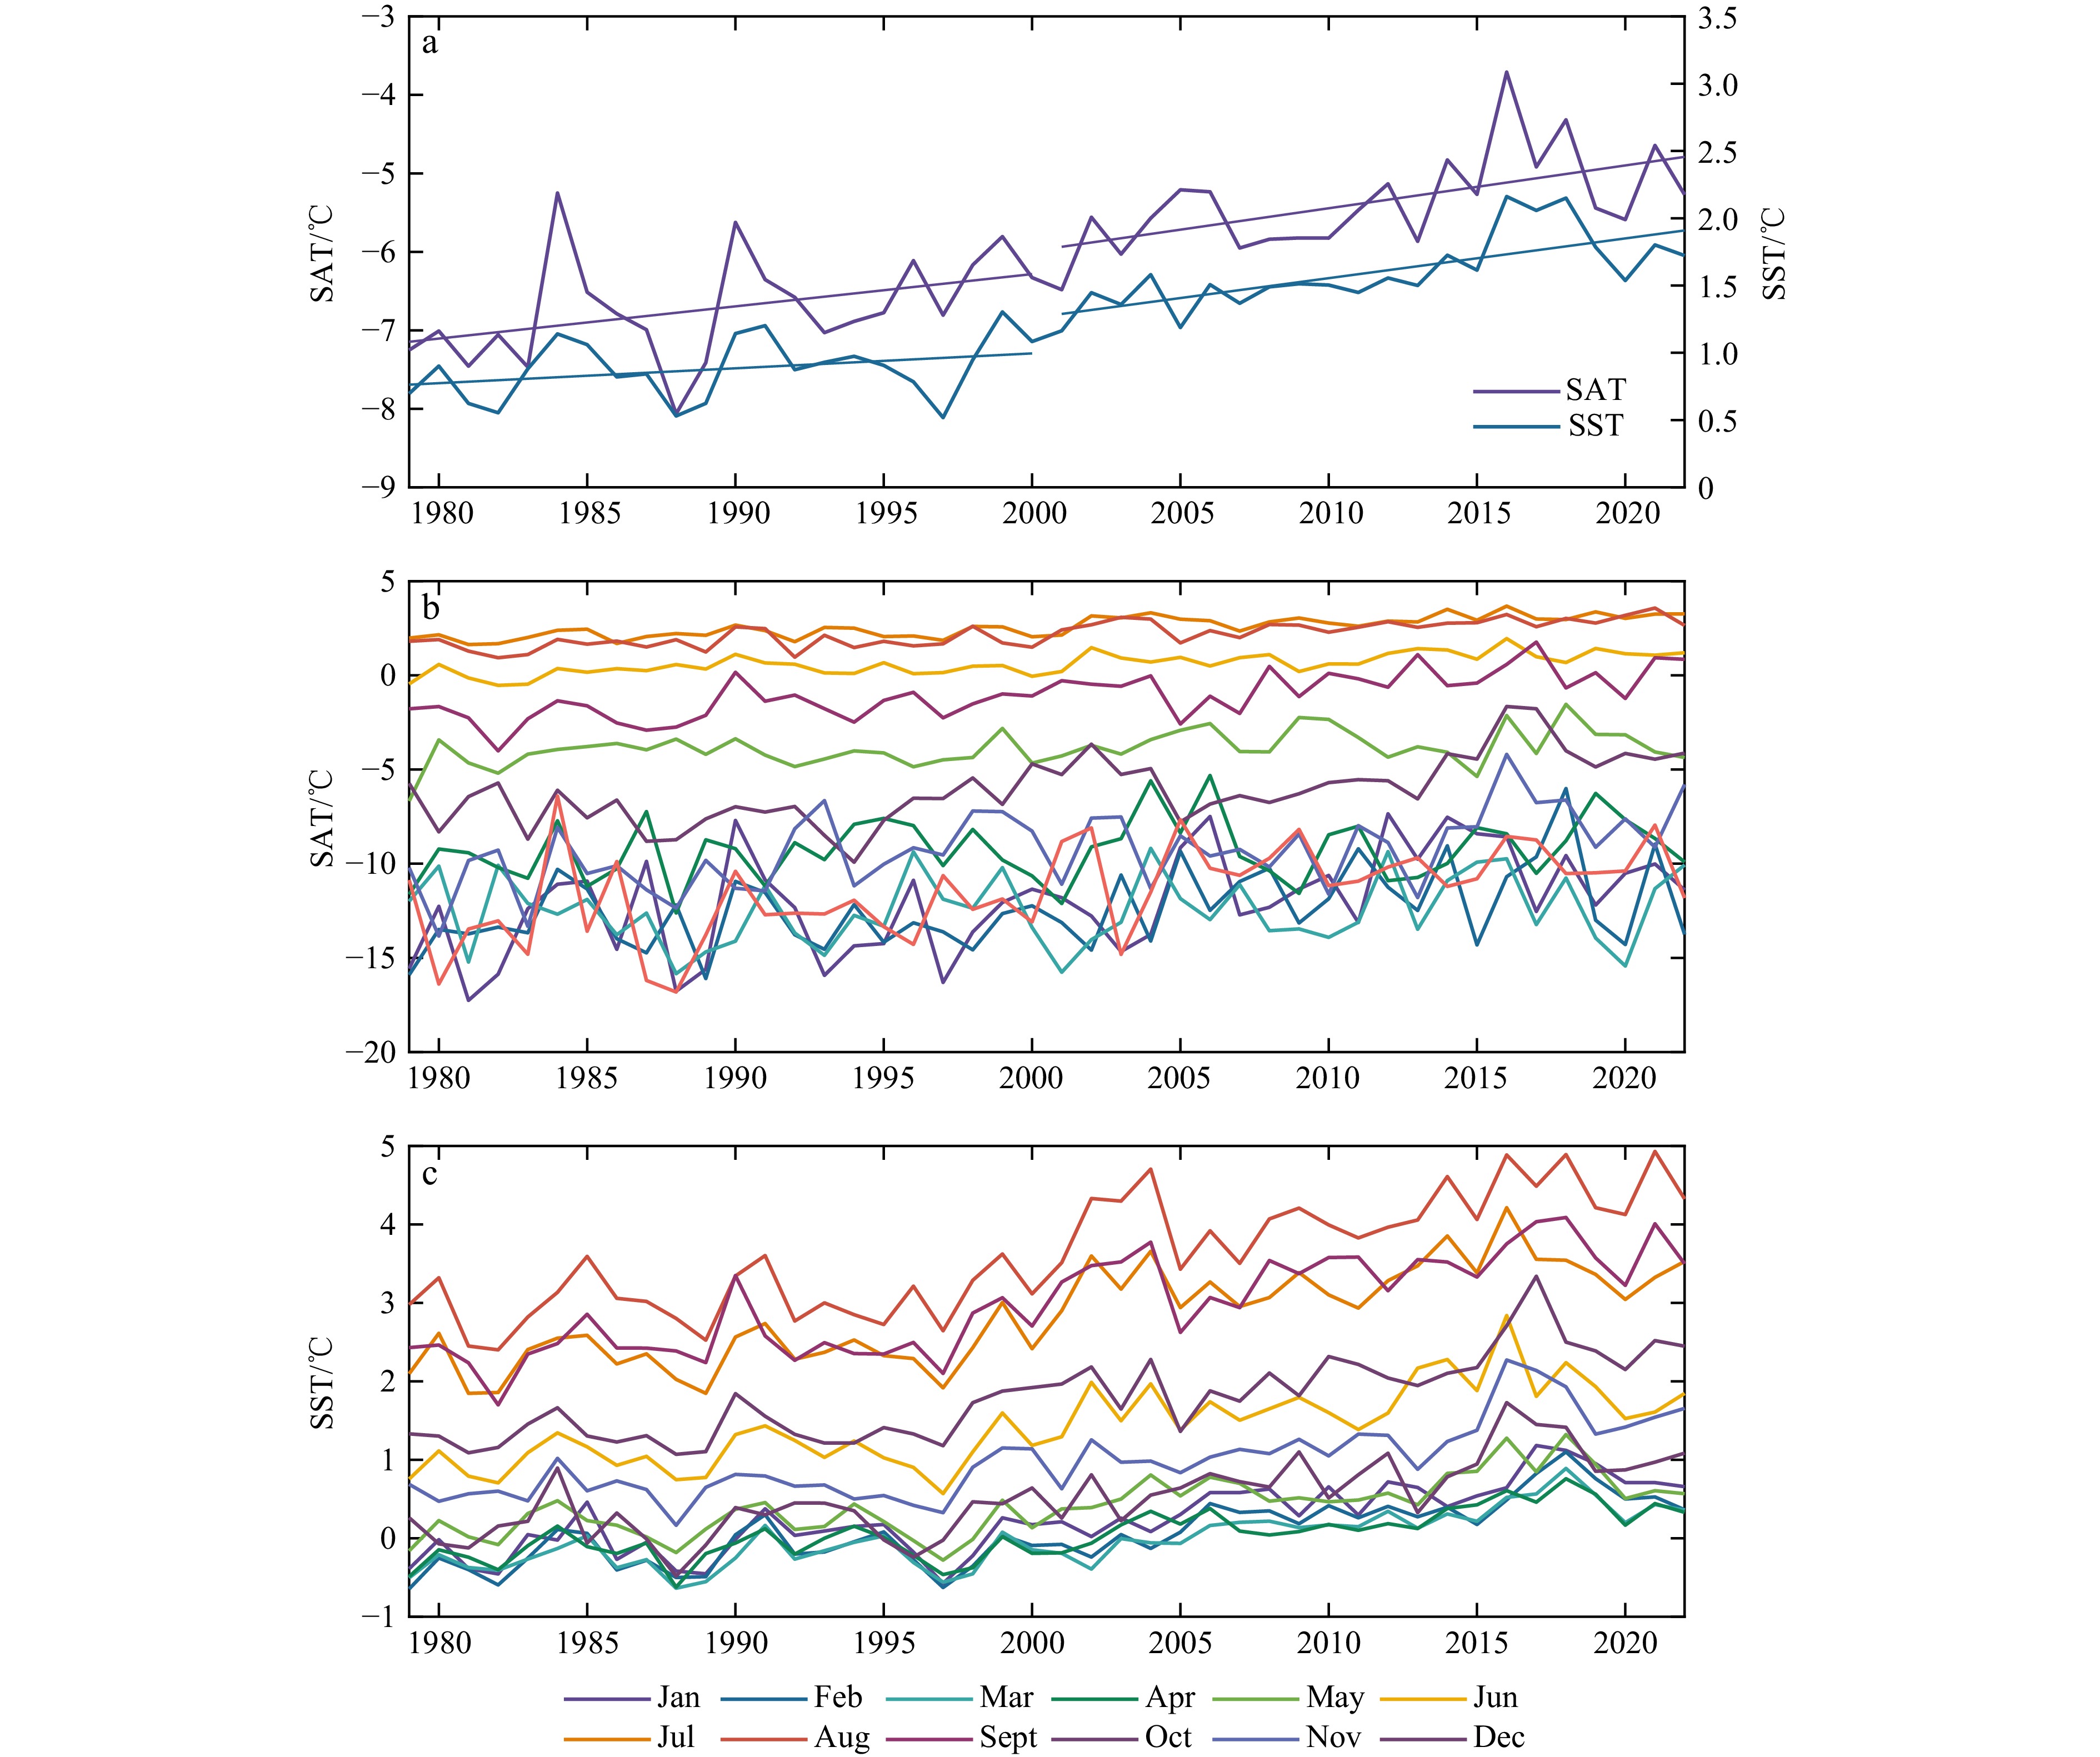
Figure 8. Annual SAT and SST (a), monthly SAT (b), monthly SST (c) during 1979–2022.
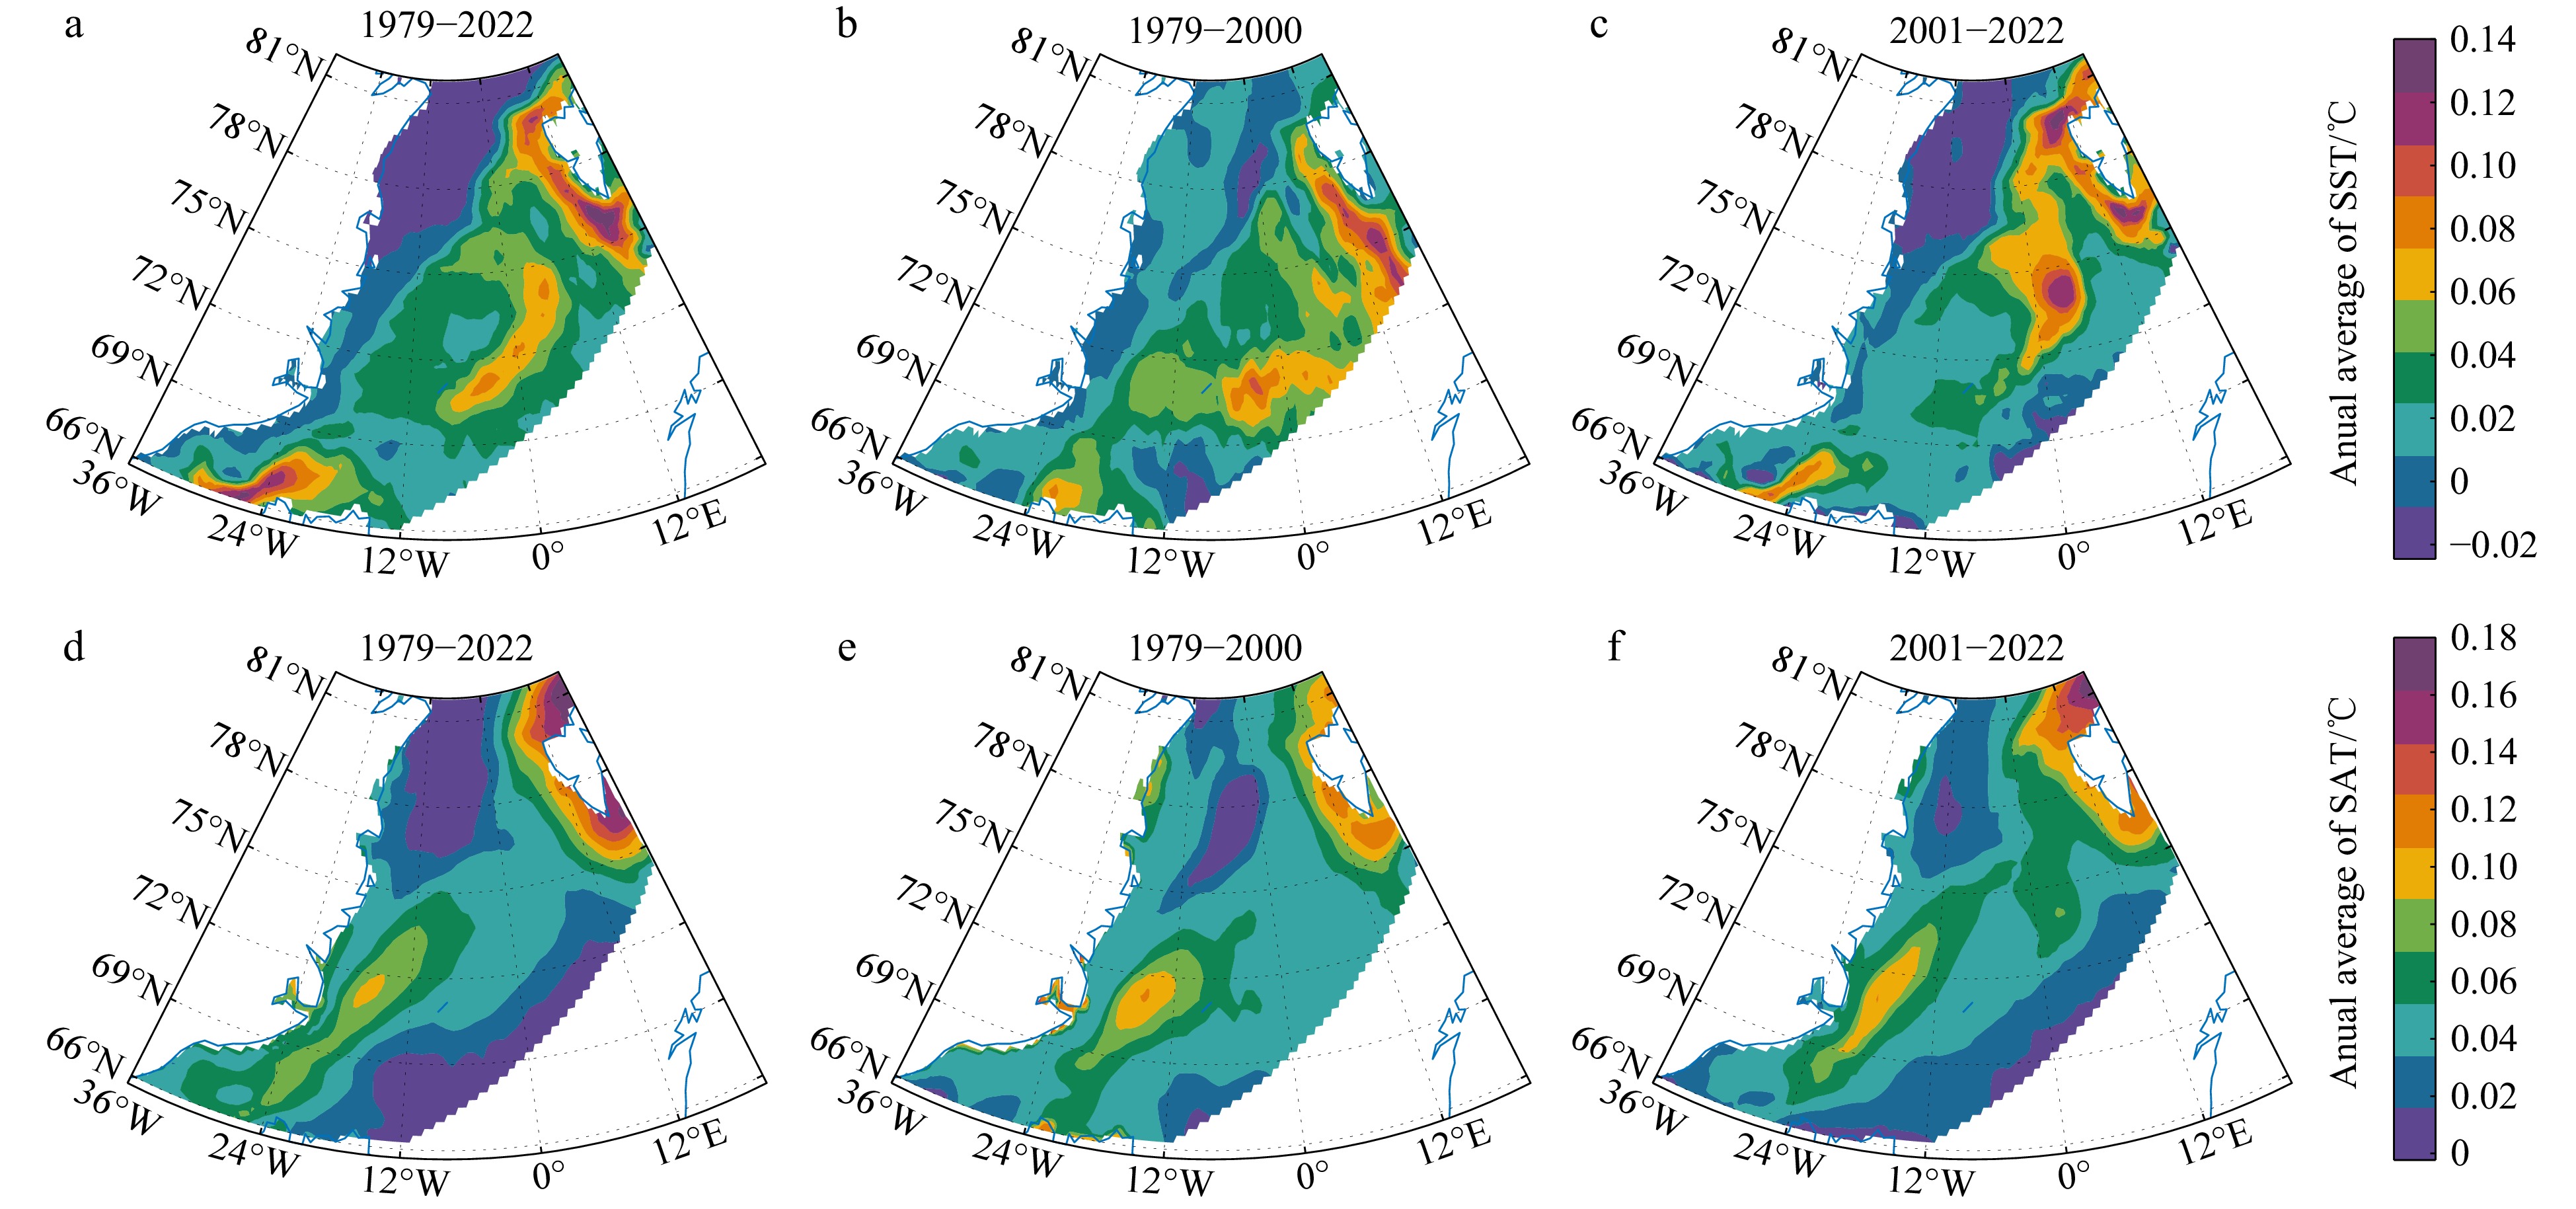
Figure 9. Spatial distribution of annual average SST/SAT change rates during 1979–2022 (a)/(d), 1979–2000 (b)/(e), and 2001–2022 (c)/(f).
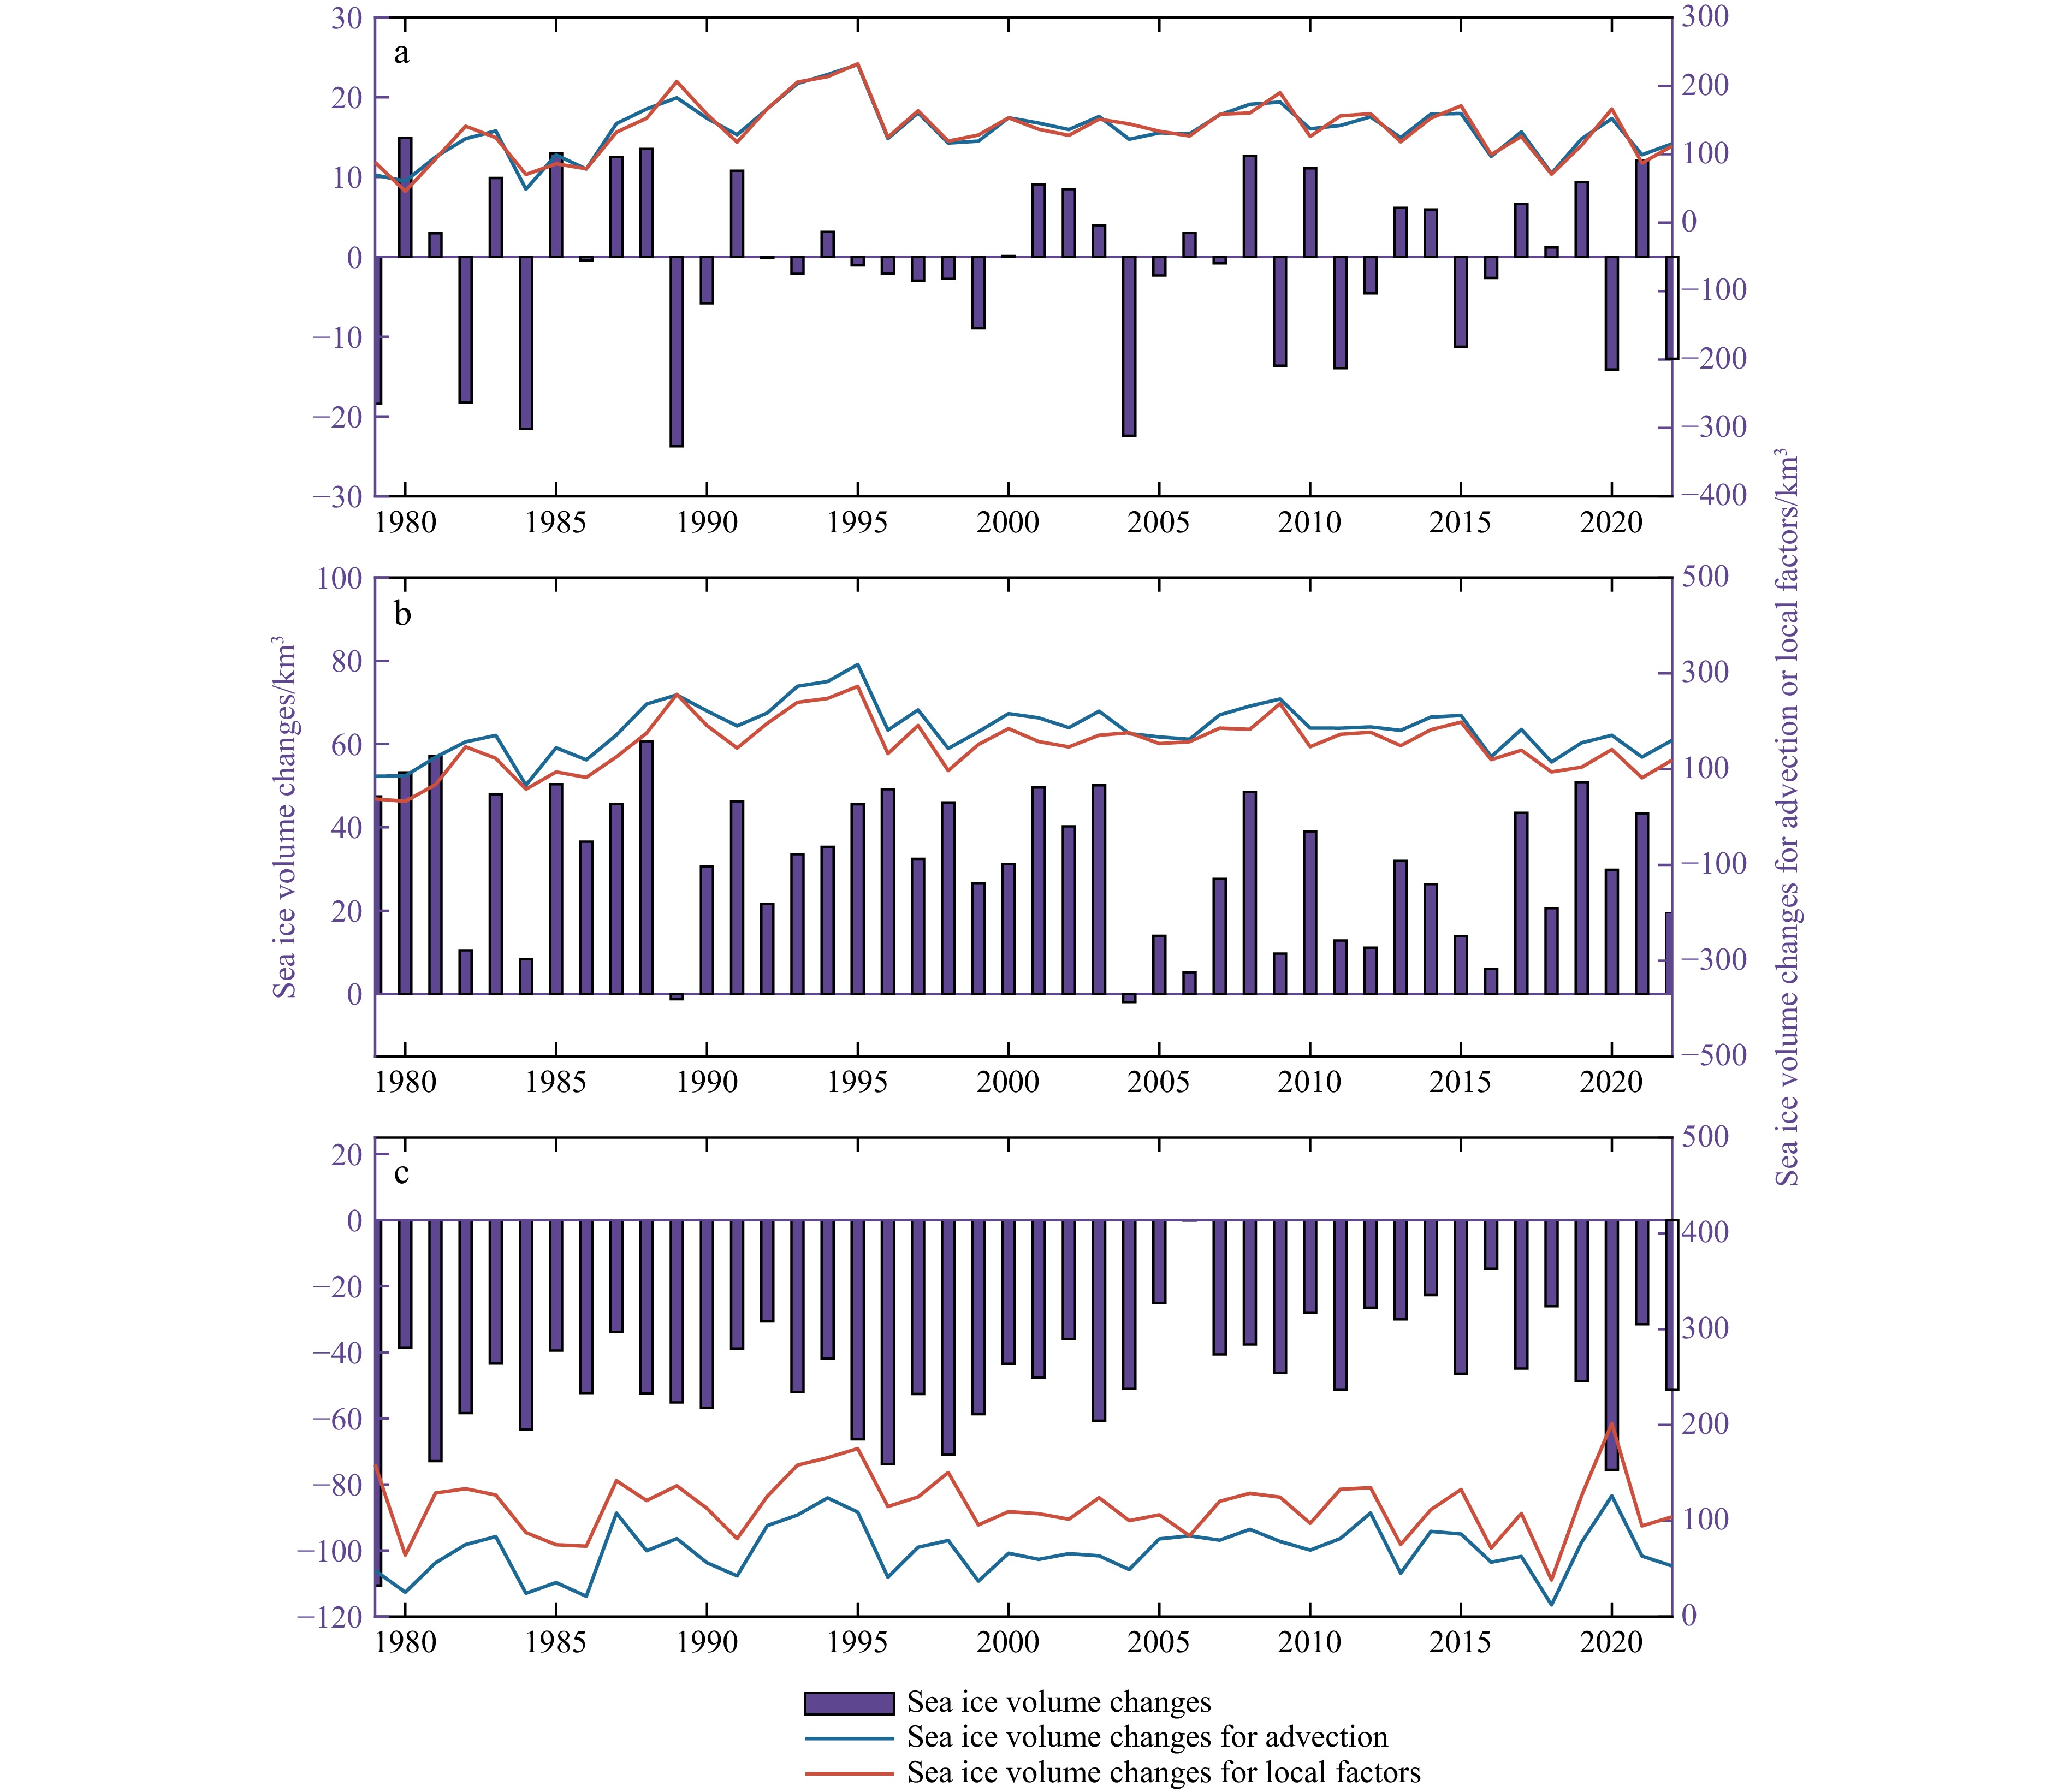
Figure 10. Sea ice volume variations in the GS for advection and local factors at annual (a), winter (b), and summer (c).
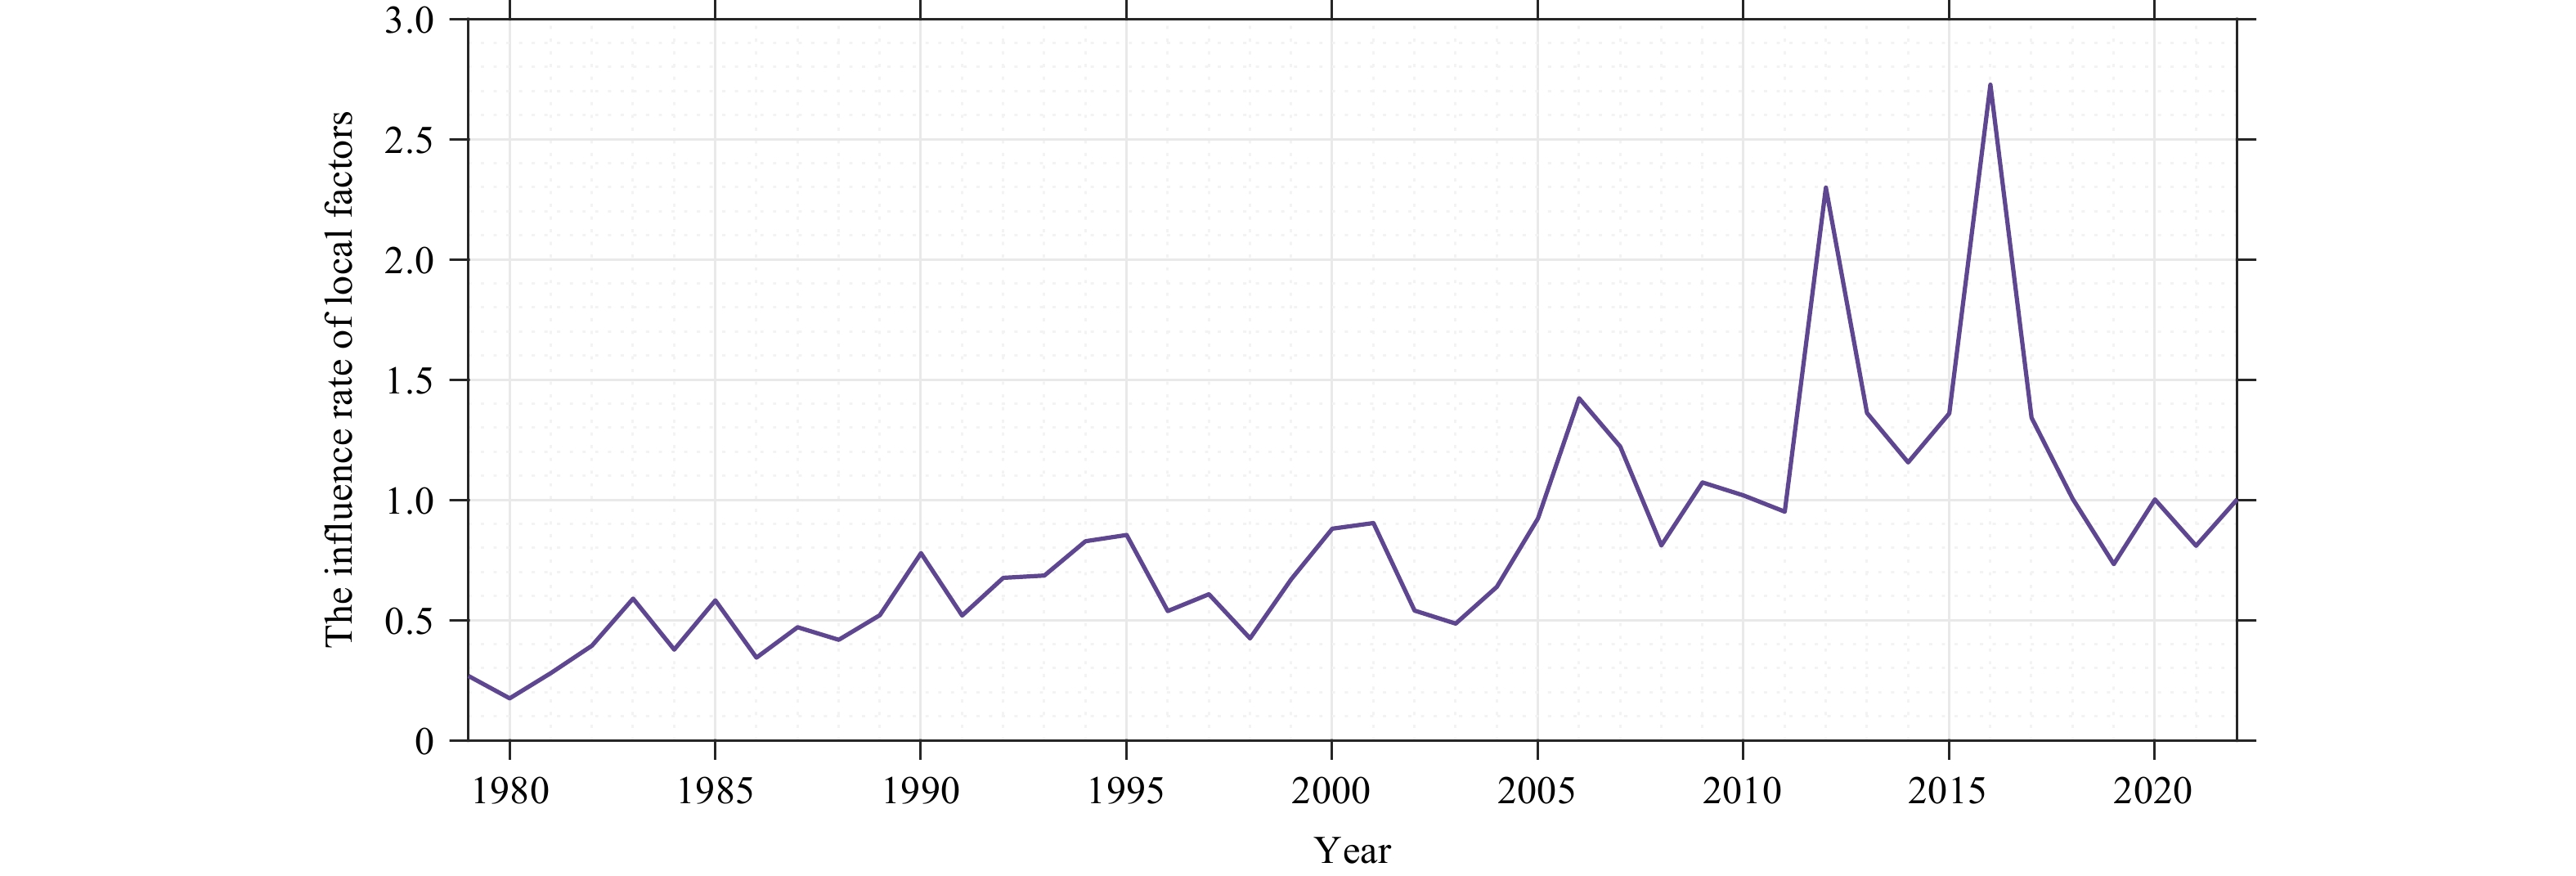
Figure 11. The annual influence rate of local factors in 1979–2022.
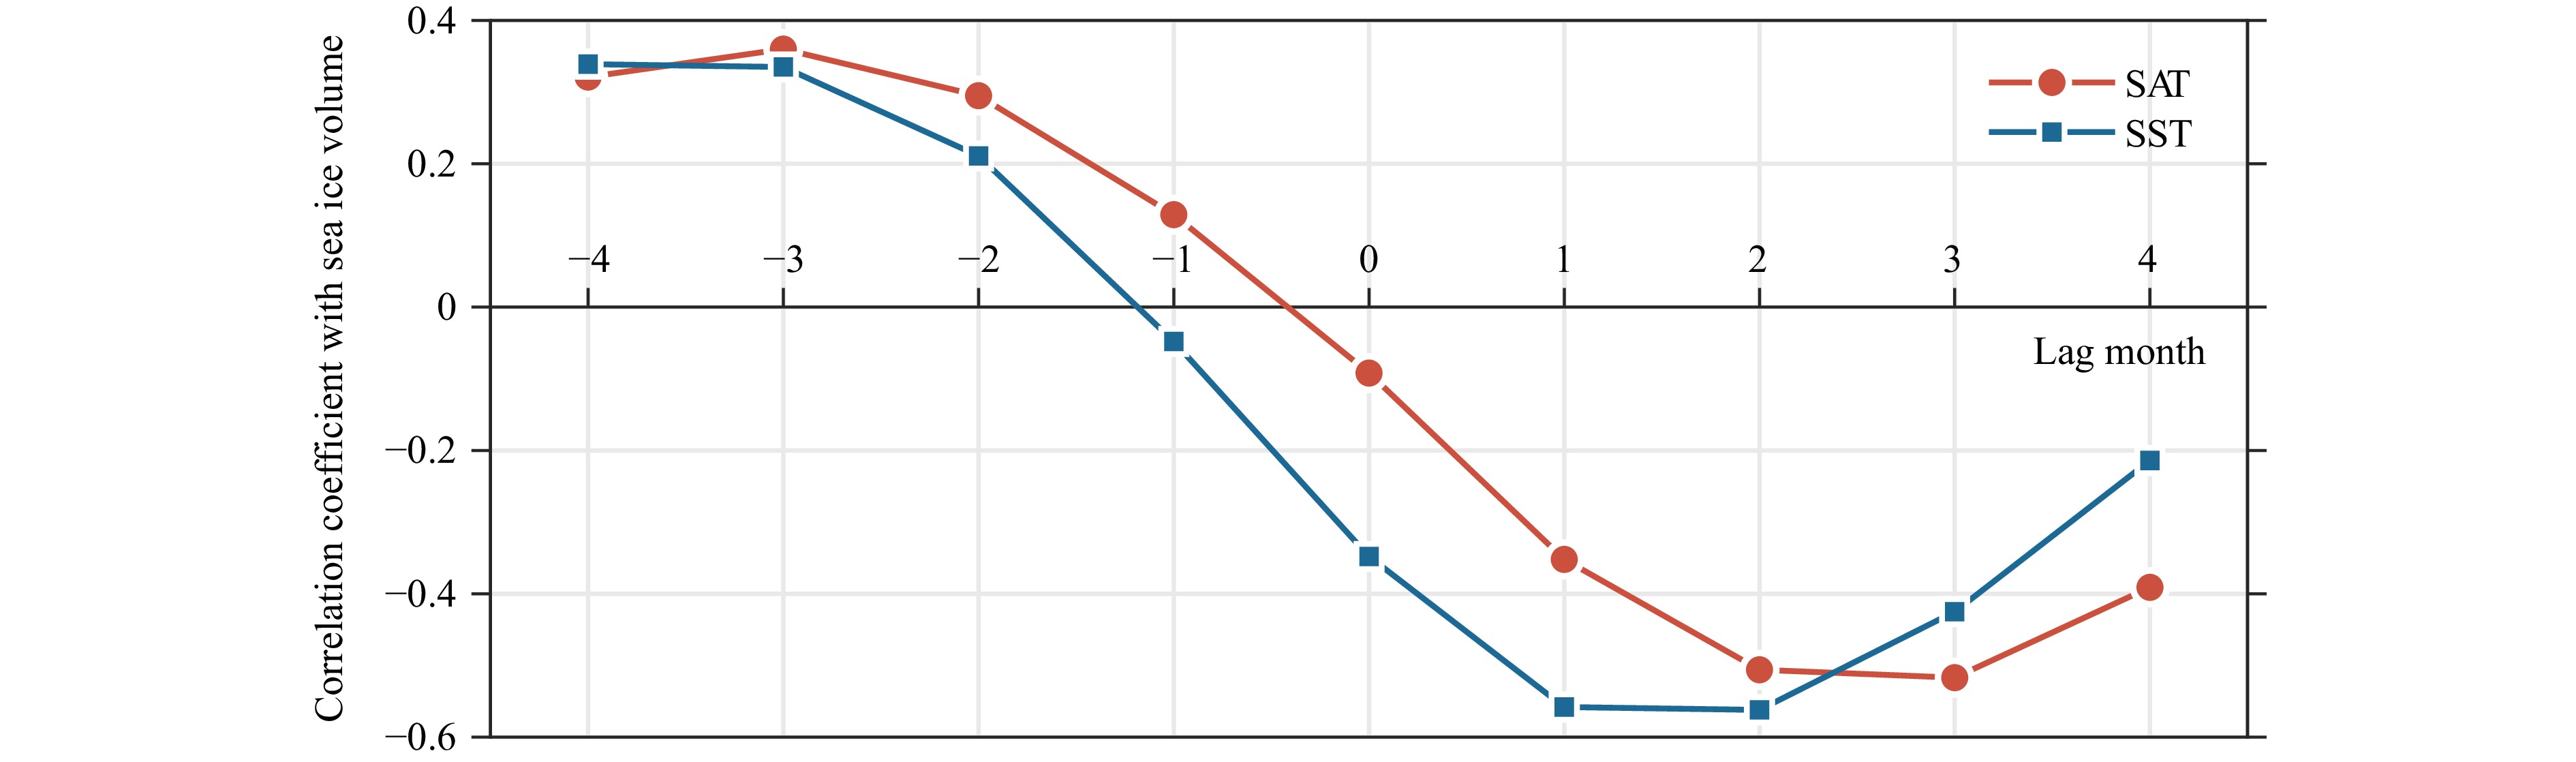
Figure 12. The correlation between variability of sea ice volume due to local forcing in the GS and SAT and SST at different lag months.
Figure 13. Spatial distribution modes and time series coefficients for the EOF analysis of SST (a)–(d) and SAT anomaly (e)–(h).
Figure 14. Correlation between atmospheric circulation indices and sea ice volume flux through FS (a)–(c). * indicates passing the significance test (p<0.05).
Figure 15. Annual Upper 300 m OHC, summer NAO (May–September) and winter NAO (October–April) during 1979-2022. The purple solid trend line denotes passing significant test.


 DownLoad: