Tan Yu, Yuhan Xia, Zhengli Qiu, Bangyi Tao, Yan Bai, Xianqiang He, Bing Chen, Mingxing Li, Yu Wang, Qilan Zhang, Chao Liang. Field observation of air-sea CO2 and H2O flux using the eddy covariance method based on 100 Hz gas analyzer in the Bohai and Yellow Seas[J]. Acta Oceanologica Sinica. doi: 10.1007/s13131-024-2393-9
Citation:
Tan Yu, Yuhan Xia, Zhengli Qiu, Bangyi Tao, Yan Bai, Xianqiang He, Bing Chen, Mingxing Li, Yu Wang, Qilan Zhang, Chao Liang. Field observation of air-sea CO2 and H2O flux using the eddy covariance method based on 100 Hz gas analyzer in the Bohai and Yellow Seas[J]. Acta Oceanologica Sinica. doi: 10.1007/s13131-024-2393-9
Tan Yu, Yuhan Xia, Zhengli Qiu, Bangyi Tao, Yan Bai, Xianqiang He, Bing Chen, Mingxing Li, Yu Wang, Qilan Zhang, Chao Liang. Field observation of air-sea CO2 and H2O flux using the eddy covariance method based on 100 Hz gas analyzer in the Bohai and Yellow Seas[J]. Acta Oceanologica Sinica. doi: 10.1007/s13131-024-2393-9
Citation:
Tan Yu, Yuhan Xia, Zhengli Qiu, Bangyi Tao, Yan Bai, Xianqiang He, Bing Chen, Mingxing Li, Yu Wang, Qilan Zhang, Chao Liang. Field observation of air-sea CO2 and H2O flux using the eddy covariance method based on 100 Hz gas analyzer in the Bohai and Yellow Seas[J]. Acta Oceanologica Sinica. doi: 10.1007/s13131-024-2393-9
College of Oceanography and Ecological Science, Shanghai Ocean University, Shanghai 201306, China
2.
State Key Laboratory of Satellite Ocean Environment Dynamics, Second Institute of Oceanography, Ministry of Natural Resources, Hangzhou 310012, China
3.
Key Laboratory of Environmental Optics and Technology, Hefei Institutes of Physical Sciences, Chinese Academy of Sciences, Hefei 230031, China
4.
Anhui Cen Feng Techhnology Co., LTD, Hefei 230088, China
5.
Donghai Laboratory, Zhoushan 316021, China
6.
School of Art & Design, Shanghai Polytechnic University, Shanghai 201209, China
Funds:
The National Key Research and Development Program of China under contract NO. 2022YFC3104203 and 2018YFC0213103; Science Foundation of Donghai Laboratory under contract NO. DH-2022KF01019; The National Natural Science Foundation, grant number 41906152 and 2023 Shanghai Education Science Research Project, grant number C2023120.
Air-sea water vapor and CO2 flux observation experiments were carried out at the Yantai National Satellite Ocean Calibration Platform and the jetty at Monolithic Beach, Juehua Island, using a 100 Hz gas analyzer. The observations were corrected by employing wild point rejection, linear detrending, delay correction, coordinate rotation, time matching, and WPL correction. The results of spectral analysis and a turbulence development adequacy data quality check showed that the overall observation data quality was good. The air-sea water vapor and CO2 flux results showed that the observation duration affected both the air-sea flux intensity and direction at different observation frequencies. At shorter observation durations, the air-sea flux values measured at 100 Hz were smaller than the 20 Hz measurements and had opposite directions. In addition, the WPL correction reduced the overall air-sea flux and partially minimized the effect of observation frequency on the air-sea flux intensity. These results showed that high-frequency observations showed more turbulence variations than low-frequency observations. This conclusion could promote an understanding of small-scale turbulence variations.
Figure 1. Air-sea flux observation platforms. Symbol‘★’is the observation platform of Juehua Island, and‘▲’is the Yantai National Satellite Ocean Calibration Platform.
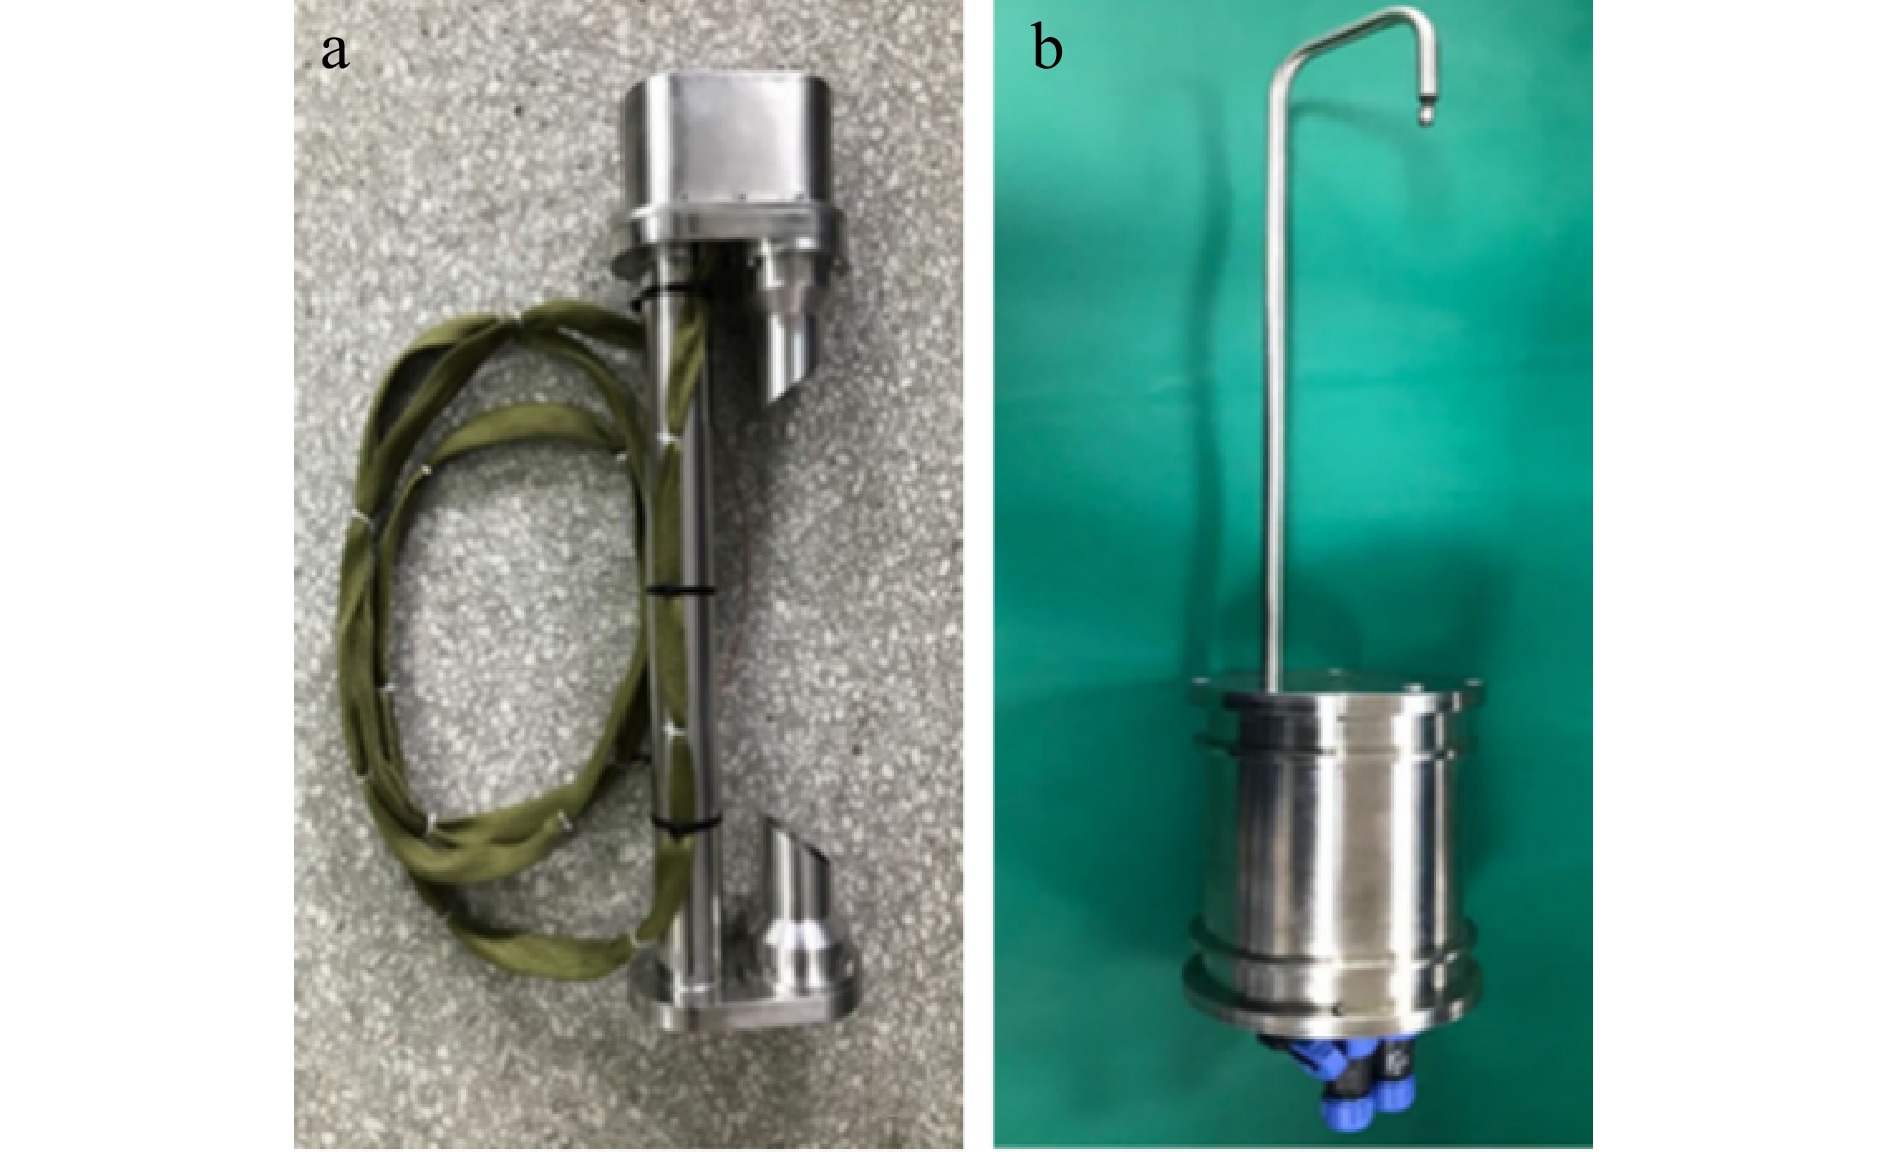
Figure 2. High-frequency 100 Hz pulsating gas analyzer. (a) CO2 gas analyzer; (b) H2O gas analyzer.
Figure 3. In situ observation experiments. (a) and (b) are the Yantai National Satellite Ocean Calibration Platform and the island observation platform at Juehua Island, Liaoning Province, respectively; (c) and (d) are the instrumentation of platforms (a) and (b), respectively.
Figure 4. Raw data preprocessing and air-sea flux calculation flow chart. The dashed boxes represent steps that are not included in the main air-sea flux calculation process and are discussed separately in this article.
Figure 5. Delay times. Delay time of ultrasonic anemometer with high-frequency CO2 pulsometer (a) and with high-frequency water vapor pulsometer (b).
Figure 6. Three-dimensional wind speed correction. (a) Before correction; (b) after correction. In the Fig., “○” is the average of 5 min wind speed samples from the offshore platform and the solid line is the vertical distance between “○” and the u-v plane.
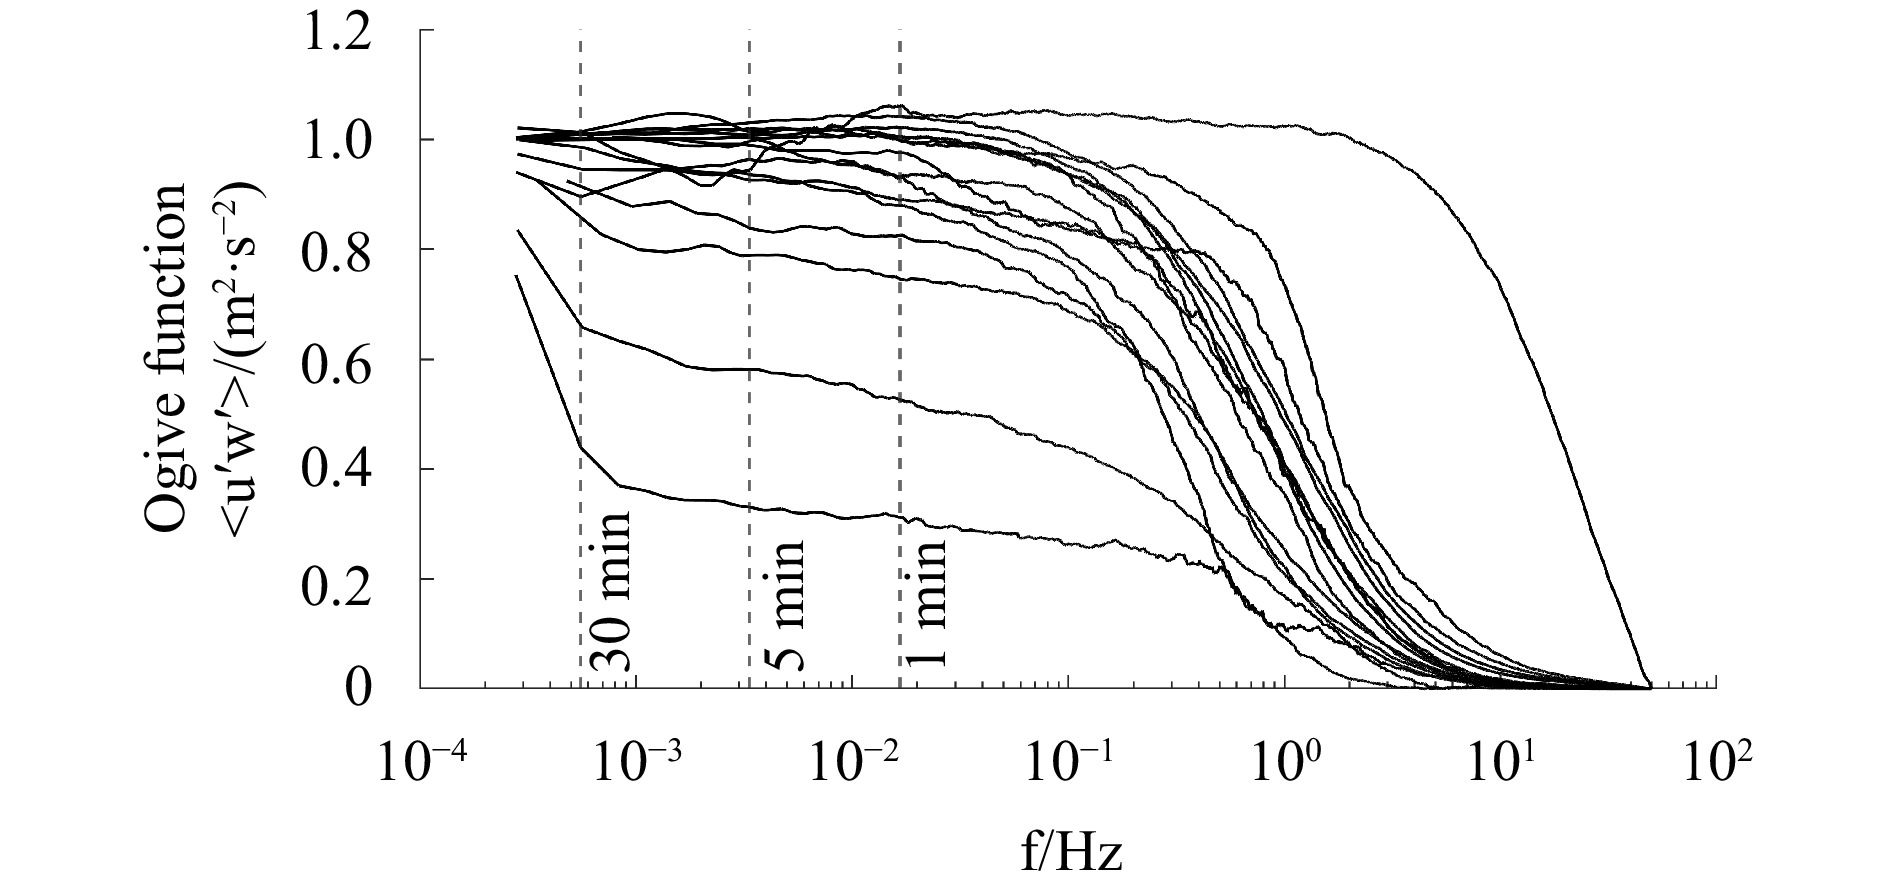
Figure 7. Ogive curves of downwind and vertical wind speeds plotted for 16 randomly selected days from our July 2021 offshore platform observations, and randomly selecting 1 hour data each day. Each Ogive Curve corresponds to one hour of data from one of the days. $ z/L= 0 $.
Figure 8. Water vapor flux WPL correction (July 10, 2021). Black lines indicate uncorrected air-sea fluxes; solid gray lines indicate corrected results; red dashed lines indicate the difference between pre-correction minus correction, and “//” indicates truncated invalid data.
Figure 9. Wind speed power spectra. (a), (b), (c) and (d), (e), (f) are the power spectra of offshore platforms and island of $ u $, $ v $, and $ w $, respectively; solid gray lines indicate measured data, “○” indicates averaged data, and dashed lines indicate “–2/3” slopes.
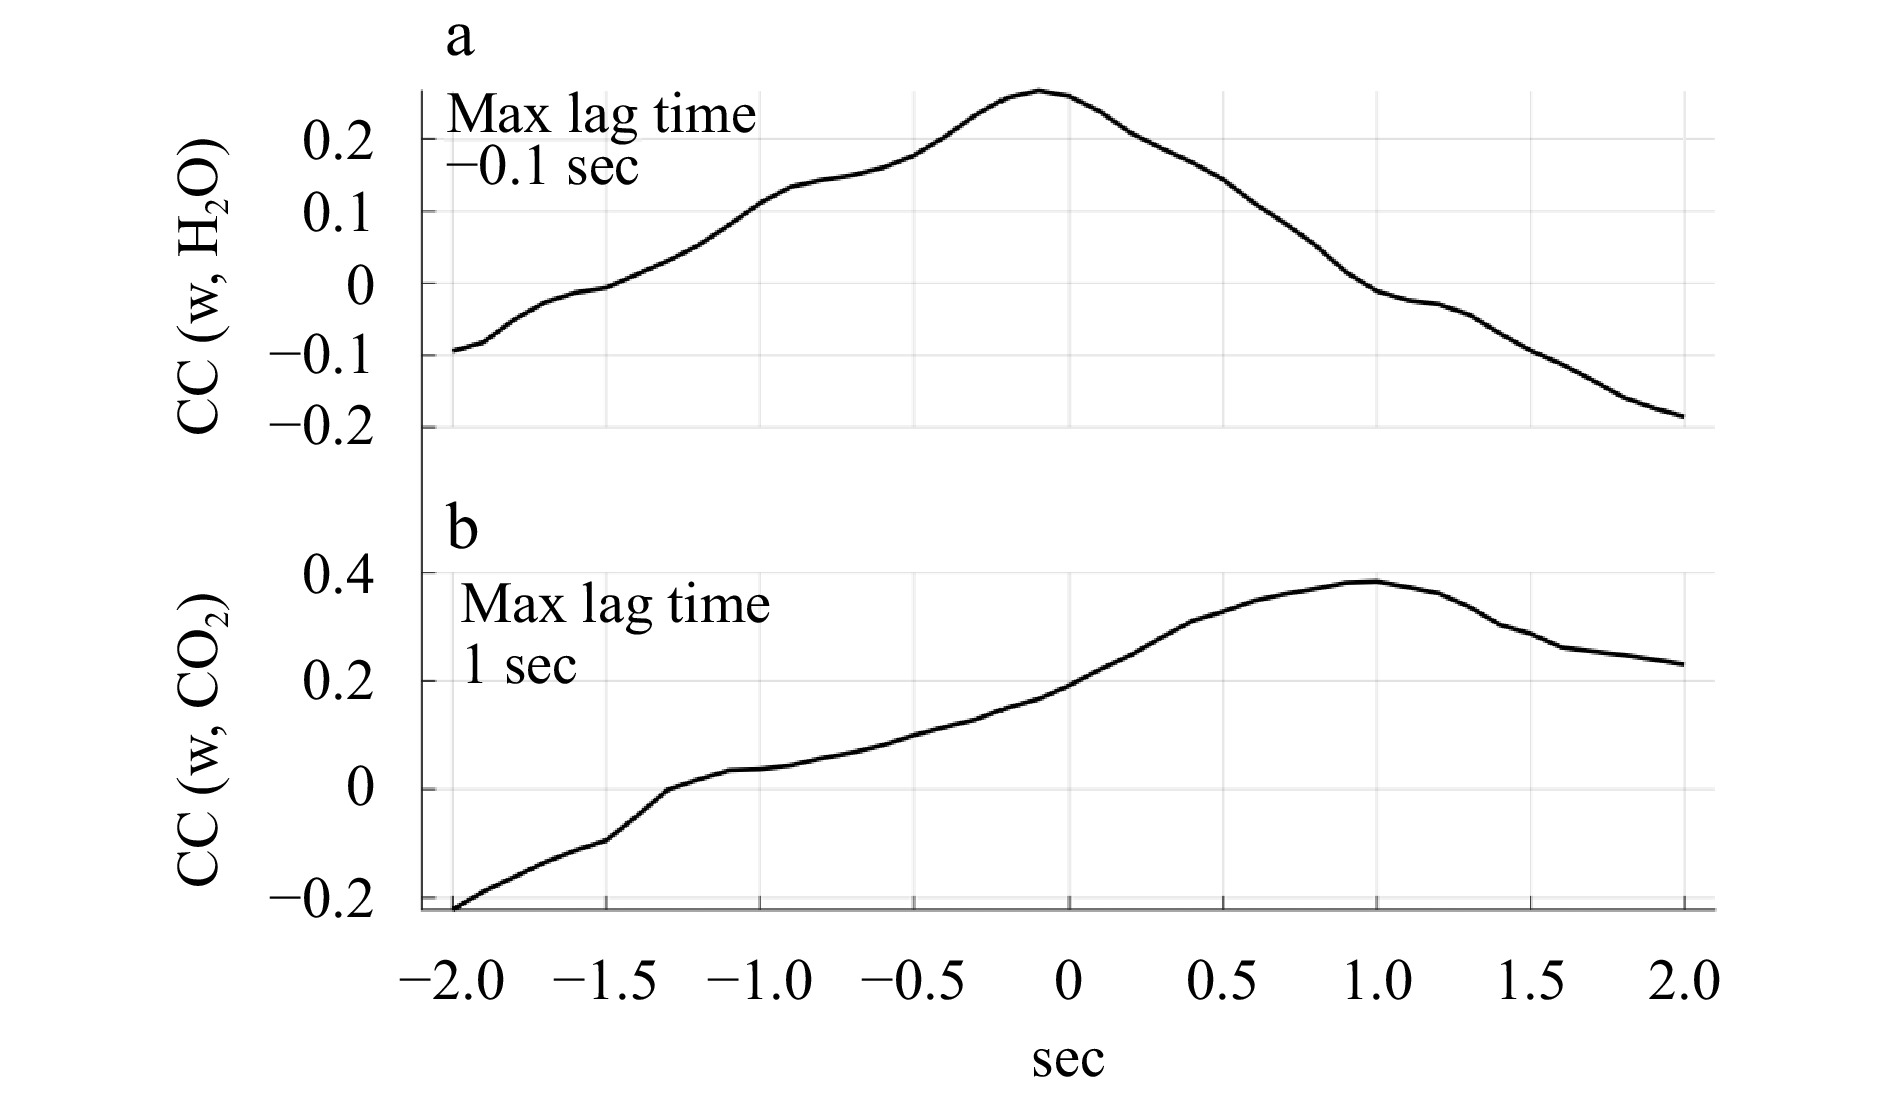
Figure 10. Co-spectral analysis. (a), (b) are co-spectra of $ w $ with H2O and CO2, respectively. The solid gray line indicates co-spectra of $ w $ with H2O (Fig. 10a) and CO2 (Fig. 10b) respectively. And “●” indicates averaged co-spectra data, the dashed line indicates the “–4/3” slope; the solid black line indicates the Kaimal et al. (1972) is suitable for atmospheric stabilization.
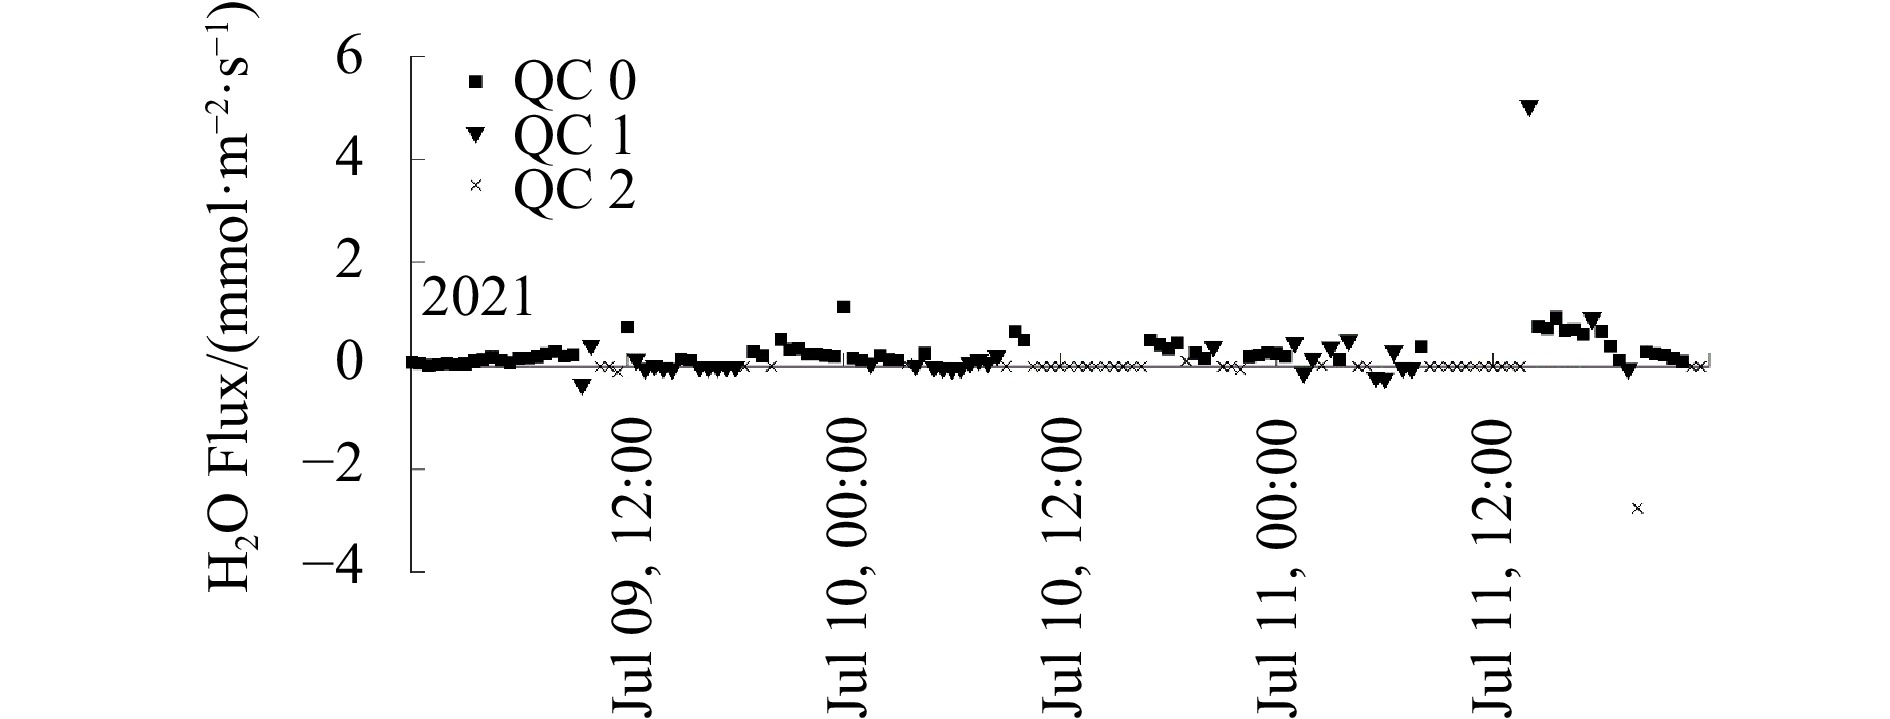
Figure 11. Overall turbulence data quality for island water vapor flux observations. “■” denotes high quality data; “▼” denotes moderate quality data; “×” denotes invalid data.
Figure 12. Air-sea flux observations from offshore platforms. (a) is the water vapor flux and (b) is the CO2 flux. “▼” denotes 100 Hz frequency; “●” denotes 20 Hz frequency; dashed line denotes zero air-sea flux.
Figure 13. Comparison of observed air-sea fluxes at different frequencies over the island. (a) Difference between 100 Hz and 20 Hz air-sea fluxes; (b), (c), and (d) are partial zoomed-in plots showing island air-sea flux observations on July 9, 10, and 11, 2021, respectively. The “//” denotes the axes of the truncated, partially invalid data, “▼” denotes 100 Hz, and “●” denotes 20 Hz.
Figure 14. Water vapor and CO2 concentrations over time; (a) and (b) are water vapor versus time for offshore platform and island data, respectively. The inner image of (a) is its local zoom; (c) is the CO2 variation with time. The red solid line indicates 100 Hz observations and the black solid line indicates 20 Hz observations.
Figure 15. Island and nearshore air-sea fluxes vary with wind speed; red dots indicate 100 Hz observed air-sea fluxes, black squares indicate 20 Hz observed air-sea fluxes; error bars indicate 95% confidence intervals.
Figure 16. Trends and confidence analyses of air-sea CO2 and water vapor fluxes; red dots indicate 100 Hz air-sea flux data, blue dots indicate 20 Hz air-sea flux data; red and blue lines indicate fitted curves; and shaded areas indicate 95% confidence limits.


 DownLoad: