Xinyu Mei, Zhongbiao Chen, Runxia Sun, Yijun He. Detection and Analysis of Spartina alterniflora in Chongming East Beach Using Sentinel-2 Imagery and Image Texture Features[J]. Acta Oceanologica Sinica. doi: 10.1007/s13131-024-2394-8
Citation:
Xinyu Mei, Zhongbiao Chen, Runxia Sun, Yijun He. Detection and Analysis of Spartina alterniflora in Chongming East Beach Using Sentinel-2 Imagery and Image Texture Features[J]. Acta Oceanologica Sinica. doi: 10.1007/s13131-024-2394-8
Xinyu Mei, Zhongbiao Chen, Runxia Sun, Yijun He. Detection and Analysis of Spartina alterniflora in Chongming East Beach Using Sentinel-2 Imagery and Image Texture Features[J]. Acta Oceanologica Sinica. doi: 10.1007/s13131-024-2394-8
Citation:
Xinyu Mei, Zhongbiao Chen, Runxia Sun, Yijun He. Detection and Analysis of Spartina alterniflora in Chongming East Beach Using Sentinel-2 Imagery and Image Texture Features[J]. Acta Oceanologica Sinica. doi: 10.1007/s13131-024-2394-8
School of Marine Sciences, Nanjing University of Information Science and Technology, Nanjing, 210044, China
Funds:
The National Key Research and Development Program of China under contract No. 2023YFC3008204; the National Natural Science Foundation of China under contract Nos 41977302 and 42476217.
Spartina alterniflora Loisel is now listed among the world’s 100 most dangerous invasive species, severely affecting the ecological balance of coastal wetlands. Remote sensing technologies based on deep learning enable large-scale monitoring of Spartina alterniflora, but they require large datasets and have poor interpretability. A new method is proposed to detect Spartina alterniflora Loisel from Sentinel-2 imagery. Firstly, to get the high canopy cover and dense community characteristics of Spartina alterniflora Loisel, multi-dimensional shallow features are extracted from the imagery. Secondly, to detect different objects from satellite imagery, index features are extracted, and the statistical features of the gray-level co-occurrence matrix (GLCM) are derived using Principal Component Analysis - Gray-Level Co-Occurrence Matrix (PCA-GLCM). Then, ensemble learning methods, including Random Forest (RF), eXtreme Gradient Boosting (XGBoost), and Light Gradient Boosting Machine (LightGBM) models, are employed for image classification. Meanwhile, Recursive Feature Elimination with Cross-Validation (RFECV) is used to select the best feature subset. Finally, to enhance the interpretability of the models, the best features are utilized to classify multi-temporal images and SHapley Additive exPlanations (SHAP) is combined with these classifications to explain the model prediction process. The method is validated by using Sentinel-2 imageries and previous observations of Spartina alterniflora Loisel in Chongming Island, it is found that the model combining image texture features such as GLCM covariance can significantly improve the detection accuracy of Spartina alterniflora by about 8% compared with the model without image texture features. Through multiple model comparisons and feature selection via RFECV, the selected model and eight features demonstrated good classification accuracy when applied to data from different time periods, proving that feature reduction can effectively enhance model generalization. Additionally, visualizing model decisions using SHAP revealed that the image texture feature component_1_GLCMVariance is particularly important for identifying each land cover type.
Figure 3. The curve of cross-validated scores as the number of features changes, based on RFECV feature selection applied to the original 20-dimensional features. A line chart of (a) RF+RFECV, a line chart of (b) LightGBM+RFECV and a line chart of (c) XGBoost+RFECV are showed on the top.
Figure 4. Model accuracy with different features. (a) The feature importance of the RF model and the overall model accuracy as the feature combination changes. (b) The variation of Spartina alterniflora classification accuracy with different feature combinations.
Figure 5. Accuracy of various land covers under different models. (a) Comparison of different models under 20 feature combinations. (b) Comparison of optimal models.
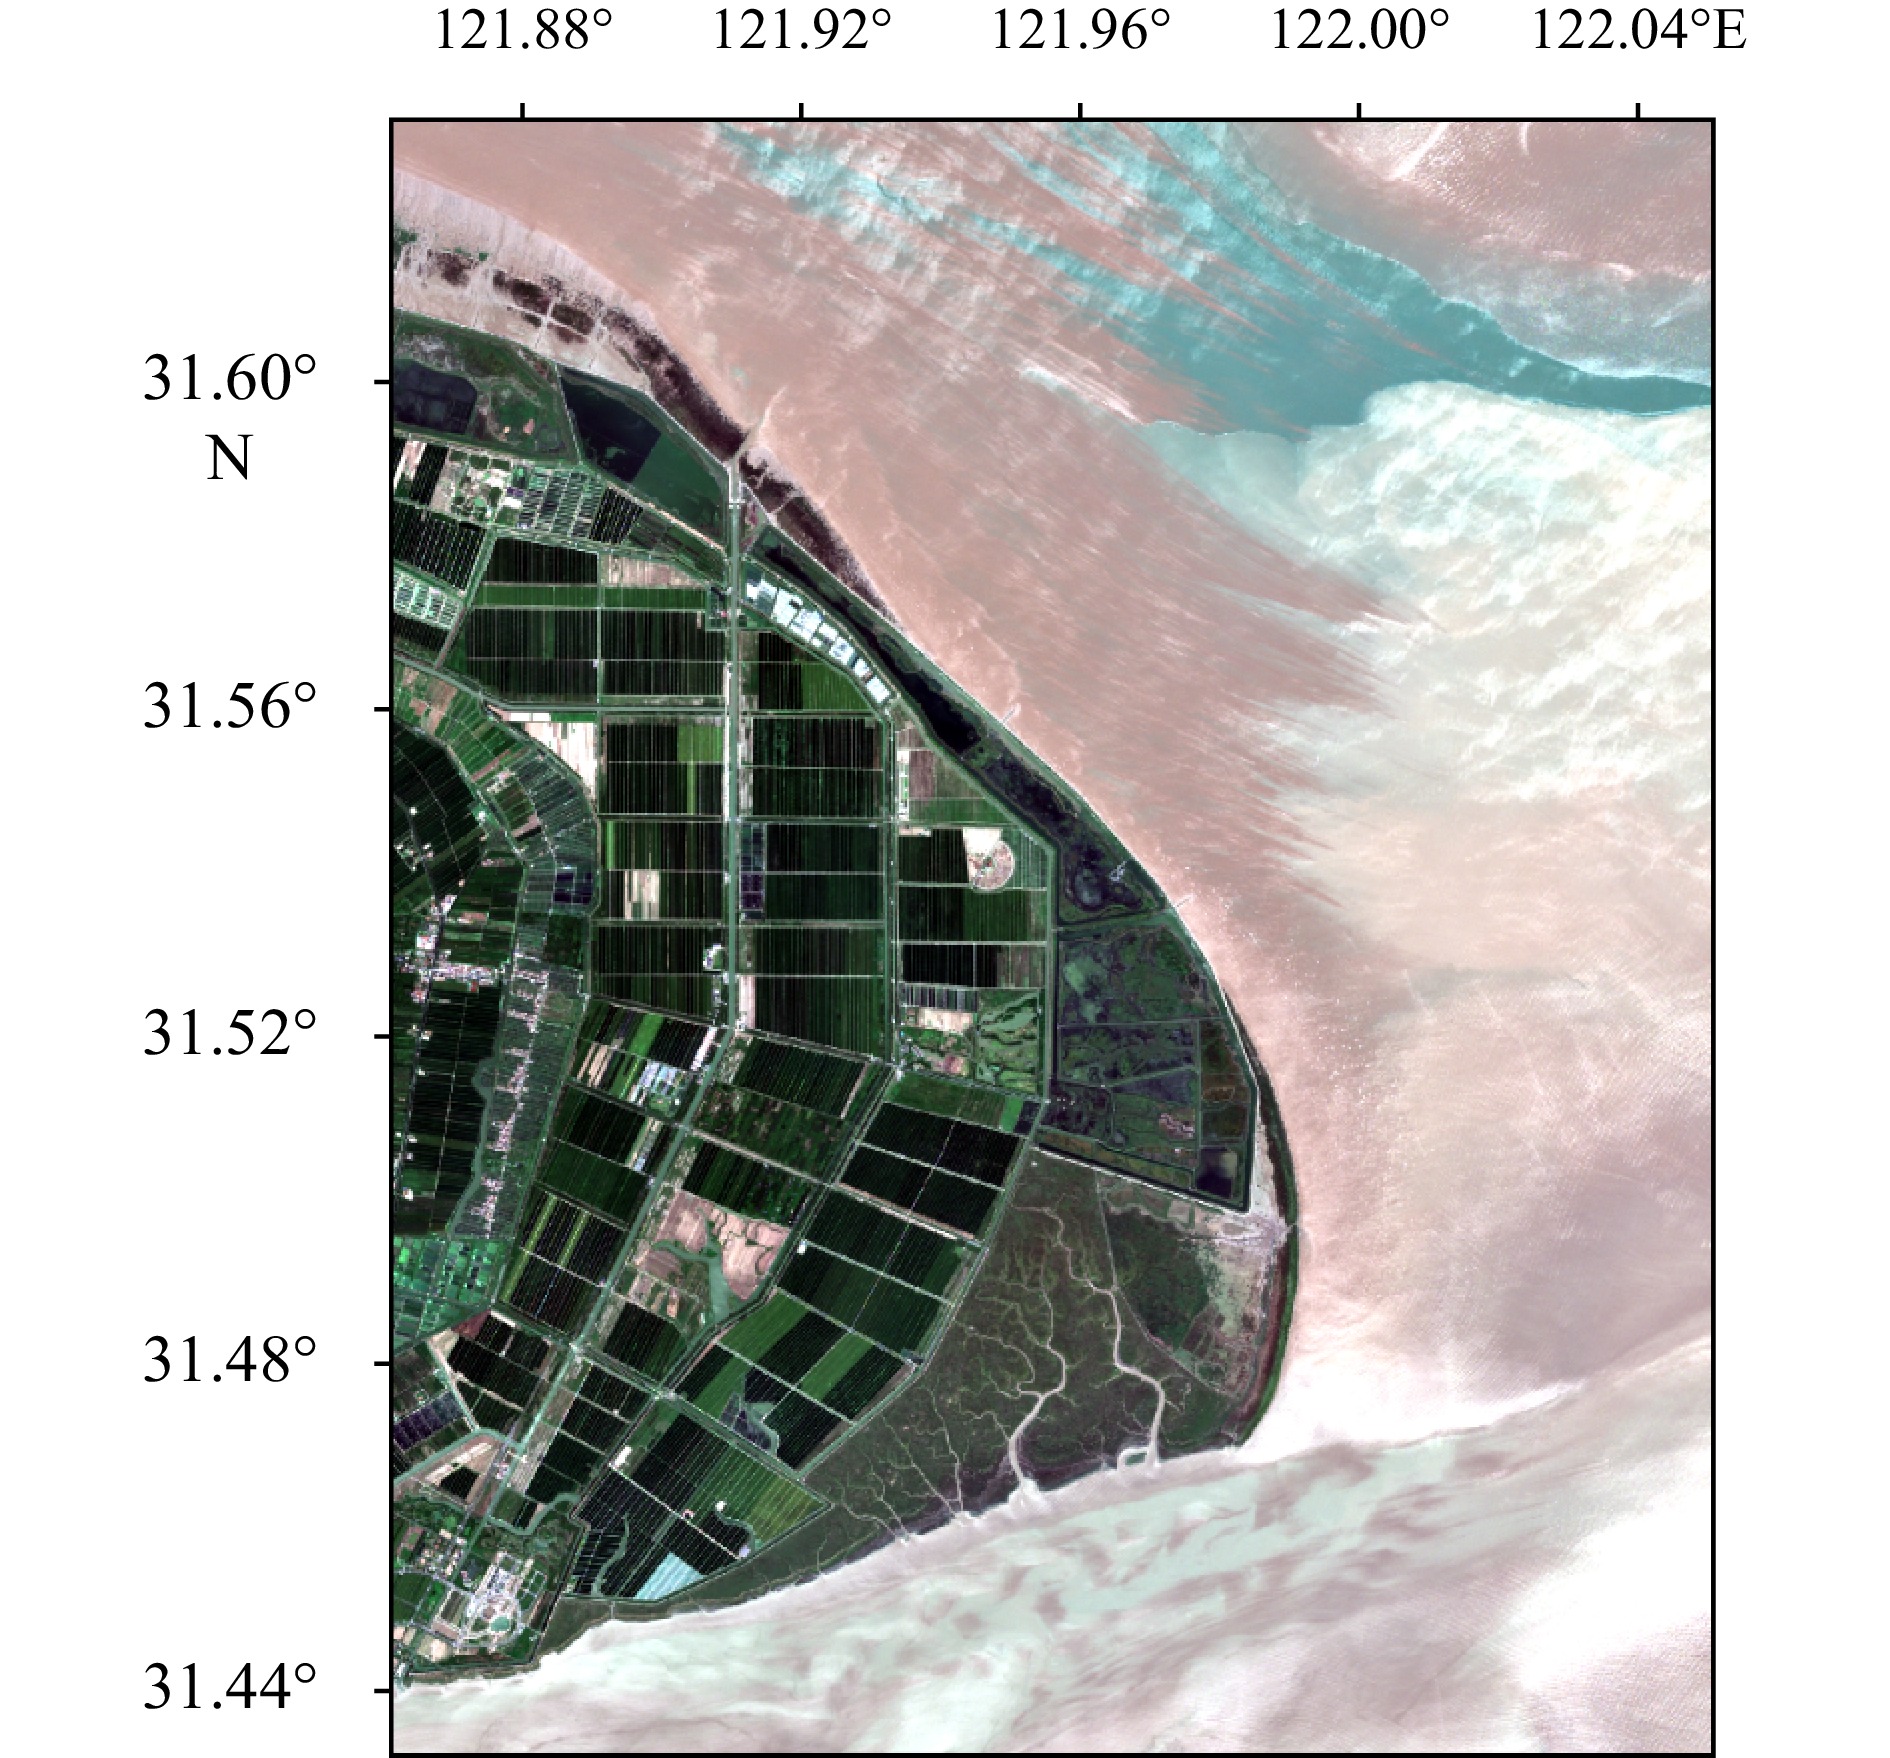
Figure 6. The selected four Sentinel-2 images from (a) January 21, 2020, (b) April 23, 2020, (c) June 2, 2020, and (d) September 5, 2020, for land cover classification and Spartina alterniflora detection. Figure 6e represents the land cover interpretation results.
Figure 7. The SHAP summary plot for each land cover type. (a) SHAP summary plot for farmland classification, (b) SHAP summary plot for breed classification, (c) SHAP summary plot for Spartina alterniflora classification, (d) SHAP summary plot for Staggered bands classification, (e) SHAP summary plot for water classification, (f) SHAP summary plot for other classification.


 DownLoad: