Genggeng Wen, Kuiyuan Wan, Shaohong Xia, Xiuwei Ye, Huilong Xu, Chaoyan Fan, Jinghe Cao, Shunshan Xu. Tomographic inversion of OBS converted shear waves: Case study of profile EW6 in the Dongsha area[J]. Acta Oceanologica Sinica.
Citation:
Genggeng Wen, Kuiyuan Wan, Shaohong Xia, Xiuwei Ye, Huilong Xu, Chaoyan Fan, Jinghe Cao, Shunshan Xu. Tomographic inversion of OBS converted shear waves: Case study of profile EW6 in the Dongsha area[J]. Acta Oceanologica Sinica.
Genggeng Wen, Kuiyuan Wan, Shaohong Xia, Xiuwei Ye, Huilong Xu, Chaoyan Fan, Jinghe Cao, Shunshan Xu. Tomographic inversion of OBS converted shear waves: Case study of profile EW6 in the Dongsha area[J]. Acta Oceanologica Sinica.
Citation:
Genggeng Wen, Kuiyuan Wan, Shaohong Xia, Xiuwei Ye, Huilong Xu, Chaoyan Fan, Jinghe Cao, Shunshan Xu. Tomographic inversion of OBS converted shear waves: Case study of profile EW6 in the Dongsha area[J]. Acta Oceanologica Sinica.
CEA Key Laboratory of Earthquake Monitoring and Disaster Mitigation Technology, Guangdong Earthquake Agency, Guangzhou 510070, China
2.
Guangdong Science and Technology Collaborative Innovation Center for Earthquake Prevention and Disaster Mitigation, Guangzhou 510070, China
3.
MOE Key Laboratory of Disaster Forecast and Control in Engineering-Urban Earthquake Safety Laboratory, Guangzhou 510070, China
4.
CAS Key Laboratory of Ocean and Marginal Sea Geology, South China Sea Institute of Oceanology, Chinese Academy of Sciences, Guangzhou 510301, China
5.
Southern Marine Science and Engineering Guangdong Laboratory (Guangzhou), 511458, China
6.
Centro de Geociencias, Universidad Nacional Autónoma de México, Querétaro, C.P. 76230, Mexico
Funds:
The National Natural Science Foundation of China under contract Nos 42276062 and 42006071; Seismological Research Foundation for Youths of Guangdong Earthquake Agency under contract No. GDDZY202307; Strategic Priority Research Program of Chinese Academy of Sciences under contract No. XDA22020303; Science and Technology Planning Project of Guangdong Province-Guangdong Collaborative Innovation Center for Earthquake Prevention and Disaster Mitigation Technology under contract No. 2018B020207011.
Studies of converted S-wave data recorded on the Ocean Bottom Seismometer (OBS) allow for the estimation of crustal S-wave velocity, from which is further derived the Vp/Vs ratio to constrain the crustal lithology and geophysical properties. Constructing a precise S-wave velocity model is important for deep structural research, and inversion of converted S-waves provides a potential solution. However, the inversion of the converted S-wave remains a weakness because of the complexity of the seismic ray path and the inconsistent conversion interface. In this study, we introduced two travel time correction methods for the S-wave velocity inversion and imaged different S-wave velocity structures in accordance with the corresponding corrected S-wave phases using seismic data of profile EW6 in the northeastern South China Sea (SCS). The two inversion models show a similar trend in velocities, and the velocity difference is < 0.15 km/s (mostly in the range of 0–0.1 km/s), indicating the accuracy of the two travel time correction methods and the reliability of the inversion results. According to simulations of seismic ray tracing based on different models, the velocity of sediments is the primary influencing factor in ray tracing for S-wave phases. If the sedimentary layer has high velocities, the near offset crustal S-wave refractions cannot be traced. In contrast, the ray tracing of Moho S-wave reflections was not significantly impacted by the velocity of the sediments. The two travel time correction methods have their own advantages, and the application of different approaches is based on additional requirements. These works provide an important reference for future improvements in converted S-wave research.
Figure 1. The OBSs position and seismic survey lines. Gray areas show the distribution of Mesozoic strata in the northeastern SCS (Yang et al., 2015). Red ellipses indicate volcanic seamounts (Fan et al., 2017).
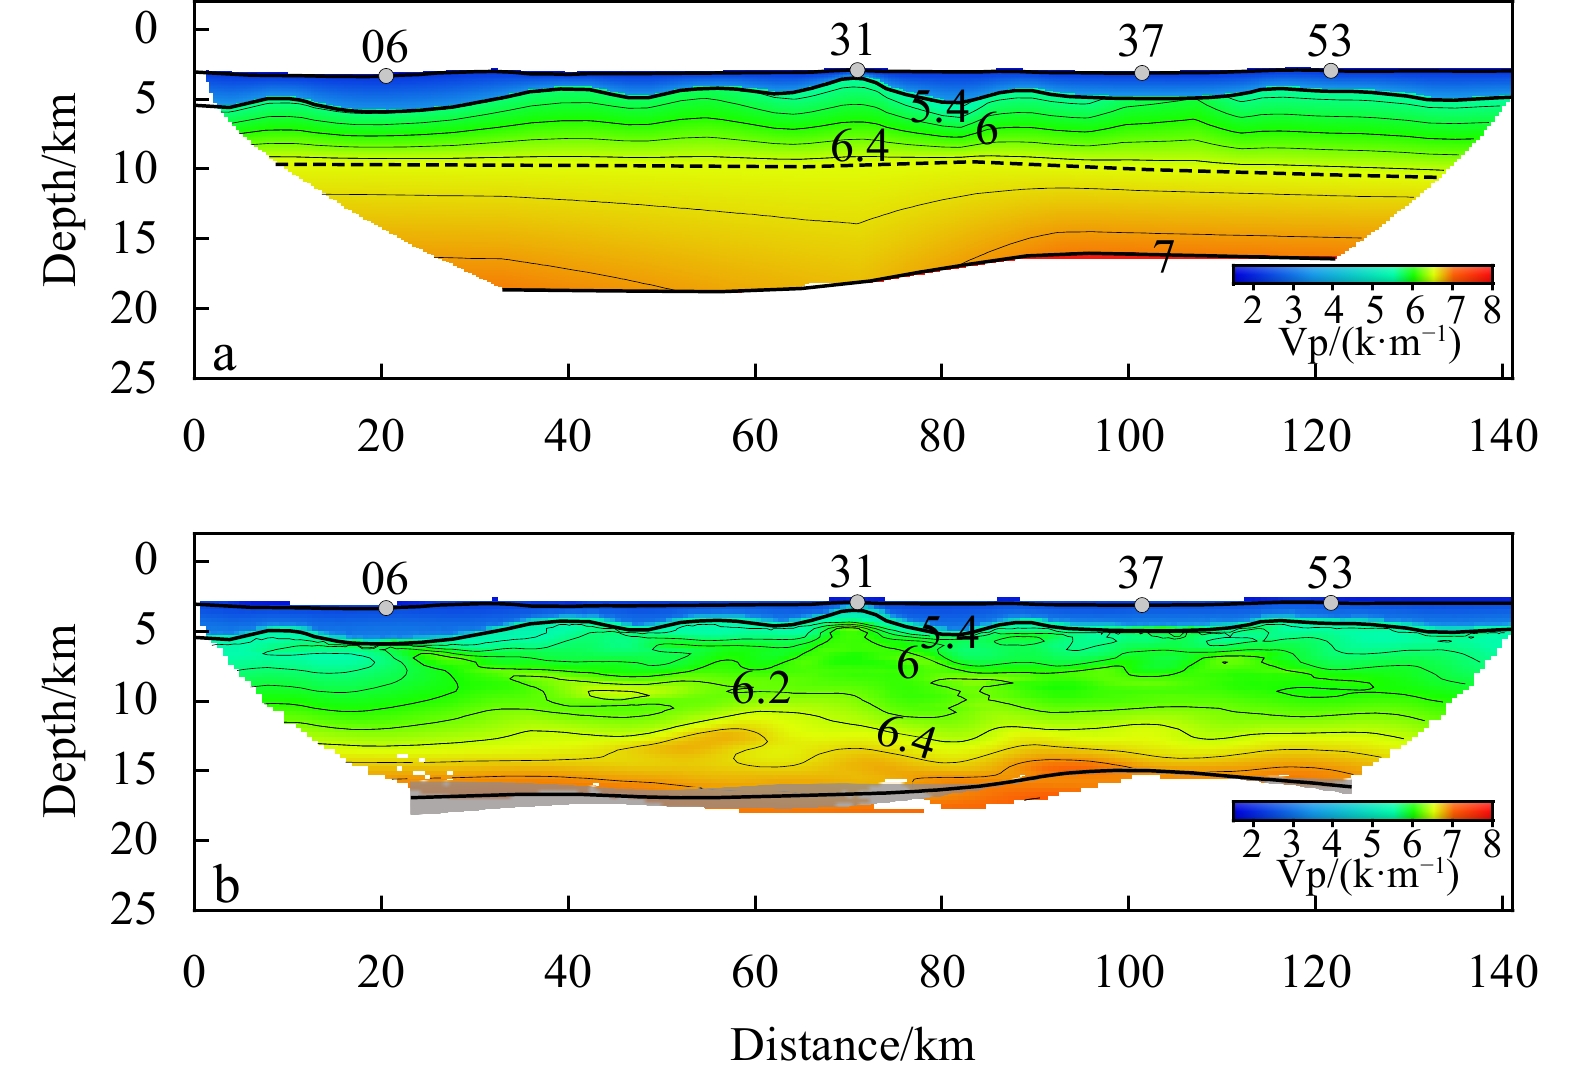
Figure 2. P-wave velocity model along profile EW6. A.The result of the RayInvr forward method (Fan et al., 2019). B.Results of the Tomo2d inversion method. Gray areas show the Moho depth standard deviation. Contour interval is 0.2 km/s.
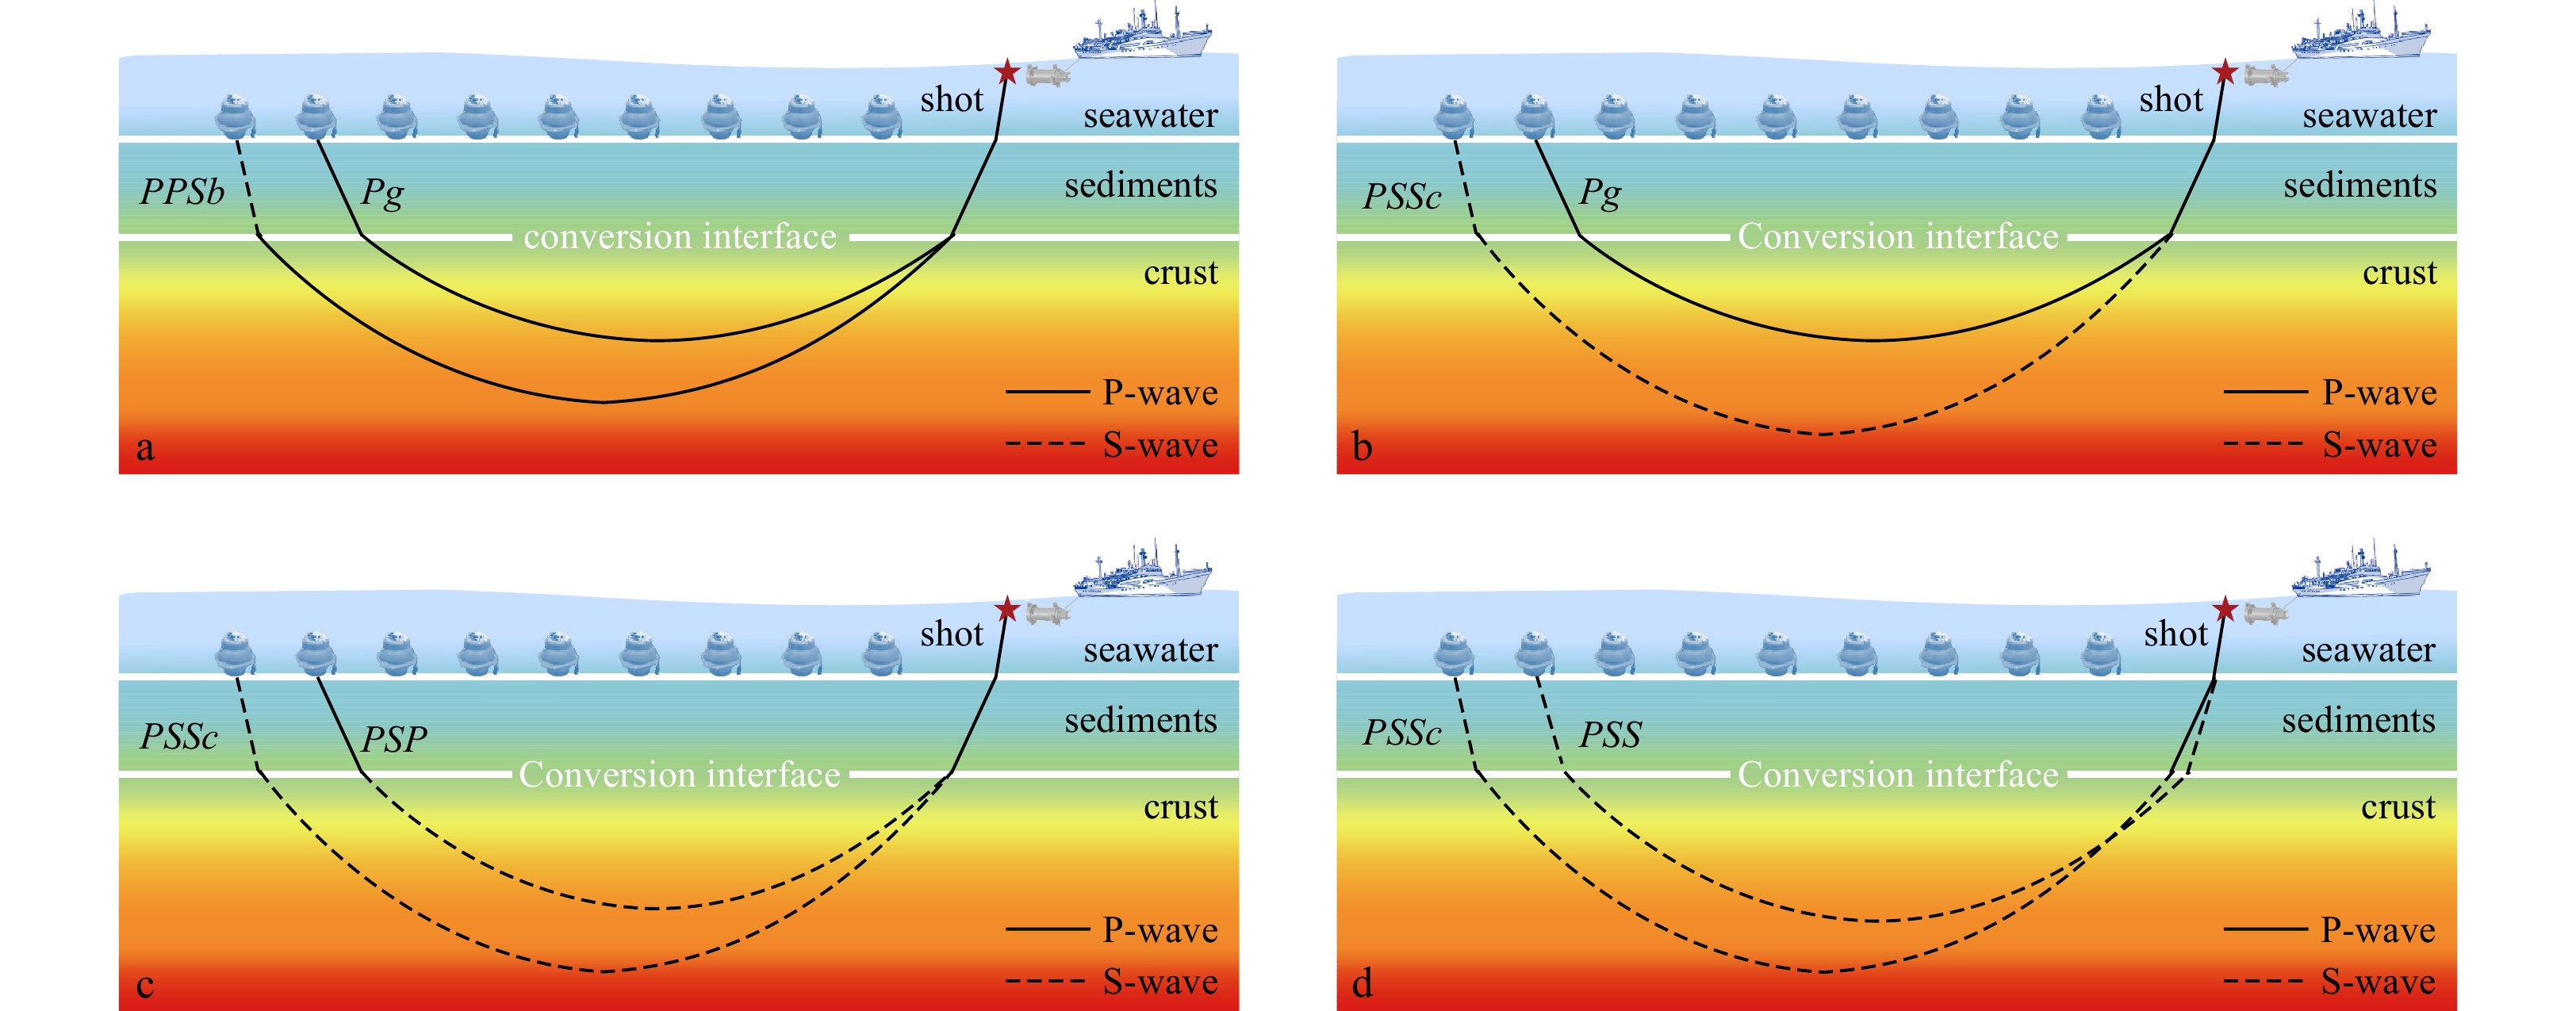
Figure 3. Schematic diagram of the propagation and conversion of the seismic waves. The PPS arrivals (PPSb) were converted from P to S-waves at an interface on the way up (A), while the PSS arrivals (PSSc) were converted on the way down (B). The PSP phase (C) is generated from double conversion at an interface, and only as an S-wave through the crust. The PSP converted at the basement once more than the PSSc when the ray was upgoing, whereas the PSSc was still traveling as an S-wave in the sediments until arriving at the OBS. The PSS phase (D) is converted on the way down at the seafloor. The PSS propagates downward in the sediment as an S-wave, while PSSc is a P-wave.
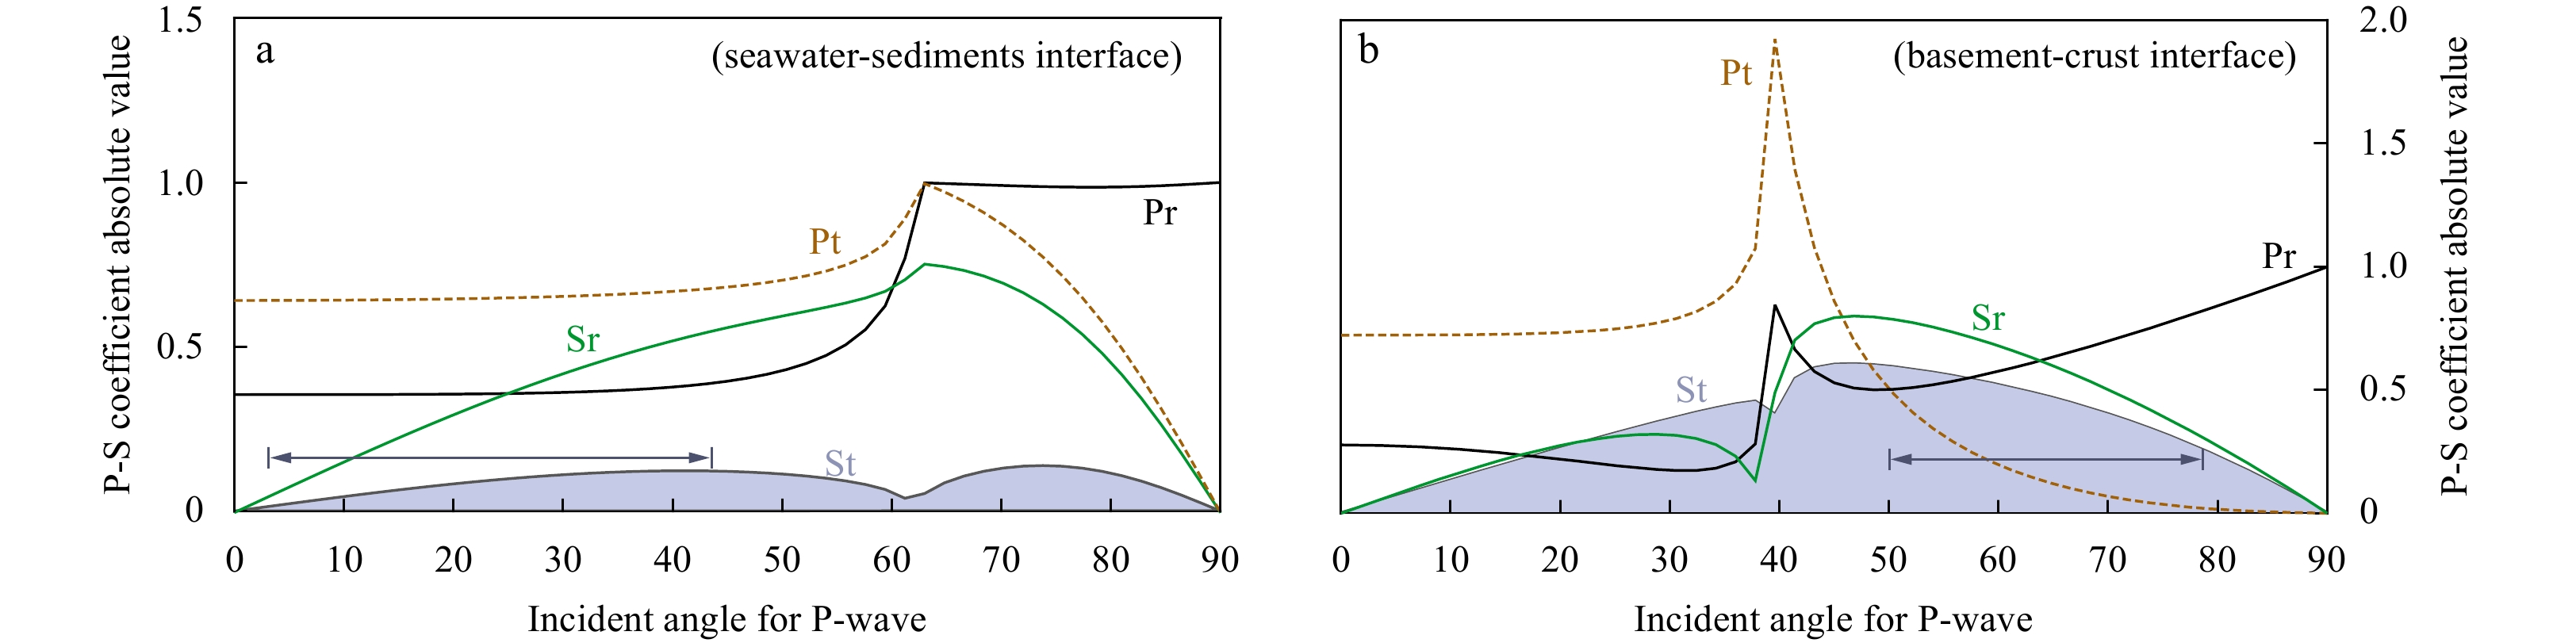
Figure 4. P-S conversion coefficient absolute value of downward seismic wave in different models. Pr, Pt, Sr, and St represent the reflected and transmitted P- and S-waves, respectively. A.Model of seawater and the unconsolidated sediments. Vp1 = 1.5 km/s, Vp2 = 1.7 km/s, Vs1 = 0 km/s, Vs2 = 0.3 km/s, ρ1 = 1.03 kg/m3 and ρ2 =1.92 kg/m3. B.Model of Cenozoic sediments and crust. Vp1 = 3.5 km/s, Vp2 = 5.5 km/s, Vs1 = 1.3 km/s, Vs2 = 3.14 km/s, ρ1 = 2.4 kg/m3 and ρ2 =2.7 kg/m3. The highly probable range of incident angles (calculated from Snell’s Law) for different model are indicated by the arrow.
Figure 5. Seismic profile of radial component at OBS06, with the reduced velocity of 4 km/s(A). The colored dashed lines represent picked travel times, and the thin black lines represent calculated travel times(B). (C) and (D) show the ray tracing of PPS and PSS conversion modes, respectively. Solid lines represent P-wave paths, and dotted lines represent S-wave paths.
Figure 7. The S-wave velocity model from RayInvr forward method. The contour interval is 0.1 km/s (A). Vp/Vs model. The bold red numbers in the model represent the Vp/Vs ratio(B).
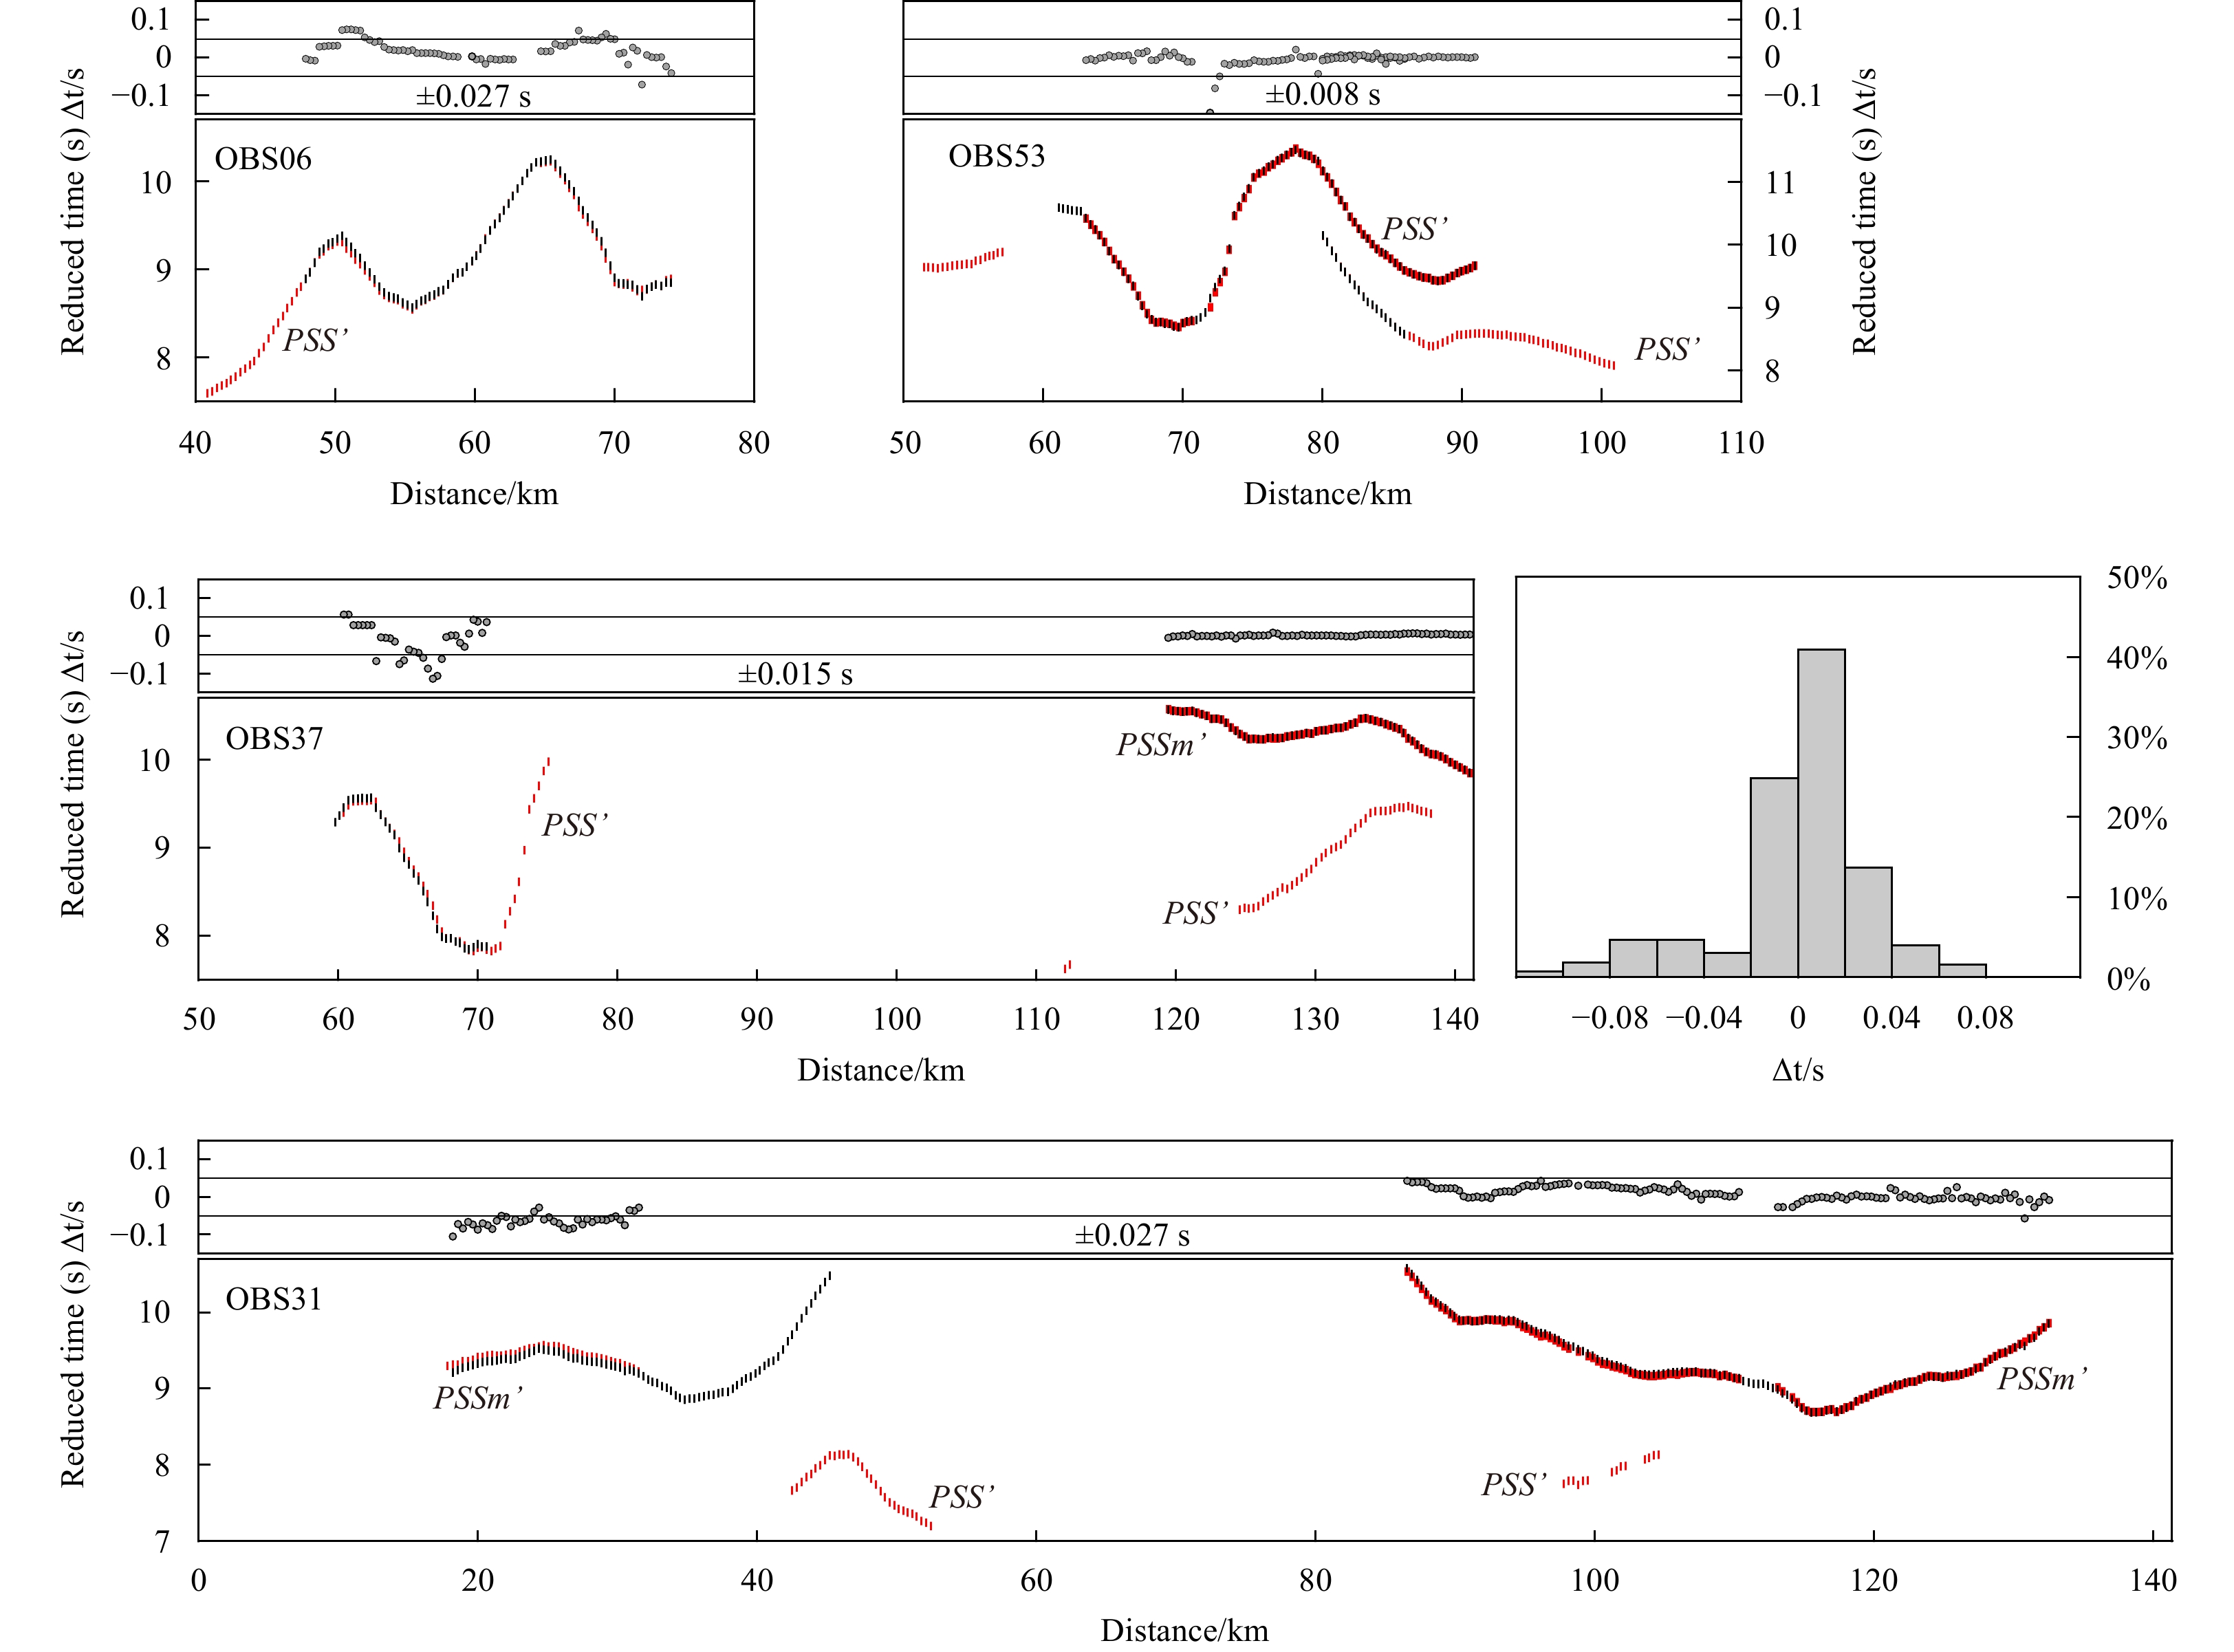
Figure 8. Travel time corrections of converted S-wave phases recorded by OBS37. (A) and (B) are seismic profiles of vertical and radial components, respectively, with a reduced velocity of 4 km/s. (C) show the identification and travel time correction of S-wave phases; colored lines represent picked travel times (PSSm', PSS', PSP', and PSmP' are corrected travel times), and the thin black lines represent calculated travel times from forward modeling.
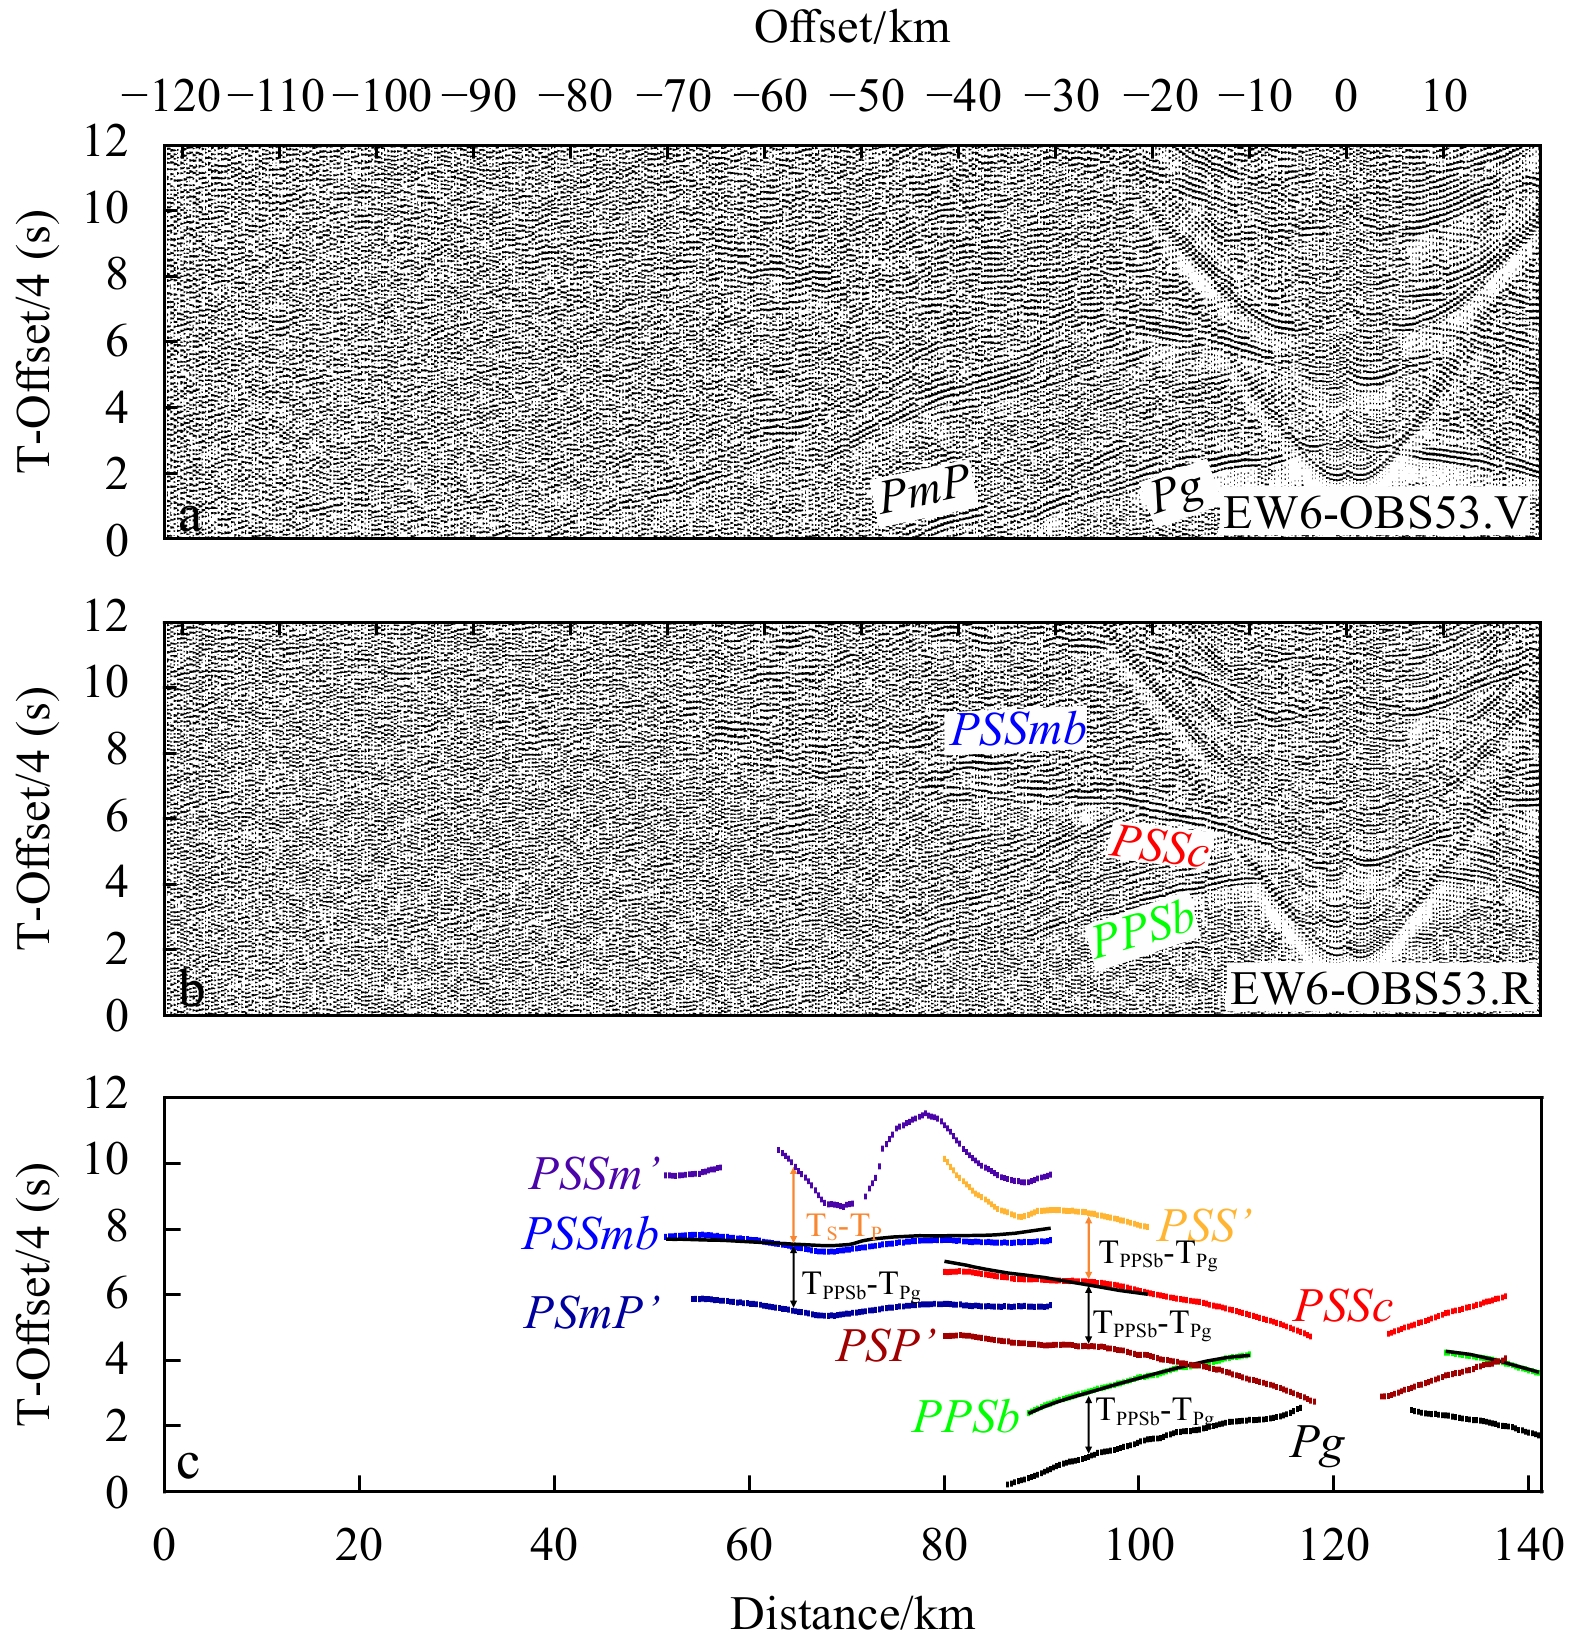
Figure 9. Travel time corrections of converted S-wave phases recorded by OBS53. (A) and (B) are seismic profiles of vertical and radial components, respectively, with a reduced velocity of 4 km/s. (C) show the identification and travel time correction of S-wave phases, colored lines represent picked travel times (PSSm', PSS', PSP', and PSmP' are corrected travel times), and the thin black lines represent calculated travel times from forward modeling.
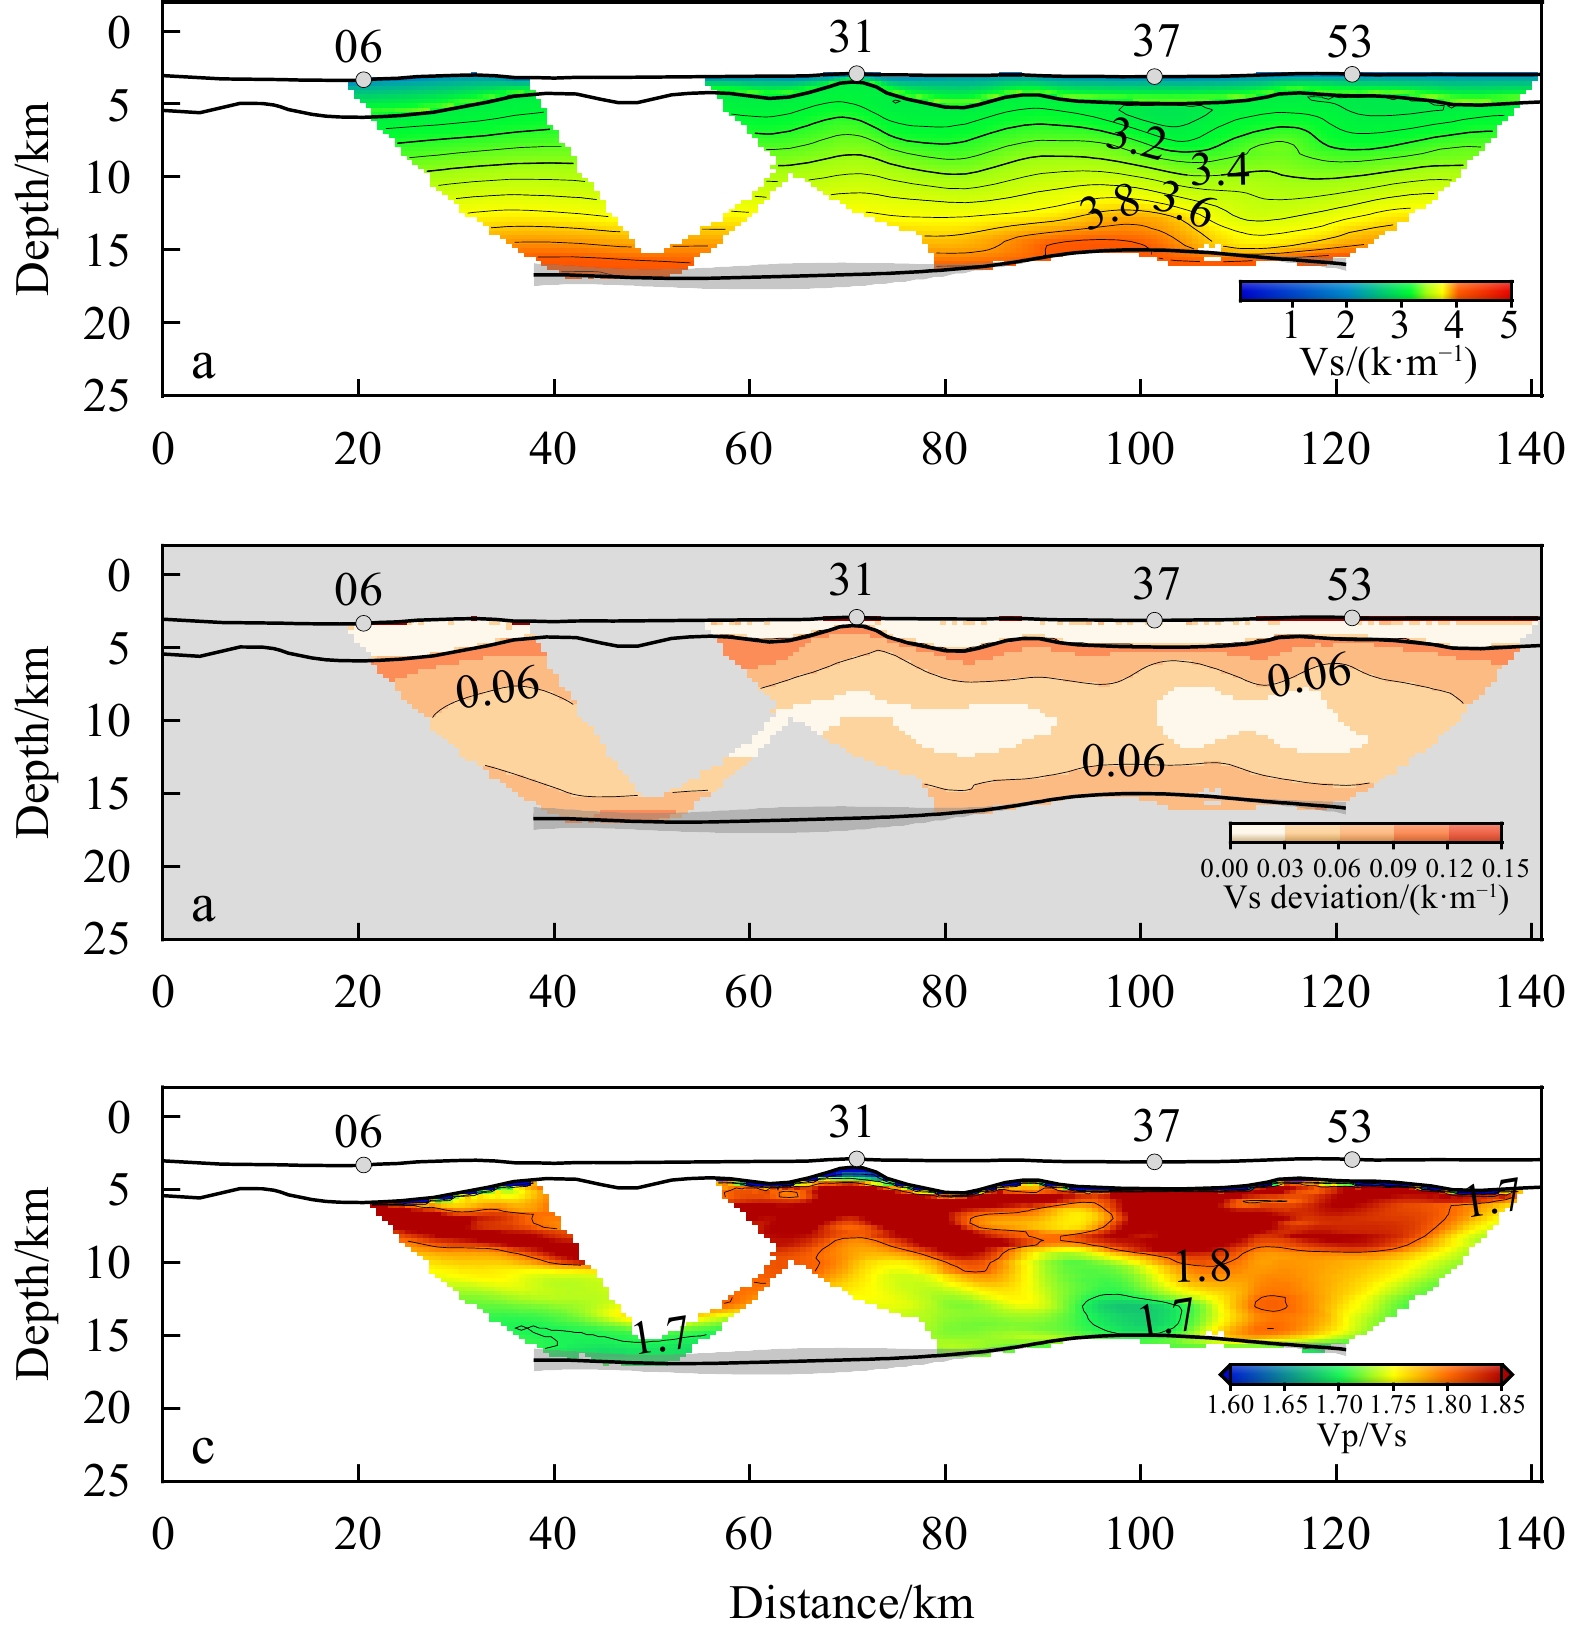
Figure 10. Final tomographic S-wave model based on PSP' phases. (A) The average S-wave velocity model. The contour interval is 0.1 km/s. The velocity value that corresponds to the color scale in the sediment represents the P-wave velocity. (B) The standard deviation of S-wave velocity. (C) The Vp/Vs model calculated from the division of the P-wave (Fig. 2B) and S-wave model (Fig. 10A). Gray areas show the Moho depth standard deviation.
Figure 11. Comparison of the ray paths for initial arrivals and corrected arrivals. Black solid lines represent the original ray path, and the red dotted lines represent the corrected ray path. The number of rays was reduced by 10 times.
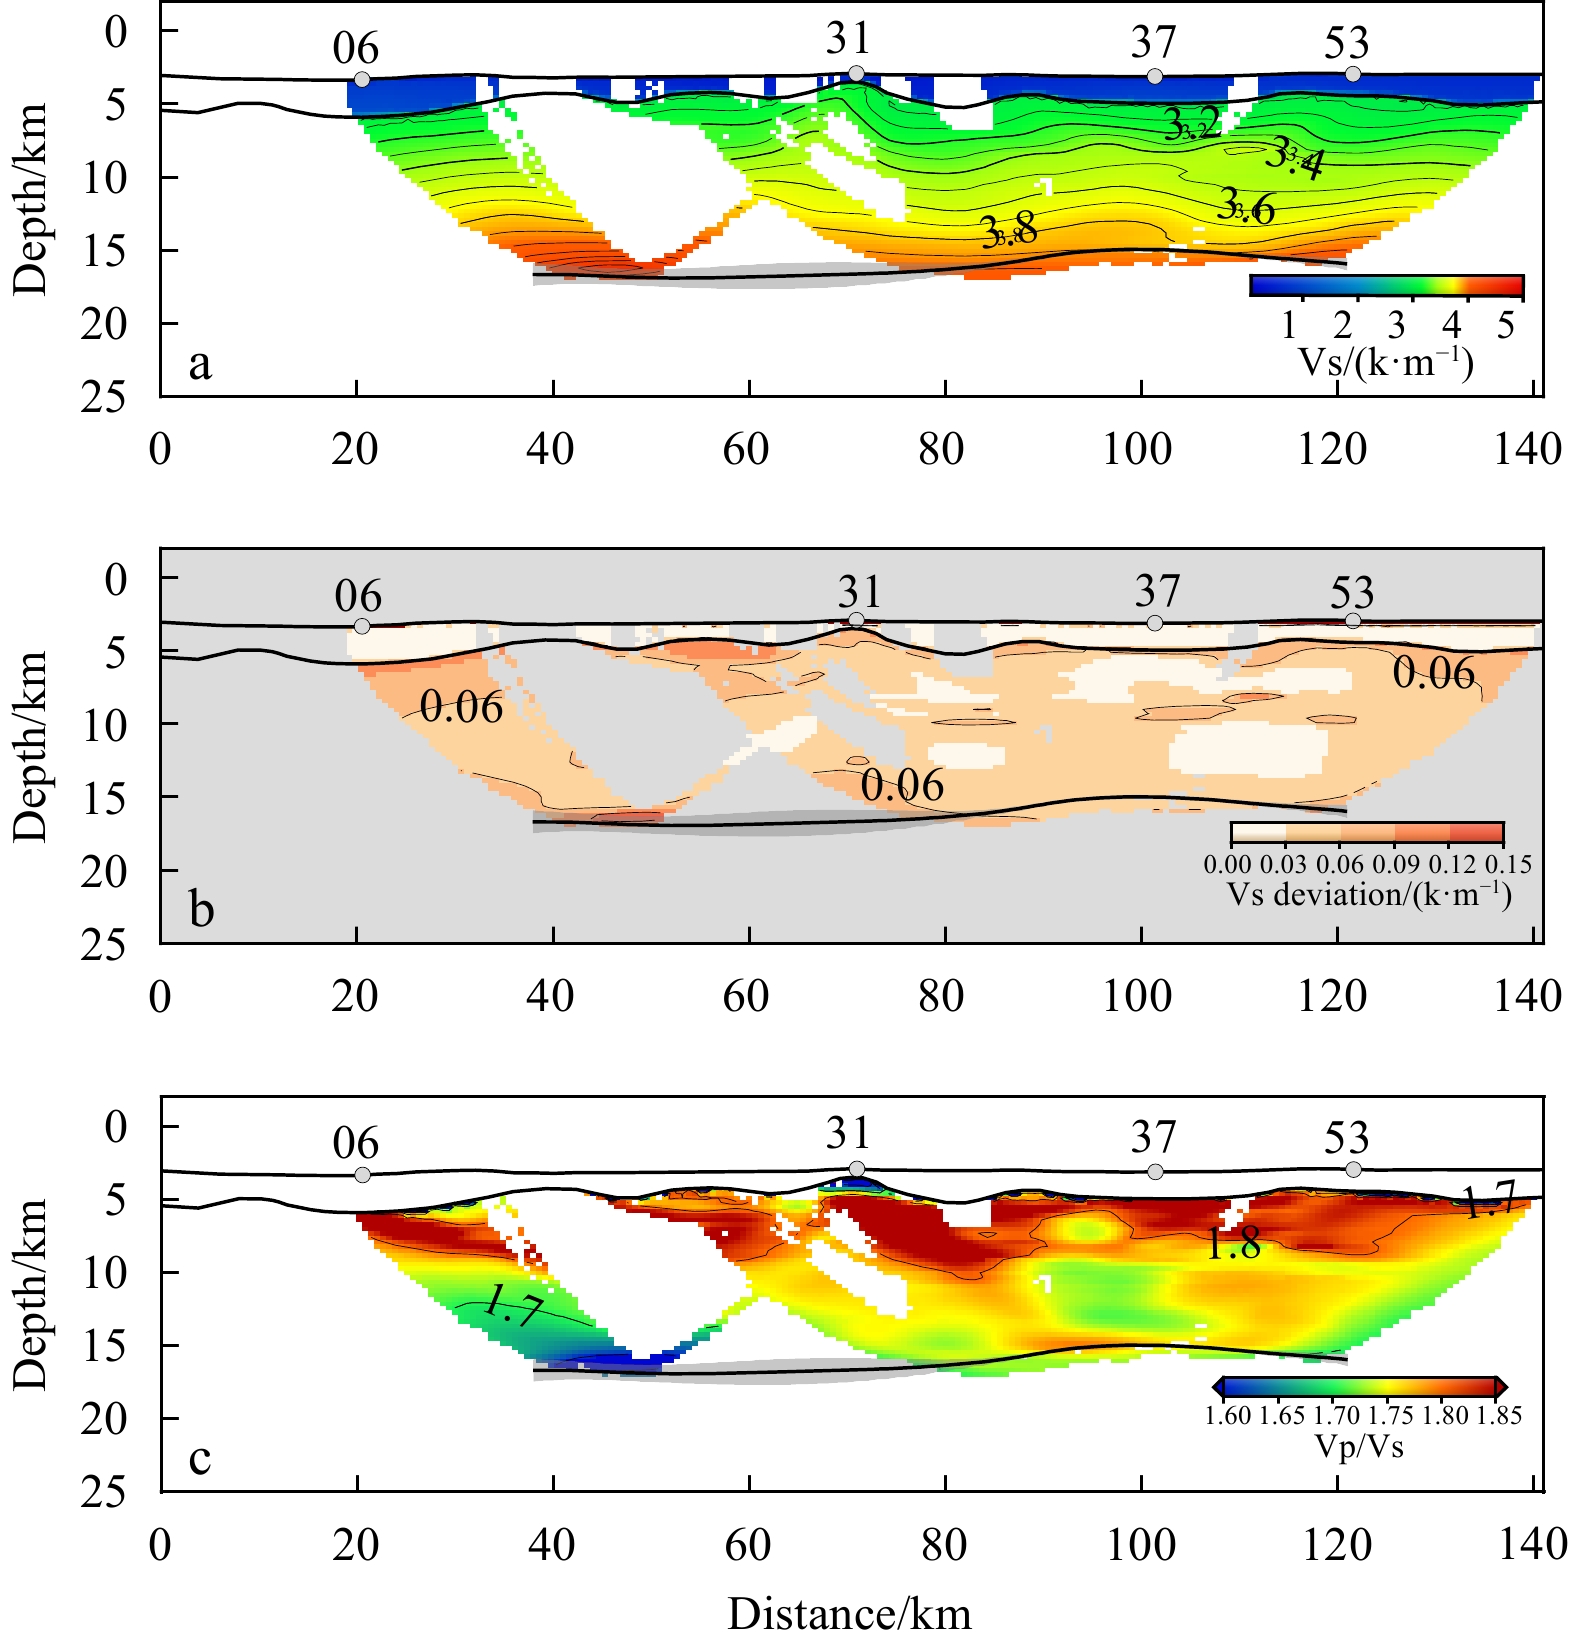
Figure 12. The final tomographic S-wave model based on PSS' phases. A.The average S-wave velocity model. The contour interval is 0.1 km/s. B.The standard deviation of S-wave velocity. C.The Vp/Vs model was calculated from the division of the P-wave model (Fig. 2B) by the S-wave model (Fig. 12A). Gray areas show the Moho depth standard deviation.
Figure 6. Seismic profile of radial component at OBS31, with the reduced velocity of 4 km/s (A). The colored dashed lines represent picked travel times, and the thin black lines represent calculated travel times(B). (C) and (D) show the ray tracing of PPS and PSS conversion modes, respectively. Solid lines represent P-wave paths, and dotted lines represent S-wave paths.
Figure 13. Ray tracing of different sediment models based on synthetic data. The rays are converted into S-waves at the sedimentary basement in the (A)–(L) model, and the Vp and Vp/Vs of the uppermost crust are 5.5 km/s and 1.75, respectively. Solid lines represent P-wave paths; dotted lines represent S-wave paths. The velocity of the uppermost crust in the (M)–(R) model is set to 3.14 km/s (same as the S-wave velocity calculated by the transformation in the previous model).
Figure 14. Seismic ray tracing results from 2100 models reveal the influence of sediment velocities on ray tracing. ∆V is the Vp of the lowermost sediments minus the Vs of the uppermost crust. The fitting degree is calculated by dividing the fitted phases by the picked phases.
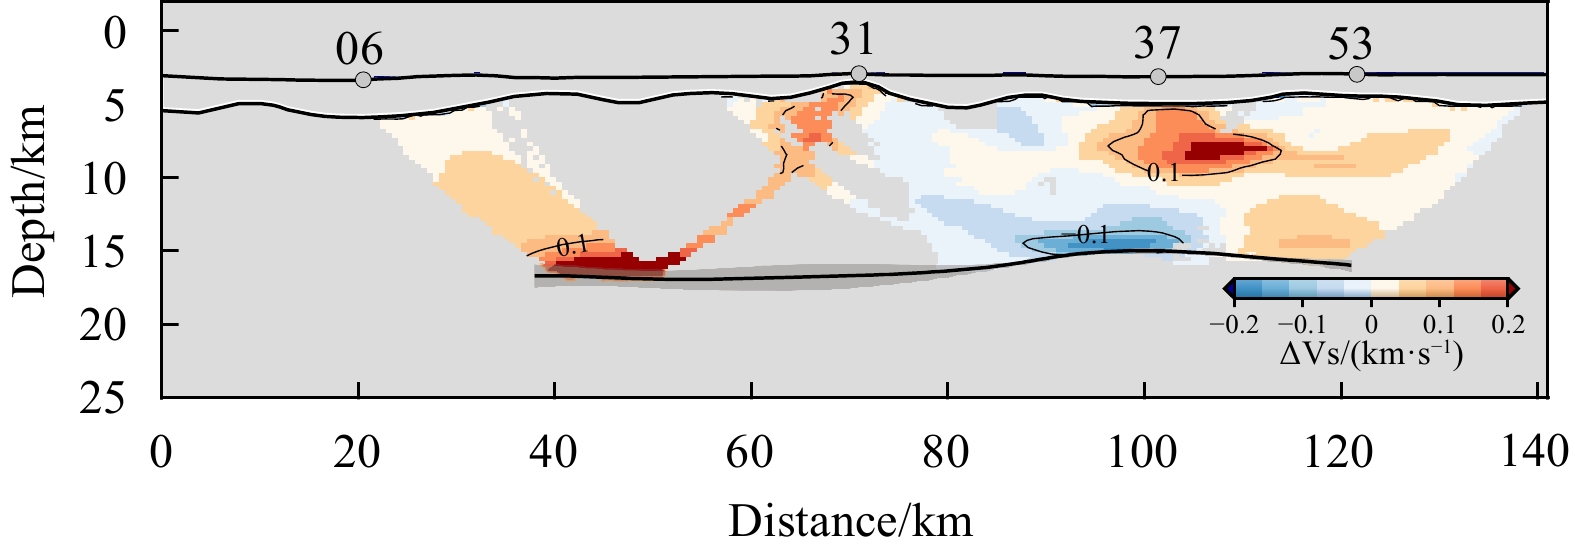
Figure 15. Inversion results comparison of different travel time correction methods. The Vs difference was obtained from Fig. 12B model minus the Fig. 10B model. Gray areas show the Moho depth standard deviation.
Figure 16. Comparison of the travel time correction result based on different crustal models.
Figure 17. The interpretation of single-channel seismic profile EW6, the intruded volcanic bodies come from Fan et al. (2019) (A). The Vp (B) and Vp/Vs (C) models for depth-to-time conversion based on the inversion P-wave model (Fig. 2B) are superimposed on the single channel seismic profile. The black dashed line represents the P-wave velocity contour of 3.5 km/s. Vp/Vs (D) odel at crossover between profile NS5 (Wen et al., 2021b) and profile EW6. TWT: two-way travel time


 DownLoad: