

The distribution of phytoplankton size and major influencing factors in the surface waters near the northern end of the Antarctic Peninsula
-
Abstract: The waters near the Antarctic Peninsula have always been a study hot spot because of their variable and unique oceanographic conditions. To determine the distribution and possible influencing factors on phytoplankton size and abundance near the Antarctic Peninsula, a large-scale survey was conducted during the austral summer of 2018. Samples were collected in 27 stations located in the Drake Passage (DP), South Shetland Islands (SSI), and South Orkney Islands (SOI). Phytoplankton communities were described using chlorophyll a (Chl a), flow cytometry and light microscopy to cover a size range from pico- to microphytoplankton. Nanophytoplankton, especially small nanophytoplankton (2−6 μm) with abundance ranging from 0.66 ×10³ cells/mL to 8.46 ×10³ cells/mL, was predominant throughout the study area. Among different regions, there was an obvious size shift. The proportion of picophytoplankton near the Elephant Island (EI) and DP was higher than other regions, and larger cells were found mainly in east of SOI. The distribution of phytoplankton abundance detected by flow cytometry was not completely consistent with Chl a concentrations due to the contribution of larger cells to Chl a. Possible influencing factors on the phytoplankton size distribution were discussed. The properties of water masses such as temperature and salinity can influence the phytoplankton size distribution. Correlation analysis revealed that only picophytoplankton is significantly correlated with salinity. Light and Fe availability might affect phytoplankton abundance and size distribution especially near the waters of SSI and EI in this study. It was also speculated that the abundance of cryptophytes is possibly related to ice melting.
-
Key words:
- Antarctic Peninsula /
- phytoplankton size /
- flow cytometry /
- Chl a /
- microscopy
-

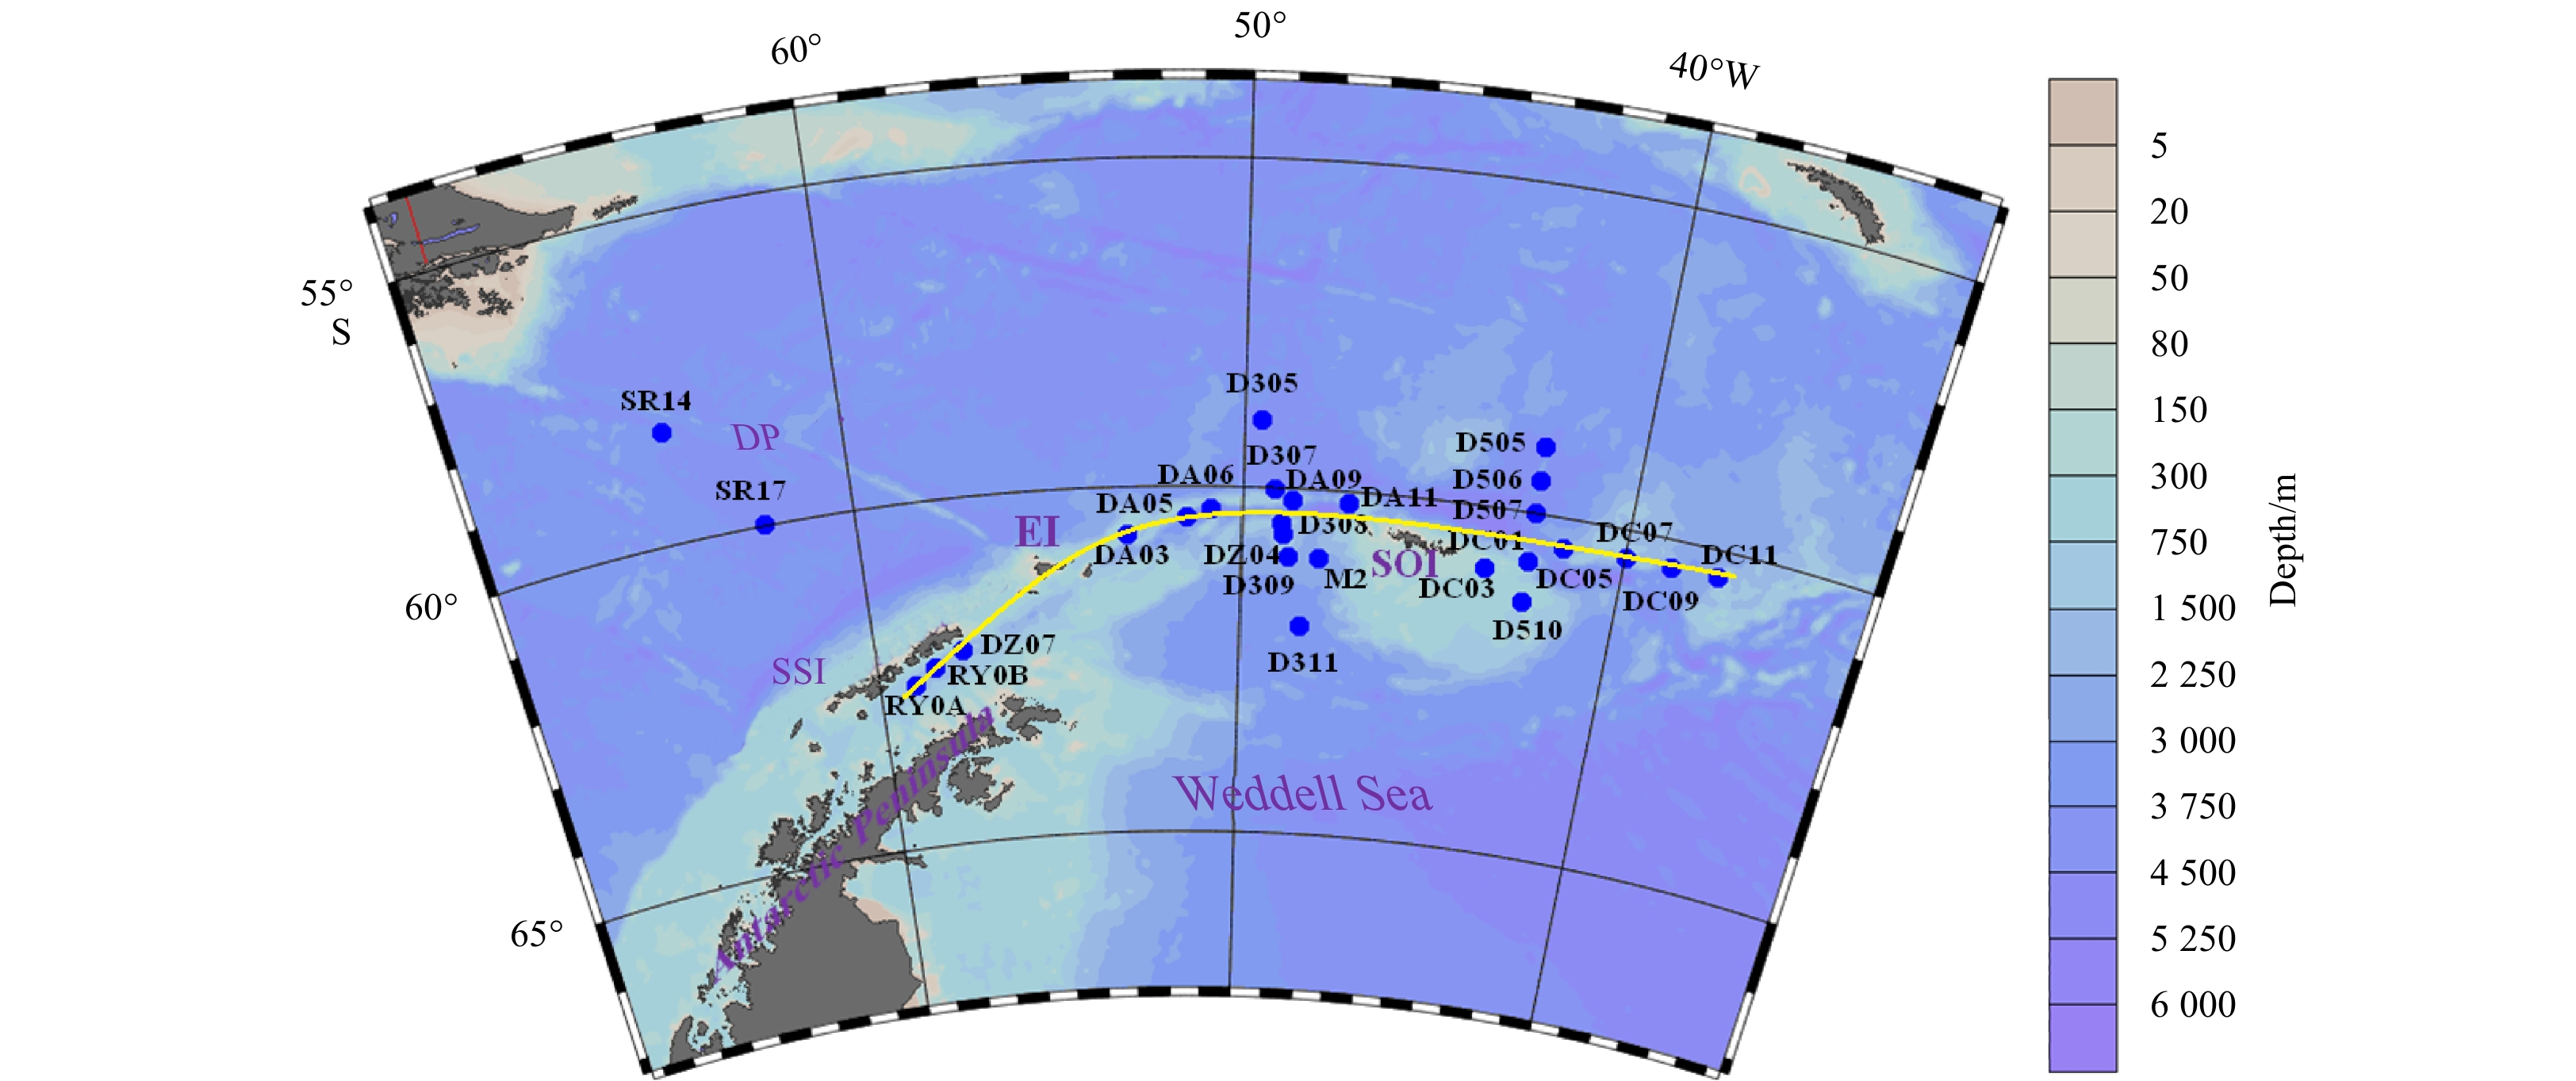
Figure 1. Study area and sampling stations in the Southern Ocean. The filled blue dots show the locations of the 27 stations. SOI, South Orkney Islands; EI, Elephant Island; DP, Drake Passage; SSI, South Shetland Islands. The solid yellow curve indicates the transect from SSI to SOI.

Figure 2. Flow cytometric plots of SSC vs. FL3 (a), and FL2 vs. FL3 (b). R1, 2 μm beads; R2, 6.19 μm beads; R3, picophytoplankton, <2 μm; R4, small nanophytoplankton, about 2−6 μm; R5, medium nanophytoplankton, >6 μm slightly; R6, cryptophytes.

Figure 3. Surface and transect (SSI-SOI) distribution of temperature and salinity. a. Surface temperature; b. surface salinity; c. transect temperature; d. transect salinity.

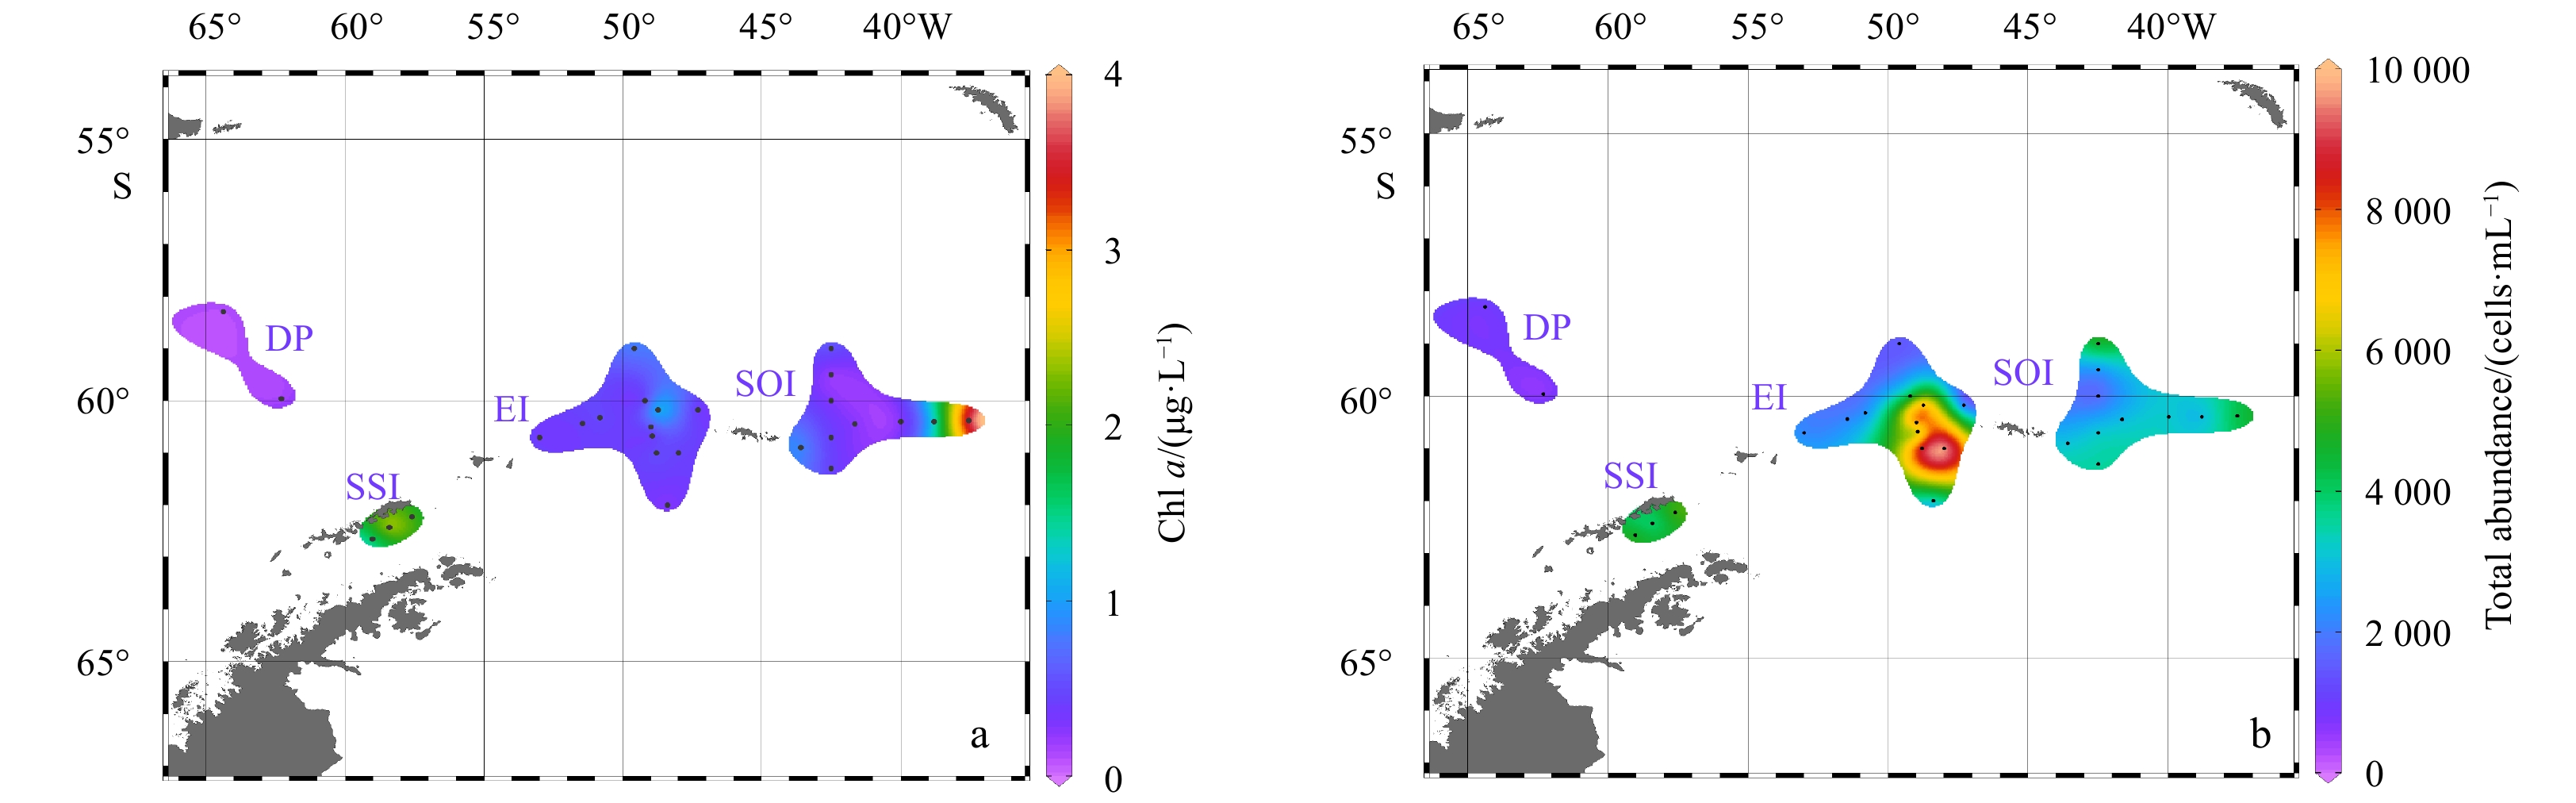
Figure 4. Distribution of Chl a concentration (μg/L) (a) and total abundance (cells/mL) (b) based on FCM.

Figure 5. Distribution of eukaryotic cell abundance in four groups. a. R3, picophytoplankton; b. R4, “small nano”; c. R5, “medium nano”; d. Cry, cryptophytes.

Figure 6. Size composition of phytoplankton communities based on FCM (a) and microscopy (b).

Figure 8. Sea ice concentration images of Antarctic (Fetterer et al., 2017).
-
[1] Agawin N S R, Agustí S, Duarte C M. 2002. Abundance of Antarctic picophytoplankton and their response to light and nutrient manipulation. Aquatic Microbial Ecology, 29(2): 161–172 [2] Becquevort S. 1997. Nanoprotozooplankton in the Atlantic sector of the Southern Ocean during early spring: biomass and feeding activities. Deep-Sea Research Part II: Topical Studies in Oceanography, 44(1–2): 355–373. doi: 10.1016/S0967-0645(96)00076-8 [3] Blanchot J, Rodier M. 1996. Picophytoplankton abundance and biomass in the western tropical Pacific Ocean during the 1992 El Niño year: results from flow cytometry. Deep-Sea Research Part I: Oceanographic Research Papers, 43(6): 877–895. doi: 10.1016/0967-0637(96)00026-X [4] Buma A G J, Gieskes W W C, Thomsen H A. 1992. Abundance of Cryptophyceae and chlorophyll b-containing organisms in the Weddell-Scotia Confluence area in the spring of 1988. Polar Biology, 12(1): 43–52 [5] Cermeño P, Marañón E, Rodríguez J, et al. 2005. Size dependence of coastal phytoplankton photosynthesis under vertical mixing conditions. Journal of Plankton Research, 27(5): 473–483. doi: 10.1093/plankt/fbi021 [6] Egas C, Henríquez-Castillo C, Delherbe N, et al. 2017. Short timescale dynamics of phytoplankton in Fildes Bay, Antarctica. Antarctic Science, 29(3): 217–228. doi: 10.1017/S0954102016000699 [7] Fetterer F, Knowles K, Meier W N, et al. 2017 Updated Daily. Sea Ice Index, Version 3. [Antarctic, Sea Ice Concentration]. Boulder, Colorado USA: National Snow and Ice Data Center [8] García-Muñoz C, Lubián L M, García C M, et al. 2013. A mesoscale study of phytoplankton assemblages around the South Shetland Islands (Antarctica). Polar Biology, 36(8): 1107–1123. doi: 10.1007/s00300-013-1333-5 [9] García-Muñoz C, Sobrino C, Lubián L M, et al. 2014. Factors controlling phytoplankton physiological state around the South Shetland Islands (Antarctica). Marine Ecology Progress Series, 498: 55–71. doi: 10.3354/meps10616 [10] Garibotti I A, Vernet M, Ferrario M E, et al. 2003. Phytoplankton spatial distribution patterns along the western Antarctic Peninsula (Southern Ocean). Marine Ecology Progress Series, 261: 21–39. doi: 10.3354/meps261021 [11] Garibotti I A, Vernet M, Ferrario M E. 2005. Annually recurrent phytoplanktonic assemblages during summer in the seasonal ice zone west of the Antarctic Peninsula (Southern Ocean). Deep-Sea Research Part I: Oceanographic Research Papers, 52(10): 1823–1841. doi: 10.1016/j.dsr.2005.05.003 [12] Green R E, Sosik H M, Olson R J. 2003. Contributions of phytoplankton and other particles to inherent optical properties in New England continental shelf waters. Limnology and Oceanography, 48(6): 2377–2391. doi: 10.4319/lo.2003.48.6.2377 [13] Hewes C D. 2009. Cell size of Antarctic phytoplankton as a biogeochemical condition. Antarctic Science, 21(5): 457–470. doi: 10.1017/S0954102009990125 [14] Hewes C D, Holm-Hansen O, Sakshaug E. 1985. Alternate carbon pathways at lower trophic levels in the Antarctic food web. In: Siegfried W R, Condy P R, Laws R M, eds. Antarctic Nutrient Cycles and Food Webs. Berlin, Heidelberg: Springer, 277–283 [15] Holm-Hansen O, Lorenzen C J, Holmes R W, et al. 1965. Fluorometric determination of chlorophyll. ICES Journal of Marine Science, 30(1): 3–15. doi: 10.1093/icesjms/30.1.3 [16] Ishikawa A, Wright S W, Van Den Enden R, et al. 2002. Abundance, size structure and community composition of phytoplankton in the Southern Ocean in the austral summer 1999/2000. Polar Bioscience, 15: 11–26 [17] Jacques G, Panouse M. 1991. Biomass and composition of size fractionated phytoplankton in the Weddell-Scotia Confluence area. Polar Biology, 11(5): 315–328 [18] Korb R E, Whitehouse M J, Gordon M, et al. 2010. Summer microplankton community structure across the Scotia Sea: implications for biological carbon export. Biogeosciences, 7(1): 343–356. doi: 10.5194/bg-7-343-2010 [19] Lepš J, Šmilauer P. 2003. Multivariate Analysis of Ecological Data Using CANOCO. Cambridge: Cambridge University Press [20] Marañón E. 2015. Cell Size as a key determinant of phytoplankton metabolism and community structure. Annual Review of Marine Science, 7: 241–264. doi: 10.1146/annurev-marine-010814-015955 [21] Marañón E, Cermeño P, Latasa M, et al. 2012. Temperature, resources, and phytoplankton size structure in the ocean. Limnology and Oceanography, 57(5): 1266–1278. doi: 10.4319/lo.2012.57.5.1266 [22] Morán X A G, López-Urrutia Á, Calvo-Díaz A, et al. 2010. Increasing importance of small phytoplankton in a warmer ocean. Global Change Biology, 16: 1137-44. [23] Olson R J, Sosik H M, Chekalyuk A M, et al. 2000. Effects of iron enrichment on phytoplankton in the Southern Ocean during late summer: active fluorescence and flow cytometric analyses. Deep-Sea Research Part II: Topical Studies in Oceanography, 47(15–16): 3181–3200. doi: 10.1016/S0967-0645(00)00064-3 [24] Rodríguez J, Jiménez-Gómez F, Blanco J M, et al. 2002. Physical gradients and spatial variability of the size structure and composition of phytoplankton in the Gerlache Strait (Antarctica). Deep-Sea Research Part II: Topical Studies in Oceanography, 49(4–5): 693–706. doi: 10.1016/S0967-0645(01)00119-9 [25] Sakshaug E, Holm-Hansen O. 1986. Photoadaptation in Antarctic phytopfankton: variations in growth rate, chemical composition and P versus I curves. Journal of Plankton Research, 8(3): 459–473. doi: 10.1093/plankt/8.3.459 [26] Schloss I, Estrada M. 1994. Phytoplankton composition in the Weddell-Scotia Confluence area during austral spring in relation to hydrography. Polar Biology, 14(2): 77–90 [27] Smith R C, Martinson D G, Stammerjohn S E, et al. 2008. Bellingshausen and western Antarctic Peninsula region: pigment biomass and sea-ice spatial/temporal distributions and interannual variabilty. Deep-Sea Research Part II: Topical Studies in Oceanography, 55(18–19): 1949–1963. doi: 10.1016/j.dsr2.2008.04.027 [28] Sosik H M, Olson J J, Armbrust E V. 2010. Flow cytometry in phytoplankton research. In: Suggett D J, Prášil O, Borowitzka M A, eds. Chlorophyll a Fluorescence in Aquatic Sciences: Methods and Applications. Dordrecht: Springer, 171–185 [29] Vernet M, Martinson D, Iannuzzi R, et al. 2008. Primary production within the sea-ice zone west of the Antarctic Peninsula: I. Sea ice, summer mixed layer, and irradiance. Deep-Sea Research Part II: Topical Studies in Oceanography, 55(18–19): 2068–2085. doi: 10.1016/j.dsr2.2008.05.021 [30] Ward B A, Dutkiewicz S, Follows M J. 2014. Modelling spatial and temporal patterns in size-structured marine plankton communities: top–down and bottom–up controls. Journal of Plankton Research, 36(1): 31–47. doi: 10.1093/plankt/fbt097 [31] Zhang Fang, Ma Yuxin, Lin Ling, et al. 2012. Hydrophysical correlation and water mass indication of optical physiological parameters of picophytoplankton in Prydz Bay during autumn 2008. Journal of Microbiological Methods, 91(3): 559–565. doi: 10.1016/j.mimet.2012.09.030 -

 下载:
下载:


 点击查看大图
计量
- 文章访问数: 347
- HTML全文浏览量: 141
- PDF下载量: 16
- 被引次数: 0

