Two-step harmonic analysis for capturing seasonally-varying amplitudes and phase lags of the predominant tidal constituents
-
Abstract: Recent studies have revealed that the predominant tidal constituents have seasonal variations at some locations. However, how to accurately obtain these variations remains a problem for the traditional harmonic analysis (HA) due to the tradeoff between length of time window and resolution of constituents. Therefore, a method named as “two-step HA” is developed in this study, which consists of both long- and short-time-window HA. Through a series of ideal experiments, practical application at two tidal gauges and comparison with the traditional HA, the feasibility and accuracy of the two-step HA are verified: The two-step HA performs better than the traditional HA in estimating monthly amplitudes and phases for the predominant constituents, whether they have seasonal variability or not. In addition to capturing variations of the predominant constituents at tidal gauges, the two-step HA would be useful in investigation of the coherence and incoherence of internal tides.
-
Key words:
- tides /
- harmonic analysis /
- seasonal variation /
- tidal gauges
-
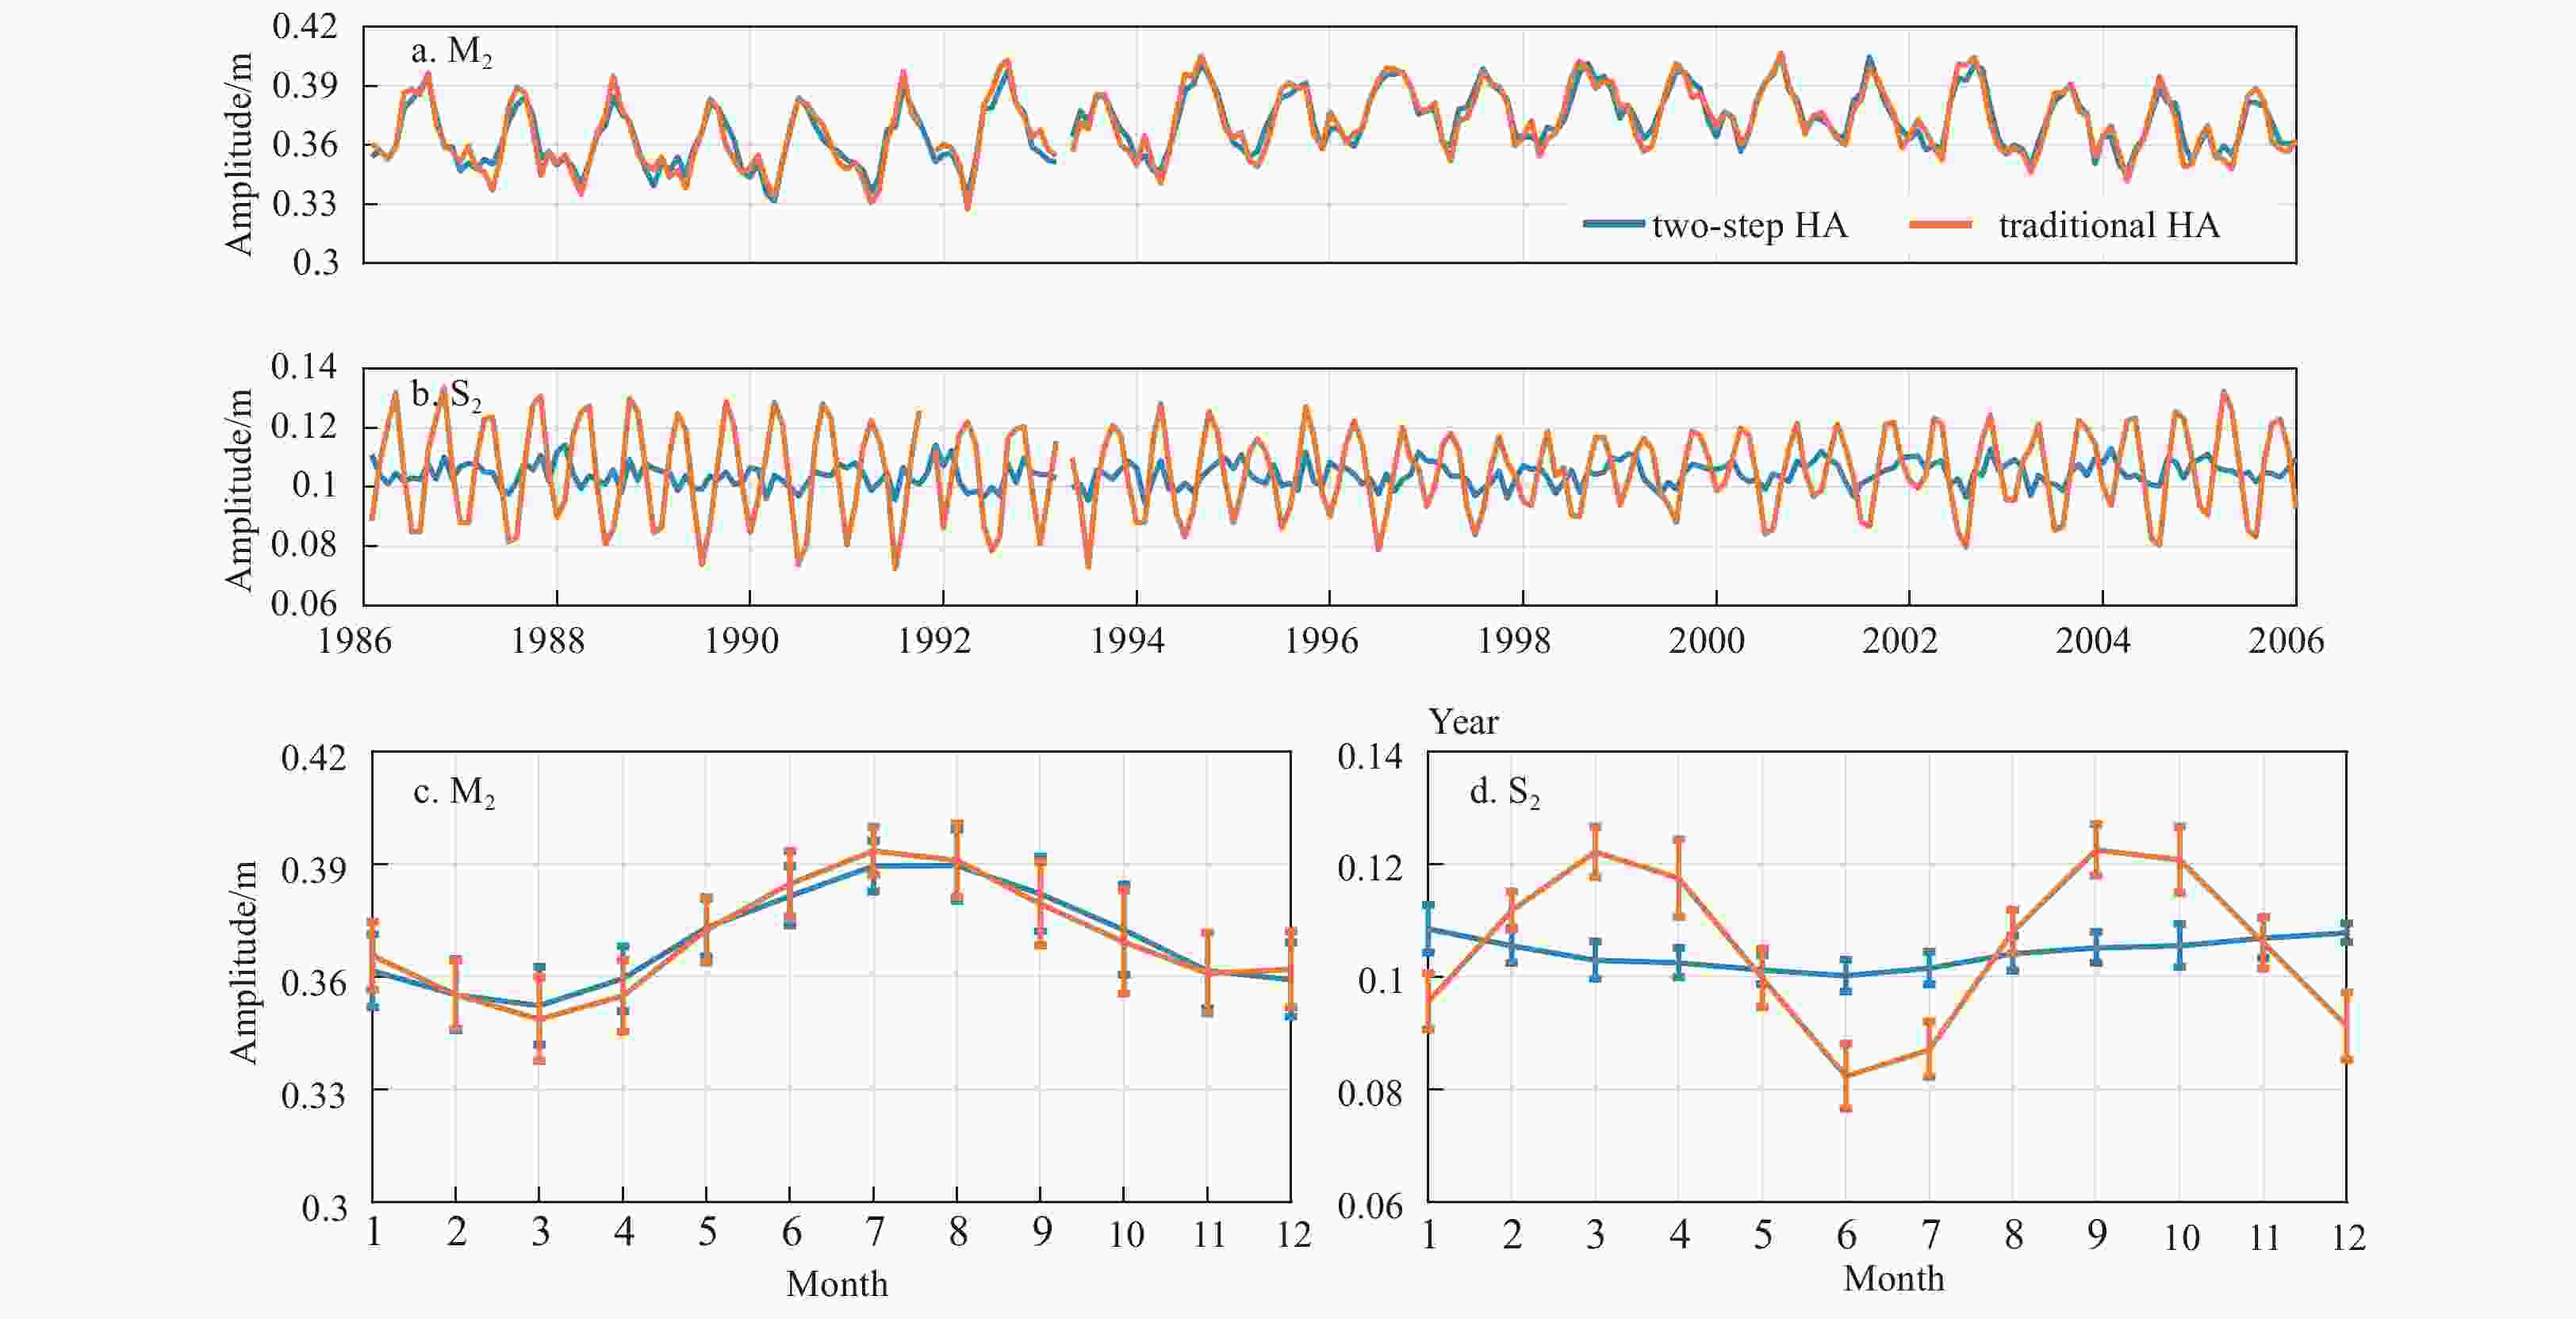
Figure 5. Monthly amplitudes of the M2 (a)and S2 (b) constituents at Cuxhaven during 1986–2006, and the 20-year-averaged monthly amplitudes and corresponding STDs of the M2 (c) and S2 (d) constituents. In each subfigure, the blue and orange lines denote the results obtained by the two-step HA and traditional HA using a one-month window, respectively.
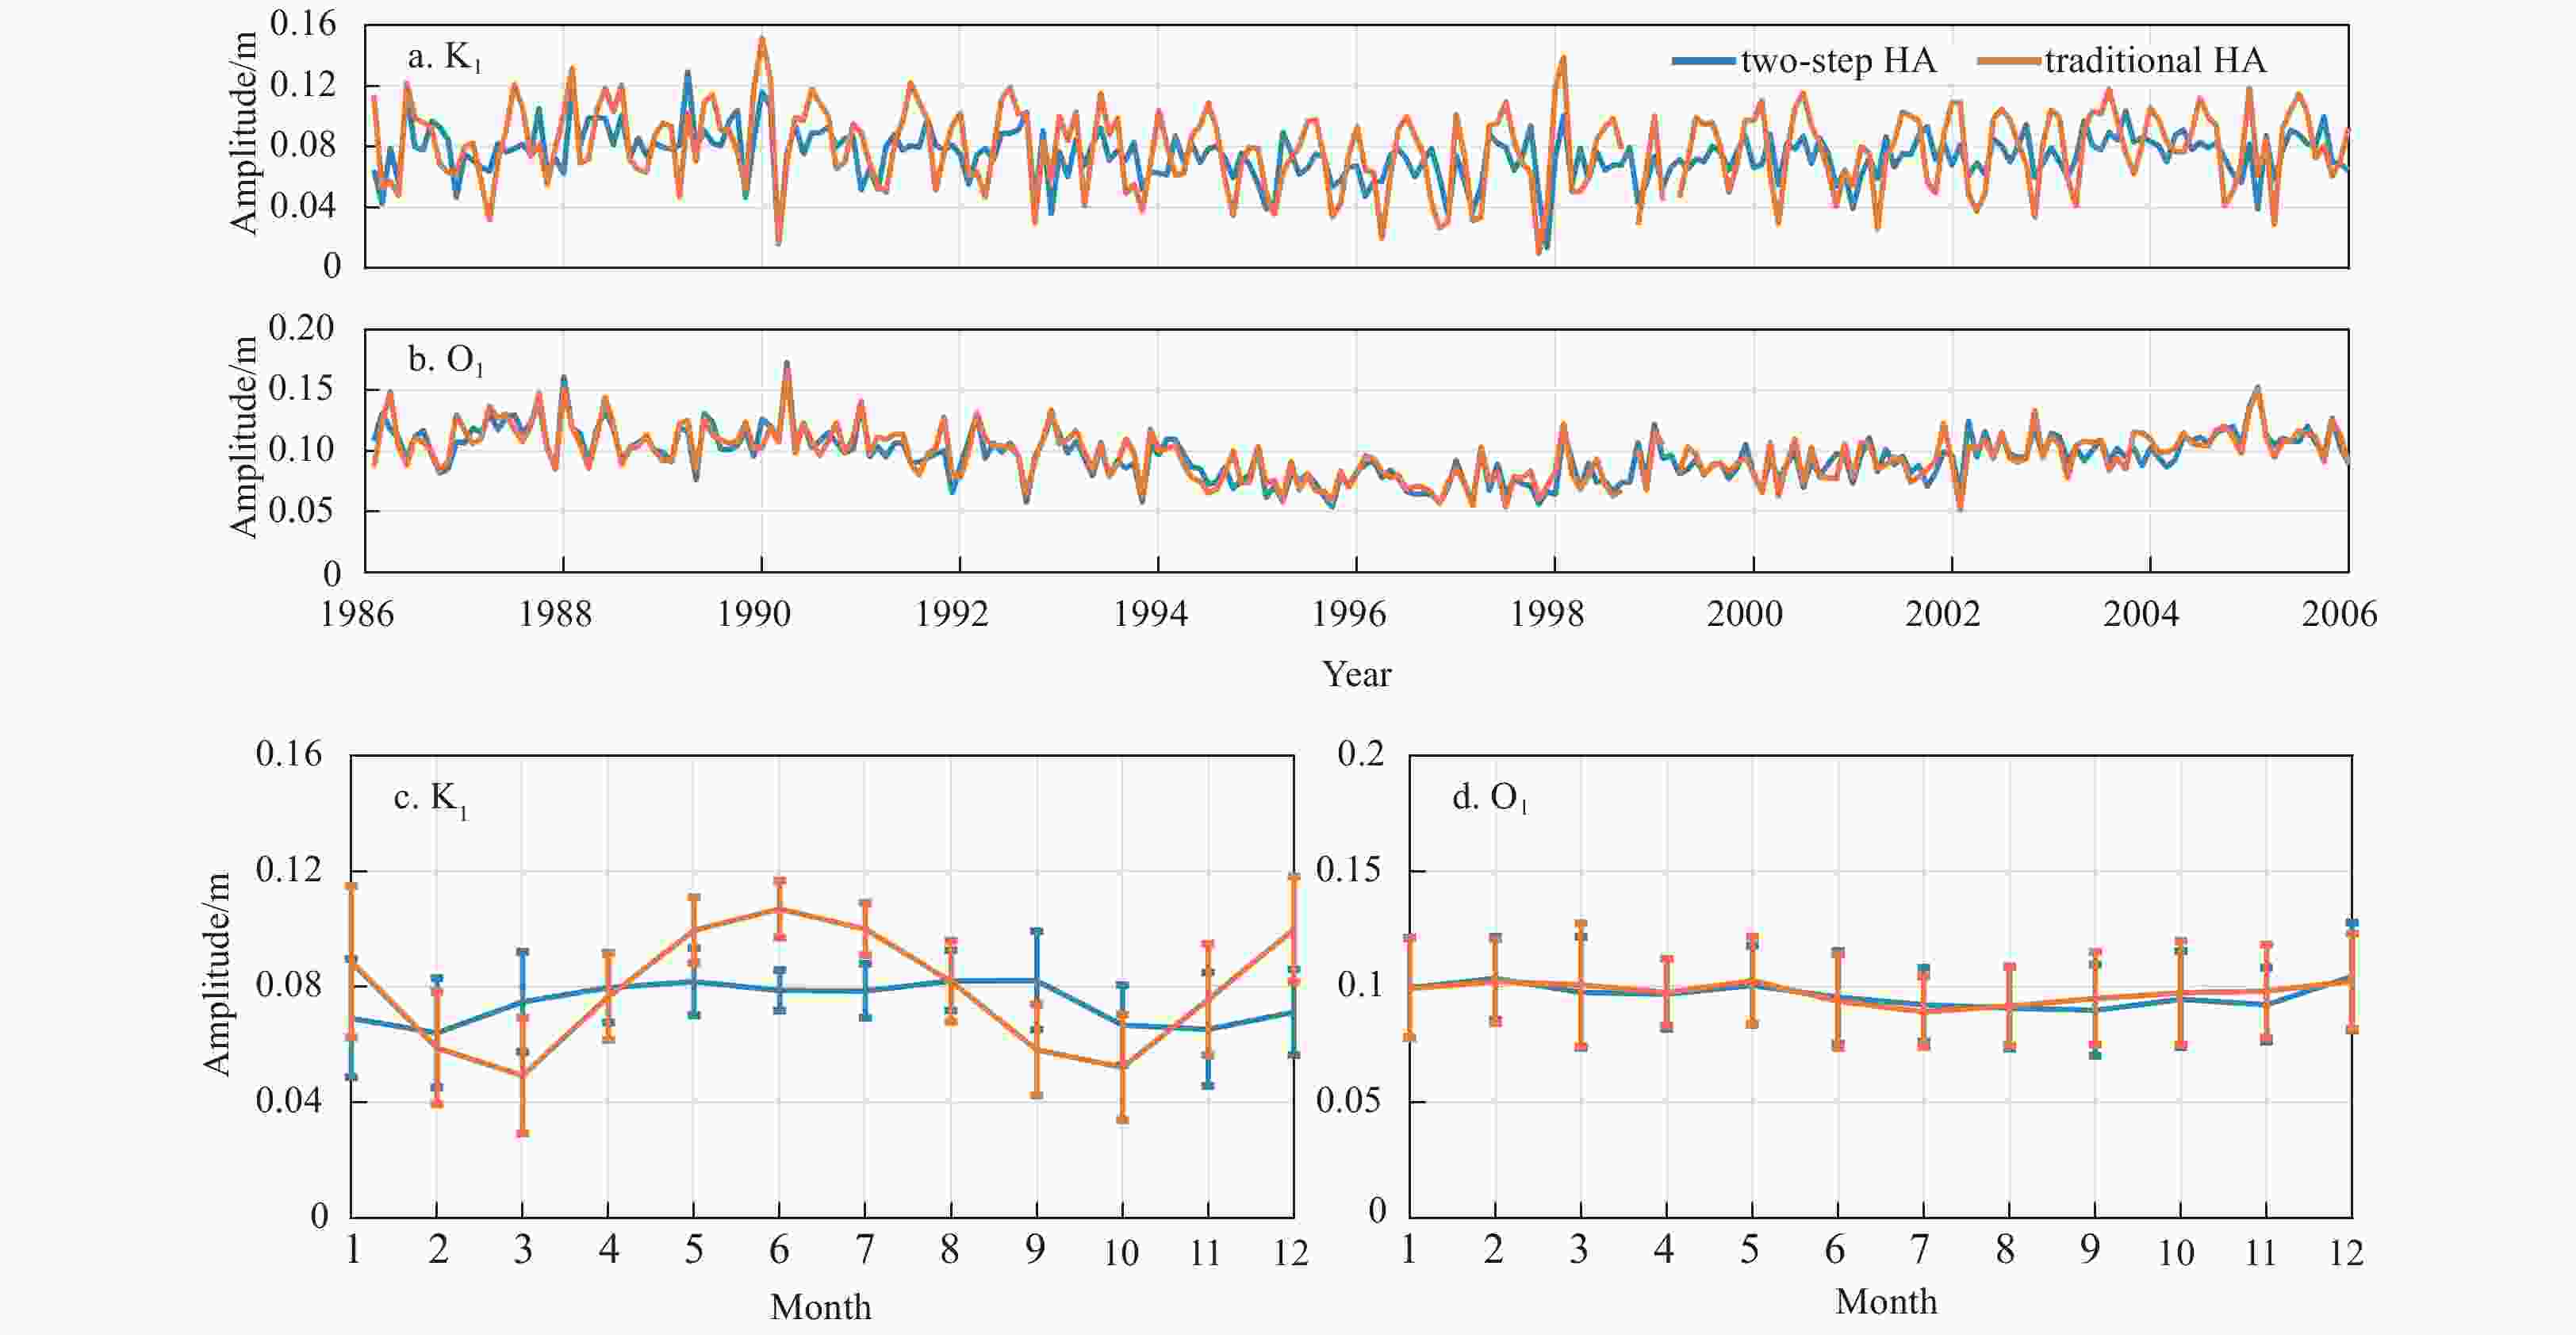
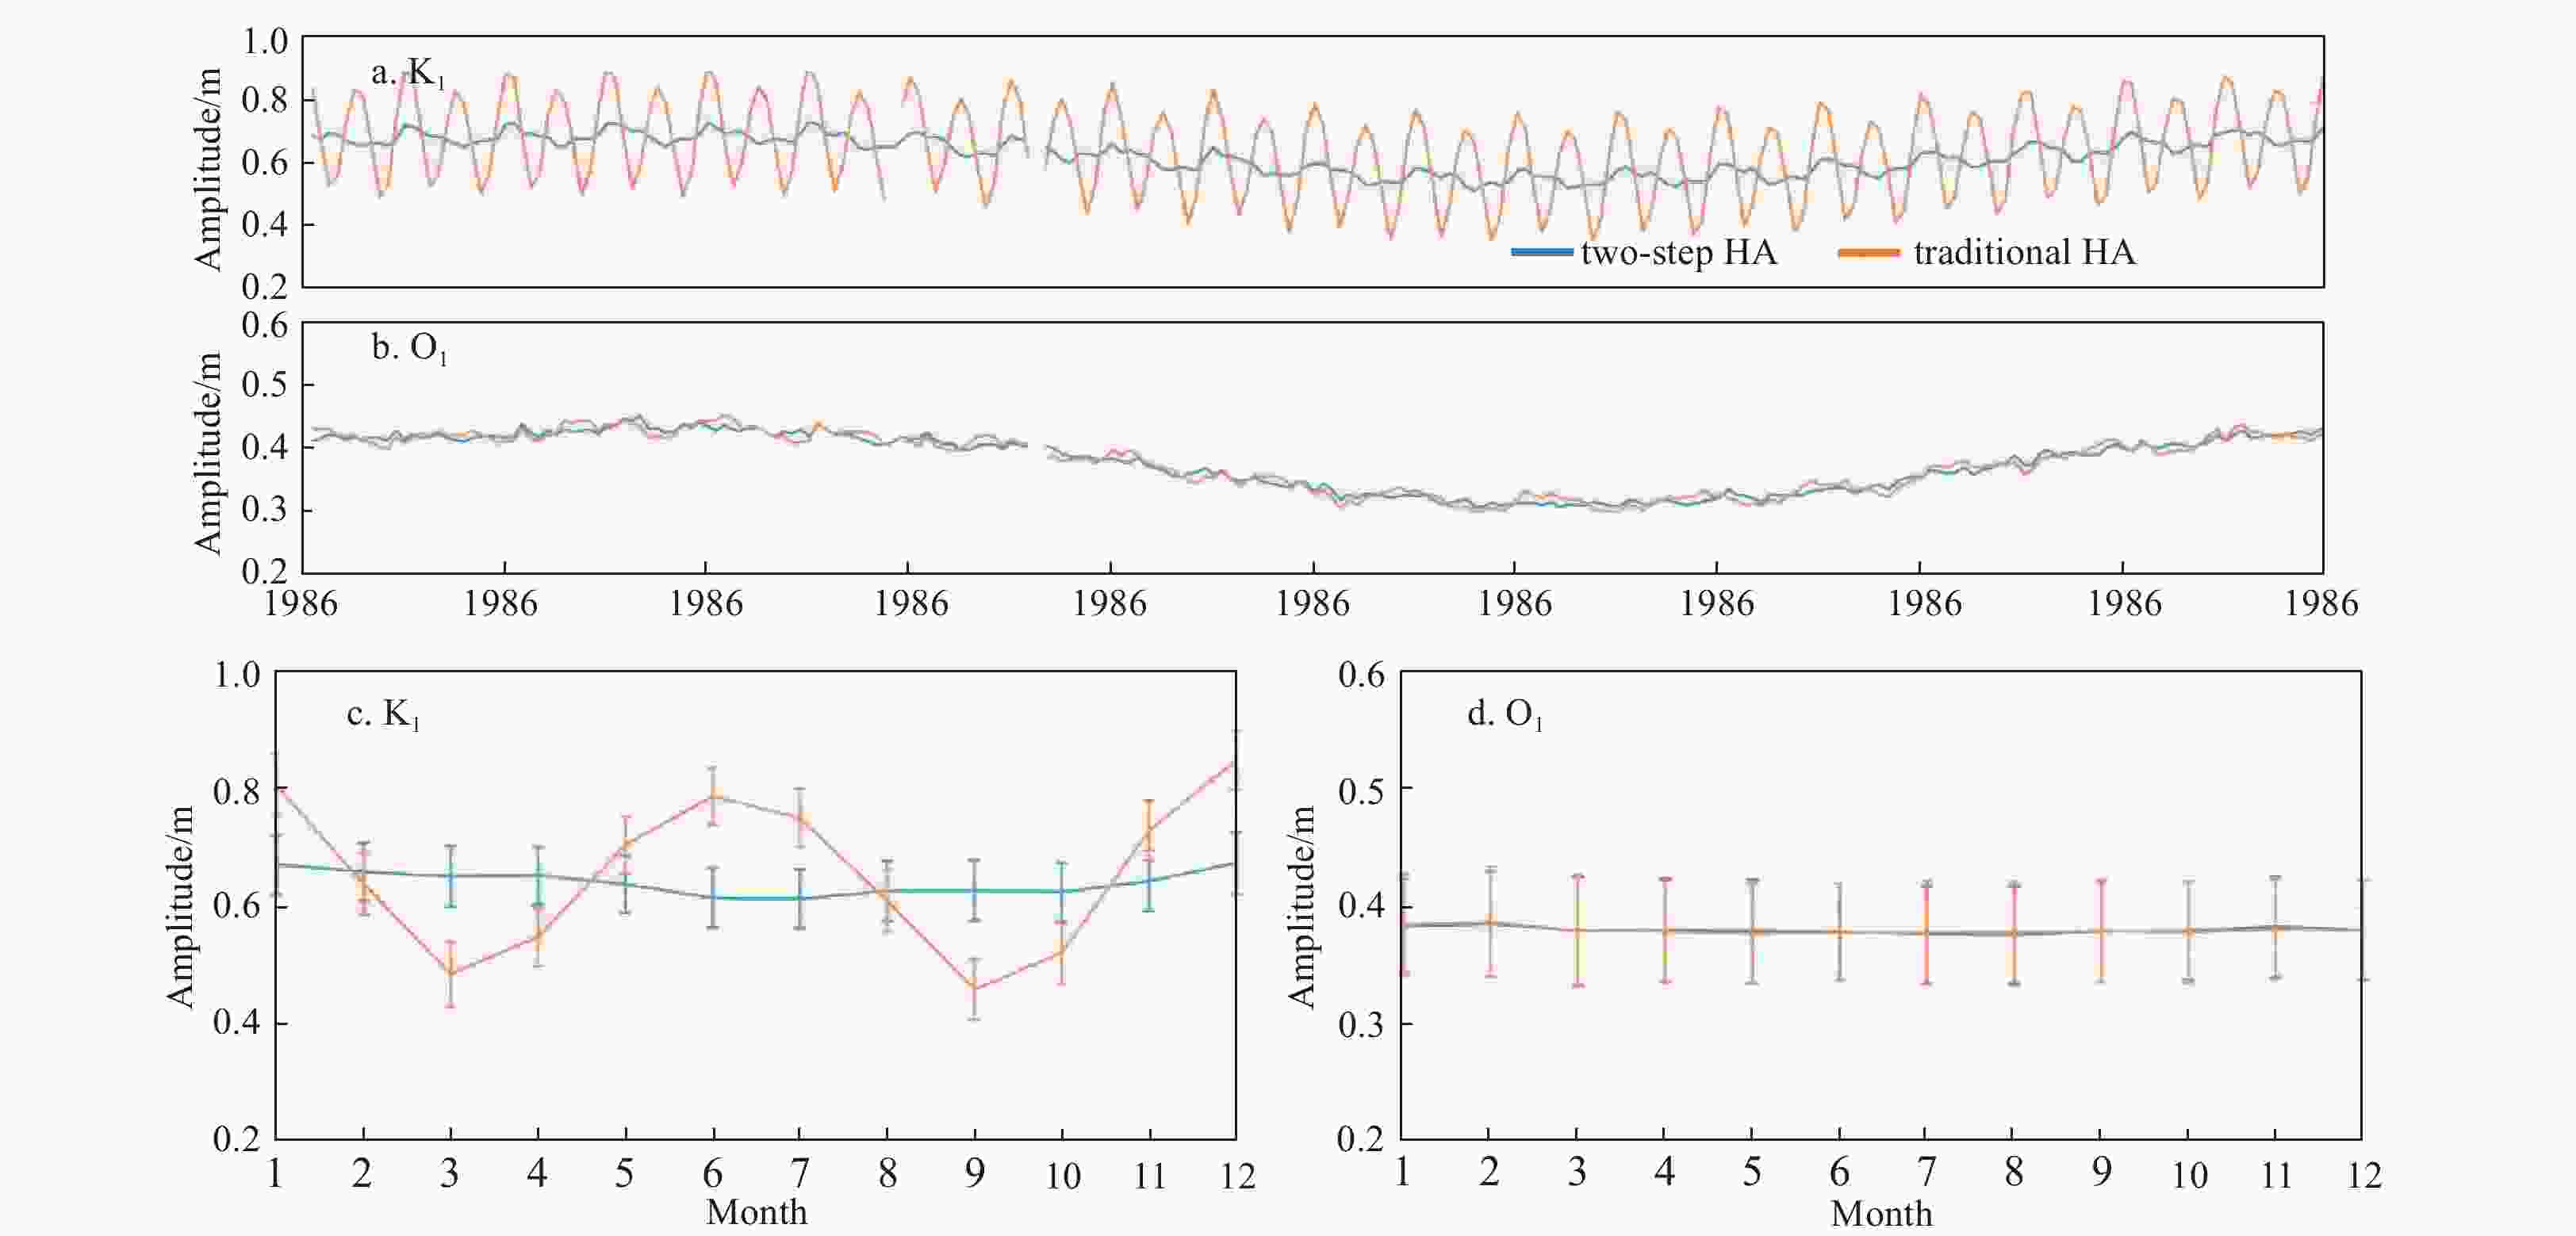
Figure 6. Monthly amplitudes of the K1 (a) and O1 (b) constituents at Cuxhaven during 1986–2006, and the 20-year-averaged monthly amplitudes and corresponding STDs of the K1 (c) and O1 (d) constituents. In each subfigure, the blue and orange lines denote the results obtained by the two-step HA and traditional HA using a one-month window, respectively.
Figure A3. Monthly amplitudes of the M2 (a) and S2 (b) constituents at Victoria during 1966–1985, and the 20-year-averaged monthly amplitudes and corresponding STDs of the M2 (c) and S2 (d) constituents. In each subfigure, the blue and orange lines denote the results obtained by the two-step HA and traditional HA using a one-month window, respectively.
Figure A4. Monthly amplitudes of the K1 (a) and O1 (b) constituents at Victoria during 1966–1985, and the 20-year-averaged monthly amplitudes and corresponding STDs of the K1 (c) and O1 (d) constituents. In each subfigure, the blue and orange lines denote the results obtained by the two-step HA and traditional HA using a one-month window, respectively.
Table 1. Alias periods (d) for each pair of constituents corresponding to hourly measurements based on the Rayleigh criterion
O1 P1 K1 N2 M2 S2 K2 Q1 27.6 9.6 9.1 1.0 1.0 0.9 0.9 O1 14.8 13.7 1.0 1.0 0.9 0.9 P1 182.6 1.1 1.1 1.0 1.0 K1 1.1 1.1 1.0 1.0 N2 27.6 9.6 9.1 M2 14.8 13.7 S2 182.6 Note: The unresolved constituent pairs (K1 and P1 as well as K2 and S2) by a one-month record and their alias periods are marked in bold. Table 2. Prescribed amplitudes (cm) and phase lags (°) of the eight constituents in IE 1
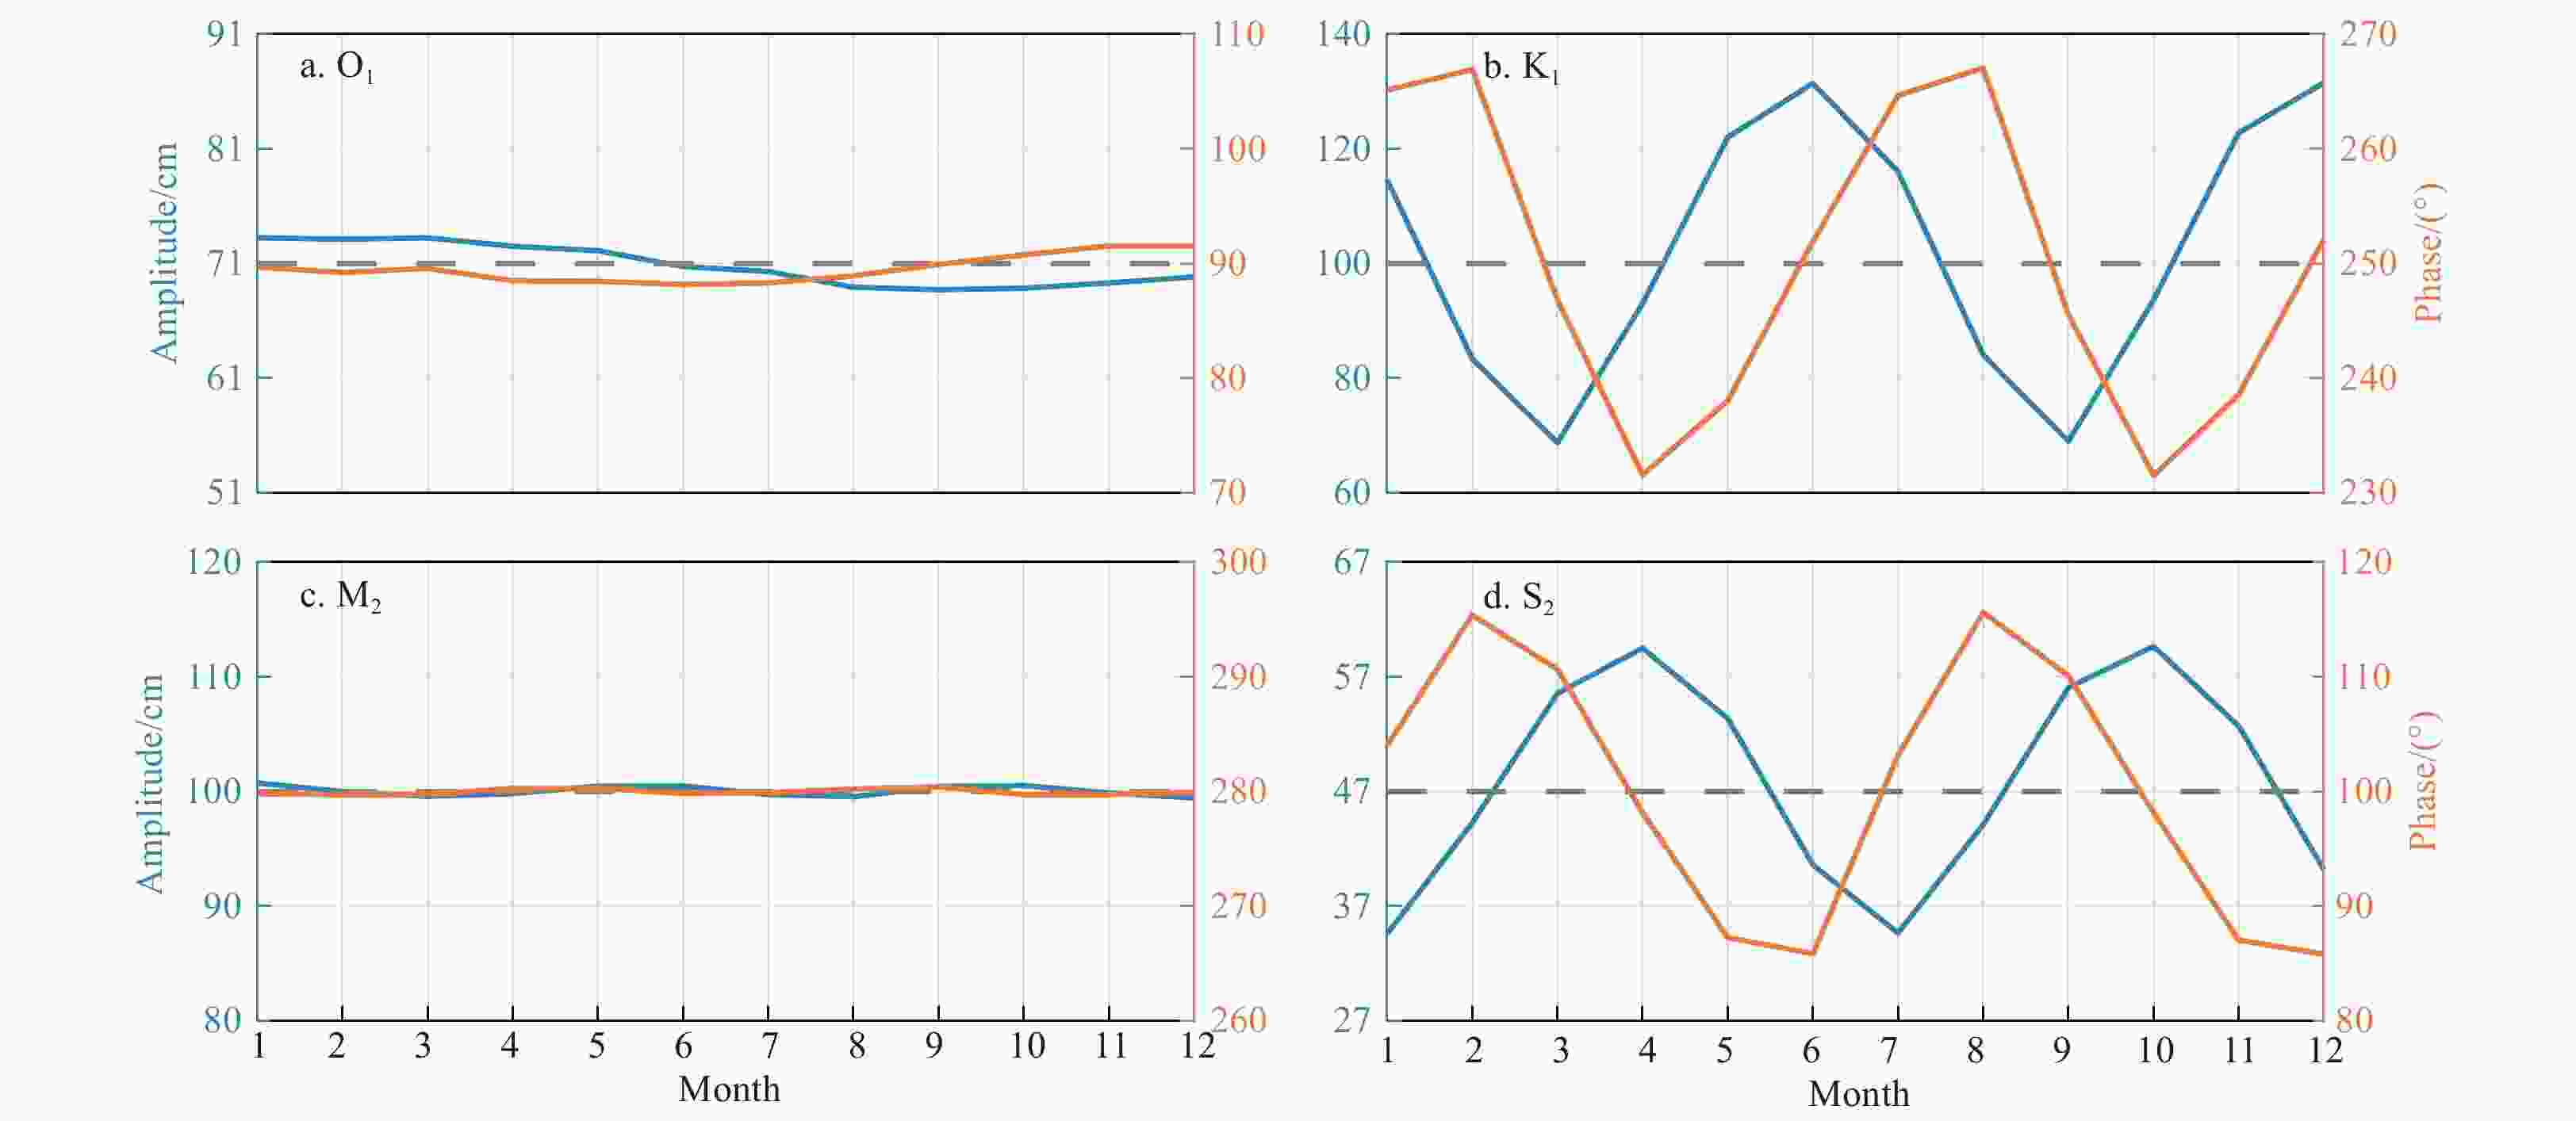
Q1 O1 P1 K1 N2 M2 S2 K2 h 14 71 33 100 19 100 47 13 g 310 90 270 250 20 280 100 140 -
[1] Amin M. 1985. Temporal variations of tides on the west coast of Great Britain. Geophysical Journal International, 82(2): 279–299. doi: 10.1111/j.1365-246X.1985.tb05138.x [2] Caldwell P C, Merrifield M A, Thompson P R. 2015. Sea level measured by tide gauges from global oceans — the Joint Archive for Sea Level holdings (NCEI Accession 0019568), Version 5.5. NOAA National Centers for Environmental Information, Dataset, doi: 10.7289/V5V40S7W [3] Cao Anzhou, Guo Zheng, Lv Xianqing, et al. 2017. Coherent and incoherent features, seasonal behaviors and spatial variations of internal tides in the northern South China Sea. Journal of Marine Systems, 172: 75–83. doi: 10.1016/j.jmarsys.2017.03.005 [4] Cherniawsky J Y, Foreman M G G, Kang S K, et al. 2009. 18.6-year lunar nodal tides from altimeter data. Continental Shelf Research, 30(6): 575–587 [5] Codiga D L. 2011. Unified tidal analysis and prediction using the UTide matlab functions. Technical Report 2011–01. Narragansett, RI: Graduate School of Oceanography, University of Rhode Island [6] Devlin A T, Zaron E D, Jay D A, et al. 2018. Seasonality of tides in southeast Asian waters. Journal of Physical Oceanography, 48(5): 1169–1190. doi: 10.1175/JPO-D-17-0119.1 [7] Doodson A T. 1921. The harmonic development of the tide-generating potential. Proceedings of the Royal Society A: Mathematical, Physical and Engineering Sciences, 100(704): 305–329 [8] Doodson A T. 1924. Perturbations of harmonic tidal constants. Proceedings of the Royal Society of A: Mathematical, Physical and Engineering Sciences, 106(739): 513–526 [9] Doodson A T. 1928. VI. The analysis of tidal observations. Philosophical Transactions of the Royal Society A: Mathematical. Physical and Engineering Sciences, 227(647–658): 223–279 [10] Dunphy M, Lamb K G. 2014. Focusing and vertical mode scattering of the first mode internal tide by mesoscale eddy interaction. Journal of Geophysical Research: Oceans, 119(1): 523–536. doi: 10.1002/2013JC009293 [11] Fang Guohong, Wang Yonggang, Wei Zexun, et al. 2004. Empirical cotidal charts of the Bohai, Yellow, and East China Seas from 10 years of TOPEX/Poseidon altimetry. Journal of Geophysical Research: Oceans, 109(C11): C11006. doi: 10.1029/2004JC002484 [12] Feng Xiangbo, Tsimplis M N, Woodworth P L. 2015. Nodal variations and long-term changes in the main tides on the coasts of China. Journal of Geophysical Research: Oceans, 120(2): 1215–1232. doi: 10.1002/2014JC010312 [13] Foreman M G G. 1977. Manual for tidal heights analysis and prediction. Patricia Bay: Institute of Ocean Sciences [14] Foreman M G G, Henry R F. 1989. The harmonic analysis of tidal model time series. Advances in Water Resources, 12(3): 109–120 [15] Georgas N. 2012. Large seasonal modulation of tides due to ice cover friction in a midlatitude estuary. Journal of Physical Oceanography, 42(3): 352–369. doi: 10.1175/JPO-D-11-063.1 [16] Godin G. 1972. The Analysis of Tides. Toronto, Canada: University of Toronto Press [17] Goldsbrough G R. 1942. Admiralty Manual of Tides. Nature, 150: 615–617. doi: 10.1038/150615a0 [18] Gräwe U, Burchard H, Müller M, et al. 2014. Seasonal variability in M2 and M4 tidal constituents and its implications for the coastal residual sediment transport. Geophysical Research Letters, 41(15): 5563–5570. doi: 10.1002/2014GL060517 [19] Guo Zheng, Pan Haidong, Cao Anzhou, et al. 2018. A harmonic analysis method adapted to capturing slow variations of tidal amplitudes and phases. Continental Shelf Research, 164: 37–44. doi: 10.1016/j.csr.2018.06.005 [20] Huess V, Andersen O B. 2001. Seasonal variation in the main tidal constituent from altimetry. Geophysical Research Letters, 28(4): 567–570. doi: 10.1029/2000GL011921 [21] Jay D A. 2009. Evolution of tidal amplitudes in the eastern Pacific Ocean. Geophysical Research Letters, 36(4): L04603 [22] Jin Guangzhen, Pan Haidong, Zhang Qilin, et al. 2018. Determination of harmonic parameters with temporal variations: An enhanced harmonic analysis algorithm and application to internal tidal currents in the South China Sea. Journal of Atmospheric and Oceanic Technology, 35(7): 1375–1398. doi: 10.1175/JTECH-D-16-0239.1 [23] Kang S K, Foreman M G, Lie H J, et al. 2002. Two‐layer tidal modeling of the Yellow and East China Seas with application to seasonal variability of the M2 tide. Journal of Geophysical Research: Oceans, 107(C3): 6-1–6-18 [24] Müller M. 2011. Rapid change in semi-diurnal tides in the North Atlantic since 1980. Geophysical Research Letters, 38(11): L11602 [25] Müller M, Cherniawsky J Y, Foreman M G G, et al. 2014. Seasonal variation of the M2 tide. Ocean Dynamics, 64(2): 159–177. doi: 10.1007/s10236-013-0679-0 [26] Nash J D, Shroyer E L, Kelly S M, et al. 2012. Are any coastal internal tides predictable?. Oceanography, 25(2): 80–95. doi: 10.5670/oceanog.2012.44 [27] Pawlowicz R, Beardsley B, Lentz S. 2002. Classical tidal harmonic analysis including error estimates in MATLAB using T_TIDE. Computers & Geosciences, 28(8): 929–937 [28] Ray R D. 2006. Secular changes of the M2 tide in the Gulf of Maine. Continental Shelf Research, 26(3): 422–427 [29] Ray R D. 2009. Secular changes in the solar semidiurnal tide of the western North Atlantic Ocean. Geophysical Research Letters, 36(19): L19601. doi: 10.1029/2009GL040217 [30] Stewart R H. 2008. Introduction to Physical Oceanography. College Station: Texas A&M University [31] St-Laurent P, Saucier F J, Dumais J F. 2008. On the modification of tides in a seasonally ice-covered sea. Journal of Geophysical Research: Oceans, 113(C11): C11014 [32] Woodworth P L. 2010. A survey of recent changes in the main components of the ocean tide. Continental Shelf Research, 30(15): 1680–1691. doi: 10.1016/j.csr.2010.07.002 [33] Xu Zhenhua, Yin Baoshu, Hou Yijun, et al. 2013. Variability of internal tides and near-inertial waves on the continental slope of the northwestern South China Sea. Journal of Geophysical Research: Oceans, 118(1): 197–211. doi: 10.1029/2012JC008212 -


 下载:
下载:

