

-
Abstract: Seven-year (2005–2011) Synthetic Aperture Radar (SAR) images are applied to study oceanic eddies in the East China Sea. It is found that most of these eddies detected from the SAR images are less than 10 km, which are submesoscale eddies. Seasonal differences are evident in the distribution of eddies, with the highest and the lowest number of eddies noted in summer and winter, respectively. Since slick streaks in SAR images look dark, an eddy identified due to the slicks is referred to as “black eddy”. As a result of wave-current interactions in the zones of current shear, it can be seen that an eddy exhibits a bright curve, the eddy is called “white eddy”. During the seven years, 95 black eddies and 50 white eddies are identified in the study area. Black eddies are found in the whole study area while white eddies are mainly distributed in the vicinity of the Kuroshio Current. This study suggests that the distribution of the white eddy is denser around the Kuroshio because of the strong shear in the Kuroshio region. In terms of the eddy sizes, white eddies are generally smaller than black eddies.
-
Key words:
- submesoscale /
- ocean eddy /
- Synthetic Aperture Radar /
- East China Sea
-
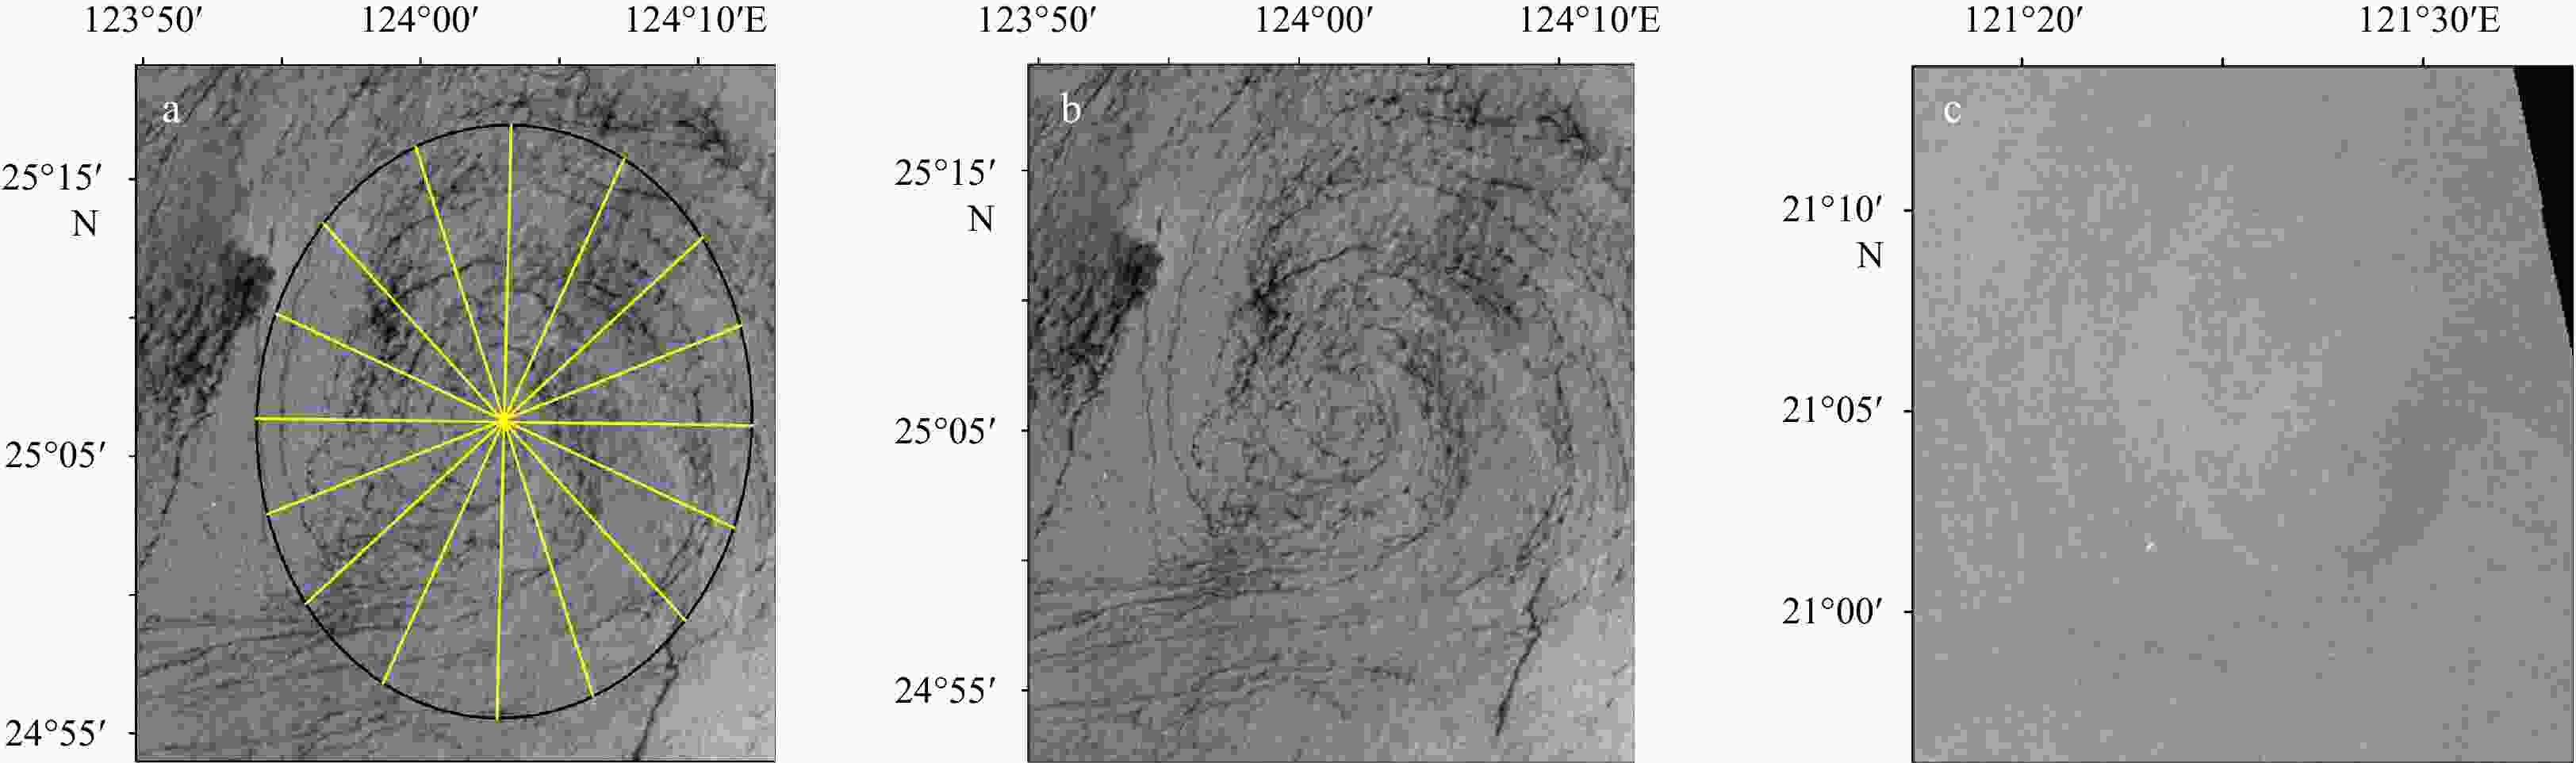
Figure 1. An eddy identified by SAR image (a), black eddy (b, 2008/07/11 UTC 01:48), and white eddy (c, 2008/08/10 UTC 13:53) identified by the Envisat SAR. In a, the outer black ellipse is the eddy boundary; the aggregation point of black curves in the SAR image is the center of the eddy; the average length of eight yellow straight lines passing through the eddy center is the diameter.

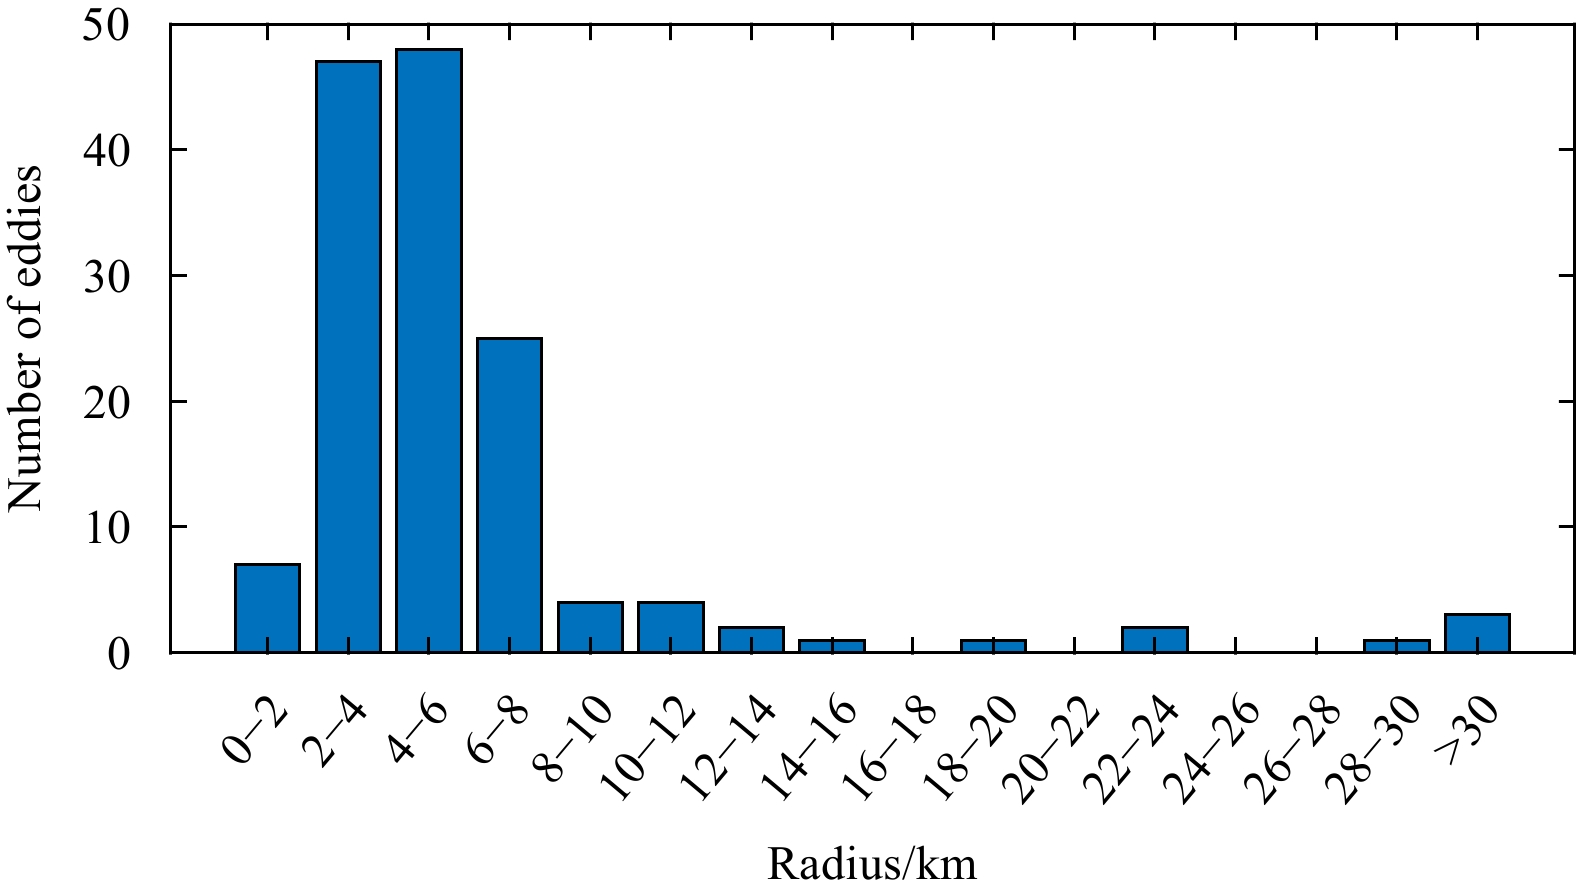
Figure 2. The radius histogram of eddies identified in the SAR images in the East China Sea from 2005 to 2011. Most of the eddies identified in the SAR images are submesoscale eddies with radius less than 20 km. Most of the radius of the eddies is concentrated in the range of 0–10 km.
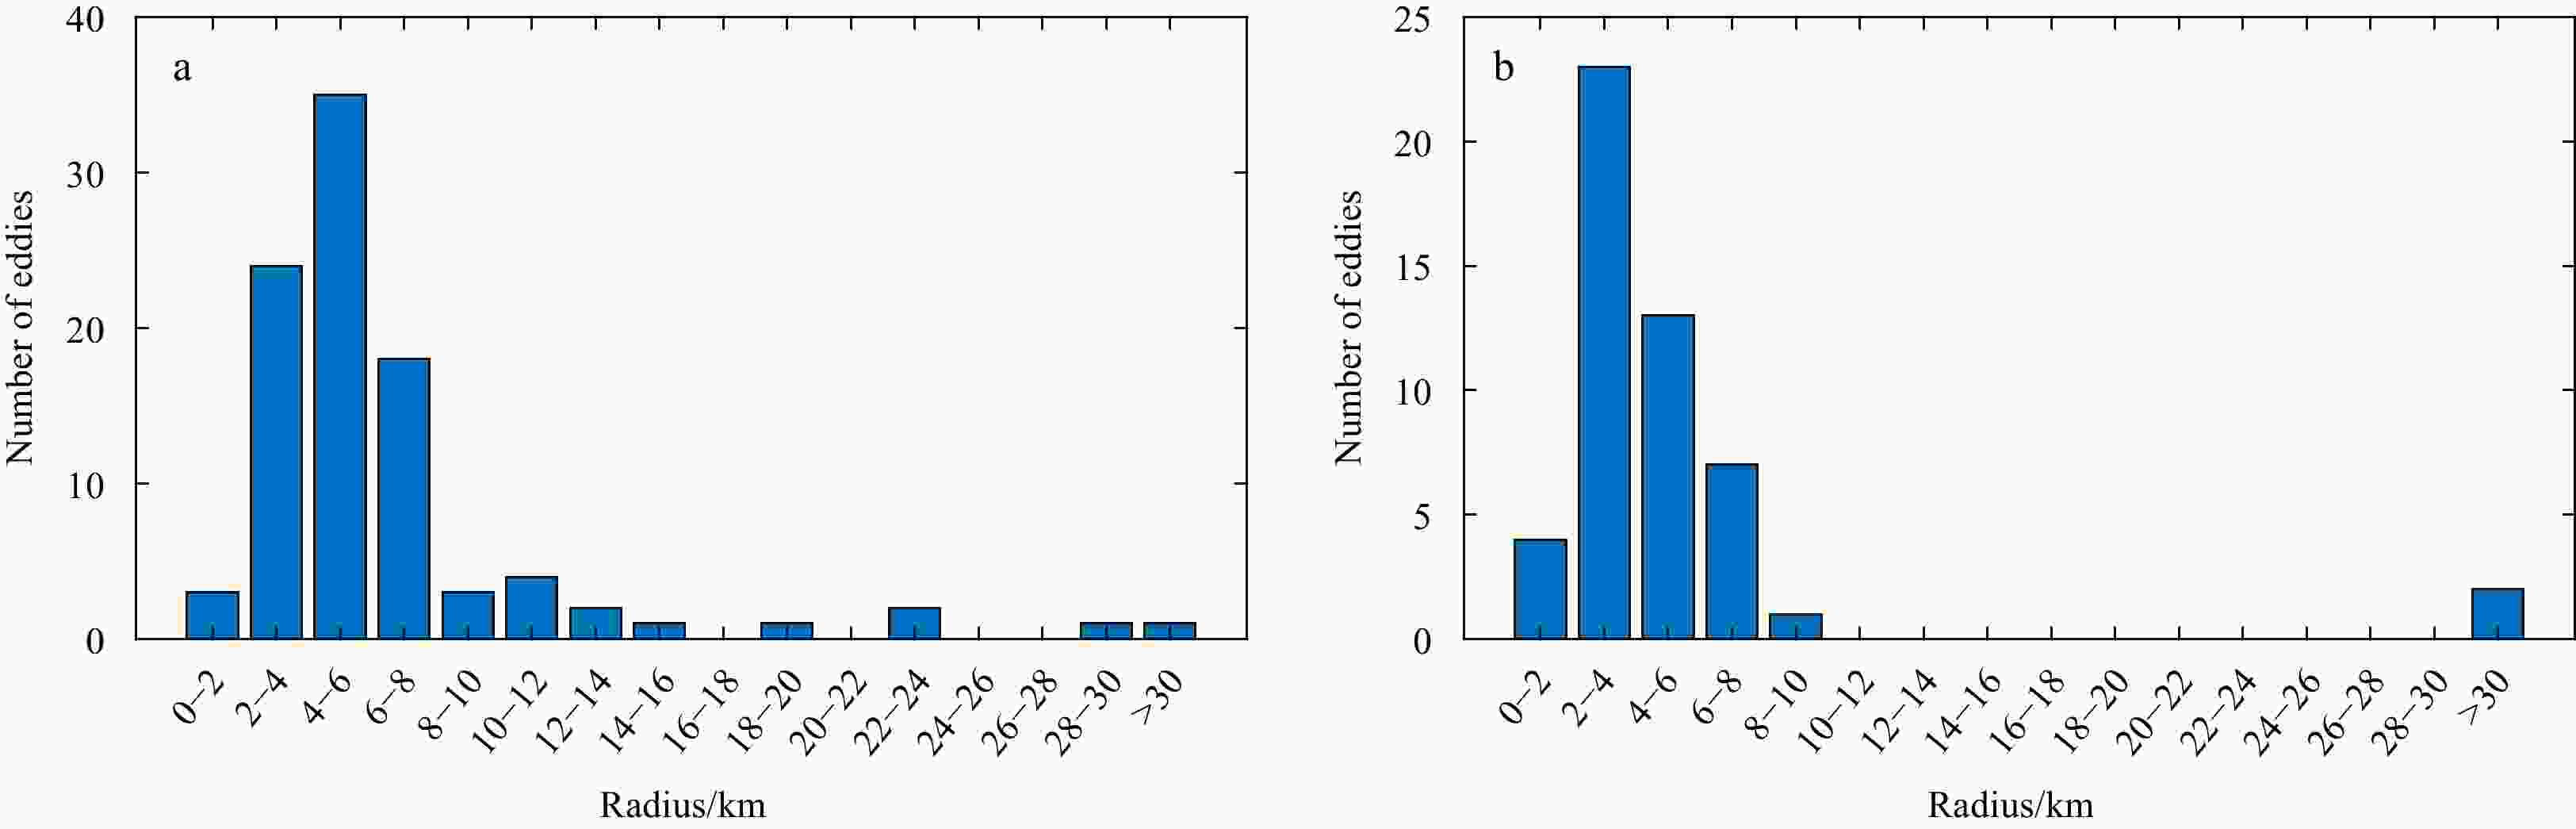
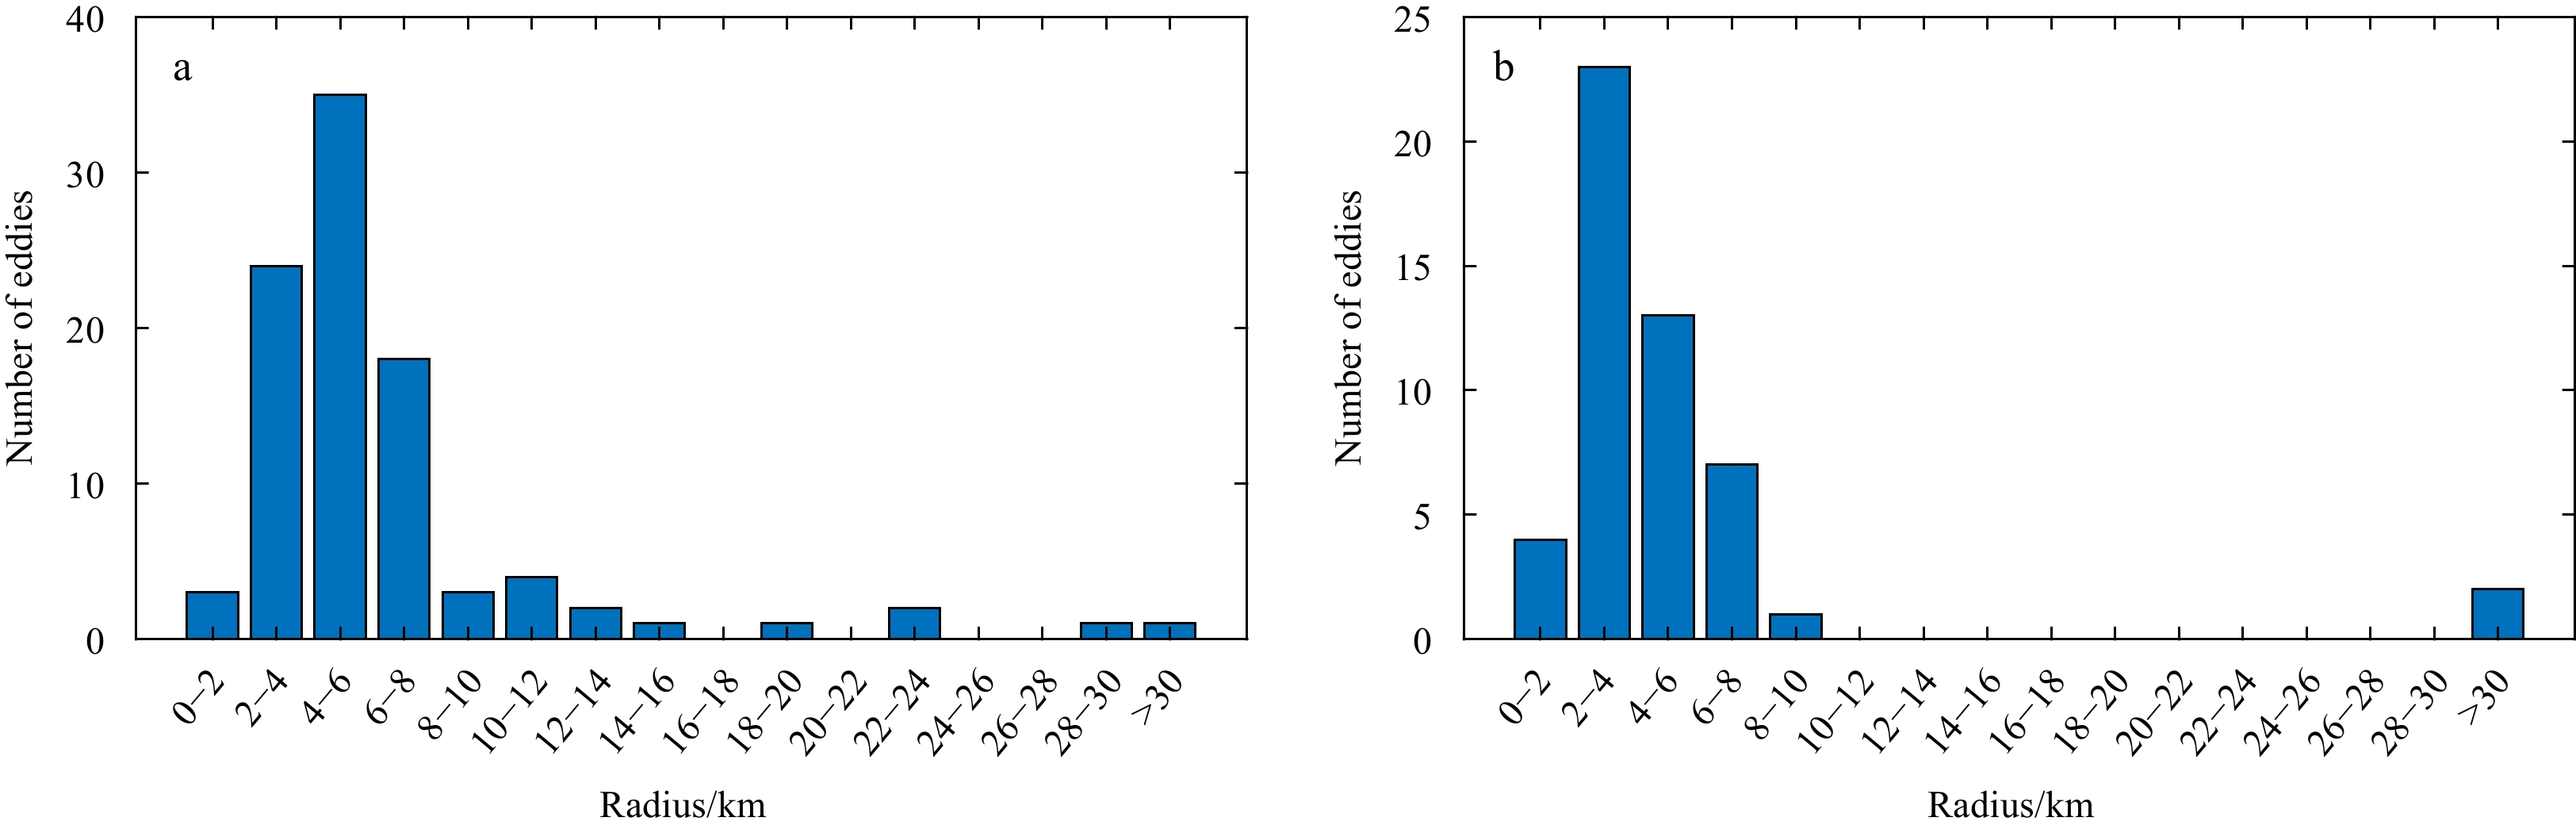
Figure 3. The radius histograms of black (a) and white (b) eddies in the East China Sea. The radii of most black and white eddies are mainly concentrated in the range of 0–10 km and the radii of white eddies are more concentrated in the smaller scale than the radii of black eddies.
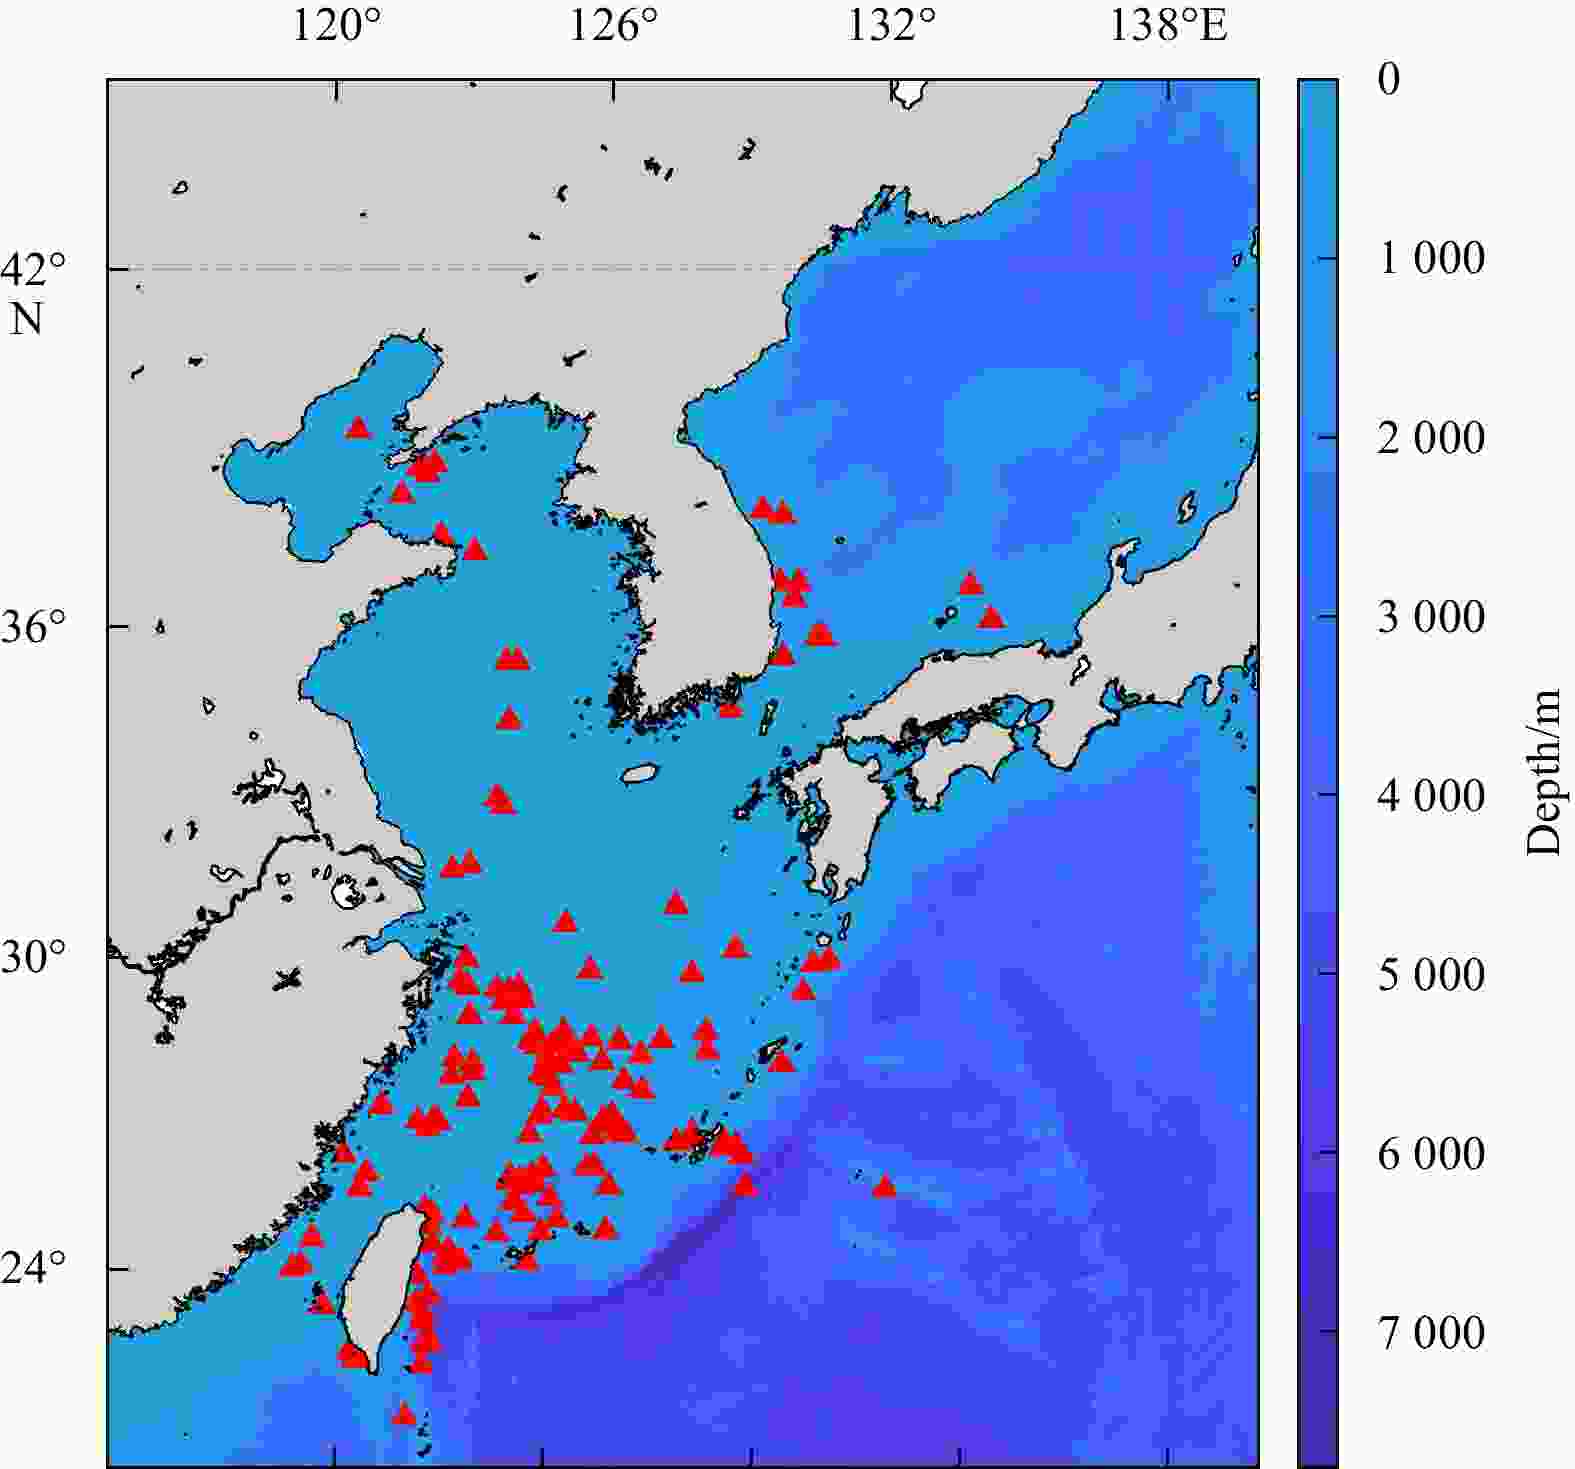
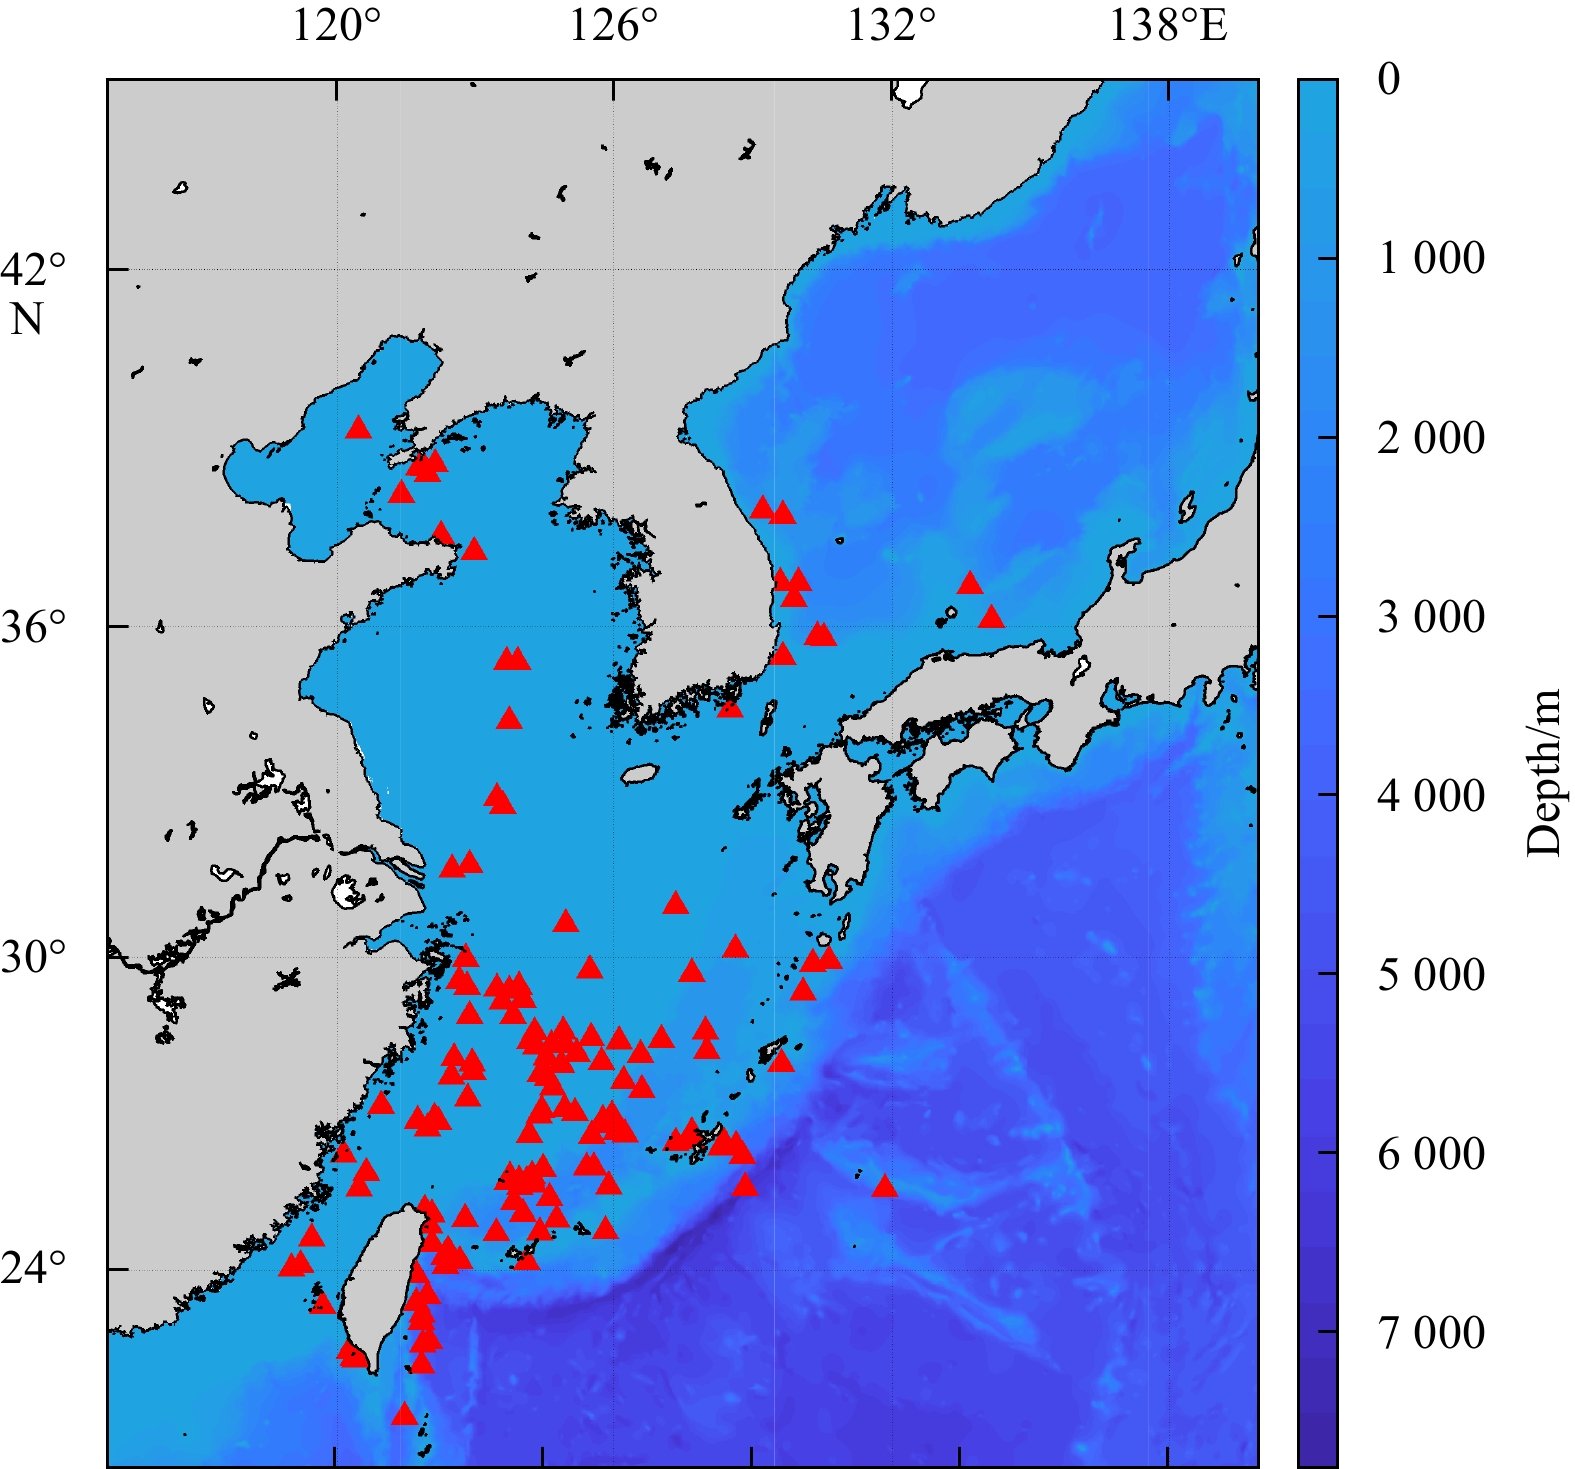
Figure 4. Spatial distribution of eddies in the East China Sea. The red triangles represent the center locations of the eddies. The background color is bathymetry (m). The data is derived from gridded bathymetry data provided by the General Bathymetric Chart of the Oceans (GEBCO).
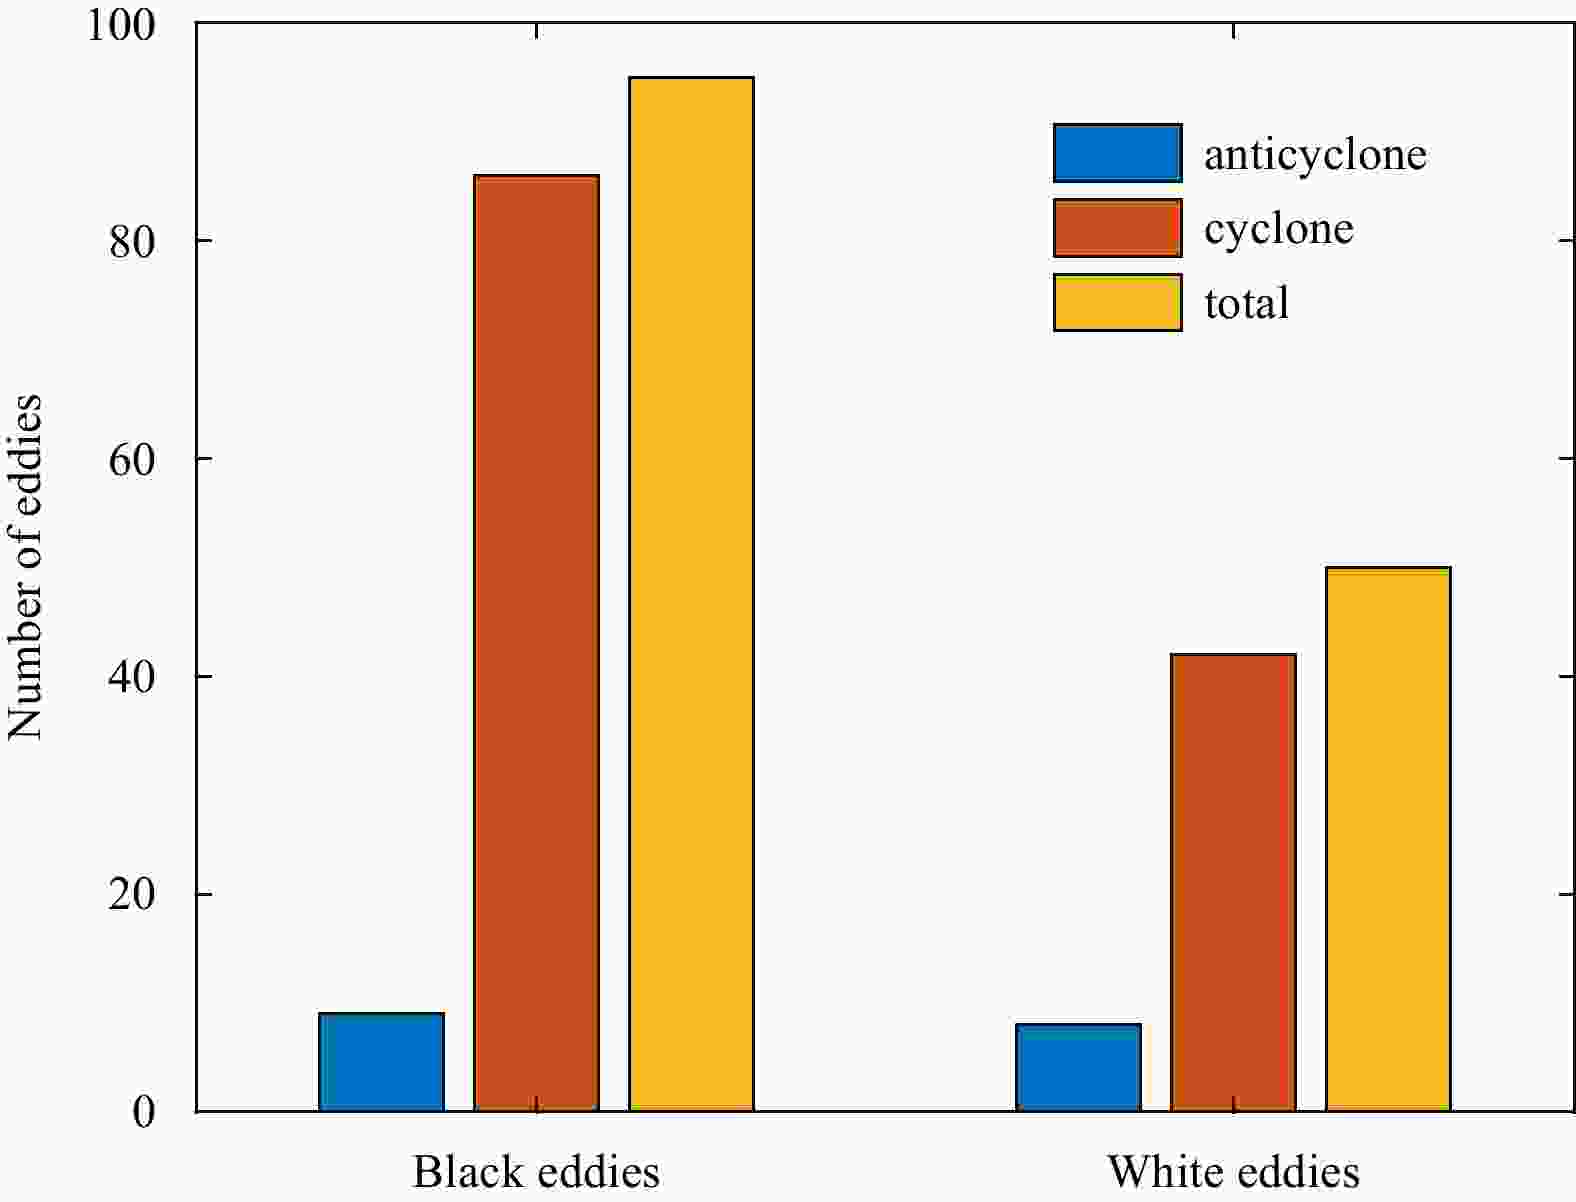
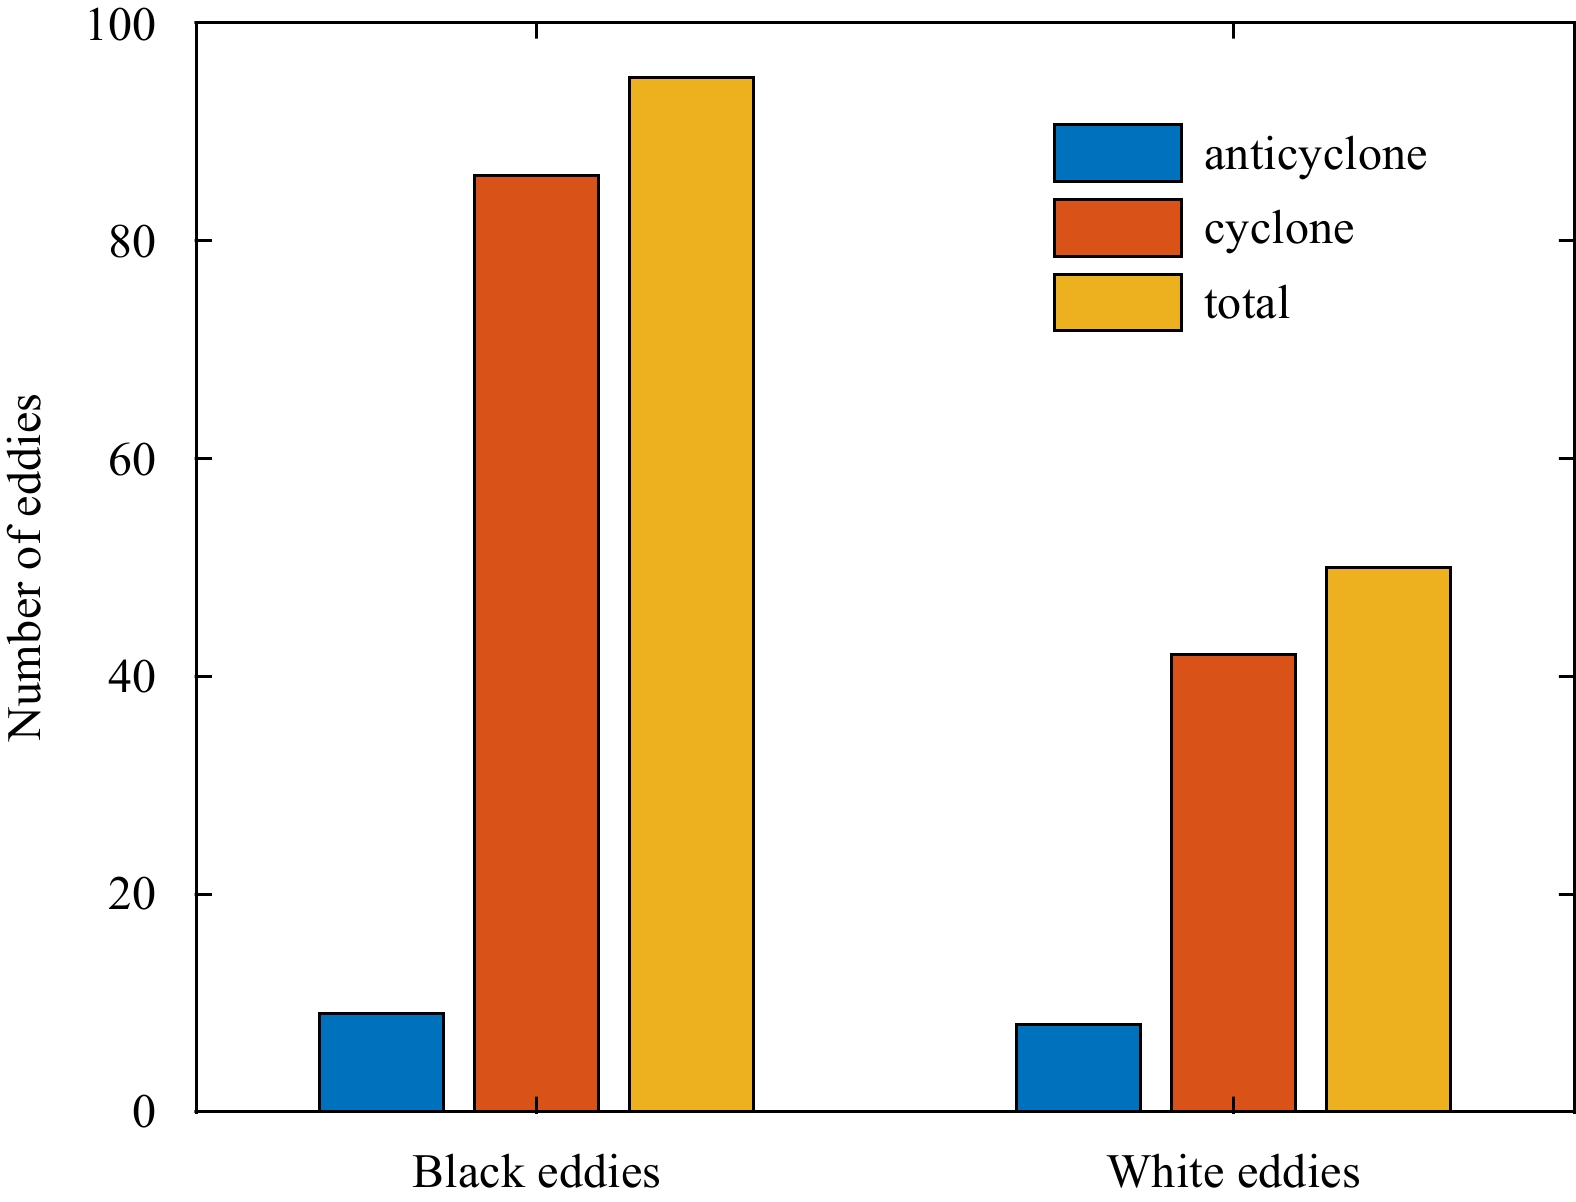
Figure 5. Comparison between the numbers of black eddies and white eddies. The blue, orange and yellow bars represent the number of anticyclonic eddies, cyclonic eddies and total number of eddies, respectively.
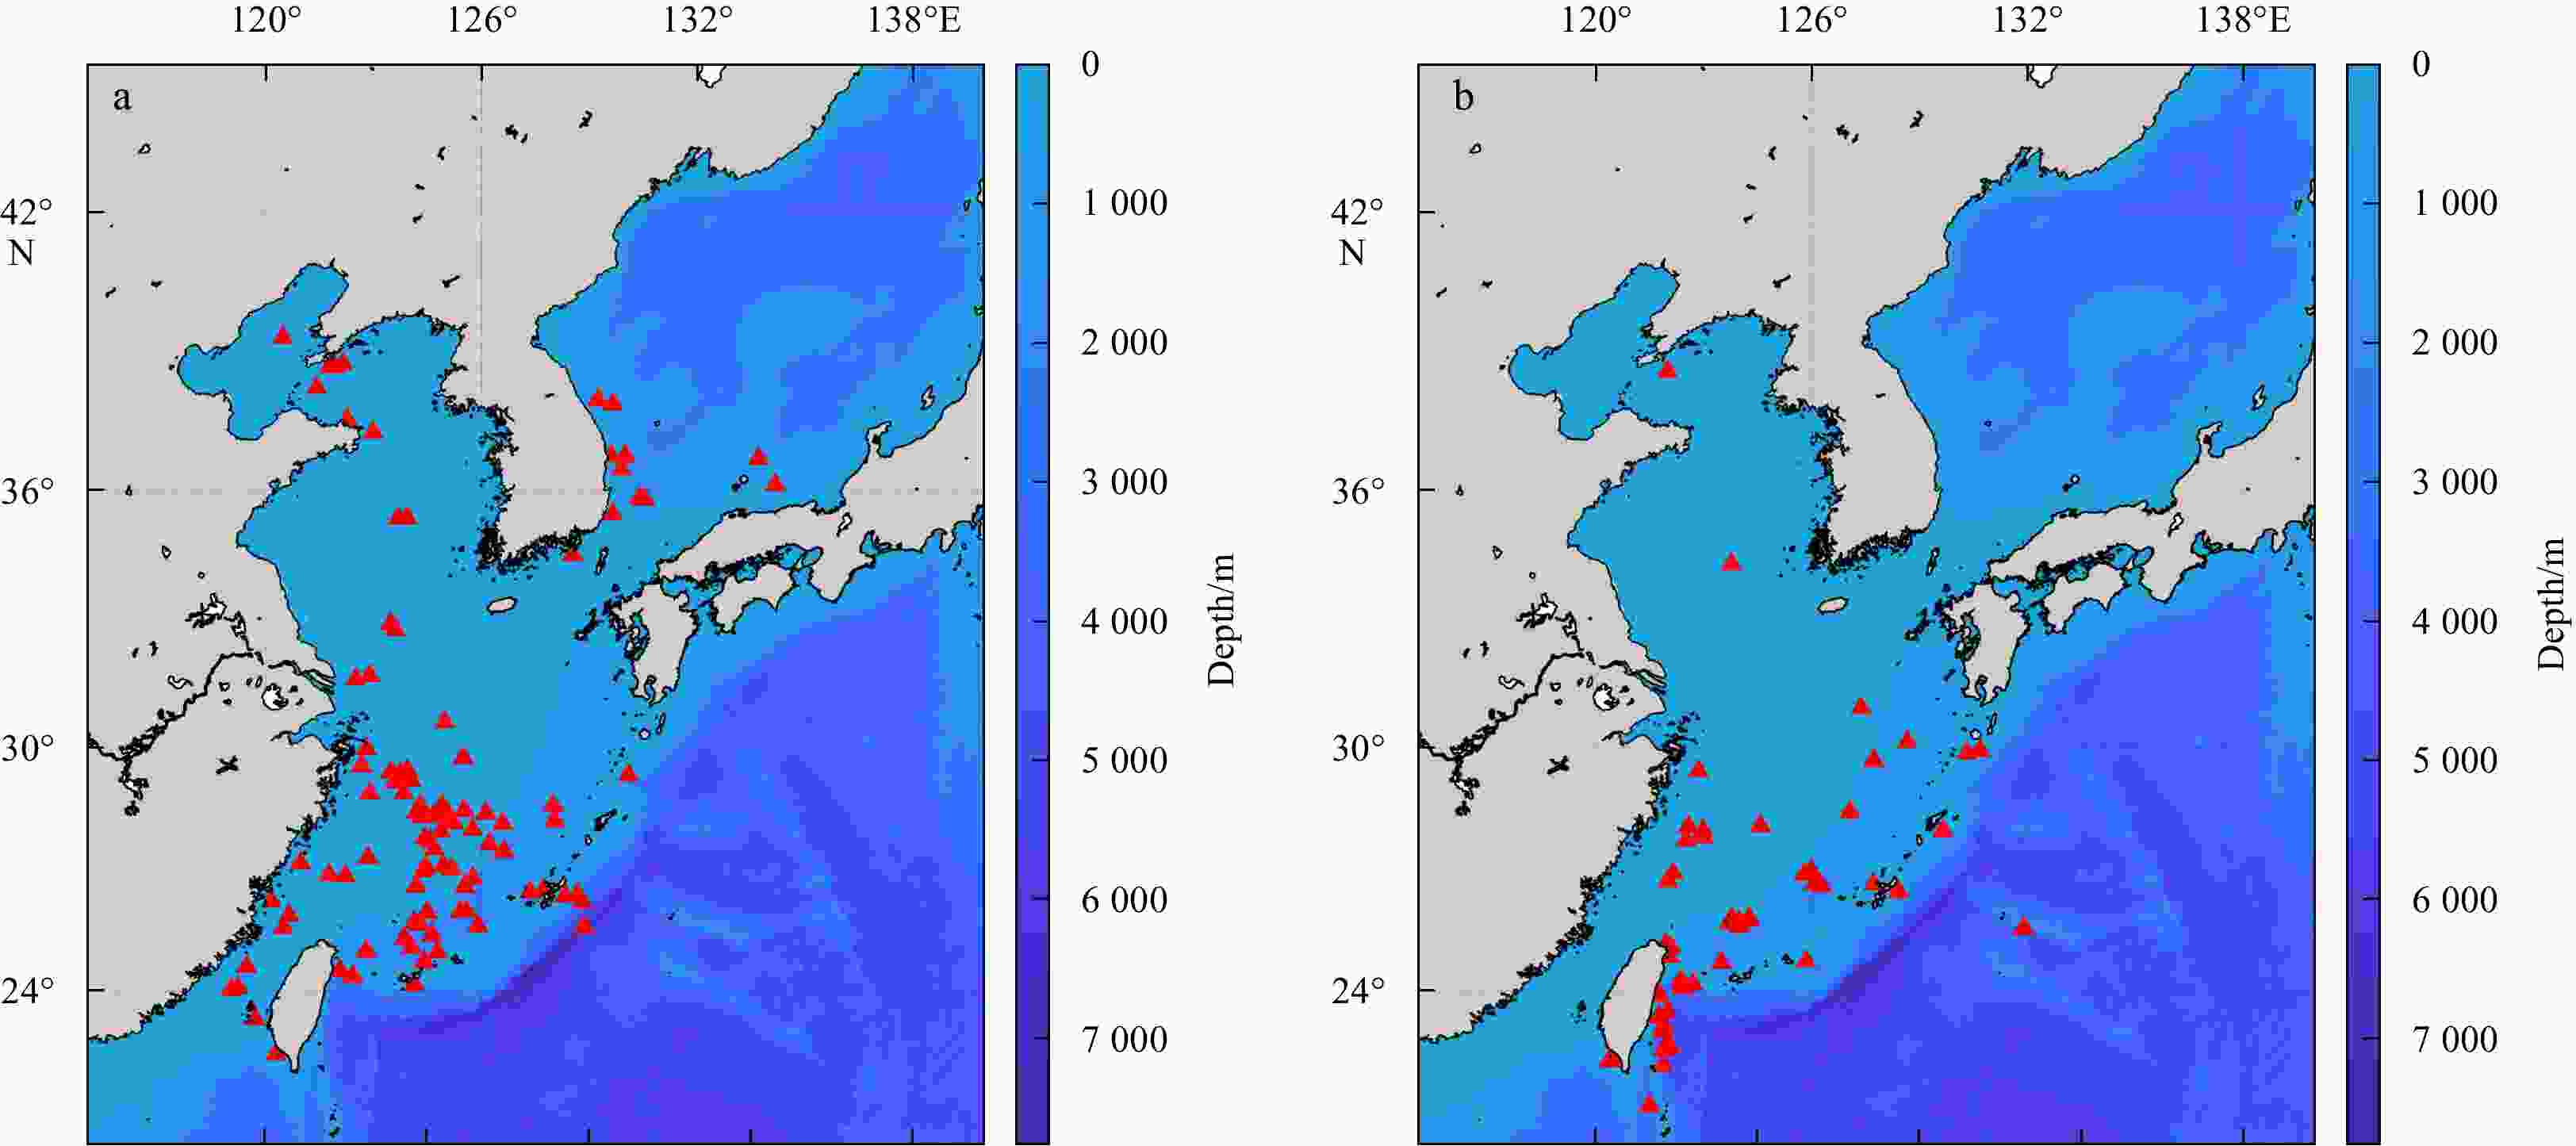
Figure 6. Spatial distribution of black eddies (a) and white eddies (b). The red triangles represent the center locations of the eddies. The background color is bathymetry (m). The black eddies are distributed over the whole area while the white eddies are mainly concentrated in the Kuroshio and its adjacent areas.
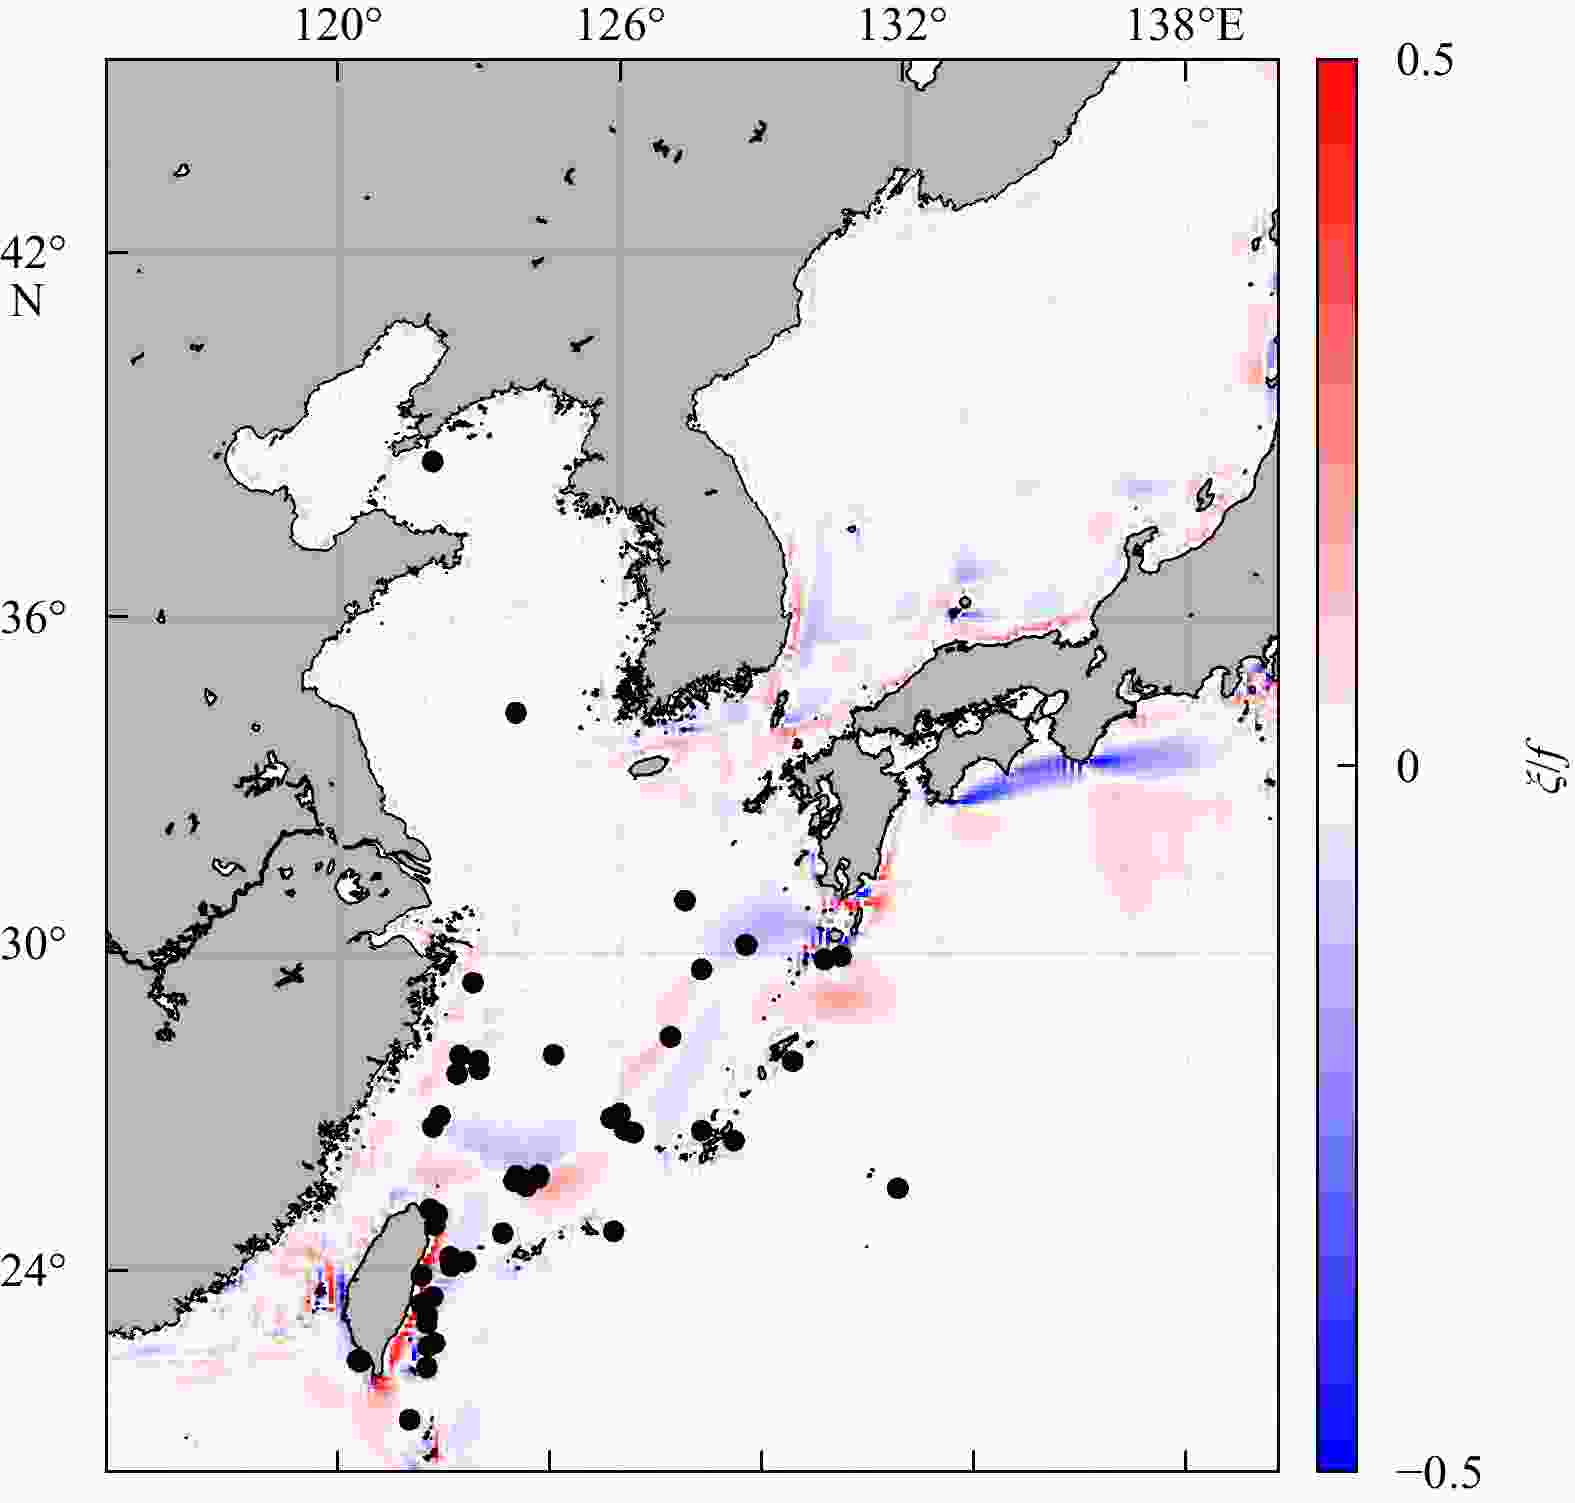
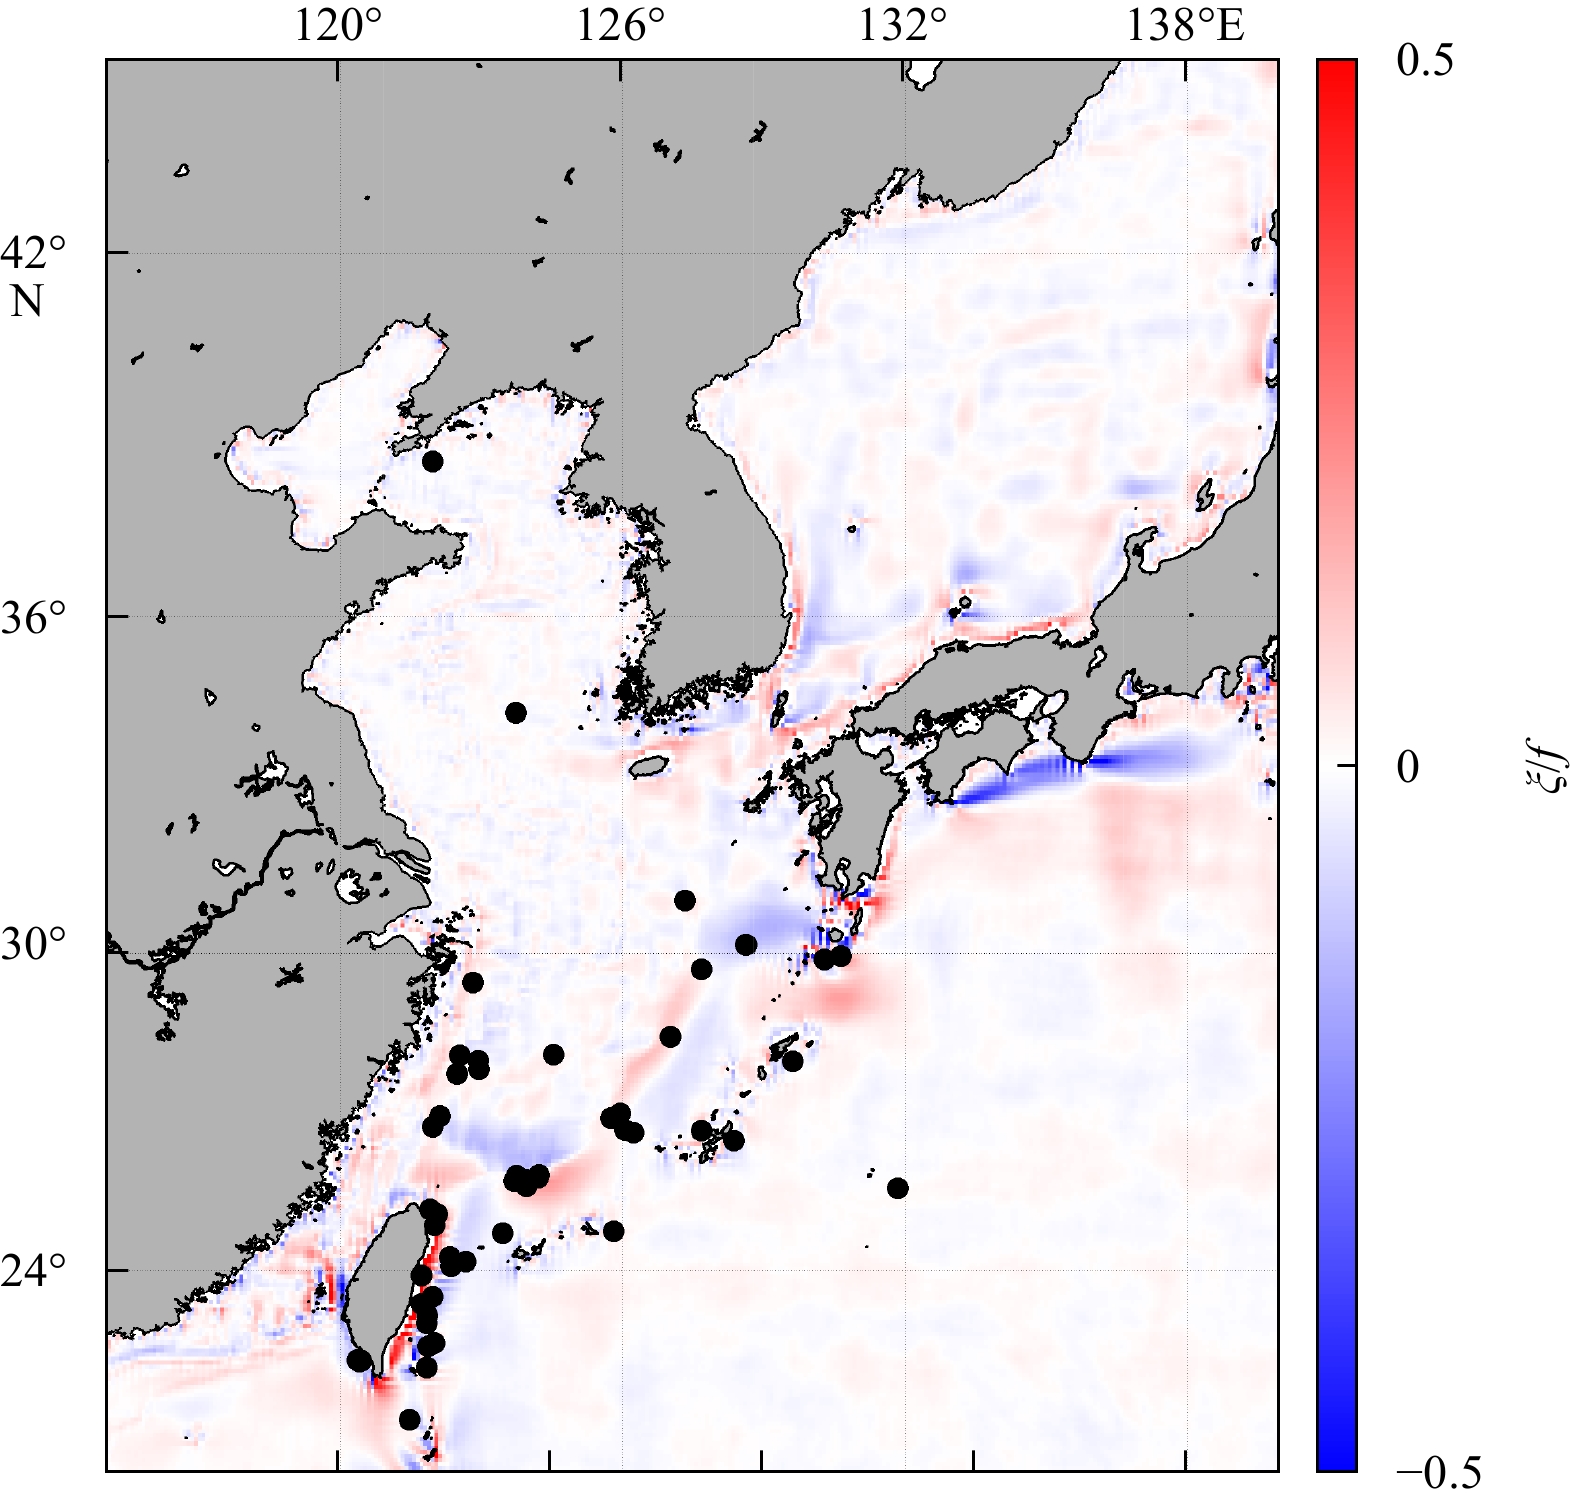
Figure 7. The spatial distributions of the shear deformation rate (ξ/f) of sea surface current and white eddies. The background color is the shear deformation rate and black points denote locations of eddies. Eddies are mostly distributed in areas of large shear deformation rates.

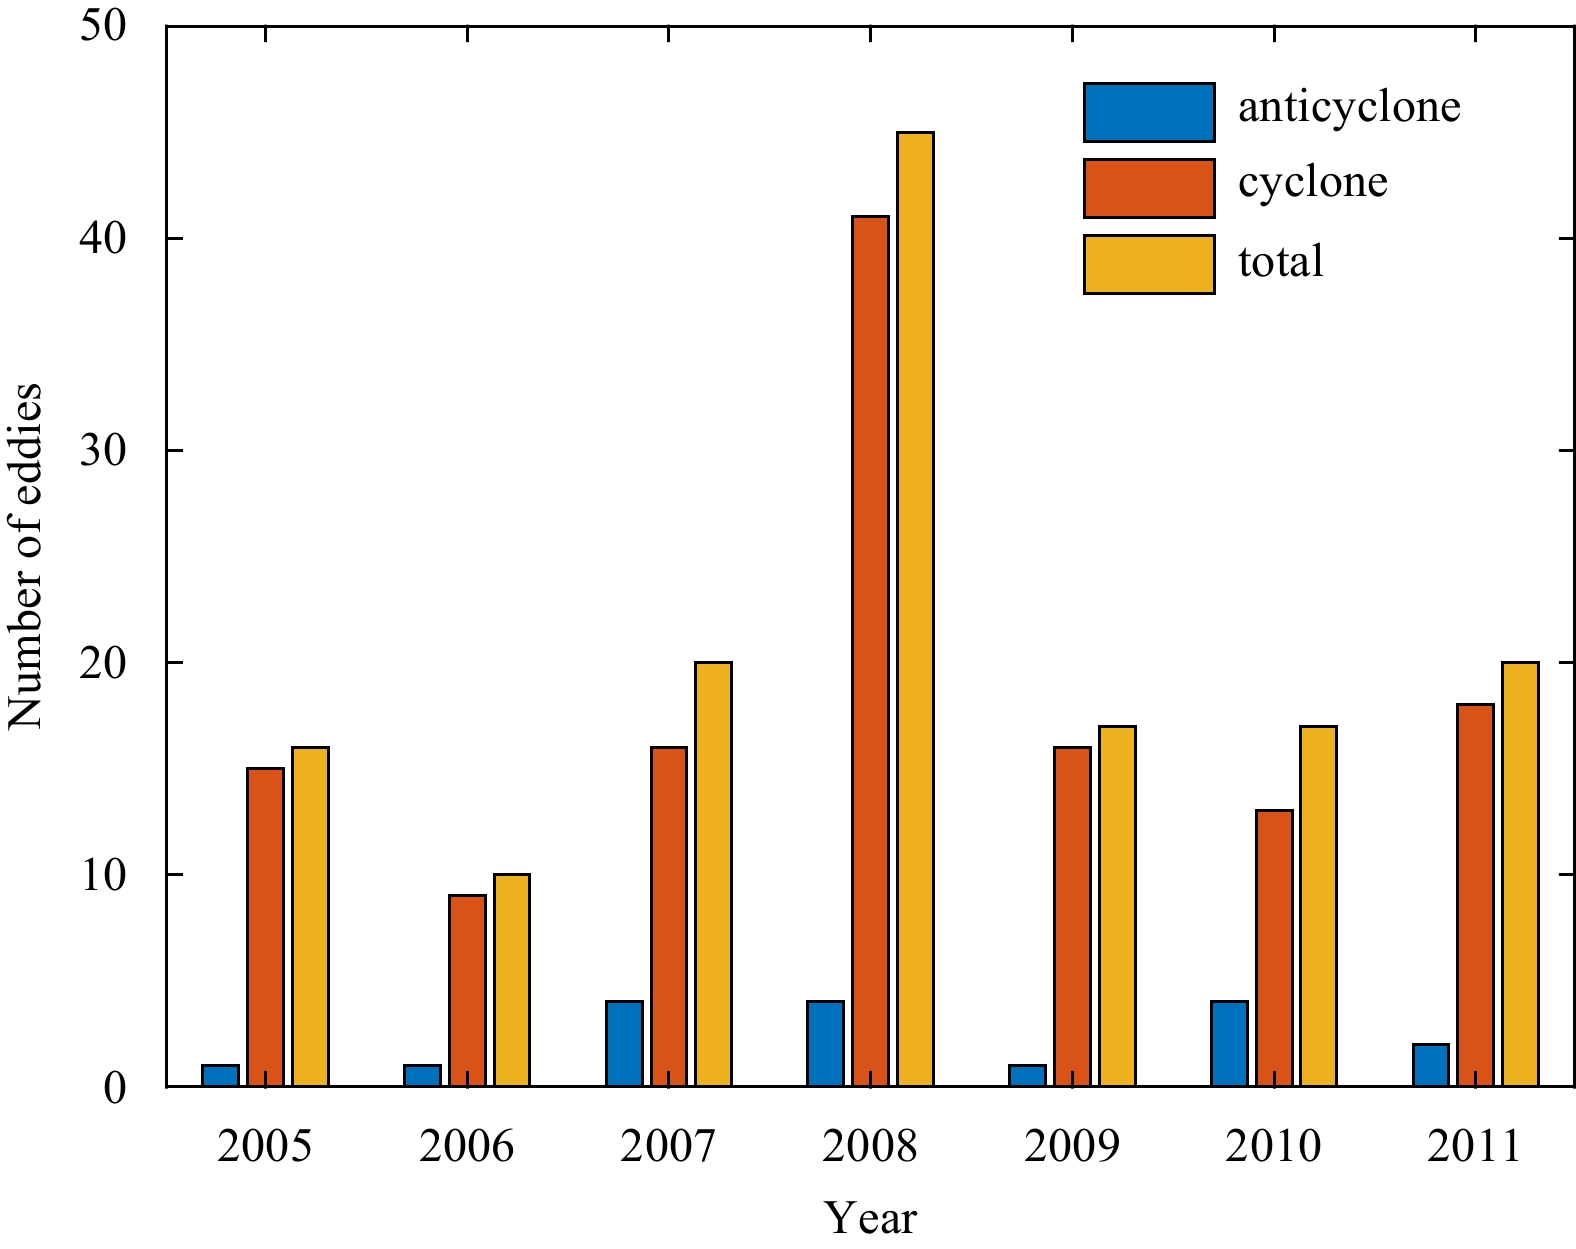
Figure 8. Annual distribution of the number of eddies in 2005–2011. The blue, orange and yellow bars represent the number of anticyclonic eddies, cyclonic eddies and total number of eddies, respectively. The largest number of eddies is identified in 2008 and the smallest number is recorded in 2006. The number of eddies identified in the other years ranges from 15 to 20.

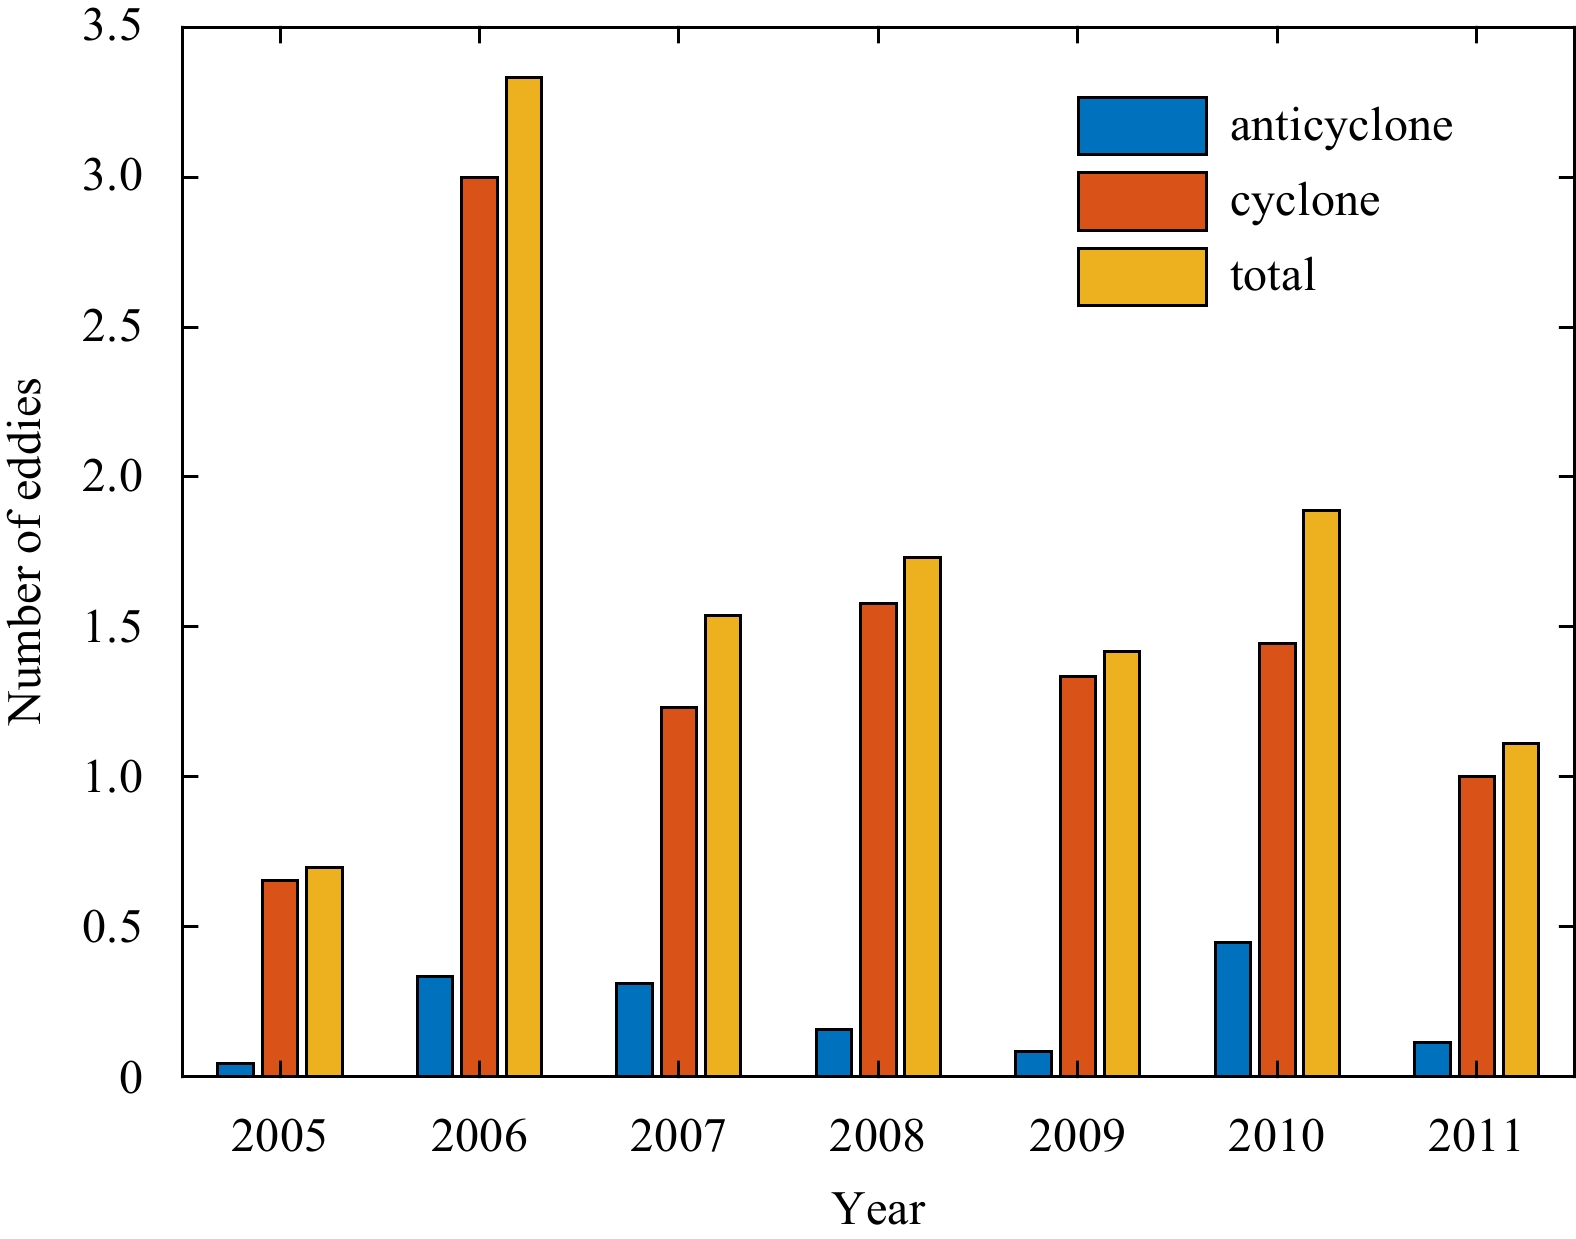
Figure 9. Annual distribution of the number of eddies identified in each SAR image which can be used for eddy detection. The blue, orange and yellow bars represent the number of anticyclonic eddies, cyclonic eddies and total number of eddies, respectively. In 2006, the number of eddies identified in each SAR image is the largest (3.33) and the lowest (0.70) in 2005. In the other years, the number of eddies identified in each SAR image ranges from 1 to 2.
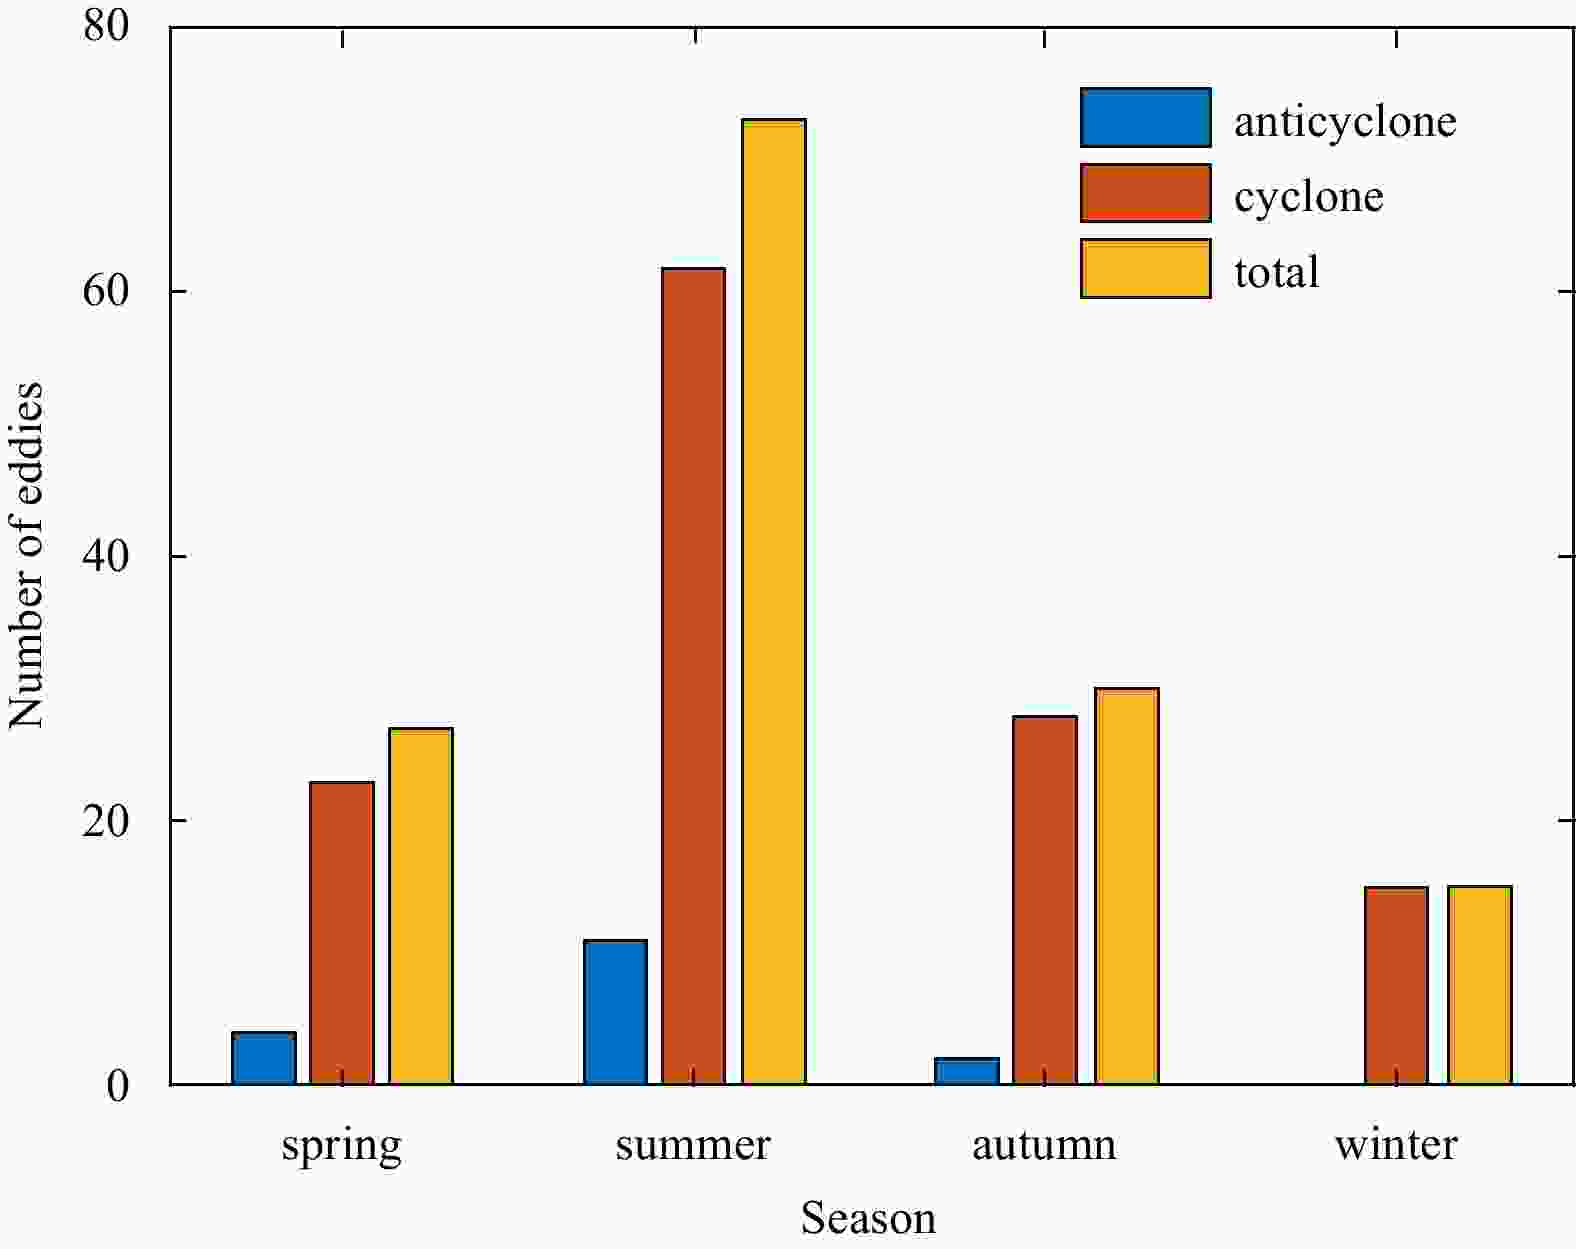
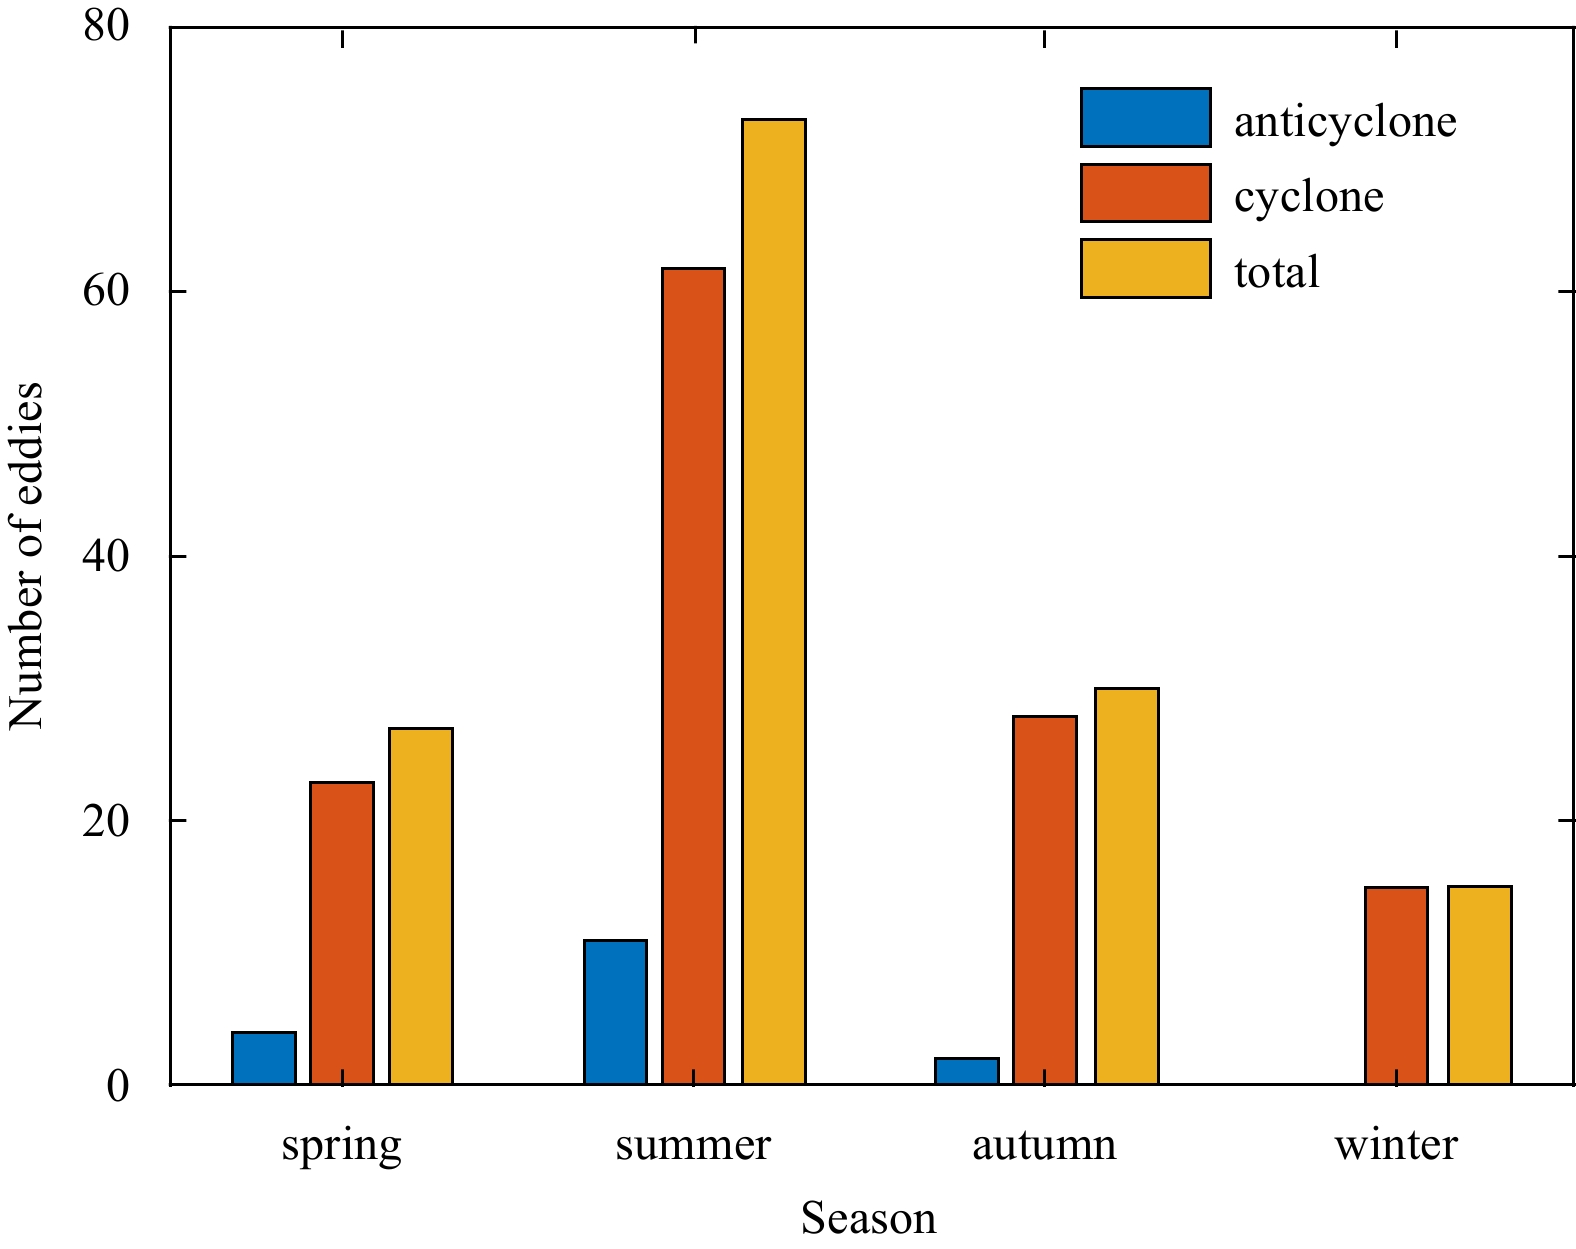
Figure 10. Seasonal distribution of the number of eddies in the East China Sea. The blue, orange and yellow bars represent the number of anticyclonic eddies, cyclonic eddies and total number of eddies, respectively.
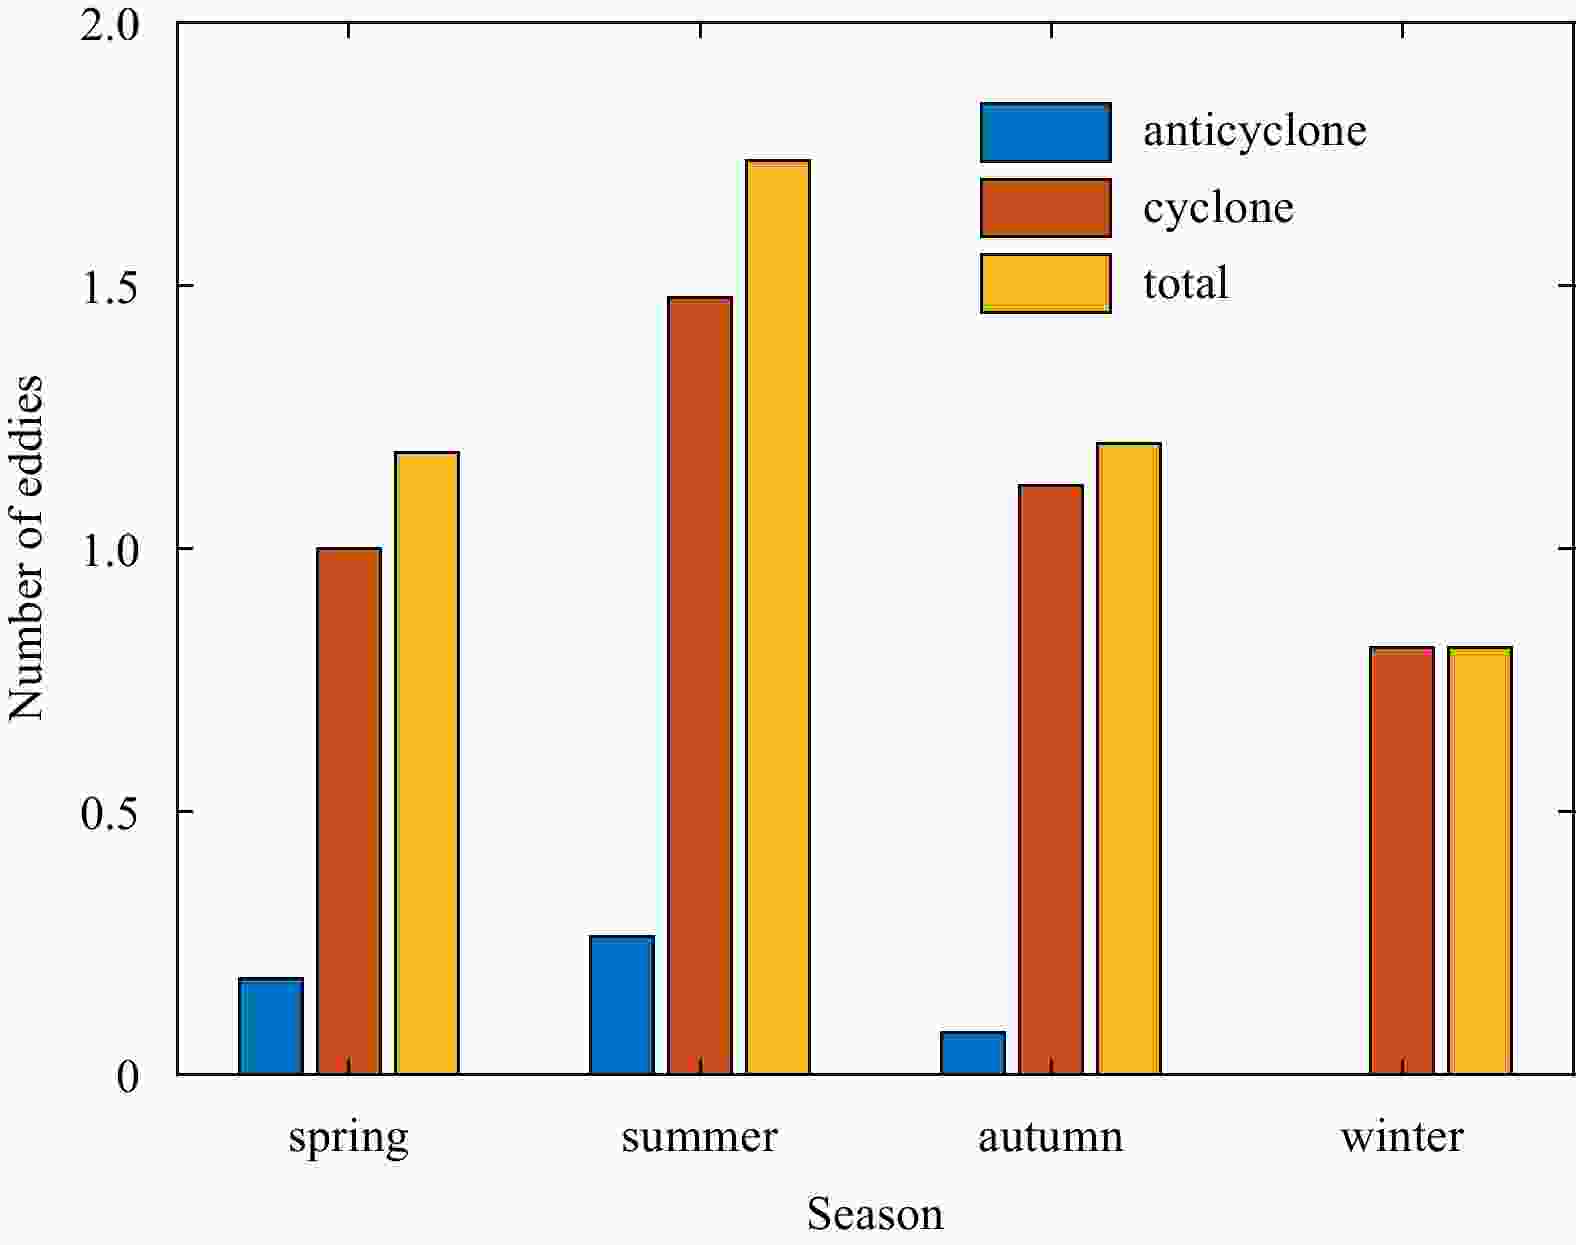
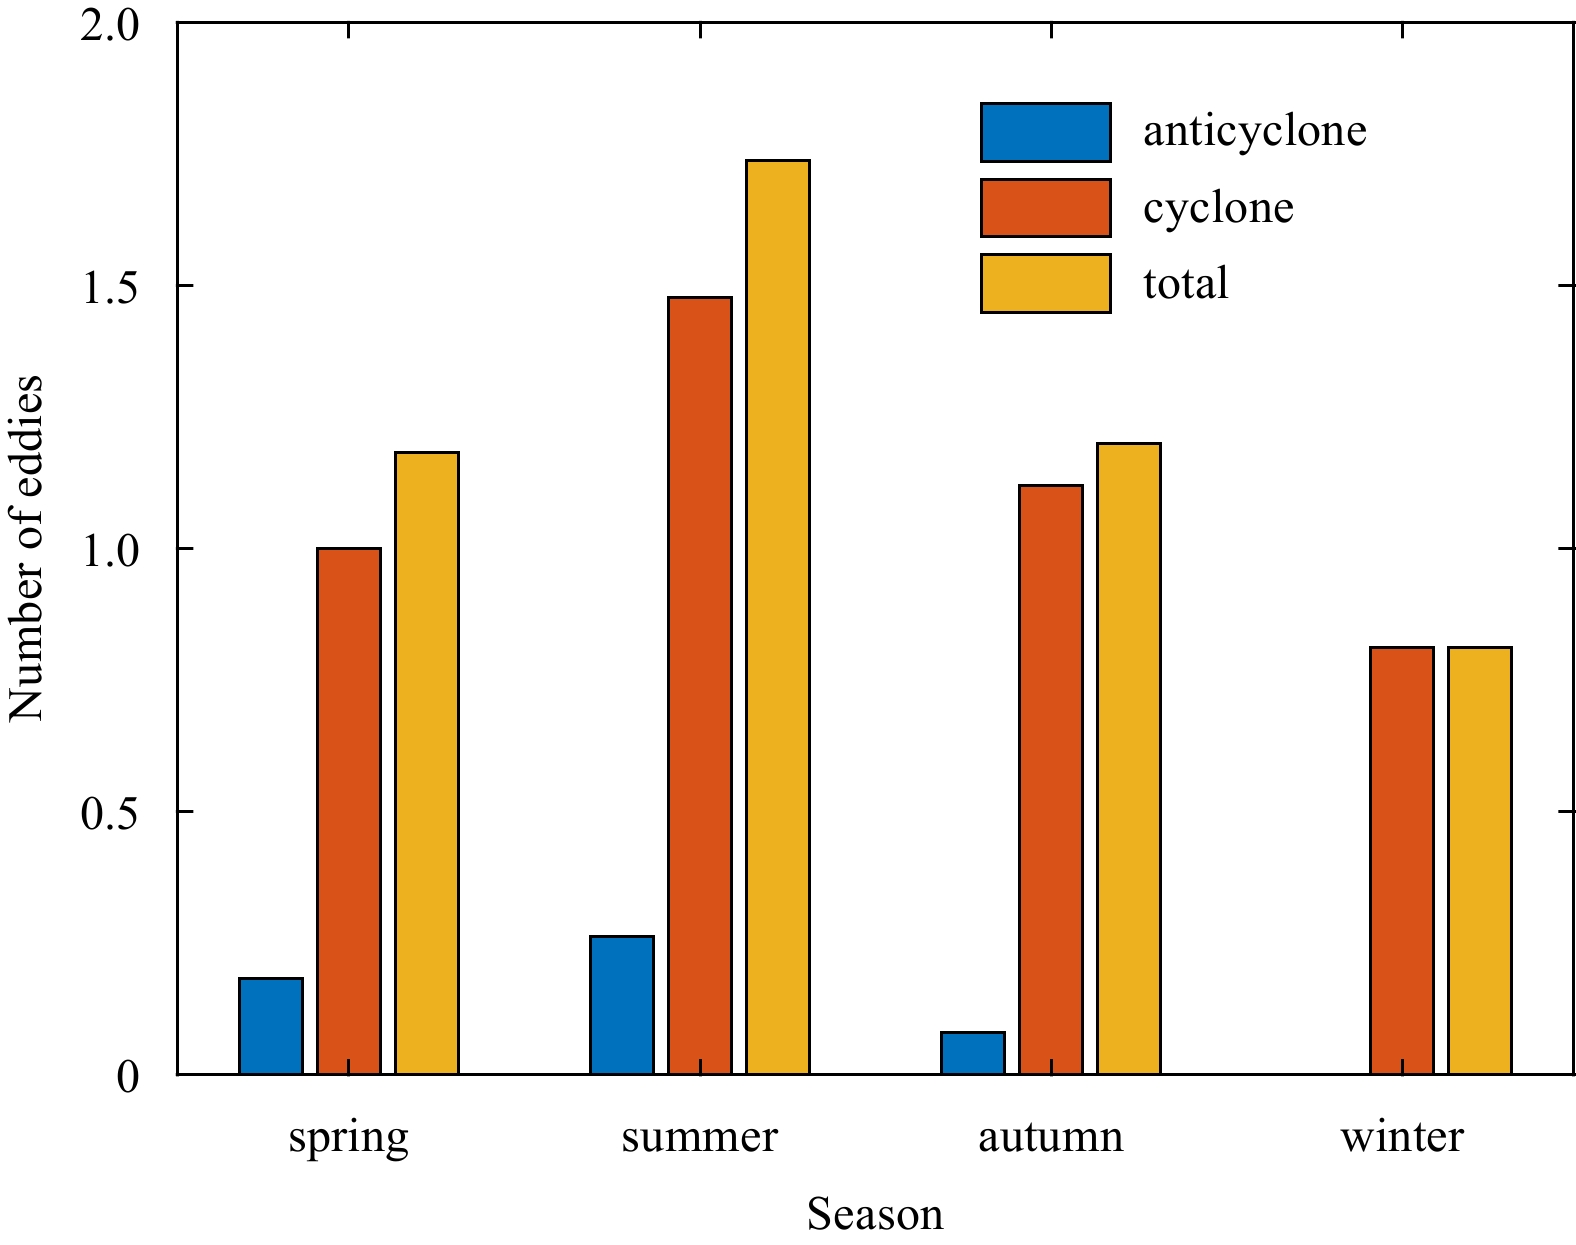
Figure 11. Seasonal distribution of the number of eddies identified in each SAR image. The blue, orange and yellow bars represent the number of anticyclonic eddies, cyclonic eddies and total number of eddies, respectively.
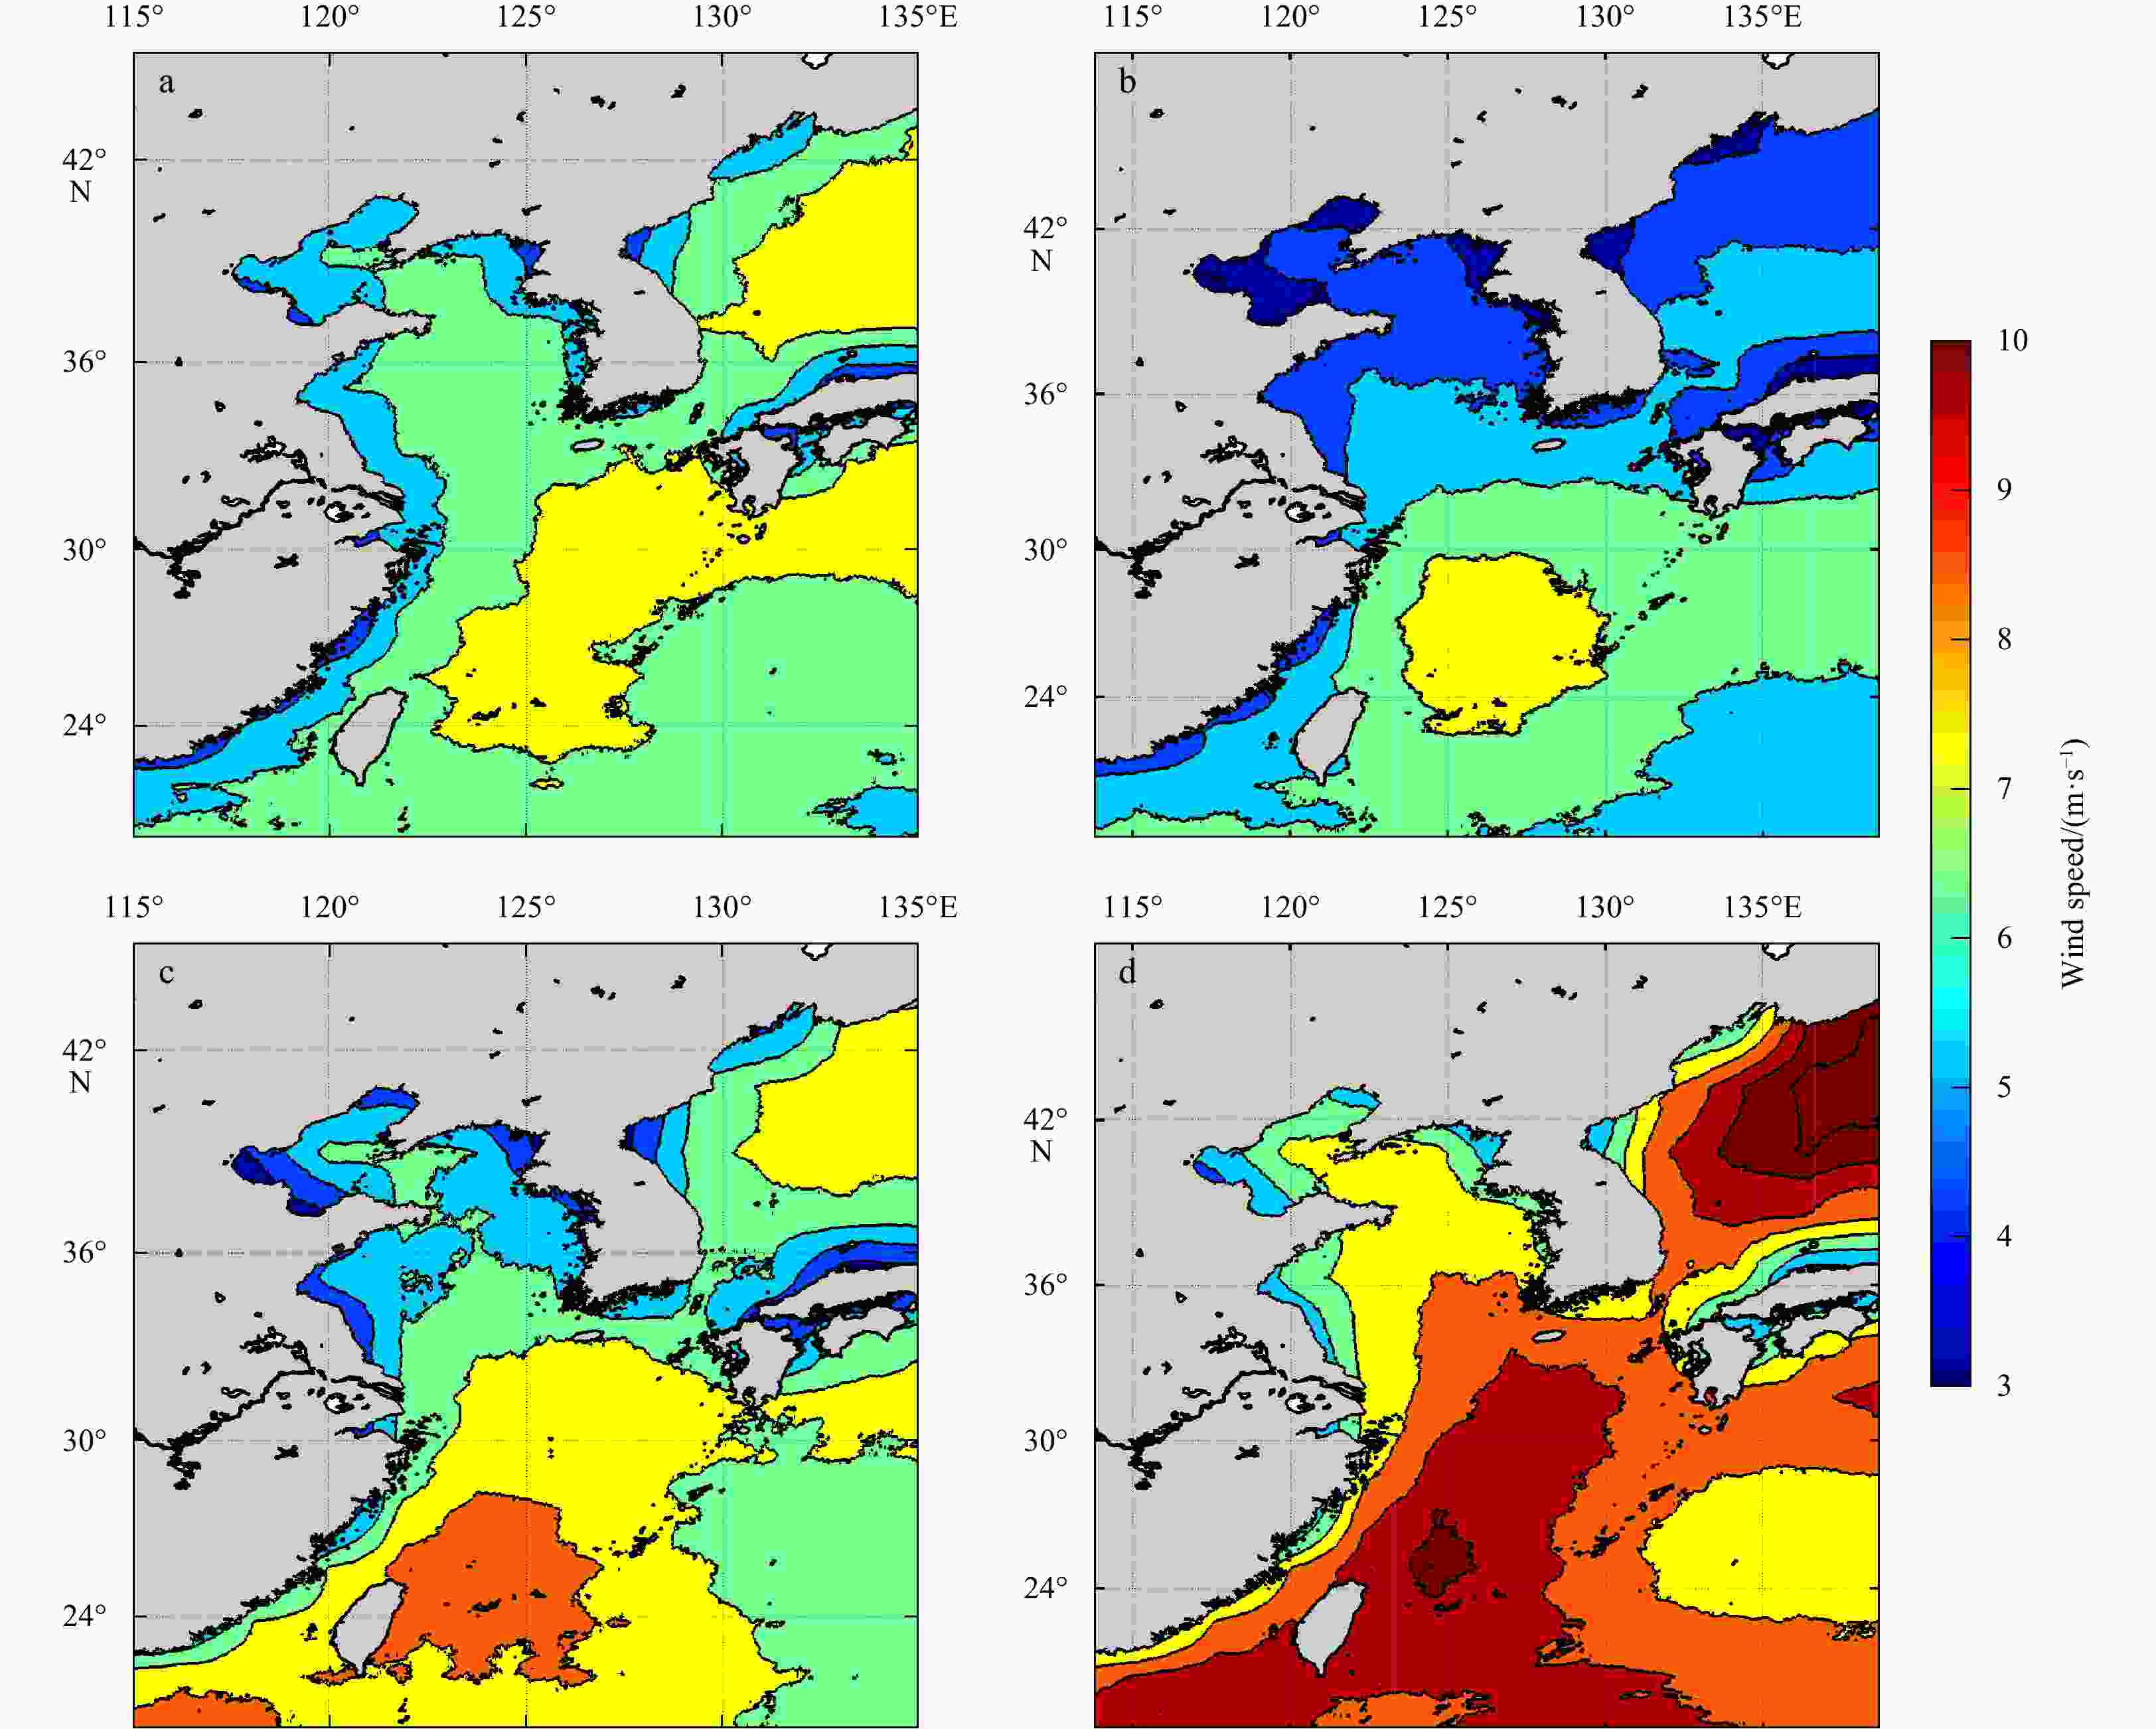
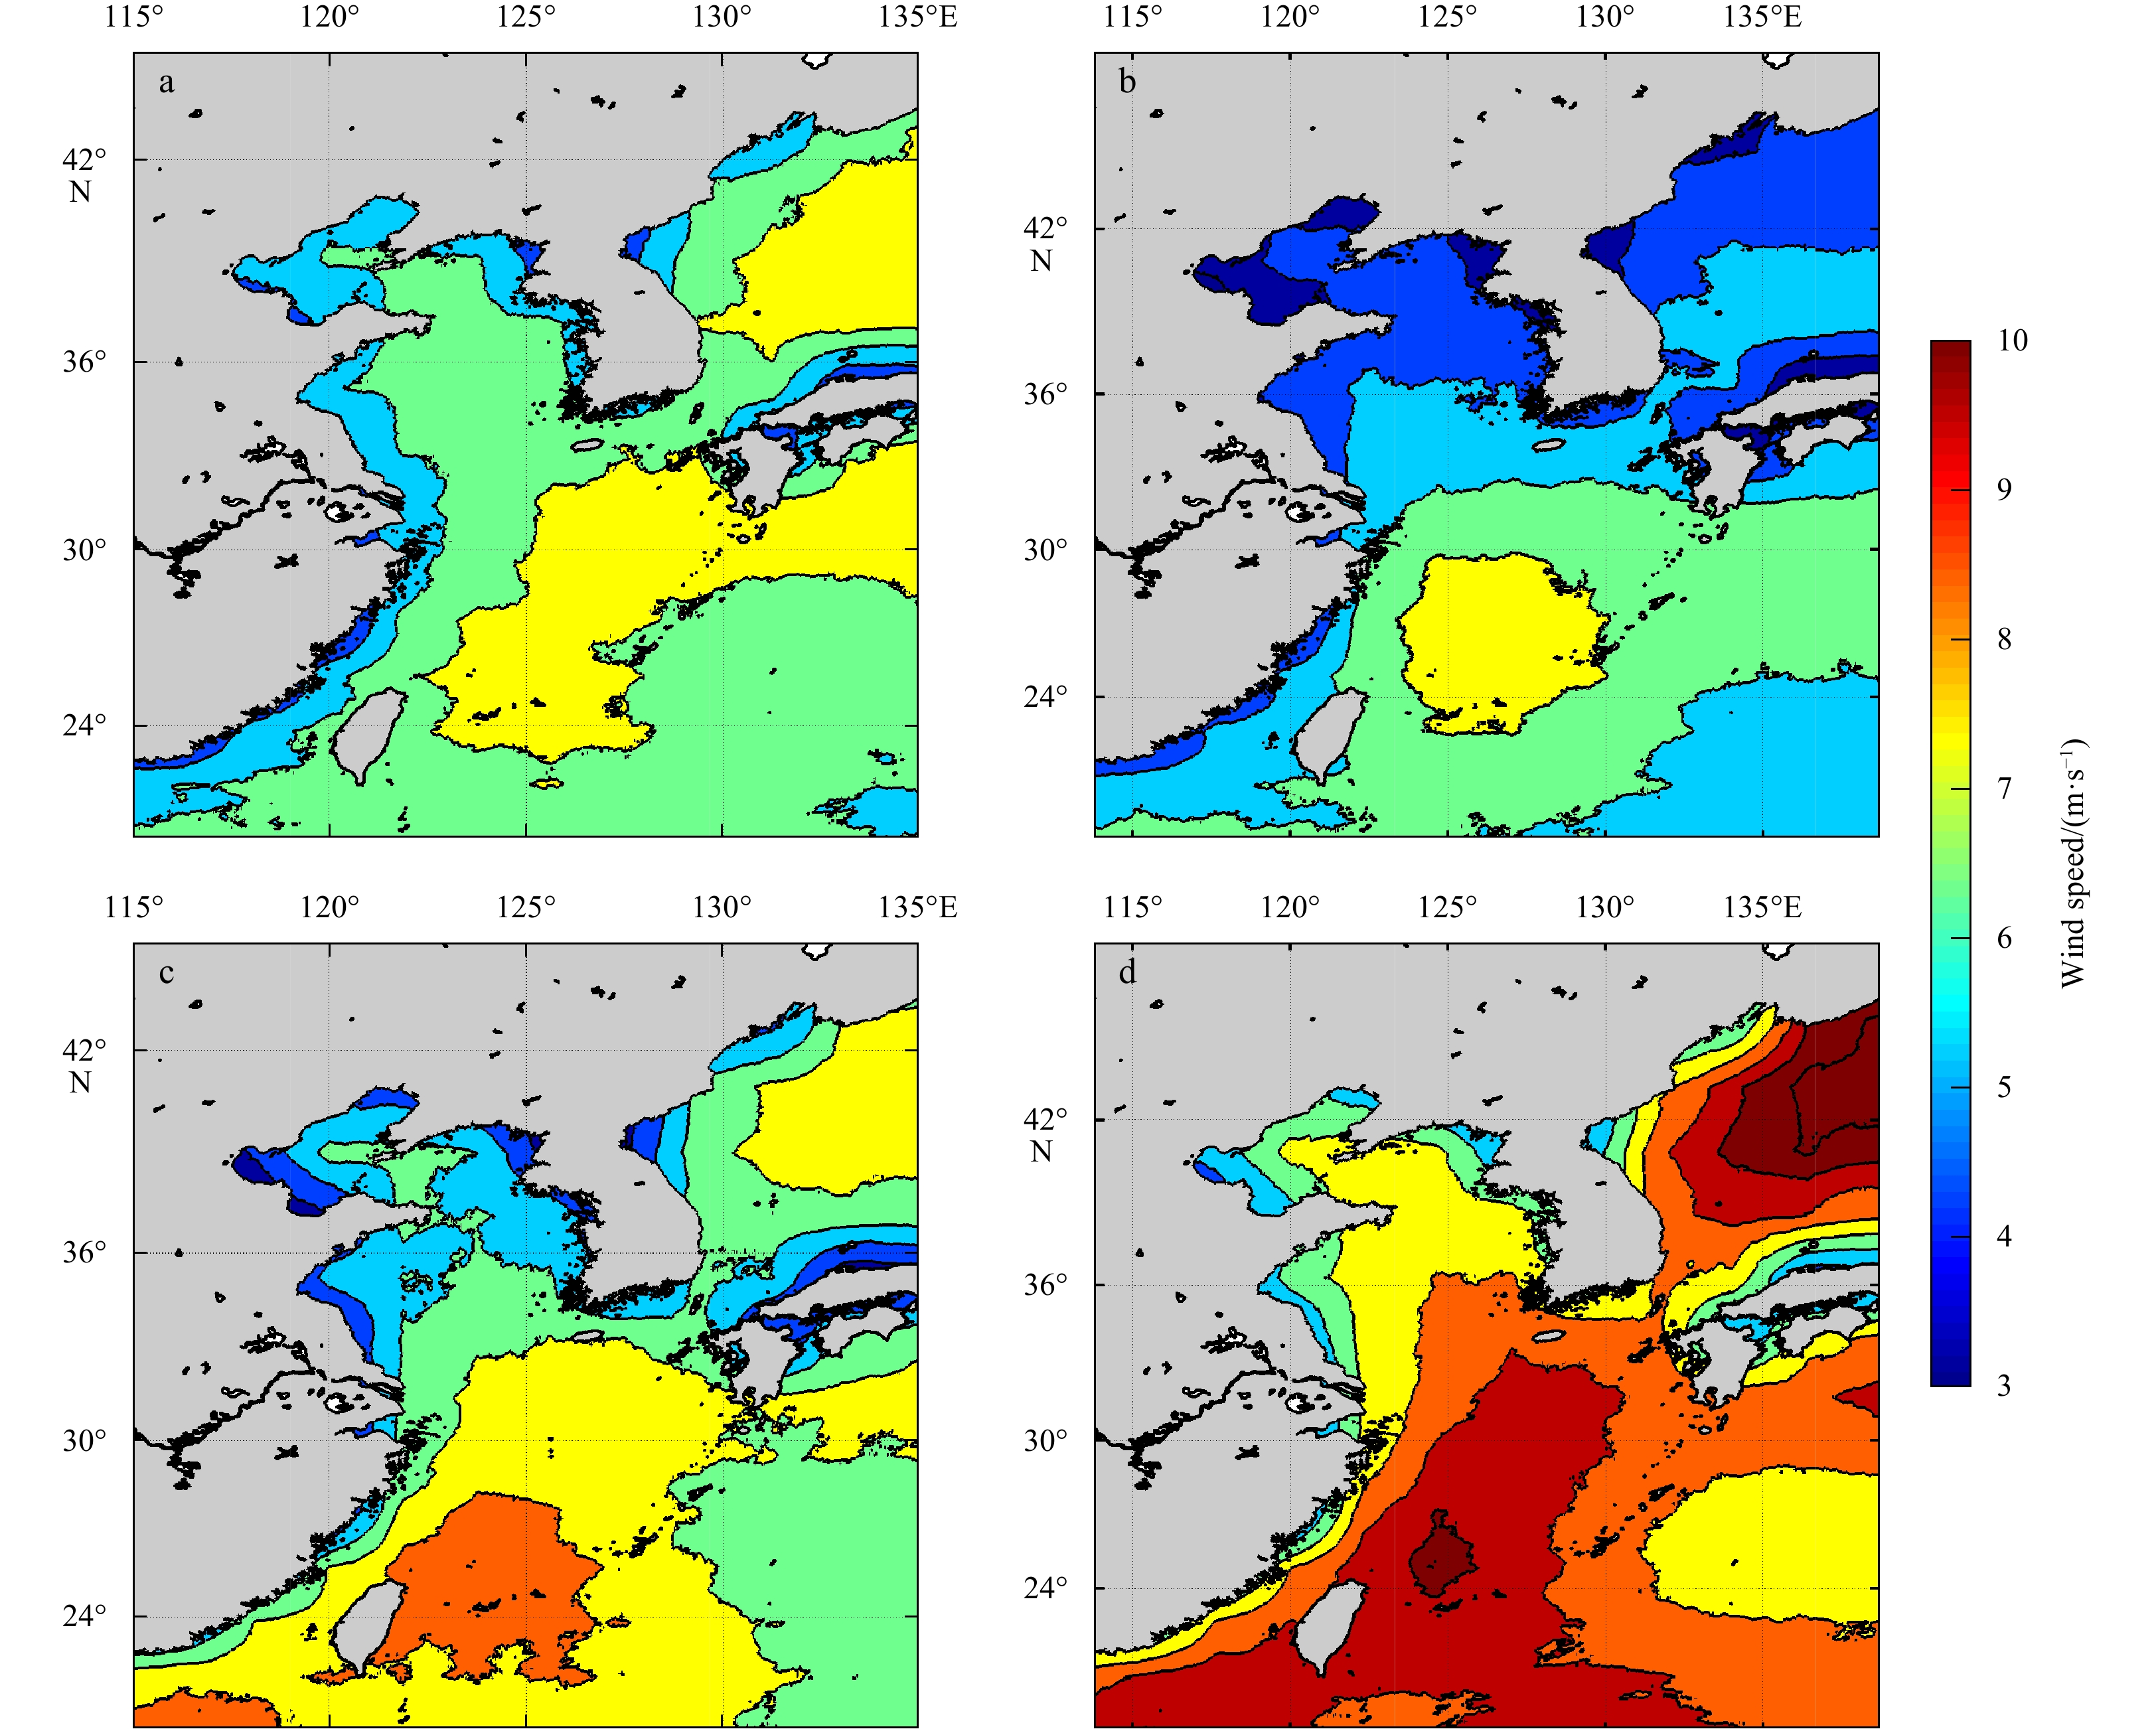
Figure 12. Seasonal average of 10-m wind speeds from 2005 to 2011 for spring (a), summer (b), autumn (c), and winter (d).
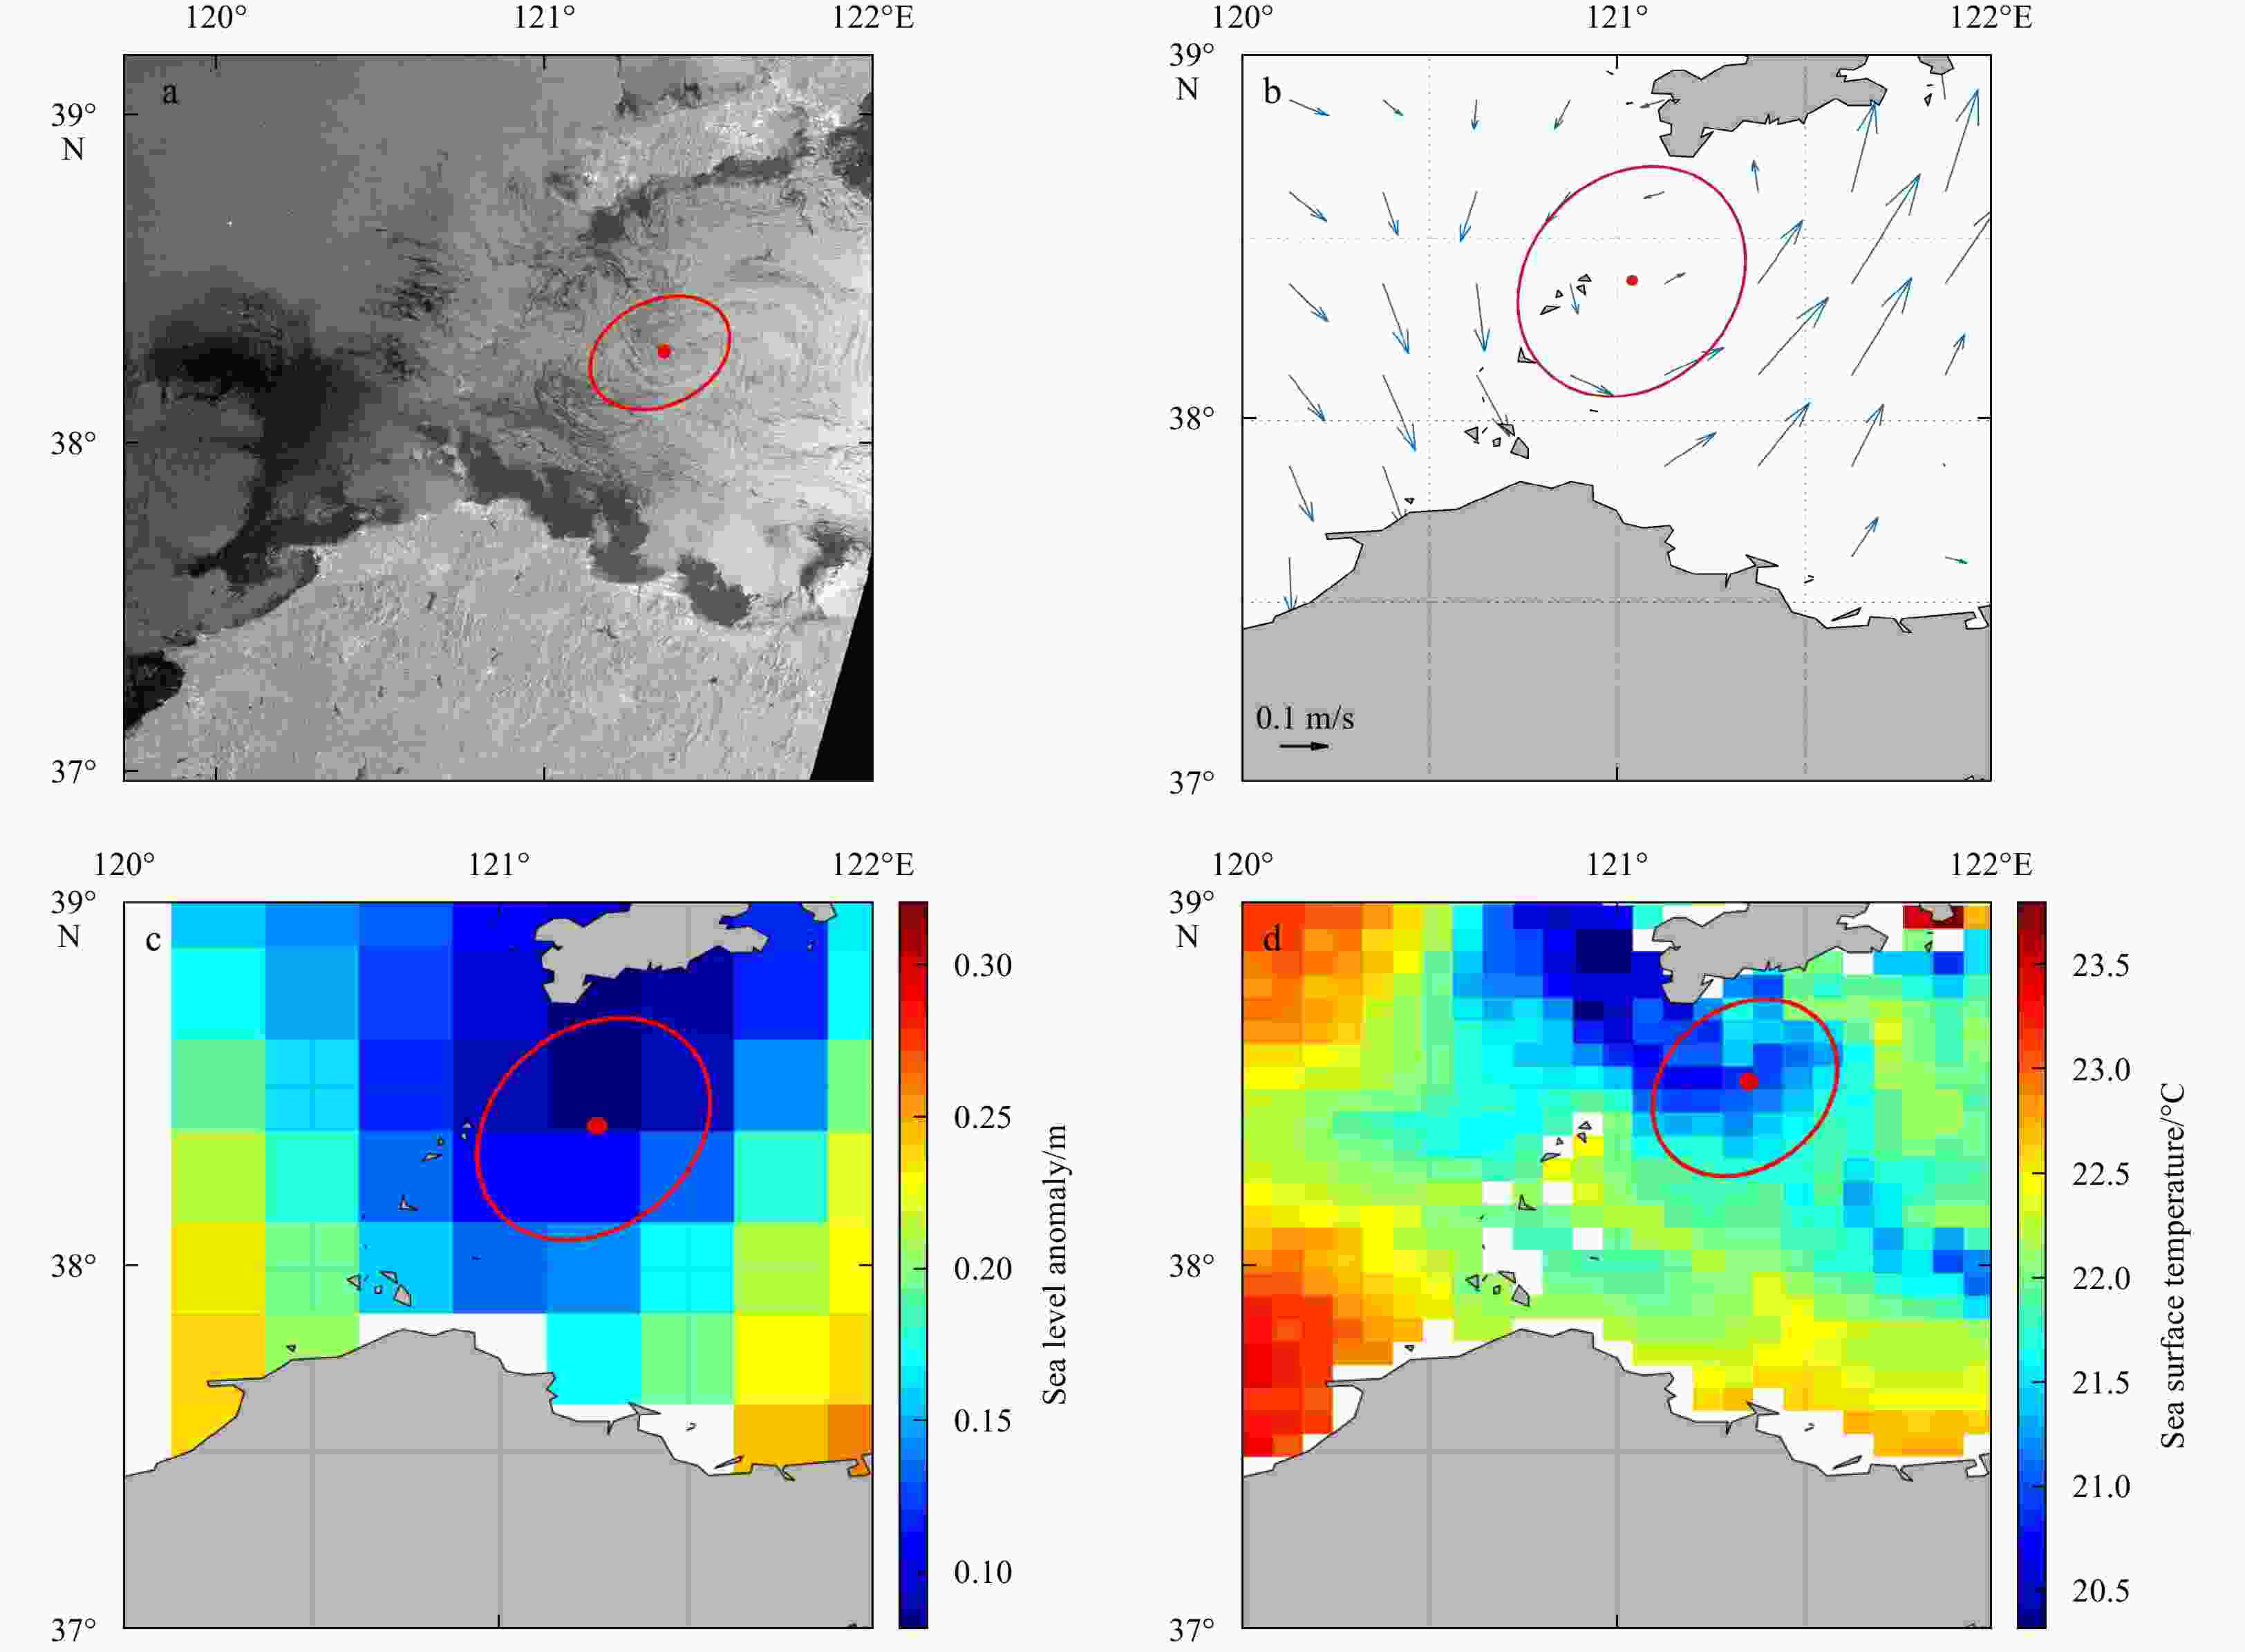
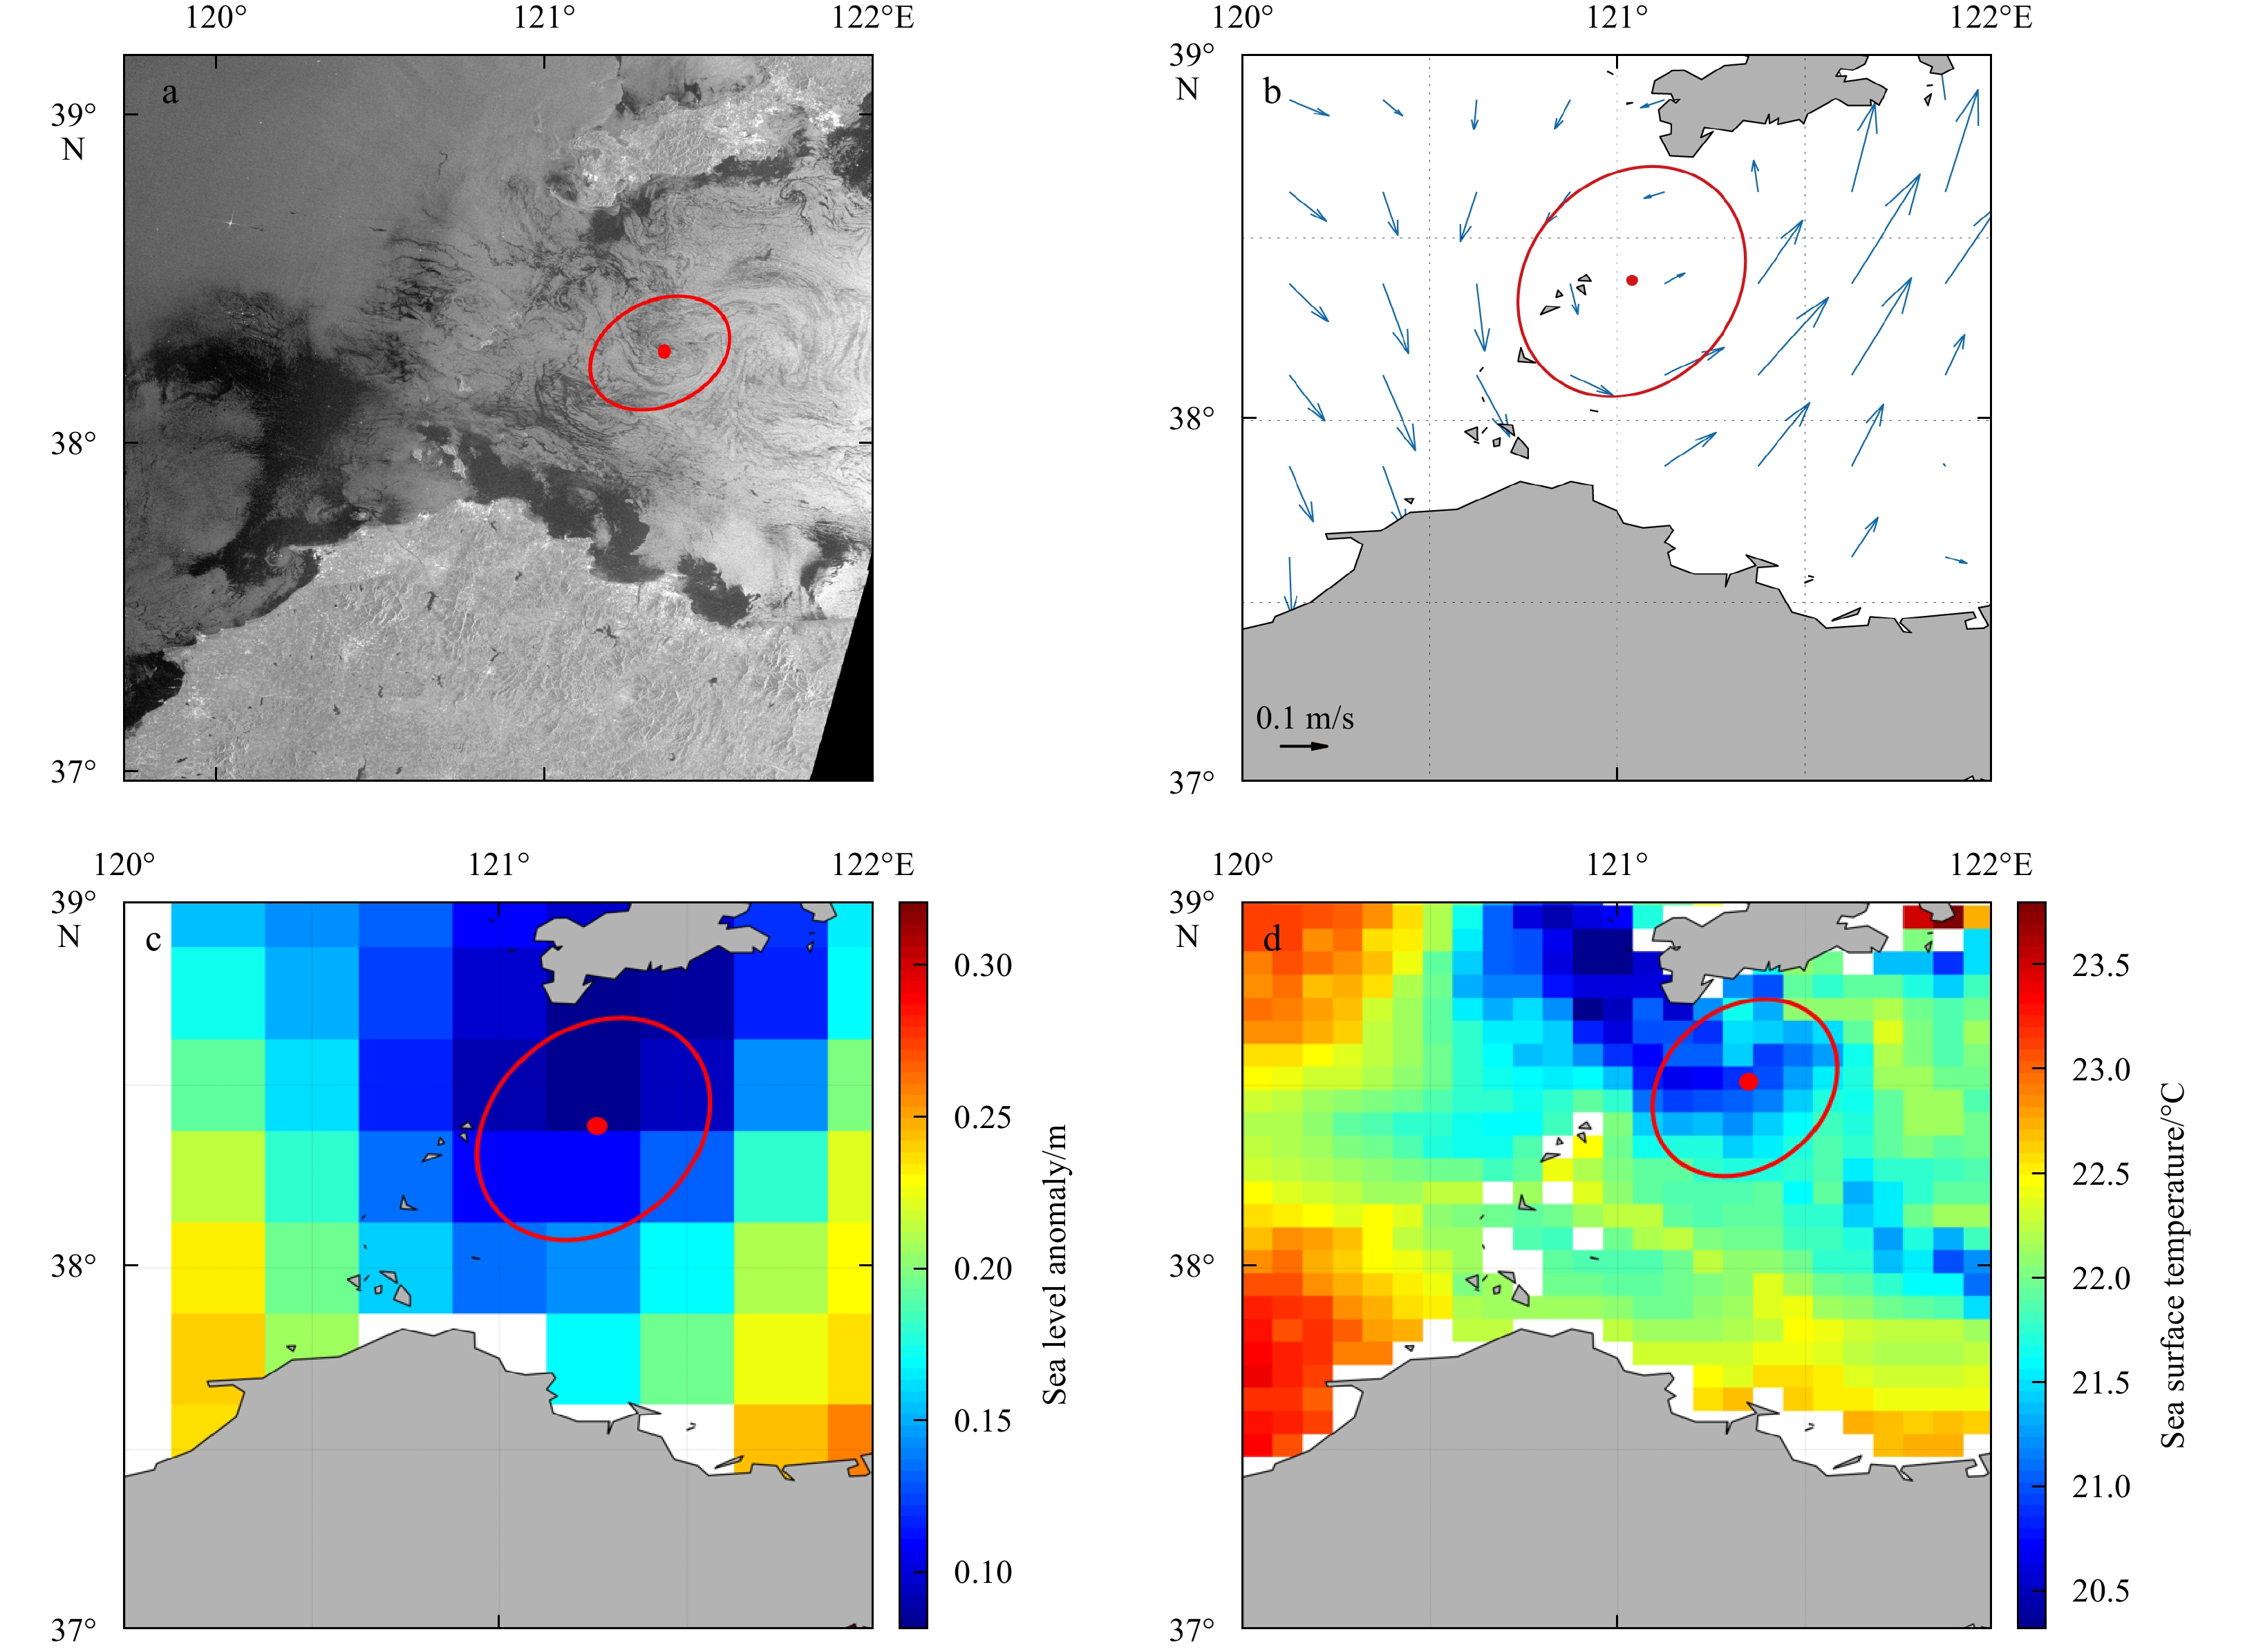
Figure 13. A cyclonic eddy identified by the SAR image (a), geostrophic current field (b), sea level anomaly (c), and sea surface temperature (d) in the Bohai Sea on September 16, 2009.
Table 1. The temporal distribution of the number of SAR images (a total of 104) capturing eddies by season and year
Year Number Spring Summer Autumn Winter Total 2005 3 4 15 1 23 2006 0 3 0 0 3 2007 1 7 4 1 13 2008 5 12 1 8 26 2009 5 4 2 1 12 2010 2 5 2 0 9 2011 5 7 1 5 18 Total 21 42 25 16 104  下载: 导出CSV
-
[1] Chelton D B, Deszoeke R A, Schlax M G, et al. 1998. Geographical variability of the first baroclinic Rossby radius of deformation. Journal of Physical Oceanography, 28(3): 433–460. doi: 10.1175/1520-0485(1998)028<0433:GVOTFB>2.0.CO;2 [2] Chelton D B, Schlax M G, Samelson R M. 2011. Global observations of nonlinear mesoscale eddies. Progress in Oceanography, 91(2): 167–216. doi: 10.1016/j.pocean.2011.01.002 [3] Chelton D B, Schlax M G, Samelson R M, et al. 2007. Global observations of large oceanic eddies. Geophysical Research Letters, 34(15): L15606 [4] DiGiacomo P M, Holt B. 2001. Satellite observations of small coastal ocean eddies in the Southern California Bight. Journal of Geophysical Research: Oceans, 106(C10): 22521–22543. doi: 10.1029/2000JC000728 [5] Dong Changming, McWilliams J C, Shchepetkin A F. 2007. Island wakes in deep water. Journal of Physical Oceanography, 37(4): 962–981. doi: 10.1175/JPO3047.1 [6] Dong Changming, Nencioli F, Liu Yu, et al. 2011. An automated approach to detect oceanic eddies from satellite remotely sensed sea surface temperature data. IEEE Geoscience and Remote Sensing Letters, 8(6): 1055–1059. doi: 10.1109/LGRS.2011.2155029 [7] Du Yanling, Song Wei, He Qi, et al. 2019. Deep learning with multi-scale feature fusion in remote sensing for automatic oceanic eddy detection. Information Fusion, 49: 89–99. doi: 10.1016/j.inffus.2018.09.006 [8] Eldevik T, Dysthe K B. 2002. Spiral eddies. Journal of Physical Oceanography, 32(3): 851–869. doi: 10.1175/1520-0485(2002)032<0851:SE>2.0.CO;2 [9] Espedal H A. 1999. Satellite SAR oil spill detection using wind history information. International Journal of Remote Sensing, 20(1): 49–65. doi: 10.1080/014311699213596 [10] Espedal H A, Johannessen O M, Johannessen J A, et al. 1998. COASTWATCH’95: ERS 1/2 SAR detection of natural film on the ocean surface. Journal of Geophysical Research: Oceans, 103(C11): 24969–24982. doi: 10.1029/98JC01660 [11] Font J, Rousseau S, Shirasago B, et al. 2002. Mesoscale variability in the Alboran Sea: synthetic aperture radar imaging of frontal eddies. Journal of Geophysical Research: Oceans, 107(C6): 3059. doi: 10.1029/2001JC000835 [12] Fu L L, Holt B. 1983. Some examples of detection of oceanic mesoscale eddies by the SEASAT synthetic-aperture radar. Journal of Geophysical Research: Oceans, 88(C3): 1844–1852. doi: 10.1029/JC088iC03p01844 [13] Gade M, Alpers W, Huhnerfuss H, et al. 1998. Imaging of biogenic and anthropogenic ocean surface films by the multifrequency/multipolarization SIR-C/X-SAR. Journal of Geophysical Research: Oceans, 103(C9): 18851–18866. doi: 10.1029/97JC01915 [14] Jia Yinglai, Liu Qinyu. 2004. Eddy shedding from the Kuroshio bend at Luzon strait. Journal of Oceanography, 60(6): 1063–1069. doi: 10.1007/s10872-005-0014-6 [15] Johannessen J A, Johannessen O M, Svendsen E, et al. 1987. Mesoscale eddies in the Fram Strait marginal ice zone during the 1983 and 1984 Marginal Ice Zone Experiments. Journal of Geophysical Research: Oceans, 92(C7): 6754–6772. doi: 10.1029/JC092iC07p06754 [16] Johannessen J A, Roed L P, Wahl T. 1993. Eddies detected in ERS-1 SAR images and simulated in reduced gravity model. International Journal of Remote Sensing, 14(11): 2203–2213. doi: 10.1080/01431169308954029 [17] Johannessen J A, Shuchman R A, Digranes G, et al. 1996. Coastal ocean fronts and eddies imaged with ERS 1 synthetic aperture radar. Journal of Geophysical Research: Oceans, 101(C3): 6651–6667. doi: 10.1029/95JC02962 [18] Karimova S. 2012. Spiral eddies in the Baltic, Black and Caspian seas as seen by satellite radar data. Advances in Space Research, 50(8): 1107–1124. doi: 10.1016/j.asr.2011.10.027 [19] Kim S Y. 2010. Observations of submesoscale eddies using high-frequency radar-derived kinematic and dynamic quantities. Continental Shelf Research, 30(15): 1639–1655. doi: 10.1016/j.csr.2010.06.011 [20] Liu Yu, Dong Changming, Guan Yuping, et al. 2012. Eddy analysis in the subtropical zonal band of the North Pacific Ocean. Deep Sea Research Part I: Oceanographic Research Papers, 68: 54–67. doi: 10.1016/j.dsr.2012.06.001 [21] Liu A K, Peng C Y, Schumacher J D. 1994. Wave-current interaction study in the Gulf of Alaska for detection of eddies by synthetic aperture radar. Journal of Geophysical Research: Oceans, 99(C5): 10075–10085. doi: 10.1029/94JC00422 [22] McWilliams J C. 2016. Submesoscale currents in the ocean. Proceedings of the Royal Society A: Mathematical, Physical and Engineering Sciences, 472(2189): 20160117. doi: 10.1098/rspa.2016.0117 [23] Munk W, Armi L, Fischer K, et al. 2000. Spirals on the sea. Proceedings of the Royal Society A: Mathematical, Physical and Engineering Sciences, 456(1997): 1217–1280. doi: 10.1098/rspa.2000.0560 [24] Nilsson C S, Tildesley P C. 1995. Imaging of oceanic features by ERS 1 synthetic aperture radar. Journal of Geophysical Research: Oceans, 100(C1): 953–967. doi: 10.1029/94JC02556 [25] Wang Guihua, Su Jilan, Chu P C. 2003. Mesoscale eddies in the South China Sea observed with altimeter data. Geophysical Research Letters, 30(21): 2121. doi: 10.1029/2003GL018532 [26] Xu Guangjun, Yang Jingsong, Dong Changming, et al. 2015. Statistical study of submesoscale eddies identified from synthetic aperture radar images in the Luzon Strait and adjacent seas. International Journal of Remote Sensing, 36(18): 4621–4631. doi: 10.1080/01431161.2015.1084431 [27] Yuan Dongliang, Han Weiqing, Hu Dunxin. 2006. Surface Kuroshio path in the Luzon Strait area derived from satellite remote sensing data. Journal of Geophysical Research: Oceans, 111(C11): C11007. doi: 10.1029/2005JC003412 [28] Yuan Dongliang, Han Weiqing, Hu Dunxin. 2007. Anti-cyclonic eddies northwest of Luzon in summer-fall observed by satellite altimeters. Geophysical Research Letters, 34(13): L13610 [29] Zheng Quanan. 2017. Satellite SAR Detection of Sub-mesoscale Ocean Dynamic Processes. New Jersey London: World Scientific, 27-54 [30] Zheng Quanan, Lin Hui, Meng Junmin, et al. 2008. Sub-mesoscale ocean vortex trains in the Luzon Strait. Journal of Geophysical Research: Oceans, 113(C4): C04032 [31] Zheng Zhewen, Zheng Quanan. 2014. Variability of island-induced ocean vortex trains, in the Kuroshio region southeast of Taiwan Island. Continental Shelf Research, 81: 1–6. doi: 10.1016/j.csr.2014.02.010 -


 点击查看大图

计量
- 文章访问数: 892
- HTML全文浏览量: 336
- PDF下载量: 56
- 被引次数: 0

