

Analysis of the inter-annual variability and southward expansion of red tides in the Zhejiang coastal waters from 1981 to 2018
-
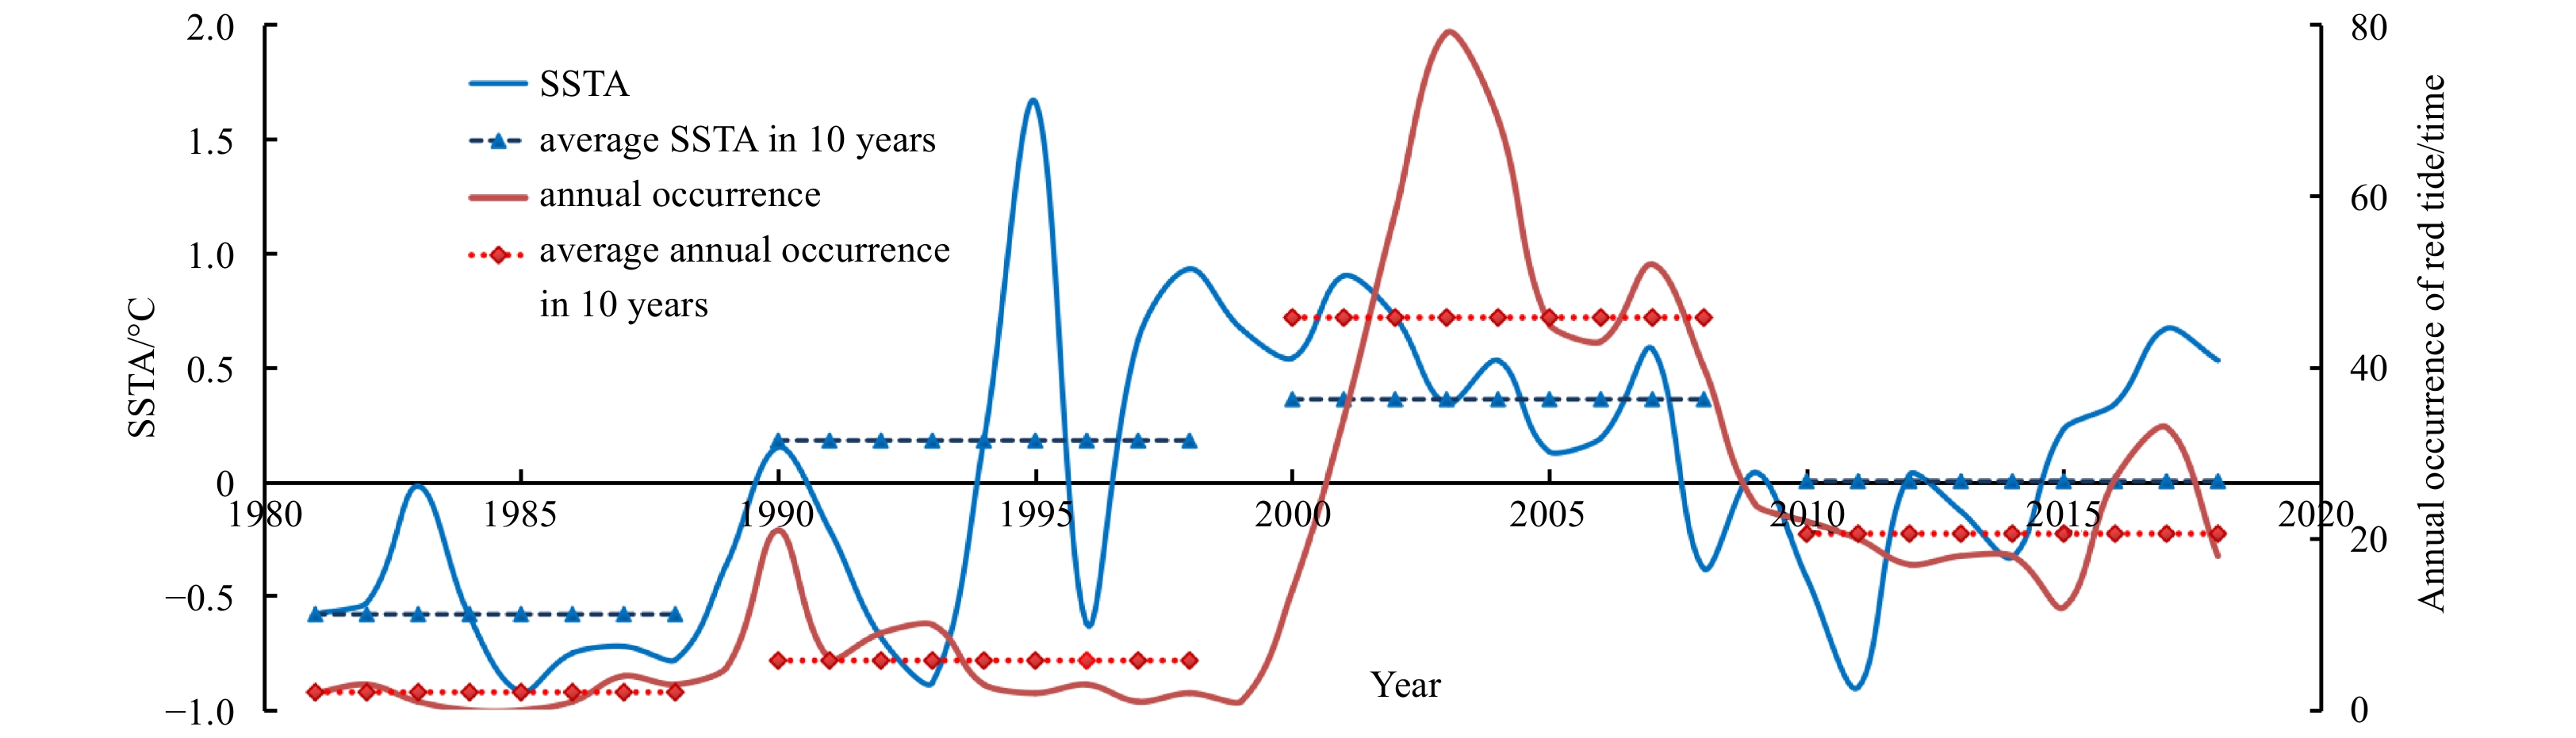
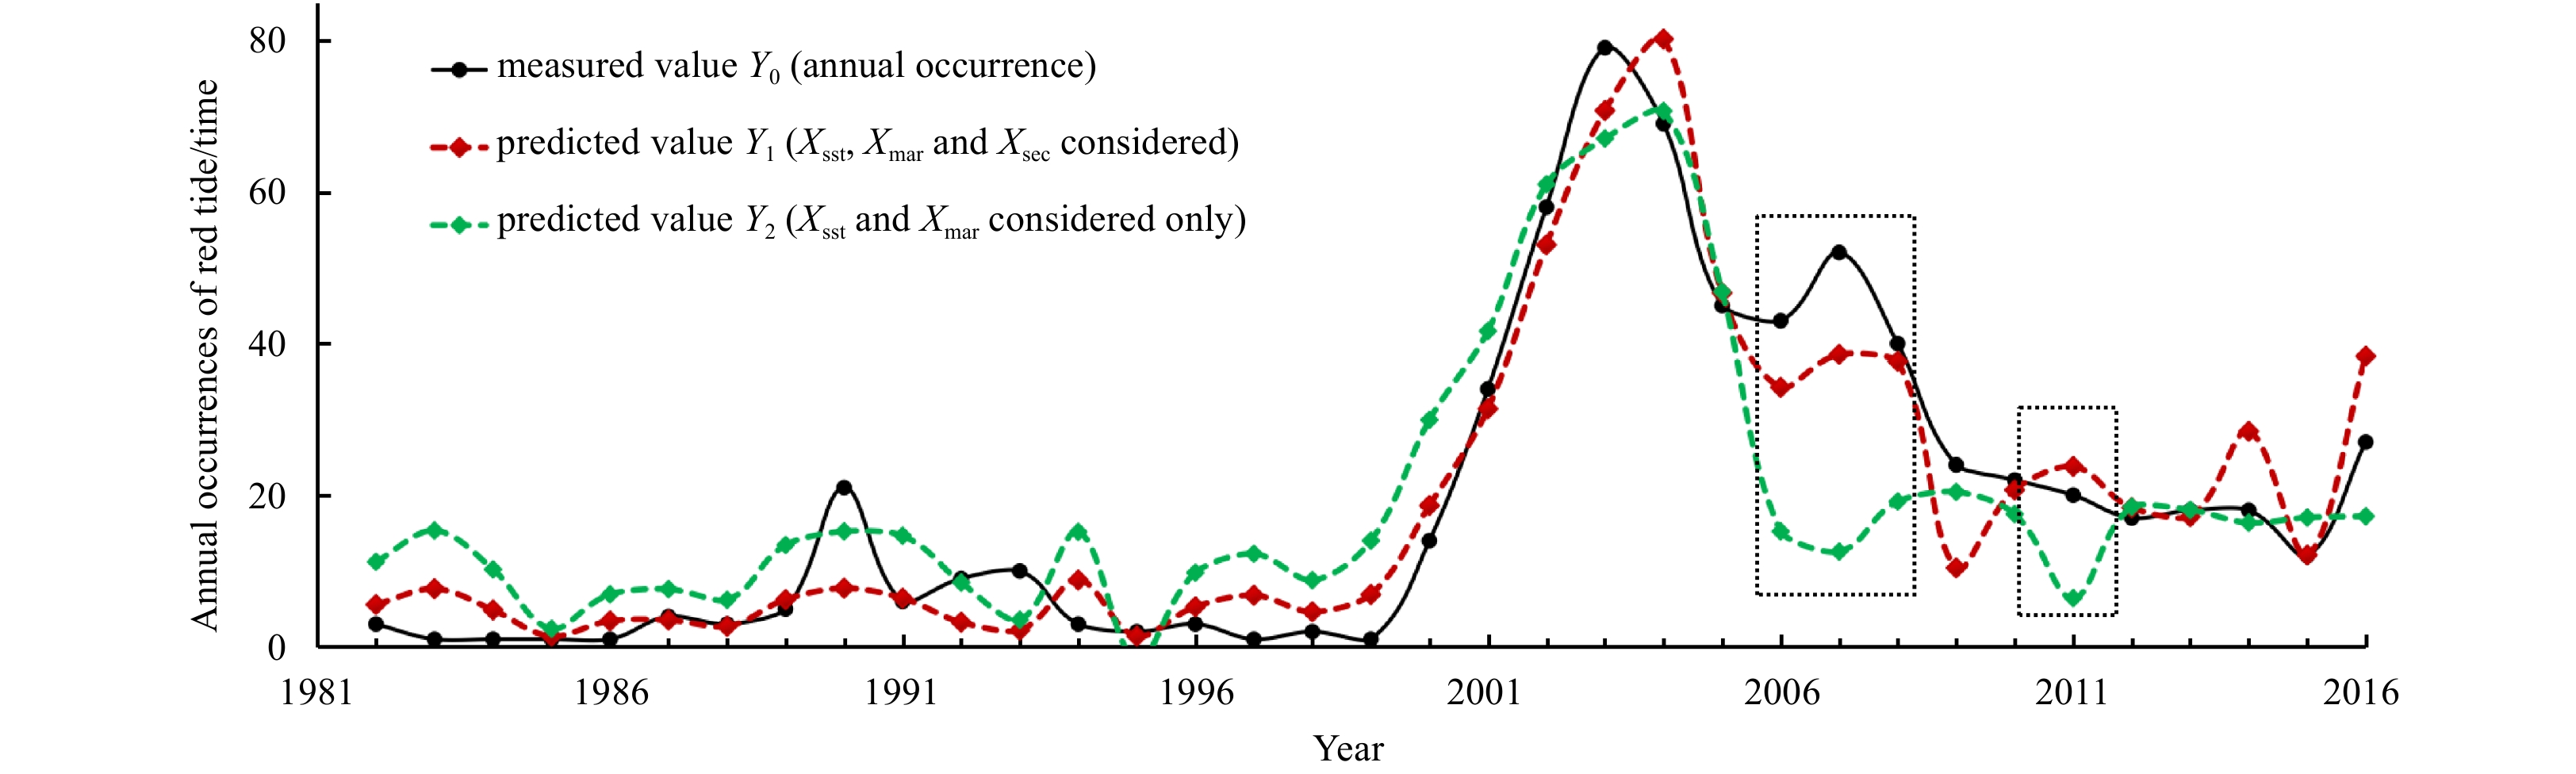
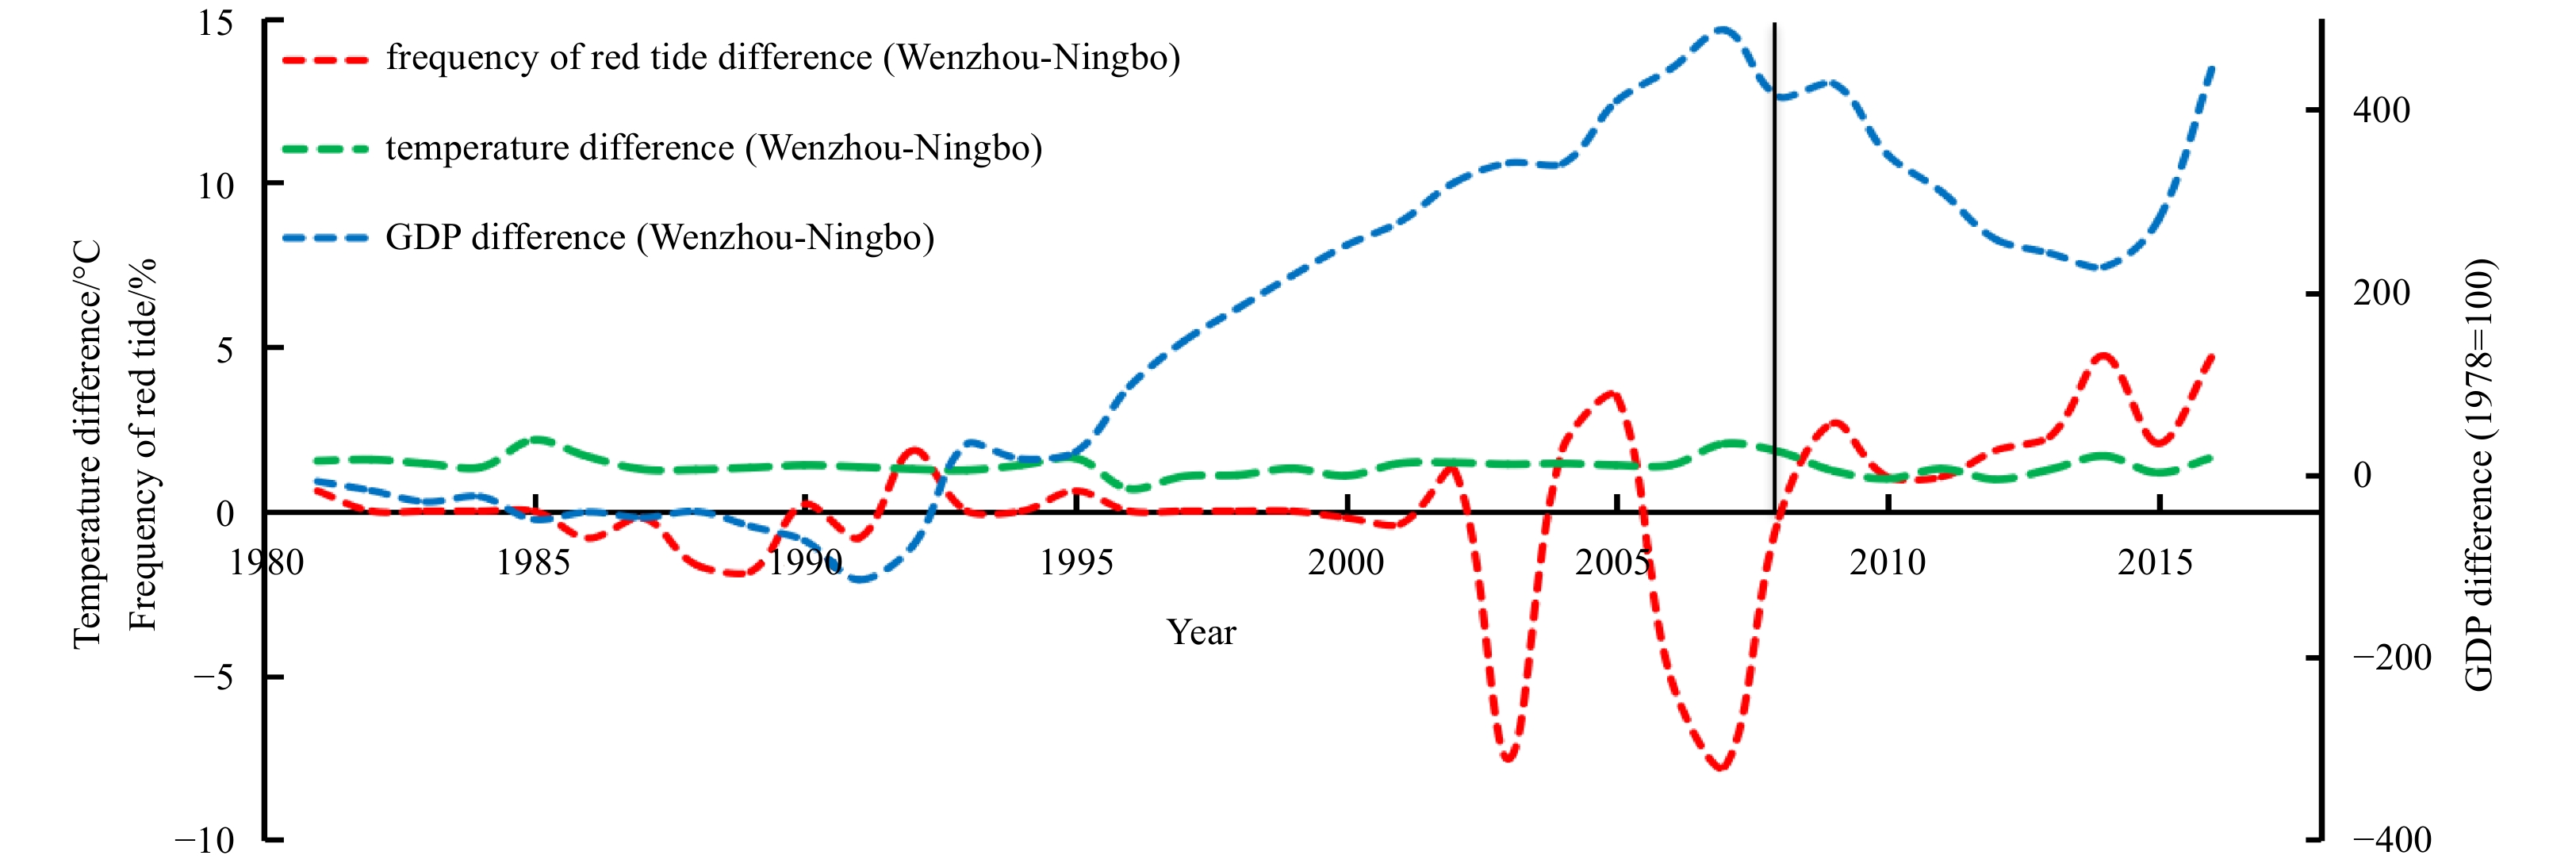
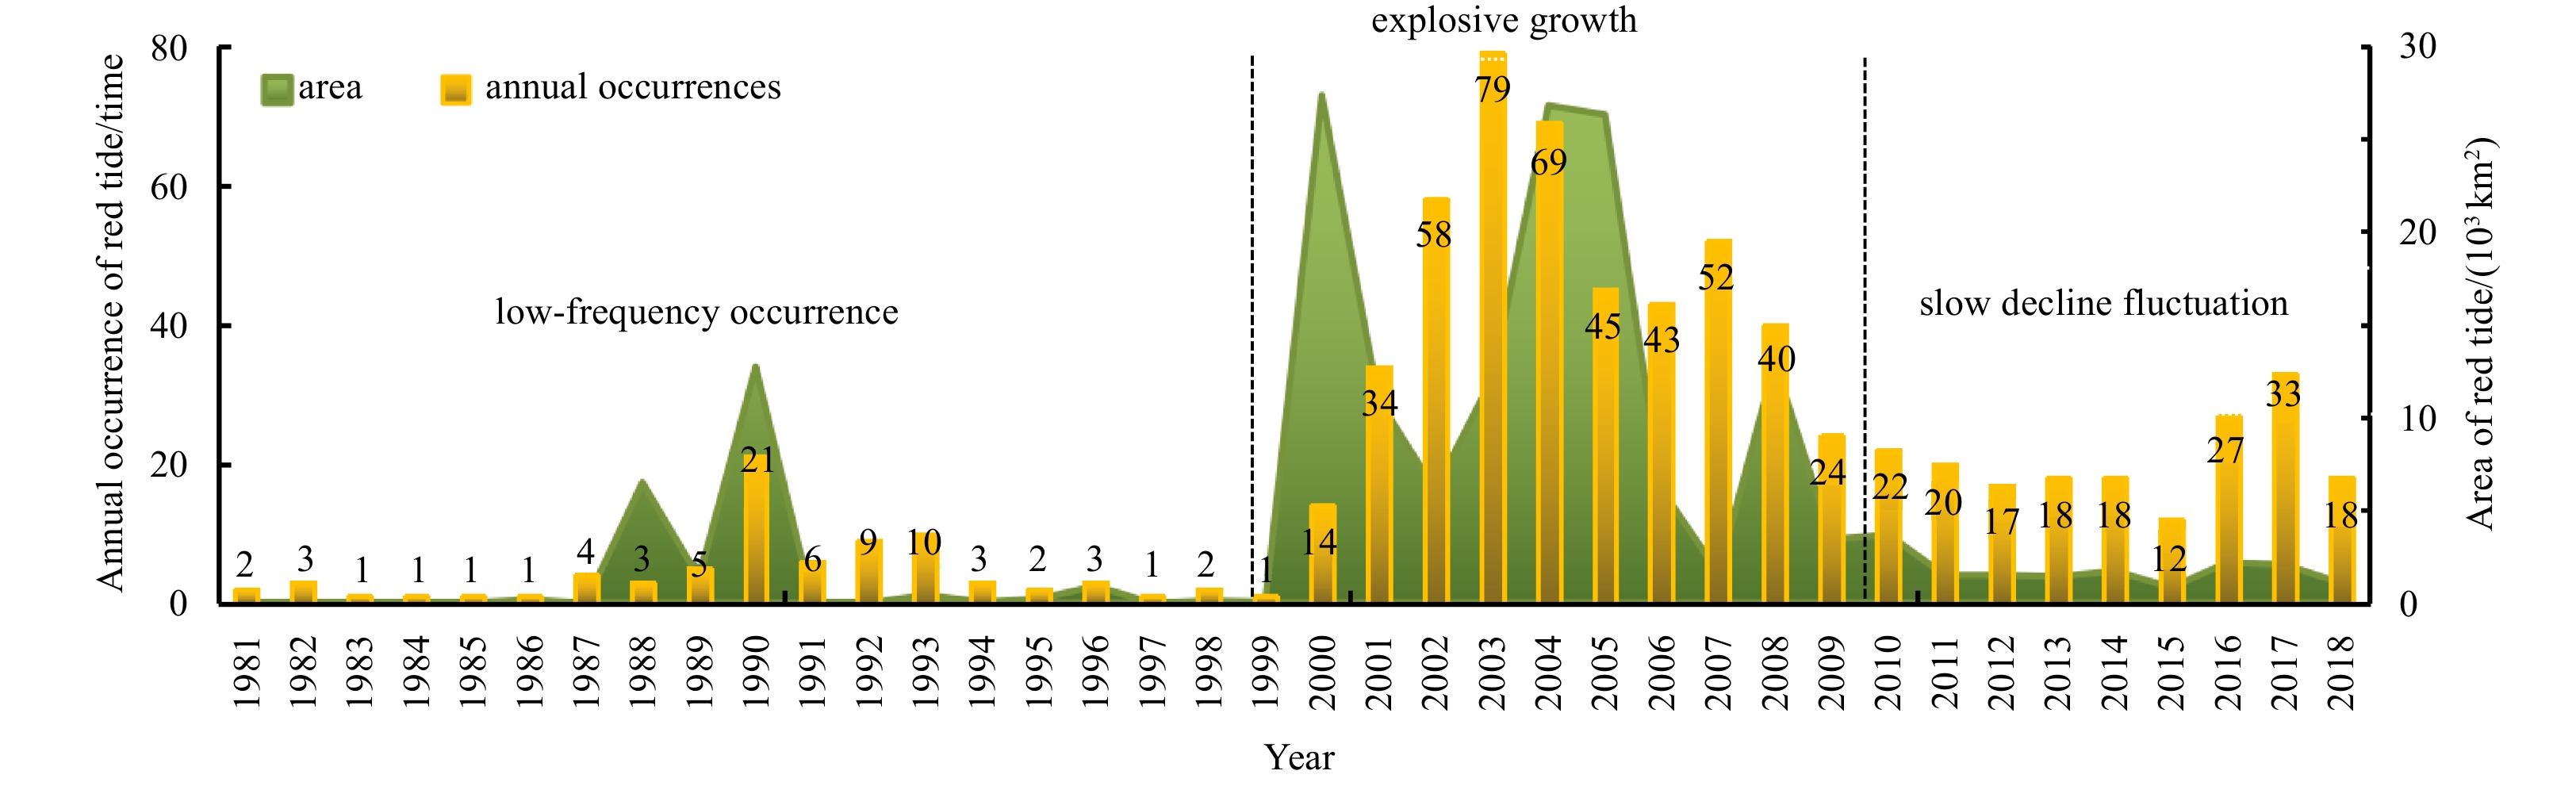
Abstract: A time series dataset spanning 39 years (1981−2018) on red tide events in Zhejiang coastal waters was used to study the characteristics of inter-annual spatial and temporal variations. A distinct inter-annual pattern characterized by low frequency, explosive growth and fluctuating decline stages was found over the studied time scale. Most red tide events occurred in parallel to the bathymetric contour, and 95.4% were located to the west of the 50 m isobath. Additionally, the high-incidence area of red tides is expanding southward. In this paper, local sea surface temperature (SST), mariculture area and secondary industry growth rate are introduced and identified as the main factors influencing the nutrient and hydrometeorological conditions. A multivariate nonlinear regression equation based on these factors was constructed, and the goodness of fit coefficient was 0.907. The causes of the annual variation and high-frequency area in the southward expansion were quantitatively analyzed based on the proposed regression model. Finally, the results indicated that 68.7% of the annual occurrence variation of red tide was due to the SST and mariculture area, which are the main impact factors; however, secondary industry growth could compensate for the nutrient deficiency caused by the sharp mariculture area reduction and decreased SST. The background nutrient level, which is elevated by coastal economic development, especially secondary industry, is the main determinant of the southward expansion. Although the trend of the southward expansion of high-frequency areas has not changed, the red tide frequency in coastal cities has decreased by half and remained at a stable level after 2010 due to substantial economic restructuring and environmental protection.
-
Key words:
- Zhejiang Province /
- red tide /
- peak drop /
- inter-annual variation /
- southward expansion
-
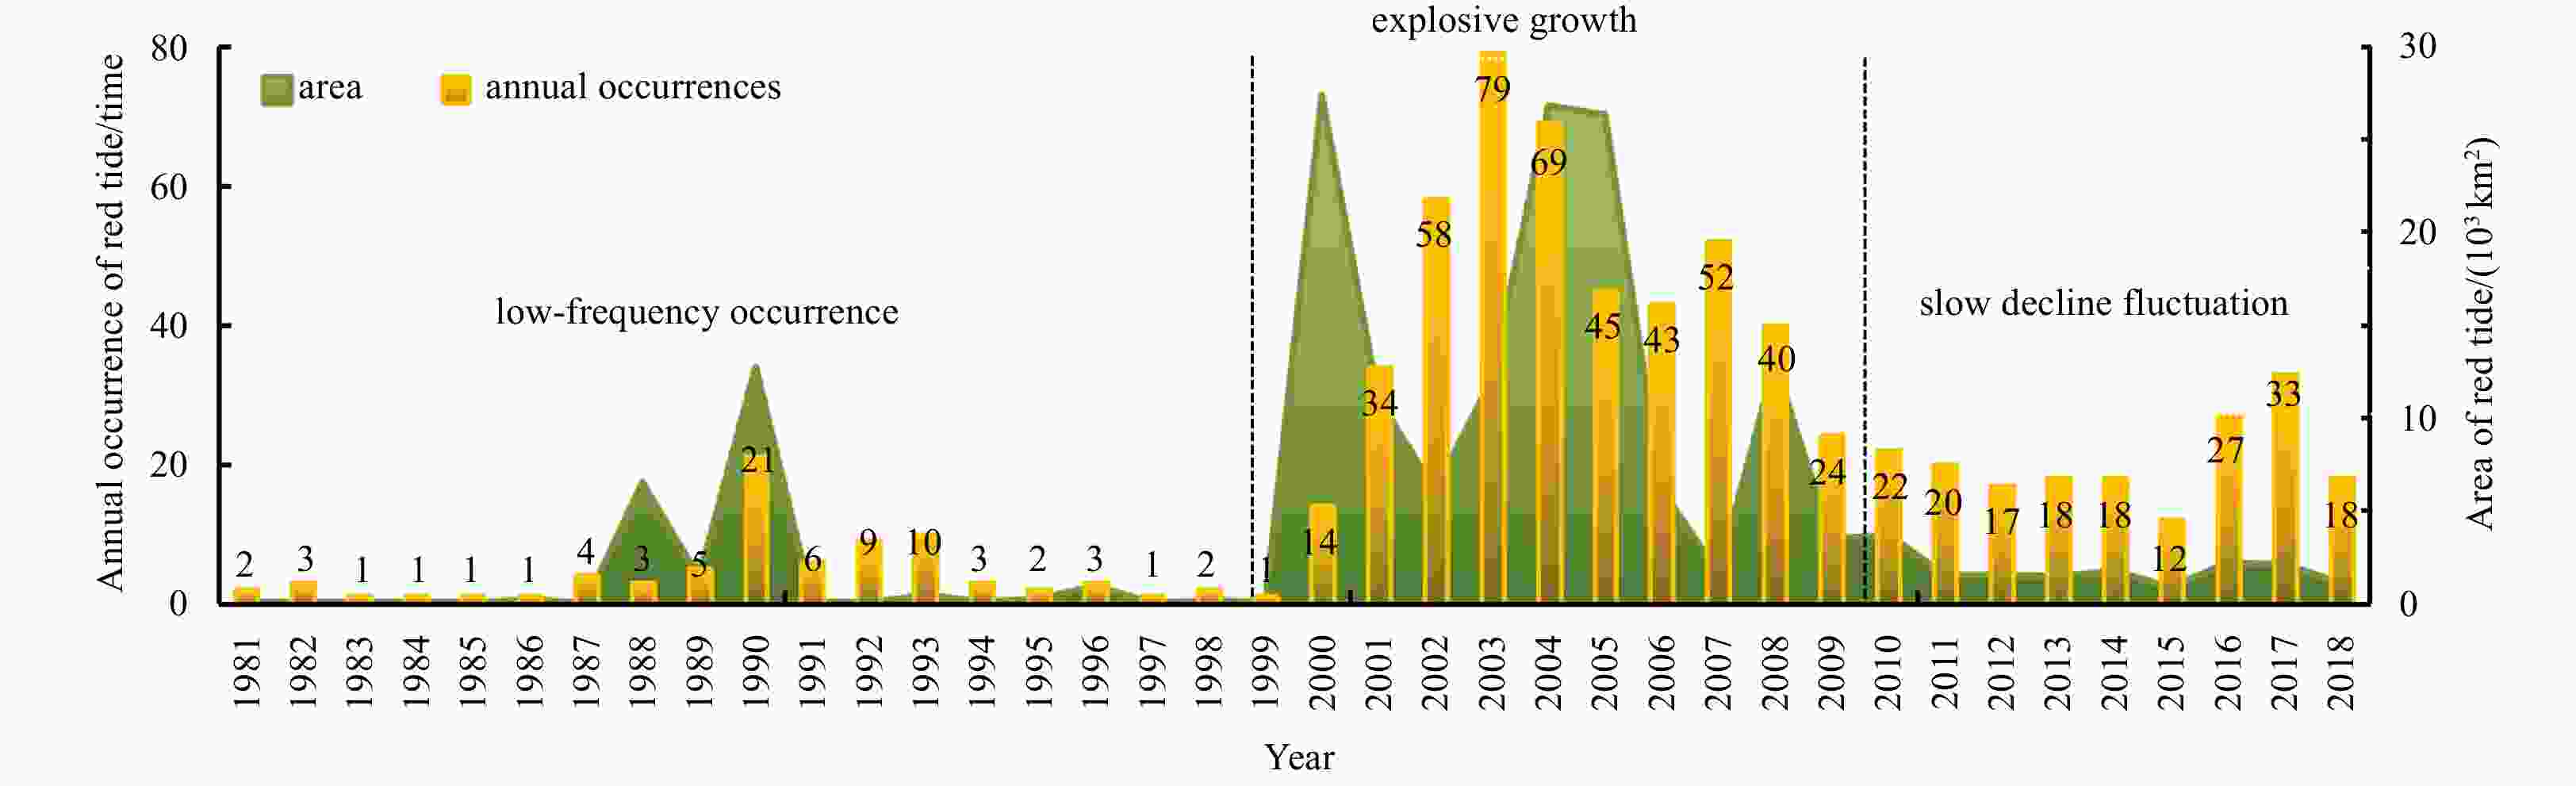
Figure 1. Annual number and area of red tide events in the Zhejiang coastal waters from 1981 to 2018.
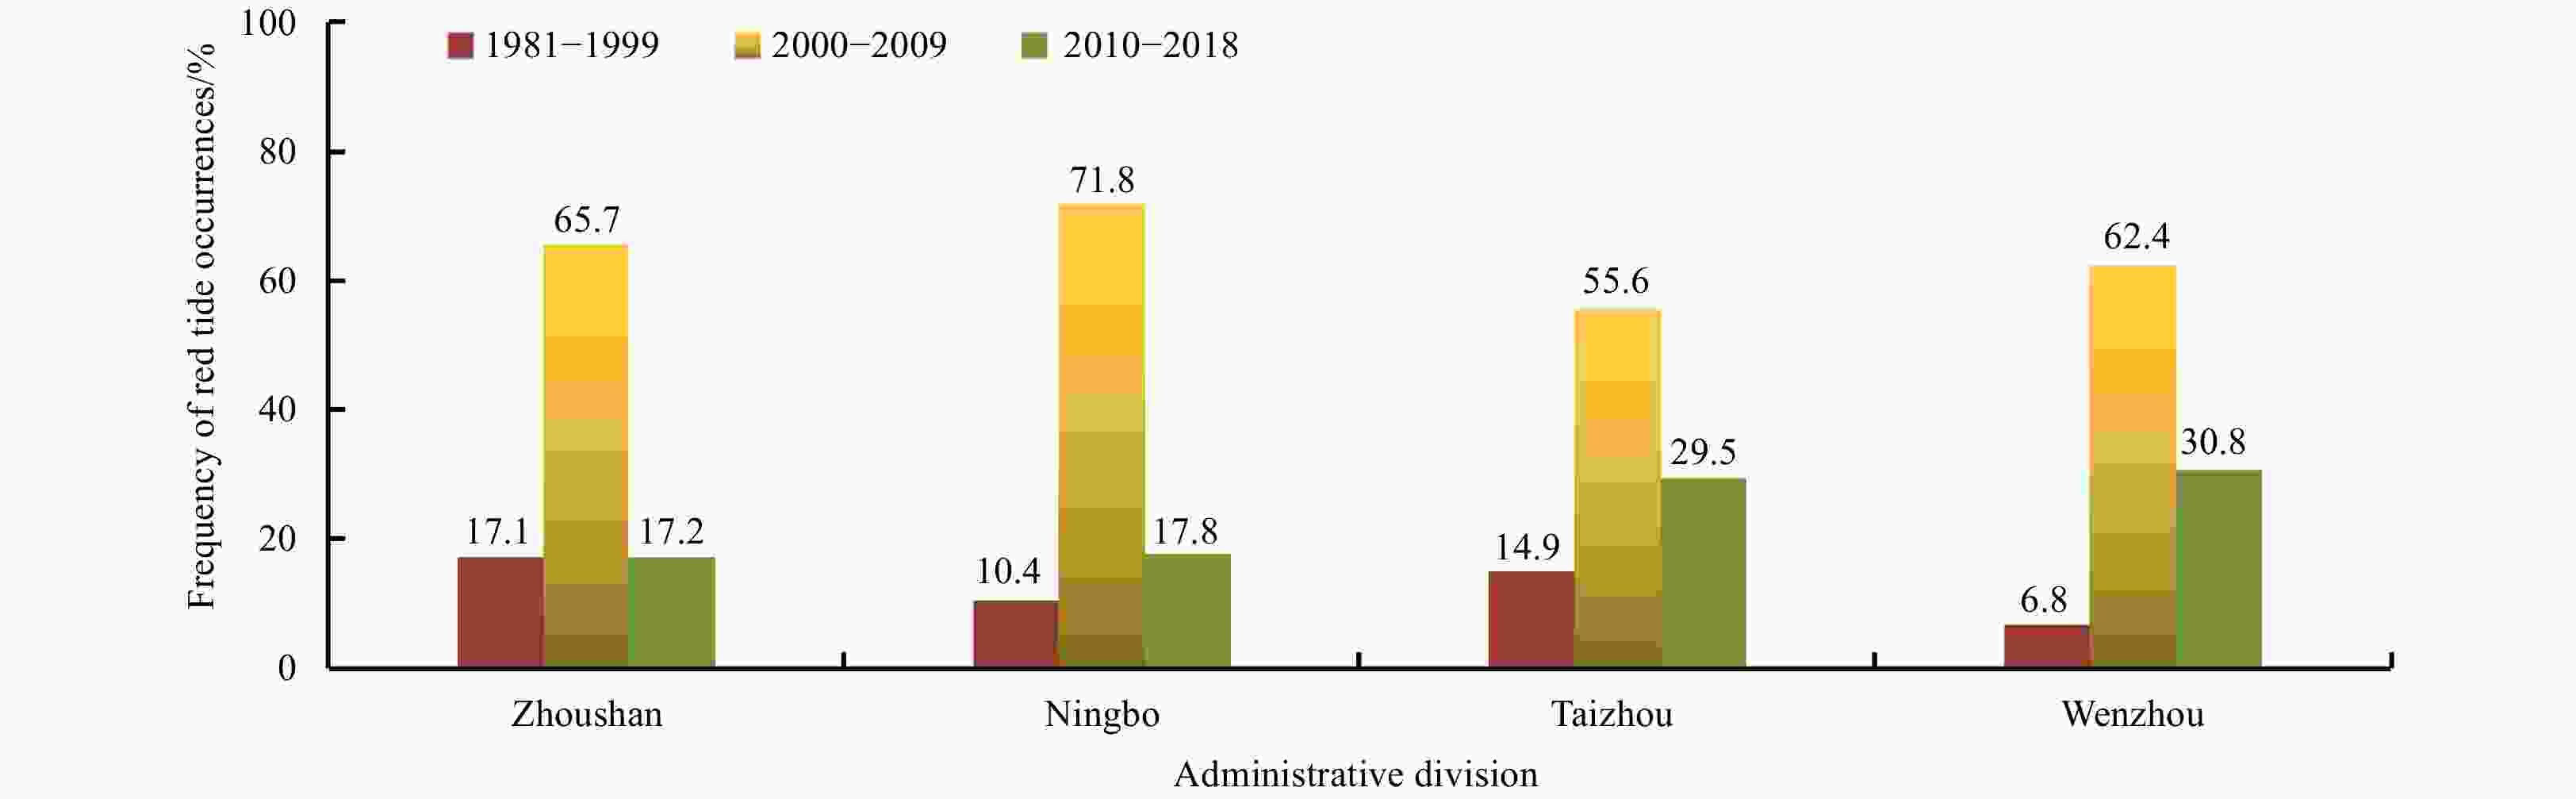
Figure 3. Red tide occurrence frequency in each decade in coastal cities of Zhejiang Province.
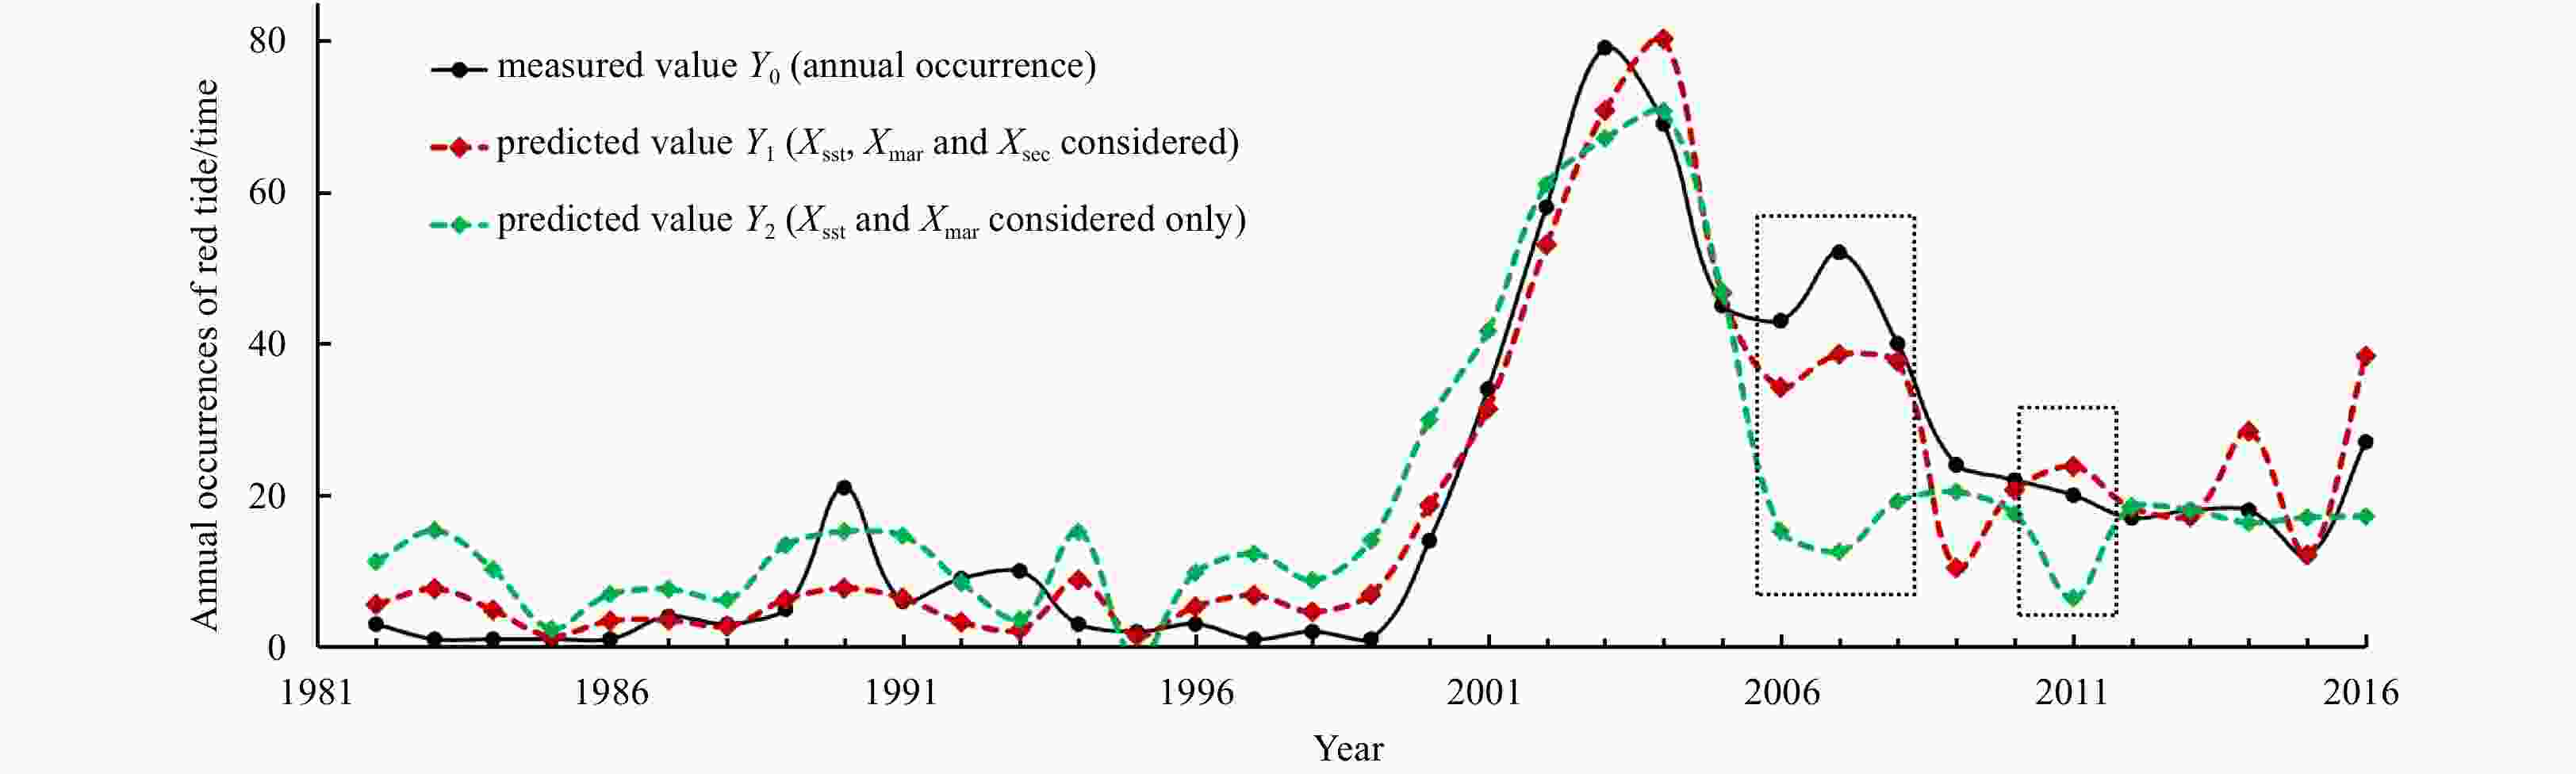
Figure 5. Comparison of simulated and actual values of the nonlinear regression equation.
Table 1. List of the main impact factors that are closely related to the long-term change of red tide
Data category Data record elements Data cycle Domain or station Specifications or technical standards Notes on information Red tide events time, location, maximum area, dominant species 1981–2015 Zhejiang coastal waters technical specifications for red tide monitoring(HY/T069–2005) dataset from 1981 to 2006 is reorganized by the Zhejiang Ocean Monitoring and Forecasting Center, and dataset from 2007 to 2015 is provided by the Zhejiang Ocean Monitoring and Forecasting Center 2016–2018 monitoring data of 2016–2018 is provided by East China Sea Monitoring Center Marine hydrometeorology SST 1981–2018 Shengshan and Nanji stations specification for coastal observation (GBT 14914–2006) Daily operational observation data from 1981 to 2018 provided by the East China Sea Forecast Center SSTA sea surface temperature anomaly SSTA10a average SSTA in 10 years ENSO index Niño3.4 area monthly mean SSTA in Niño3.4 area National Oceanic and Atmospheric Administration (https://www.cpc.noaa.gov) Marine water environment proportion of class IV to classes less than IV 2000–2018 Zhejiang coastal waters sea water quality standard (GB 3097–1997) Zhejiang Marine Environmental Bulletin issued by the Department of Ecology and Environment of Zhejiang Province (http://sthjt.zj.gov.cn.) Indicators of socio-economic development gross domestic product (GDP) 1981–2018 Zhejiang Province added-value index of primary, secondary and tertiary industries Statistical Yearbook of China issued by the State Statistical Bureau (http://data.stats.gov.cn.) Ningbo City Table 3–2 GDP development
index over the years2019 Ningbo Statistical Yearbook issued by the Ningbo Municipal Statistics Bureau (http://vod.ningbo.gov.cn/) Wenzhou City Table 1–10 GDP development
index over the years2019 Wenzhou Statistical Yearbook issued by the Wenzhou Municipal statistics bureau (http://wztjj.wenzhou.gov.cn.) maricultural area 1981–2016 Zhejiang Province total maricultural area for agriculture Statistical Yearbook of China issued by the State Statistical Bureau (http://data.stats.gov.cn)  下载: 导出CSV
Table 2. Nonparametric test statistics of the normal distributions of red tide occurrence and factors
Factor Shapiro-Wilk Skewness Kurtosis Statistics Freedom Significance Statistics Statistics YAORT 0.835 38 0 1.34 1.215 XSST 0.957 38 0.147* 0.365 –0.344 XNiño3.4 0.985 38 0.881* 0.257 –0.339 Xmar 0.923 36 0.015* 0.3 –1.416 Xwq 0.96 19 0.572* 0.577 –0.264 Xpri 0.886 38 0.001 0.674 –0.838 Xsec 0.814 38 0 0.924 –0.633 Xter 0.763 38 0 1.44 1.051 Note: * When the significance is >0.05, the factor exhibits normal or partially normal distributions.
下载: 导出CSV
Table 3. Rank correlation coefficient of red tide occurrence and factors
Variable YAORT SST Nourishment Water quality XSST XNiño3.4 Xmar Xpri Xsec Xter Xwq Code 7 1 8 2 3 4 5 6 YAORT correlation coefficient 1 0.326* 0.107 0.743** 0.394* 0.696** 0.461* 0.22 Sig (two-sided) − 0.046 0.524 0 0.016 0 0 0.366 N 38 38 38 36 37 37 37 19 Note: * When the confidence coefficient (two-sided test) is 0.05, the correlation is significant; ** when the confidence coefficient (two-sided test) is 0.01, the correlation is significant; − represents no data.
下载: 导出CSV
Table 4. ANOVA of the multivariate nonlinear regression equation
Source Sum of squares Degrees of freedom Mean square Regression 26 504.633 9 2 944.959 Residual 1 410.367 26 54.245 Total before correction 27 915 35 Total after correction 15 127.543 34 Note: R2=1–(residual sum of squares)/(corrected sum of squares) = 0.907.
下载: 导出CSV
-
[1] Cao Xinzhong. 1986. Prelimary study on the seasonal process of the coastal upwelling off Zhejiang in the east Sea, China. Journal of Fisheries of China (in Chinese), 10(1): 52–68 [2] Chen Yanlong, Yang Jianhong, Zhao Dongzhi, et al. 2013. Quantitative study on effect of seawater temperature on specific growth rate of algal species. Marine Environmental Science (in Chinese), 32(1): 104–110 [3] Cloern J E, Jassby A D, Thompson J K, et al. 2007. A cold phase of the East Pacific triggers new phytoplankton blooms in San Francisco Bay. Proceedings of the National Academy of Sciences of the United States of America, 104(47): 18561–18565. doi: 10.1073/pnas.0706151104 [4] Deng Bangping, Zhang Haofei, He Yanlong, et al. 2017. Analysis on the relationship between the red tide events and El Niño in the East China Sea from 1981 to 2011. Ecological Science (in Chinese), 36(6): 161–164 [5] Feng Jianfeng, Wang Hongli, Li Shengpeng. 2007. Research on prediction of phytoplankton’s density using support vector machines. Marine Environmental Science (in Chinese), 26(5): 438–441 [6] Fu Mingzhu, Wang Zongling, Pu Xinming, et al. 2012. Changes of nutrient concentrations and N: P: Si ratios and their possible impacts on the Huanghai Sea ecosystem. Acta Oceanologica Sinica, 31(4): 1001–112 [7] Guo Hao, Ding Dewen, Lin Feng’ao, et al. 2015. Characteristics and patterns of red tide in china coastal waters during the last 20a. Advances in Marine Science (in Chinese), 33(4): 547–558 [8] Gao Junzhang, Liu Yalin, Lin Yi, et al. 2017. Analysis on characteristics of red tide disaster in Wenzhou coastal waters during the last 10 years. Transactions of Oceanology and Limnology (in Chinese), (4): 86–90 [9] He Chunliang, Yang Hong. 2009. Space-time distribution of red tide events in China and its relationship with the El Niño. Journal of Shanghai Ocean University (in Chinese), 18(2): 206–211 [10] Jing Zhiyou, Qi Yiquan, Hua Zulin. 2008. Numerical study on summer upwelling over northern continental shelf of South China Sea. Journal of Tropical Oceanography (in Chinese), 27(3): 1–8 [11] Li Xueding. 2012. Analysis on characteristics of red tide in Fujian coastal waters during the last 10 years. Environment Science (in Chinese), 33(7): 2210–2216 [12] Lin Jun. 2011. A modeling study of the phytoplankton dynamics off the Changjiang estuary (in Chinese) [dissertation]. Shanghai: East China Normal University [13] Liu Lusan, Li Zicheng, Zhou Juan, et al. 2011. Temporal and spatial distribution of red tide in Yangtze River Estuary and adjacent waters. Environmental Science (in Chinese), 32(9): 2497–2504 [14] Long Hua, Zhou Yan, Yu Jun, et al. 2008. Analyses on harmful algal blooms in Zhejiang coastal waters from 2001 to 2007. Marine Environmental Science (in Chinese), 27(S1): 1–4 [15] Lou Xiulin. 2010. Remote sensing observation of upwelling current in Zhejiang coastal waters and the relationship between red tide (in Chinese) [dissertation]. Qingdao: Ocean University of China [16] Mu Di. 2011. The study on the ecological water quality dynamic modeling of Bohai bay (in Chinese) [dissertation]. Tianjin: Tianjin University [17] Qi Yuzao. 2003. Red Tide Along the Coast of China. Beijing: Science Press, 3–5 [18] Song Nanqi, Wang Nuo, Wu Nuan, et al. 2018. Temporal and spatial distribution of harmful algal blooms in the Bohai Sea during 1952−2016 based on GIS. China Environmental Science (in Chinese), 38(3): 1142–1148 [19] Wang Hongli, Ge Gen, Li Yuelei. 2006. Research on the prediction of red tide based on the Fuzzy Neural Network. Marine Science Bulletin (in Chinese), 25(4): 36–41 [20] Wei Guiqiu, Wang Hua, Cai Weixu, et al. 2012. 10-year retrospective analysis on the harmful algal blooms in the Pearl River Estuary. Marine Science Bulletin (in Chinese), 31(4): 466–474 [21] Wen Shiyong, Zhao Dongzhi, Zhao Ling, et al. 2009. Tolerance response model of N/P ratios for red tide algae. Journal of Dalian Maritime University (in Chinese), 35(1): 118–122 [22] Wooster W S, Zhang C I. 2004. Regime shifts in the North Pacific: early indications of the 1976–1977 event. Progress in Oceanography, 60(2−4): 183–200. doi: 10.1016/j.pocean.2004.02.005 [23] Xu Lili, Gong Maoxun, Xu Tingting, et al. 2013. Relationships between the east Asian monsoon anomalous and the red tide occurrence frequency in the East China Sea mental factors in the Beidaihe waters of the Qinhuangdao. Marine Forecasts (in Chinese), 30(5): 8–14 [24] Yang Hong, He Chunliang. 2009. The red tide events in the China Sea and the relationship with the temperature and El Niño. Transactions of Oceanology and Limnology (in Chinese), 2(2): 1–6 [25] Zhang Qingtian. 2013. Review on the annual variation of red tides in China Sea. Environmental Monitoring in China (in Chinese), 29(5): 98–102 [26] Zhao Dongzhi. 2010. The Occurrence Regularity of Red Tide Disasters in the Typical Waters of China (in Chinese). Beijing: China Ocean Press [27] Zhao Dongzhi, Zhang Fengshou, Zhao Ling. 2003. Detecting chlorophyll and hazard algal bloom in coastal water with normalized deference of AVHPP. Ocean Technology (in Chinese), 22(3): 30–33 [28] Zhao Dongzhi, Zhang Fengshou, Yang Jianhong, et al. 2005. The optimized spectral bands ratio for the relation of sun-induced chlorophyll fluorescence height with high chlorophyll a concentration of algal bloom waters. Haiyang Xuebao (in Chinese), 27(6): 146–153 [29] Zhong Shanshan, He Jinhai, Liu Xuanfei, et al. 2004. Possible mechanisms of Enso’s decadal variability. Journal of Tropical Oceanography (in Chinese), 23(2): 28–36 -


 点击查看大图
计量
- 文章访问数: 287
- HTML全文浏览量: 87
- PDF下载量: 8
- 被引次数: 0

