

Evaluation of reanalysis surface wind products with quality-assured buoy wind measurements along the north coast of the South China Sea
-
Abstract: Three archived reanalysis wind vectors at 10 m height in the wind speed range of 2–15 m/s, namely, the second version of the National Centres for Environmental Prediction (NCEP) Climate Forecast System Reanalysis (CFSv2), European Centre for Medium-Range Weather Forecasting Interim Reanalysis (ERA-I) and NCEP-Department of Energy (DOE) Reanalysis 2 (NCEP-2) products, are evaluated by a comparison with the winds measured by moored buoys in coastal regions of the South China Sea (SCS). The buoy data are first quality controlled by extensive techniques that help eliminate degraded measurements. The evaluation results reveal that the CFSv2 wind vectors are most consistent with the buoy winds (with average biases of 0.01 m/s and 1.76°). The ERA-I winds significantly underestimate the buoy wind speed (with an average bias of –1.57 m/s), while the statistical errors in the NCEP-2 wind direction have the largest magnitude. The diagnosis of the reanalysis wind errors shows the residuals of all three reanalysis wind speeds (reanalysis-buoy) decrease with increasing buoy wind speed, suggesting a narrower wind speed range than that of the observations. Moreover, wind direction errors are examined to depend on the magnitude of the wind speed and the wind speed biases. In general, the evaluation of three reanalysis wind products demonstrates that CFSv2 wind vectors are the closest to the winds along the north coast of the SCS and are sufficiently accurate to be used in numerical models.
-
Key words:
- evaluation /
- quality control /
- buoy wind /
- coastal regions of the South China Sea
-
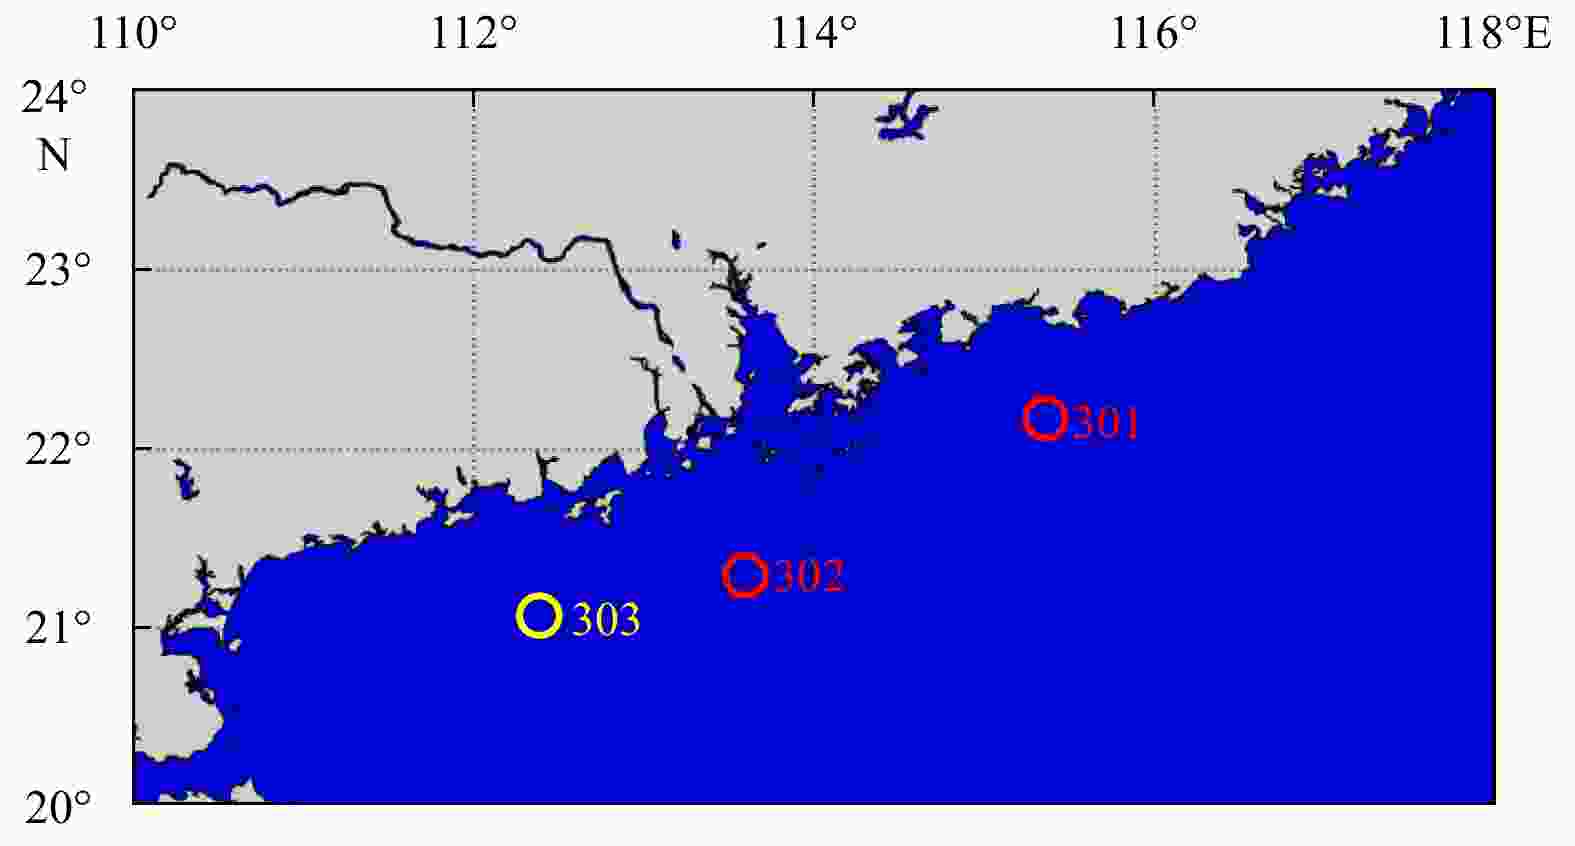
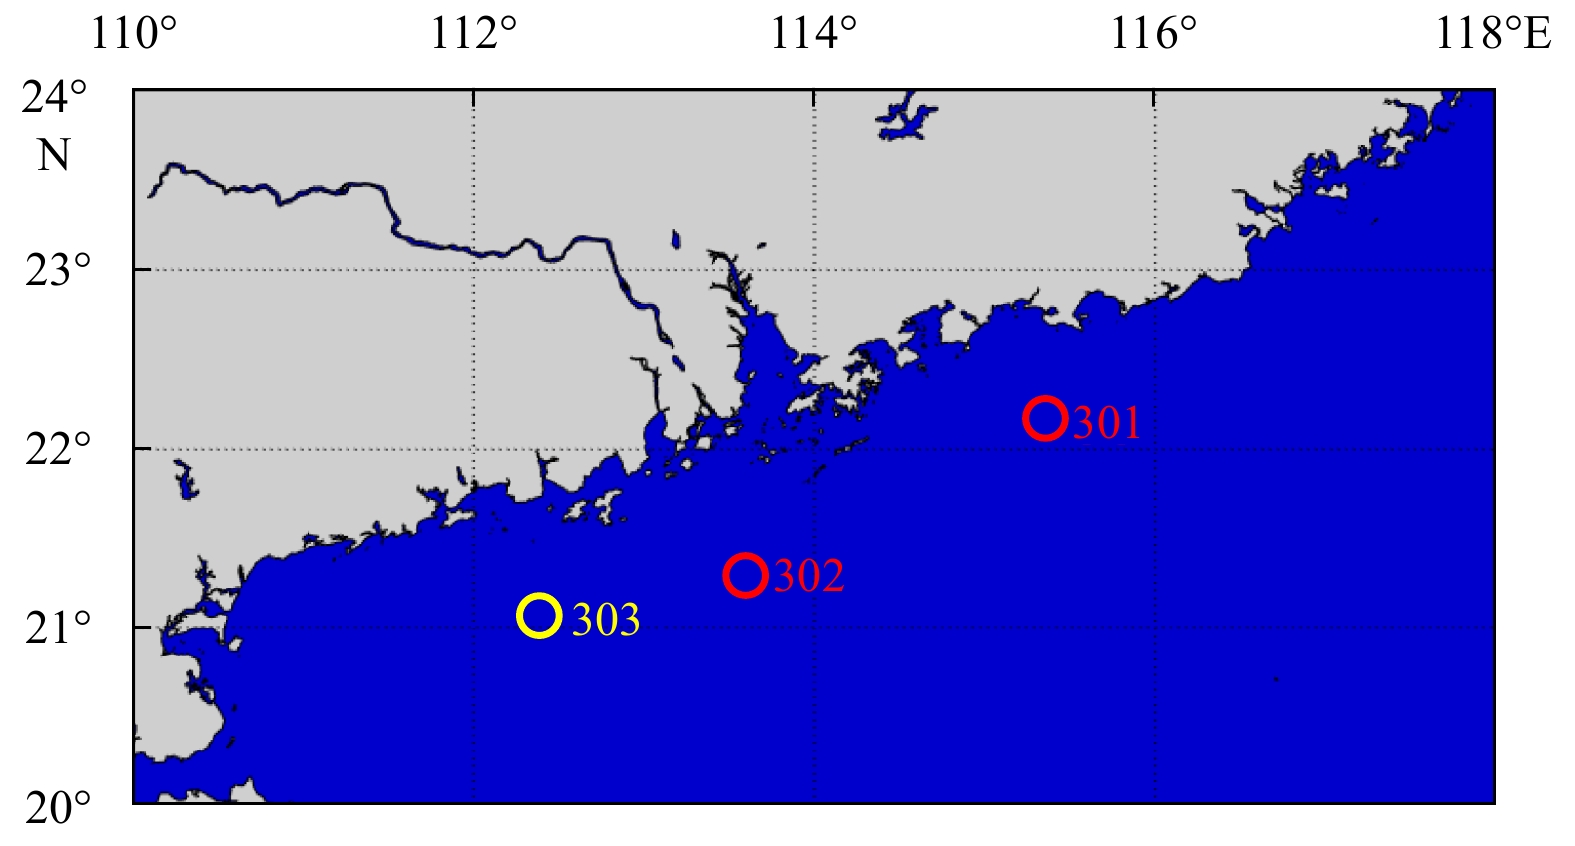
Figure 1. Location of the three offshore-moored buoys (hollow circles) used in the quality control. Red circles denote the selected buoys in the evaluation.
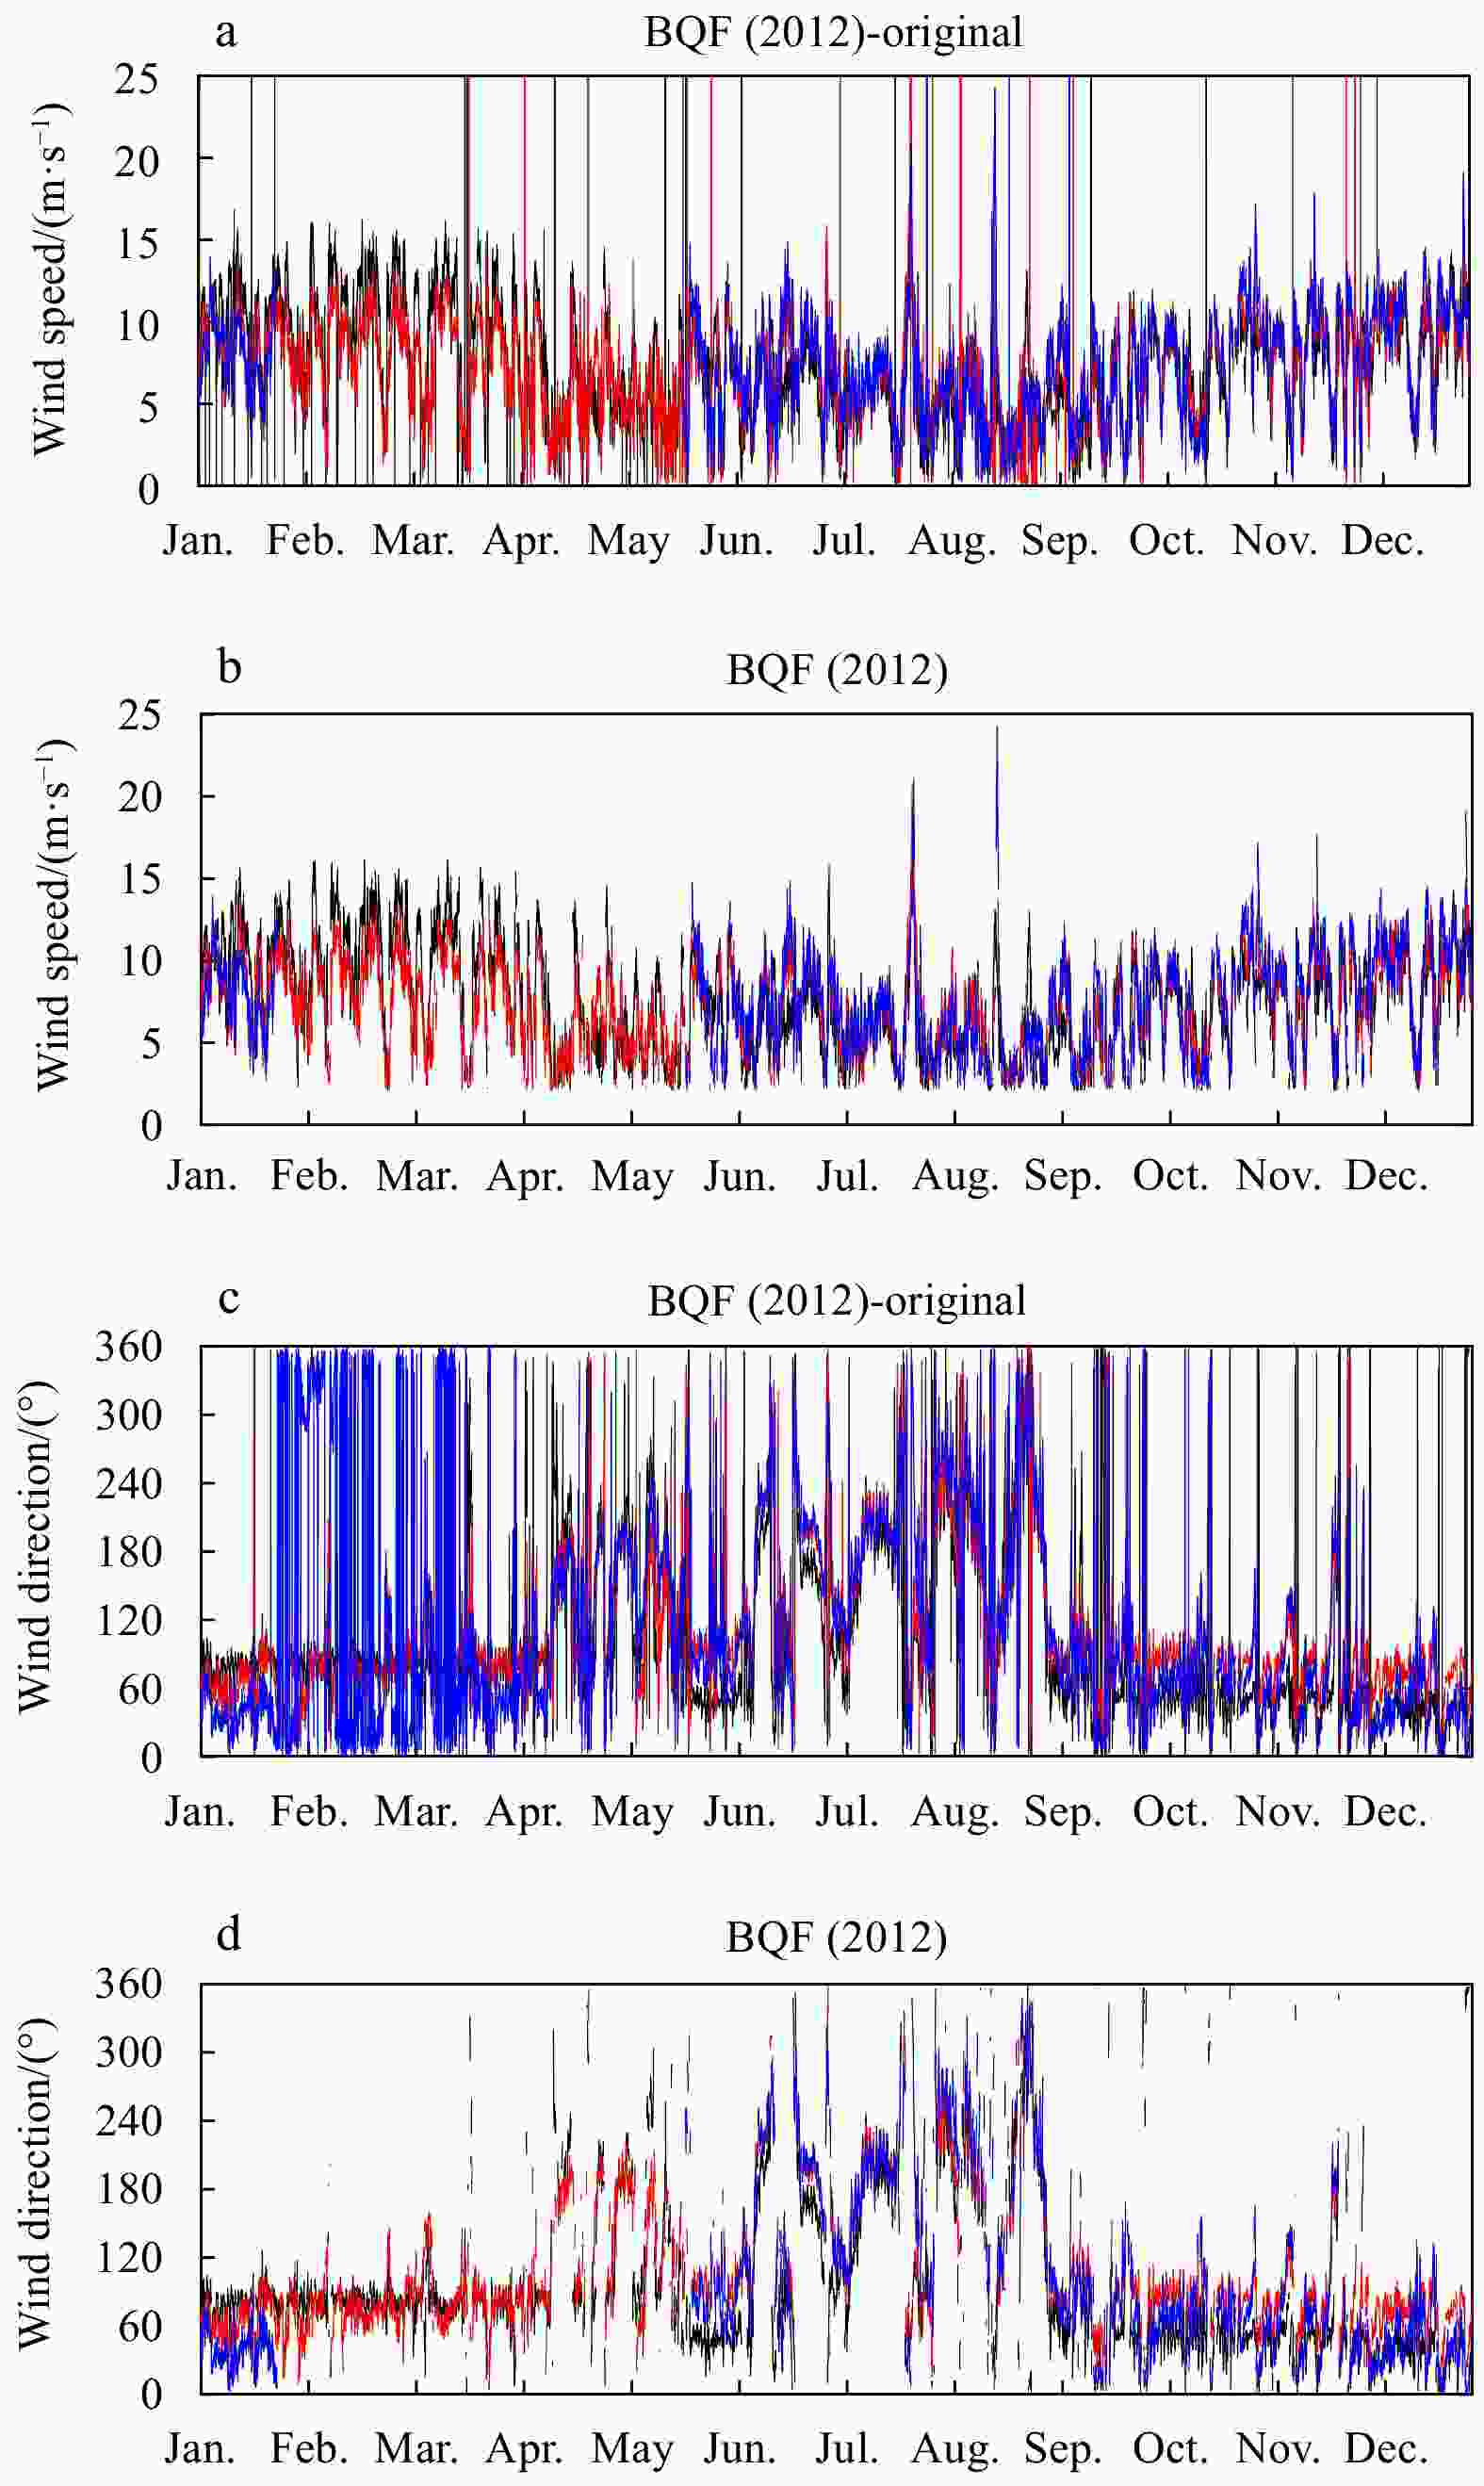
Figure 2. Time series of the original buoy wind speed during 2012 (a), the buoy wind speed during 2012 after quality control procedures (b), the original buoy wind direction during 2012 (c), and buoy wind direction during 2012 after quality control procedures (d). The black, red and blue lines correspond to Buoy 301, Buoy 302 and Buoy 303, respectively. BQF means the buoys in shallow waters.
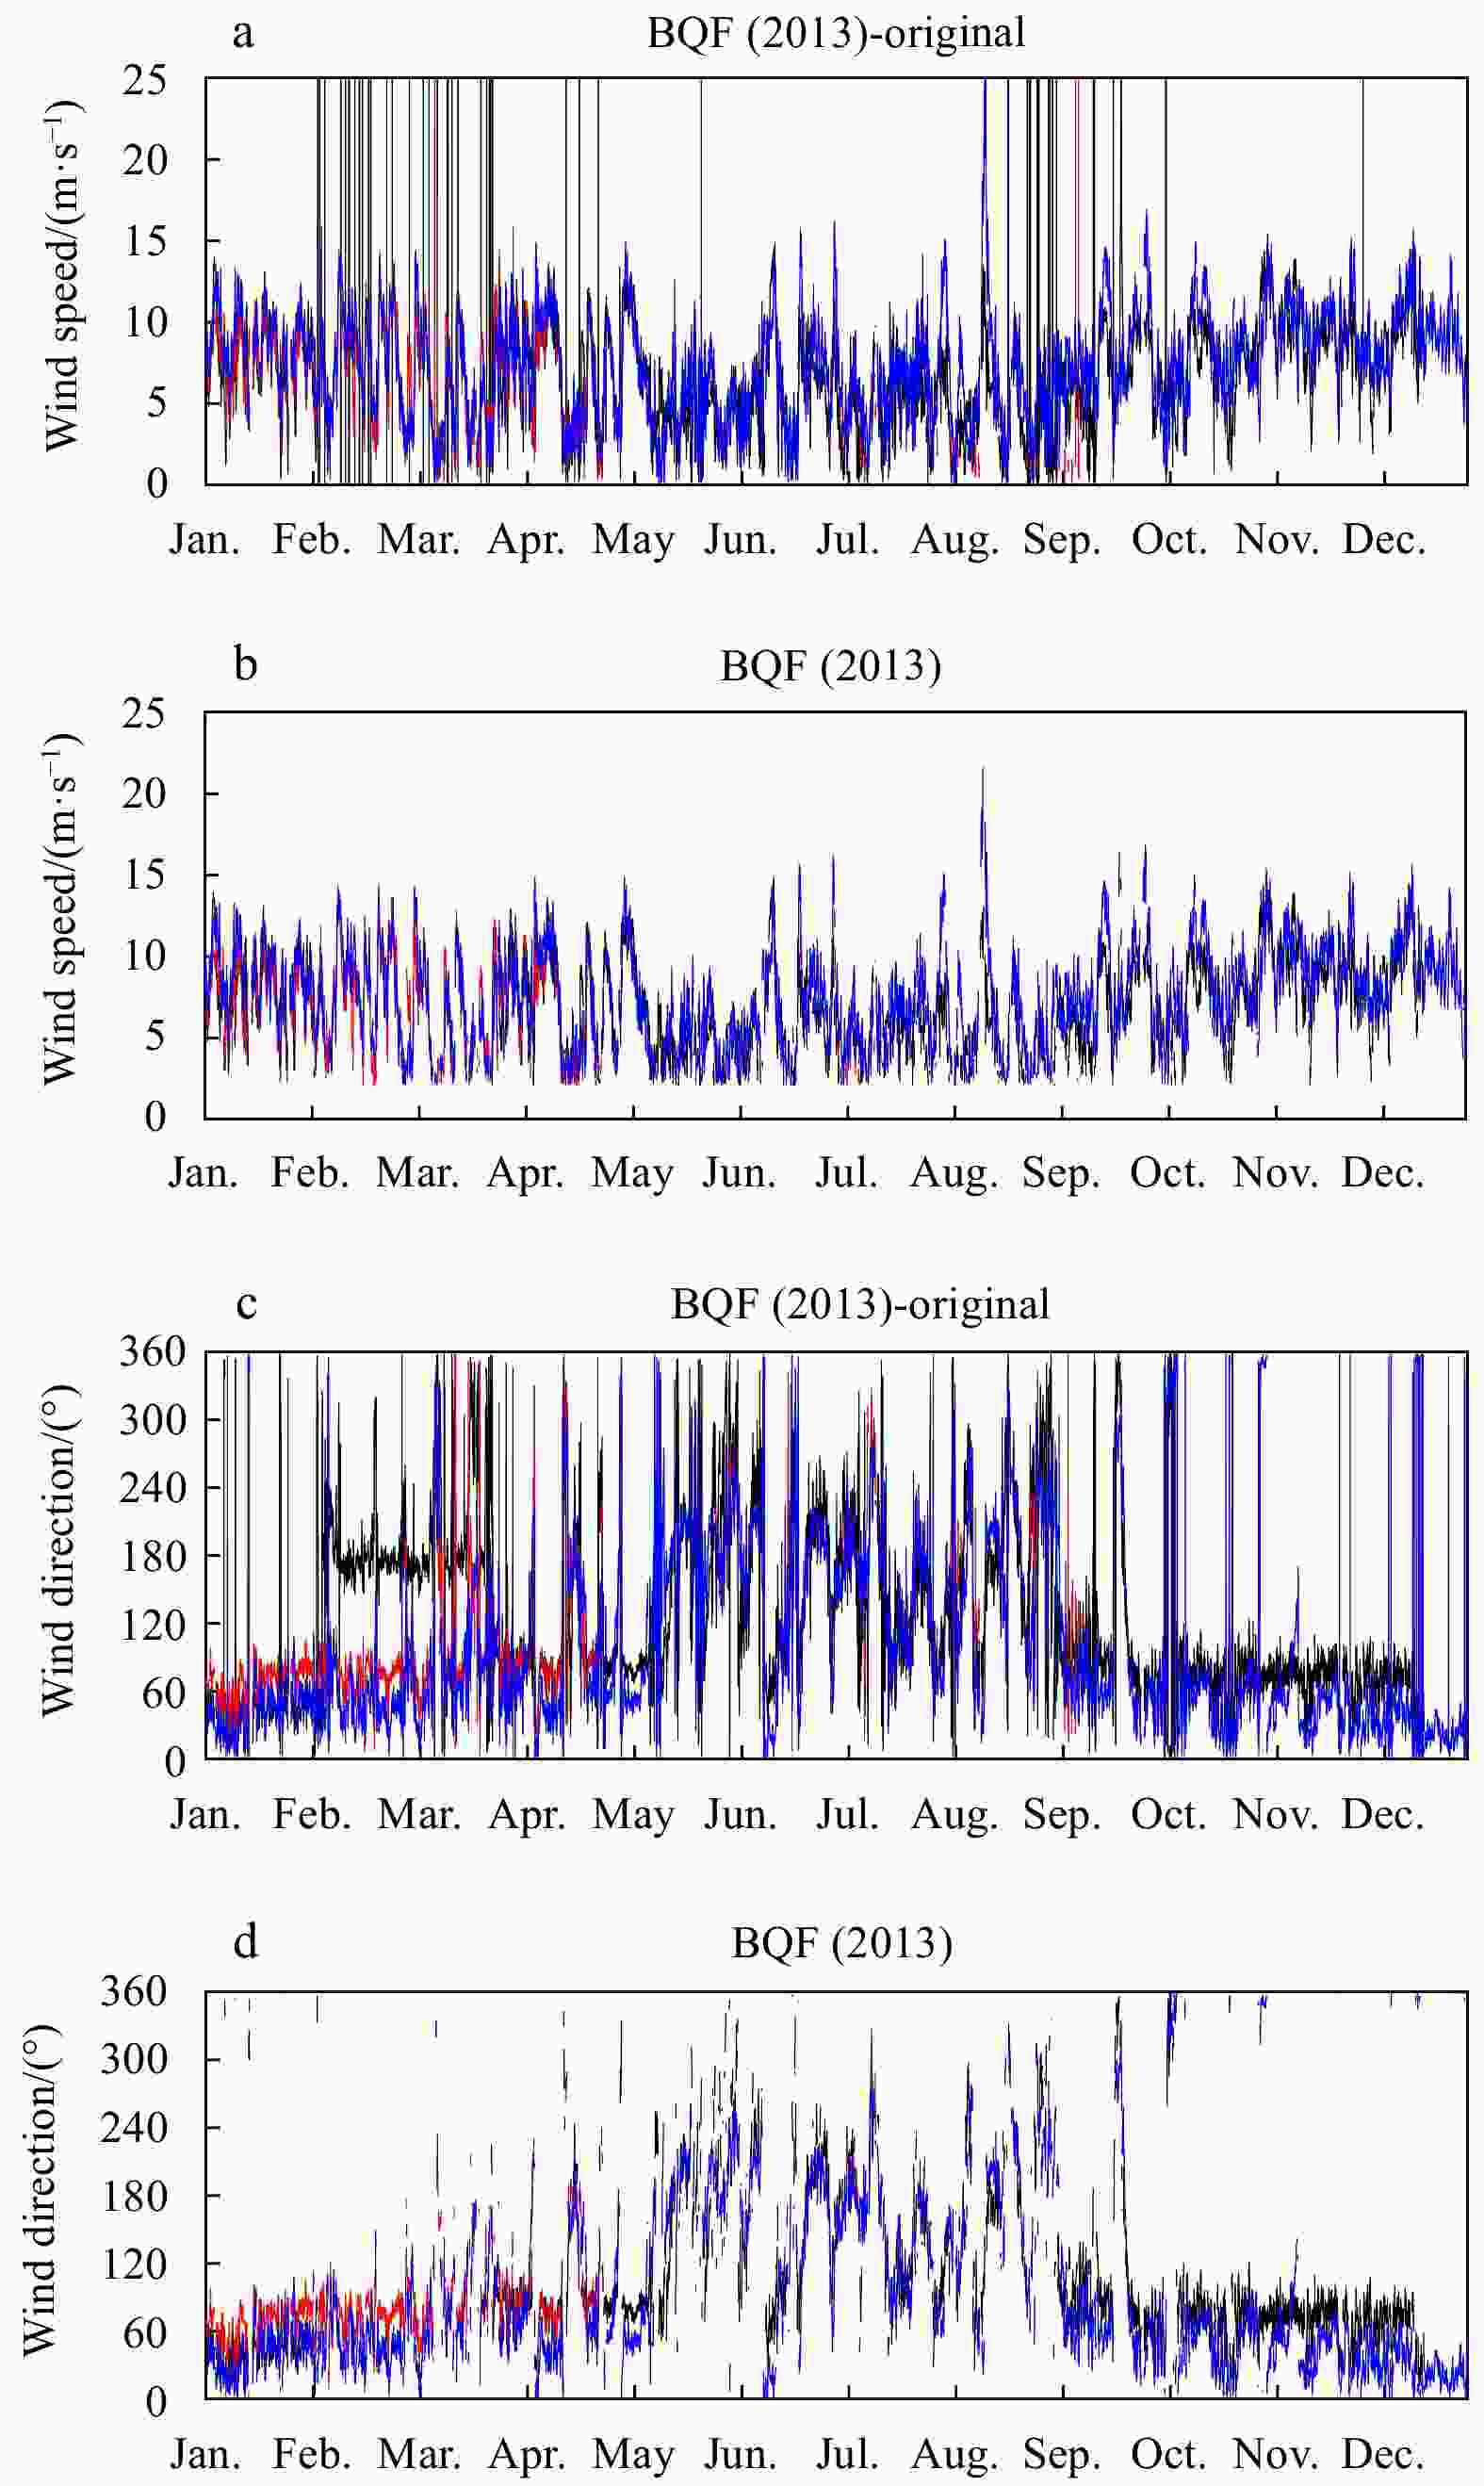
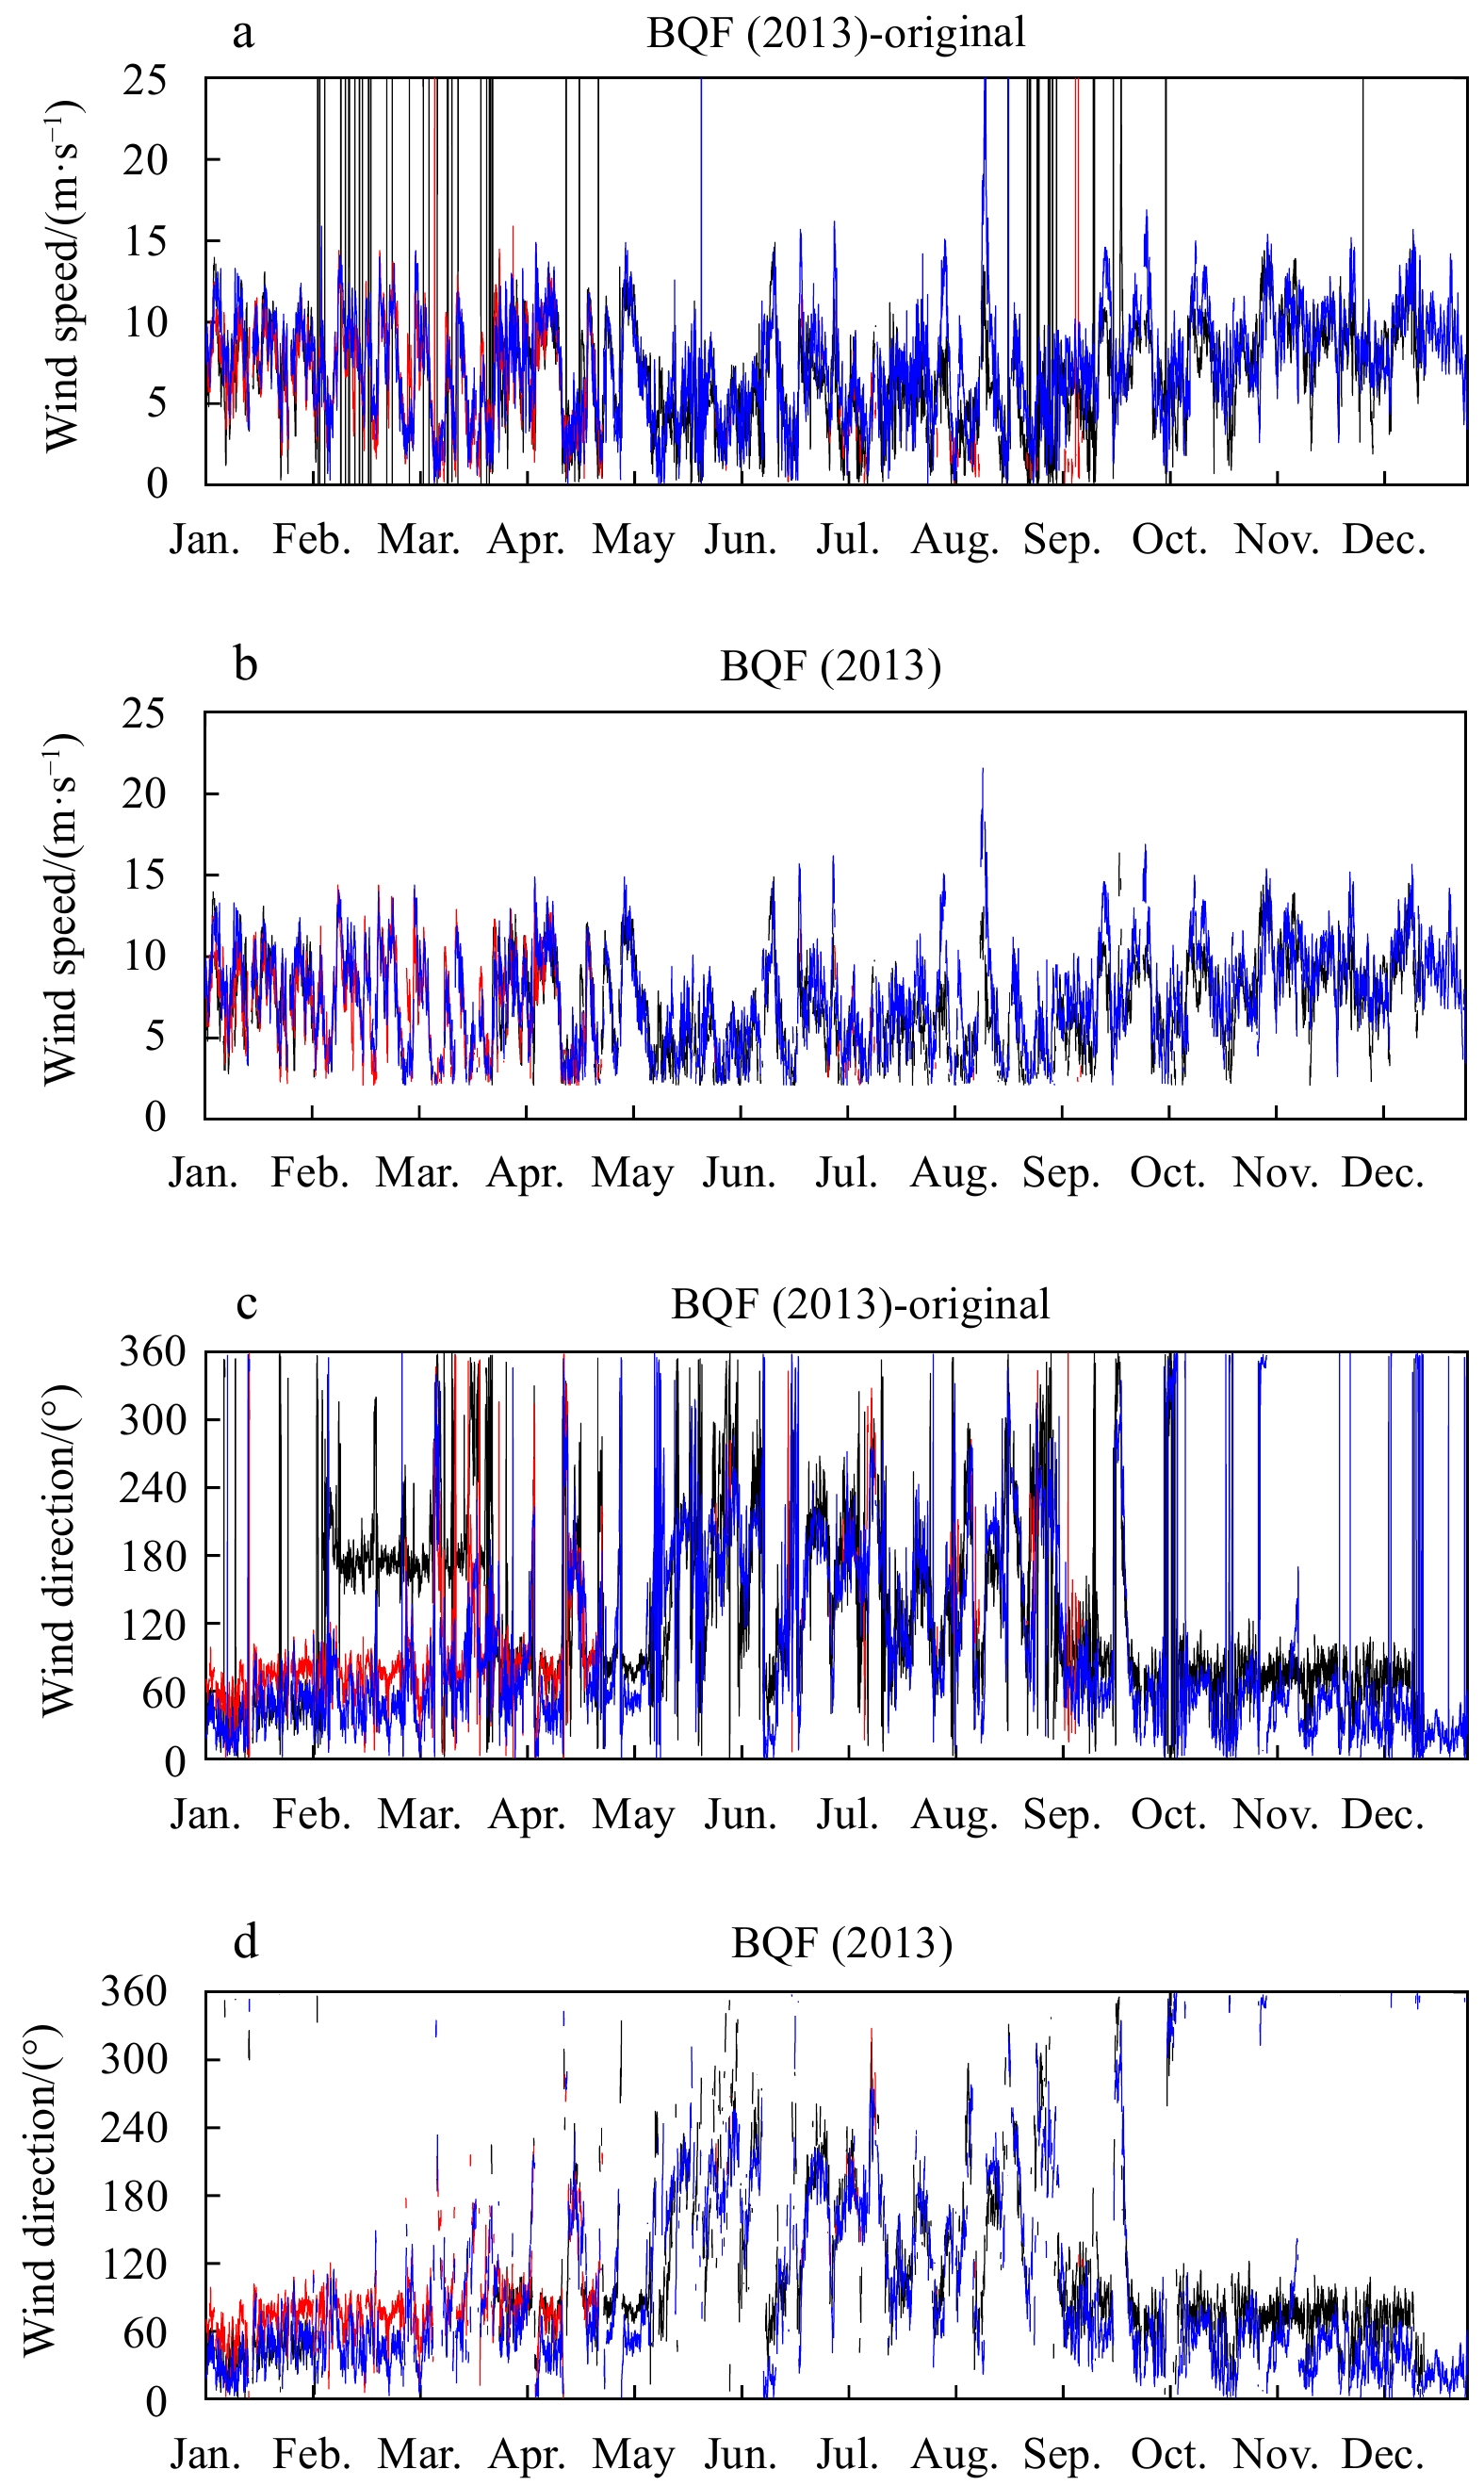
Figure 3. Time series of the original buoy wind speed during 2013 (a), the buoy wind speed during 2013 after quality control procedures (b), the original buoy wind direction during 2013 (c), and buoy wind direction during 2013 after quality control procedures (d). The black, red and blue lines correspond to Buoy 301, Buoy 302 and Buoy 303, respectively.
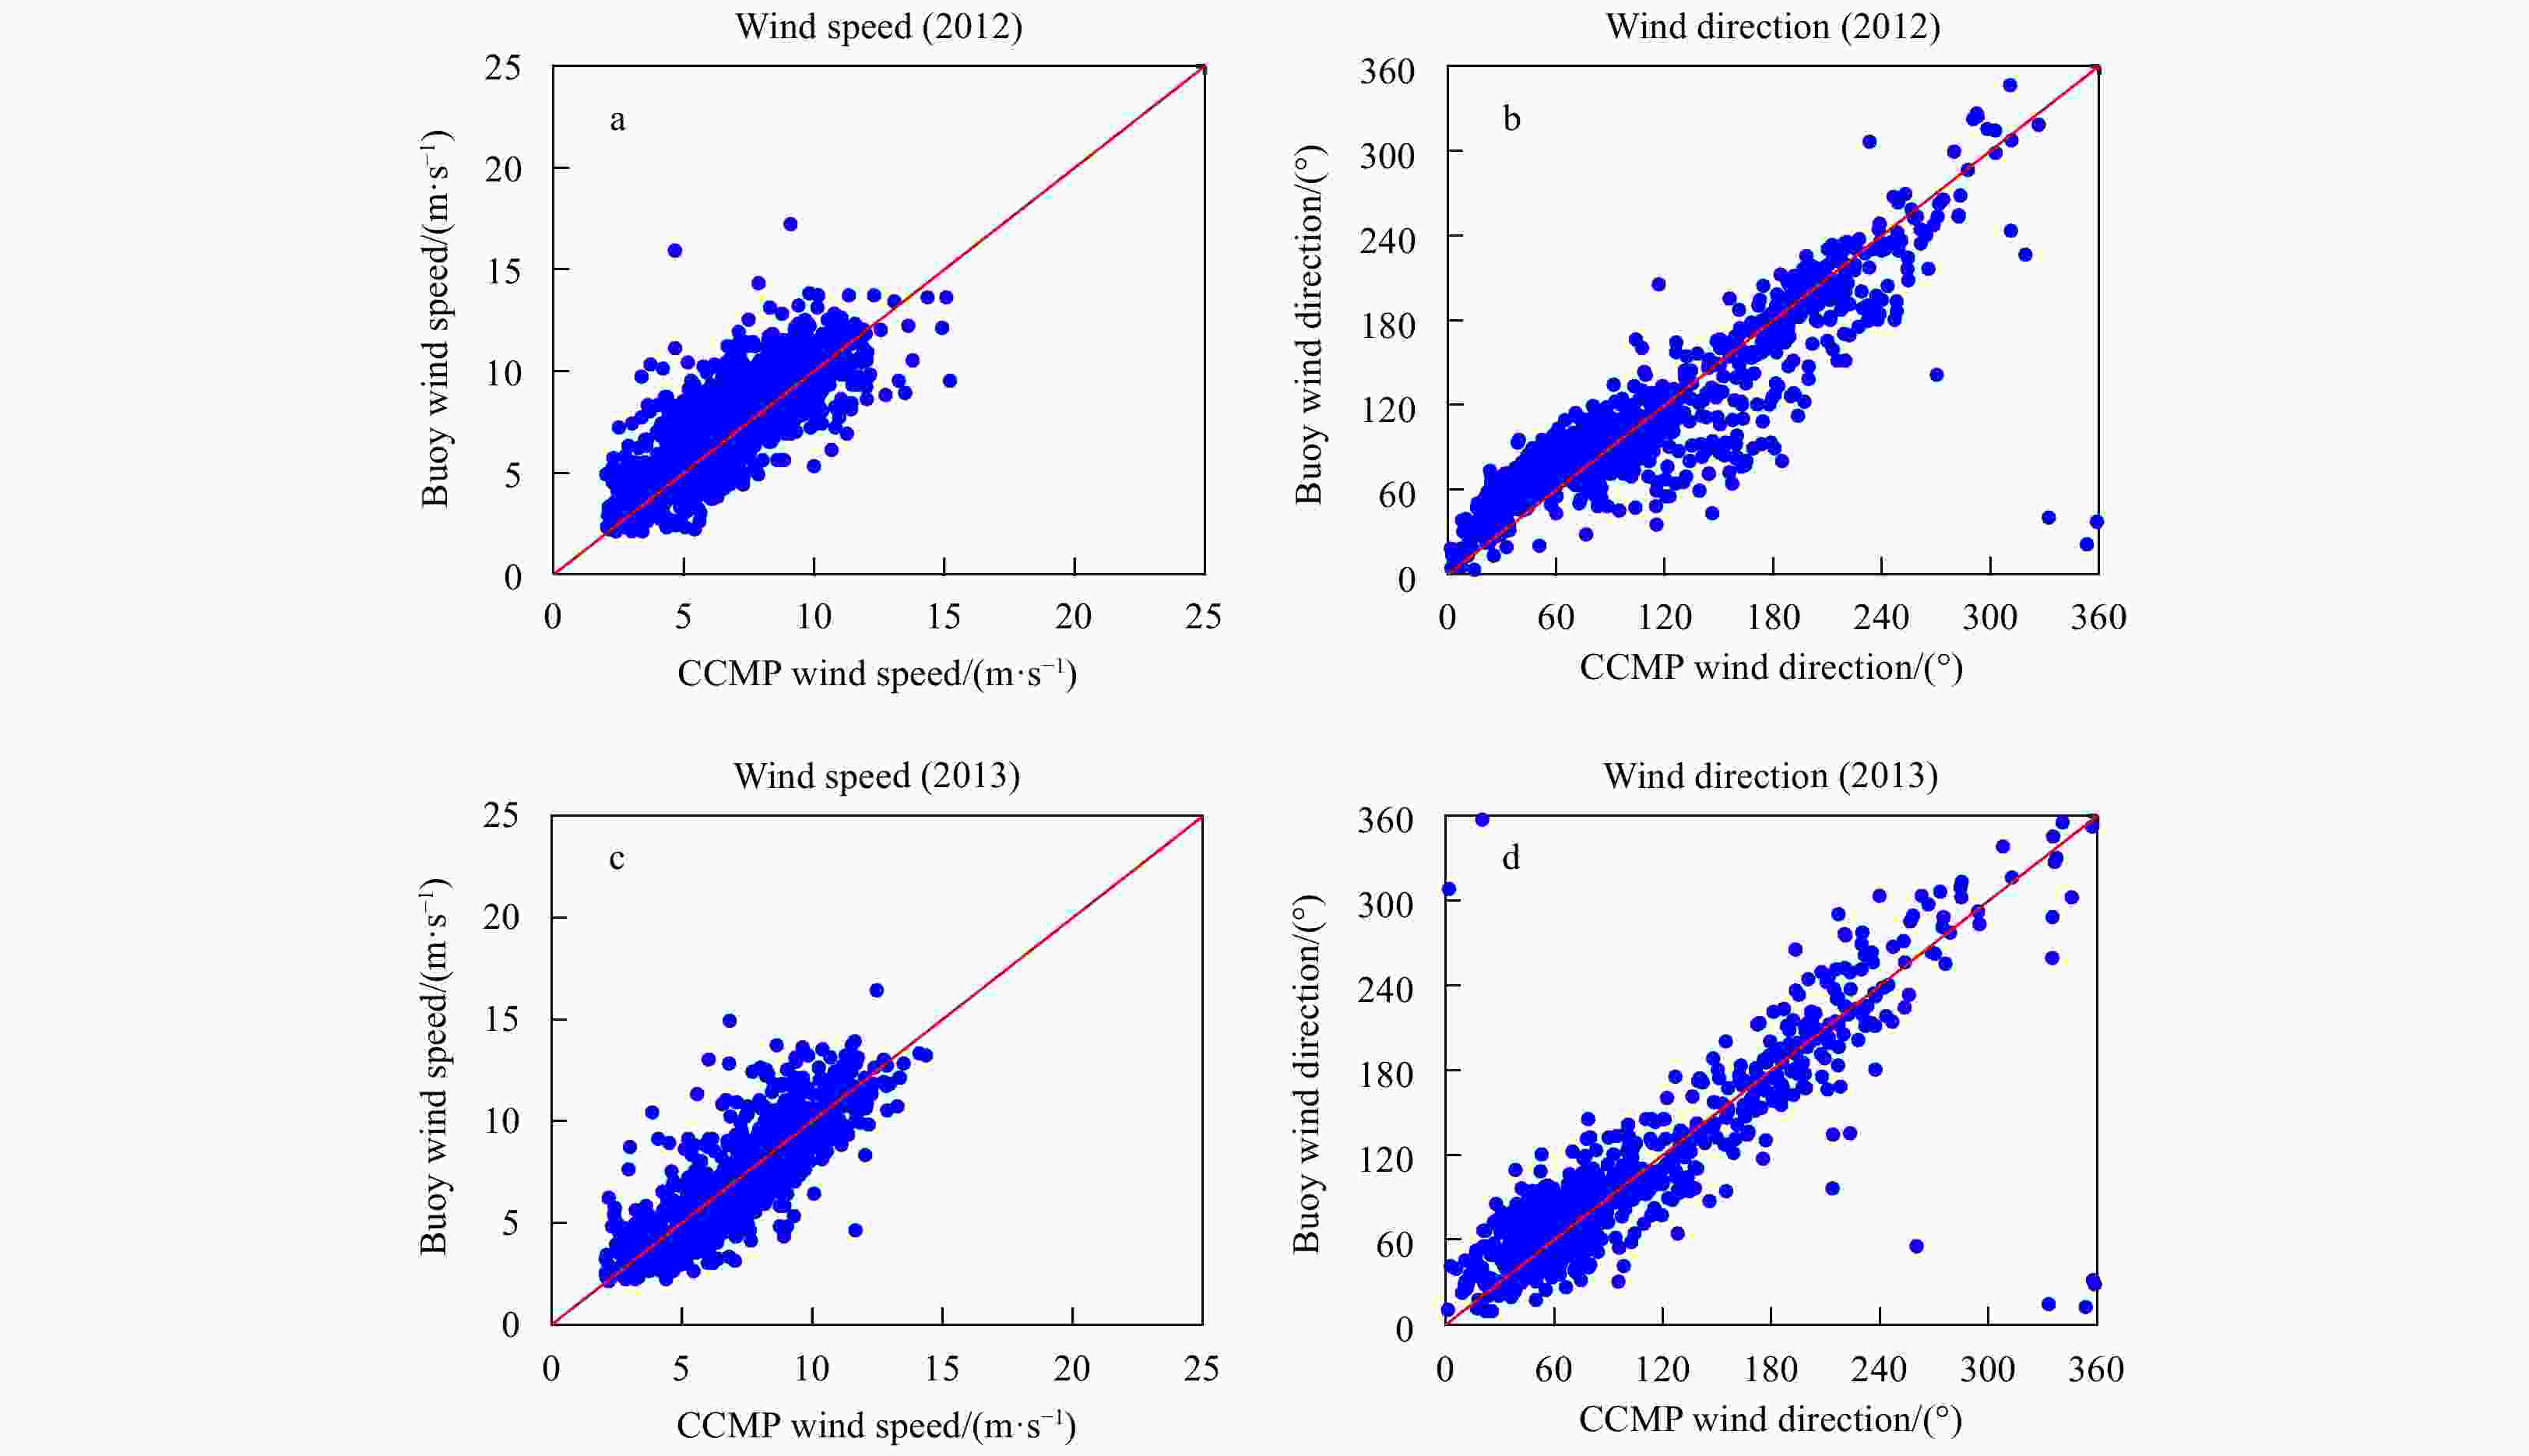
Figure 4. Scatterplots for the wind speed and direction of the comparisons between the CCMP and wind data from Buoy 302 during 2012 and Buoy 301 during 2013. a and b show the comparison of wind vectors during 2012, while c and d show wind comparison during 2013.

Figure 5. Scatterplots for the wind speed and direction of the comparisons between the reanalysis and wind data from Buoy 302 during 2012. a. CFSv2 wind speed; b. ERA-I wind speed; c. NCEP-2 wind speed; d. CFSv2 wind direction; e. ERA-I wind direction; and f. NCEP-2 wind direction.
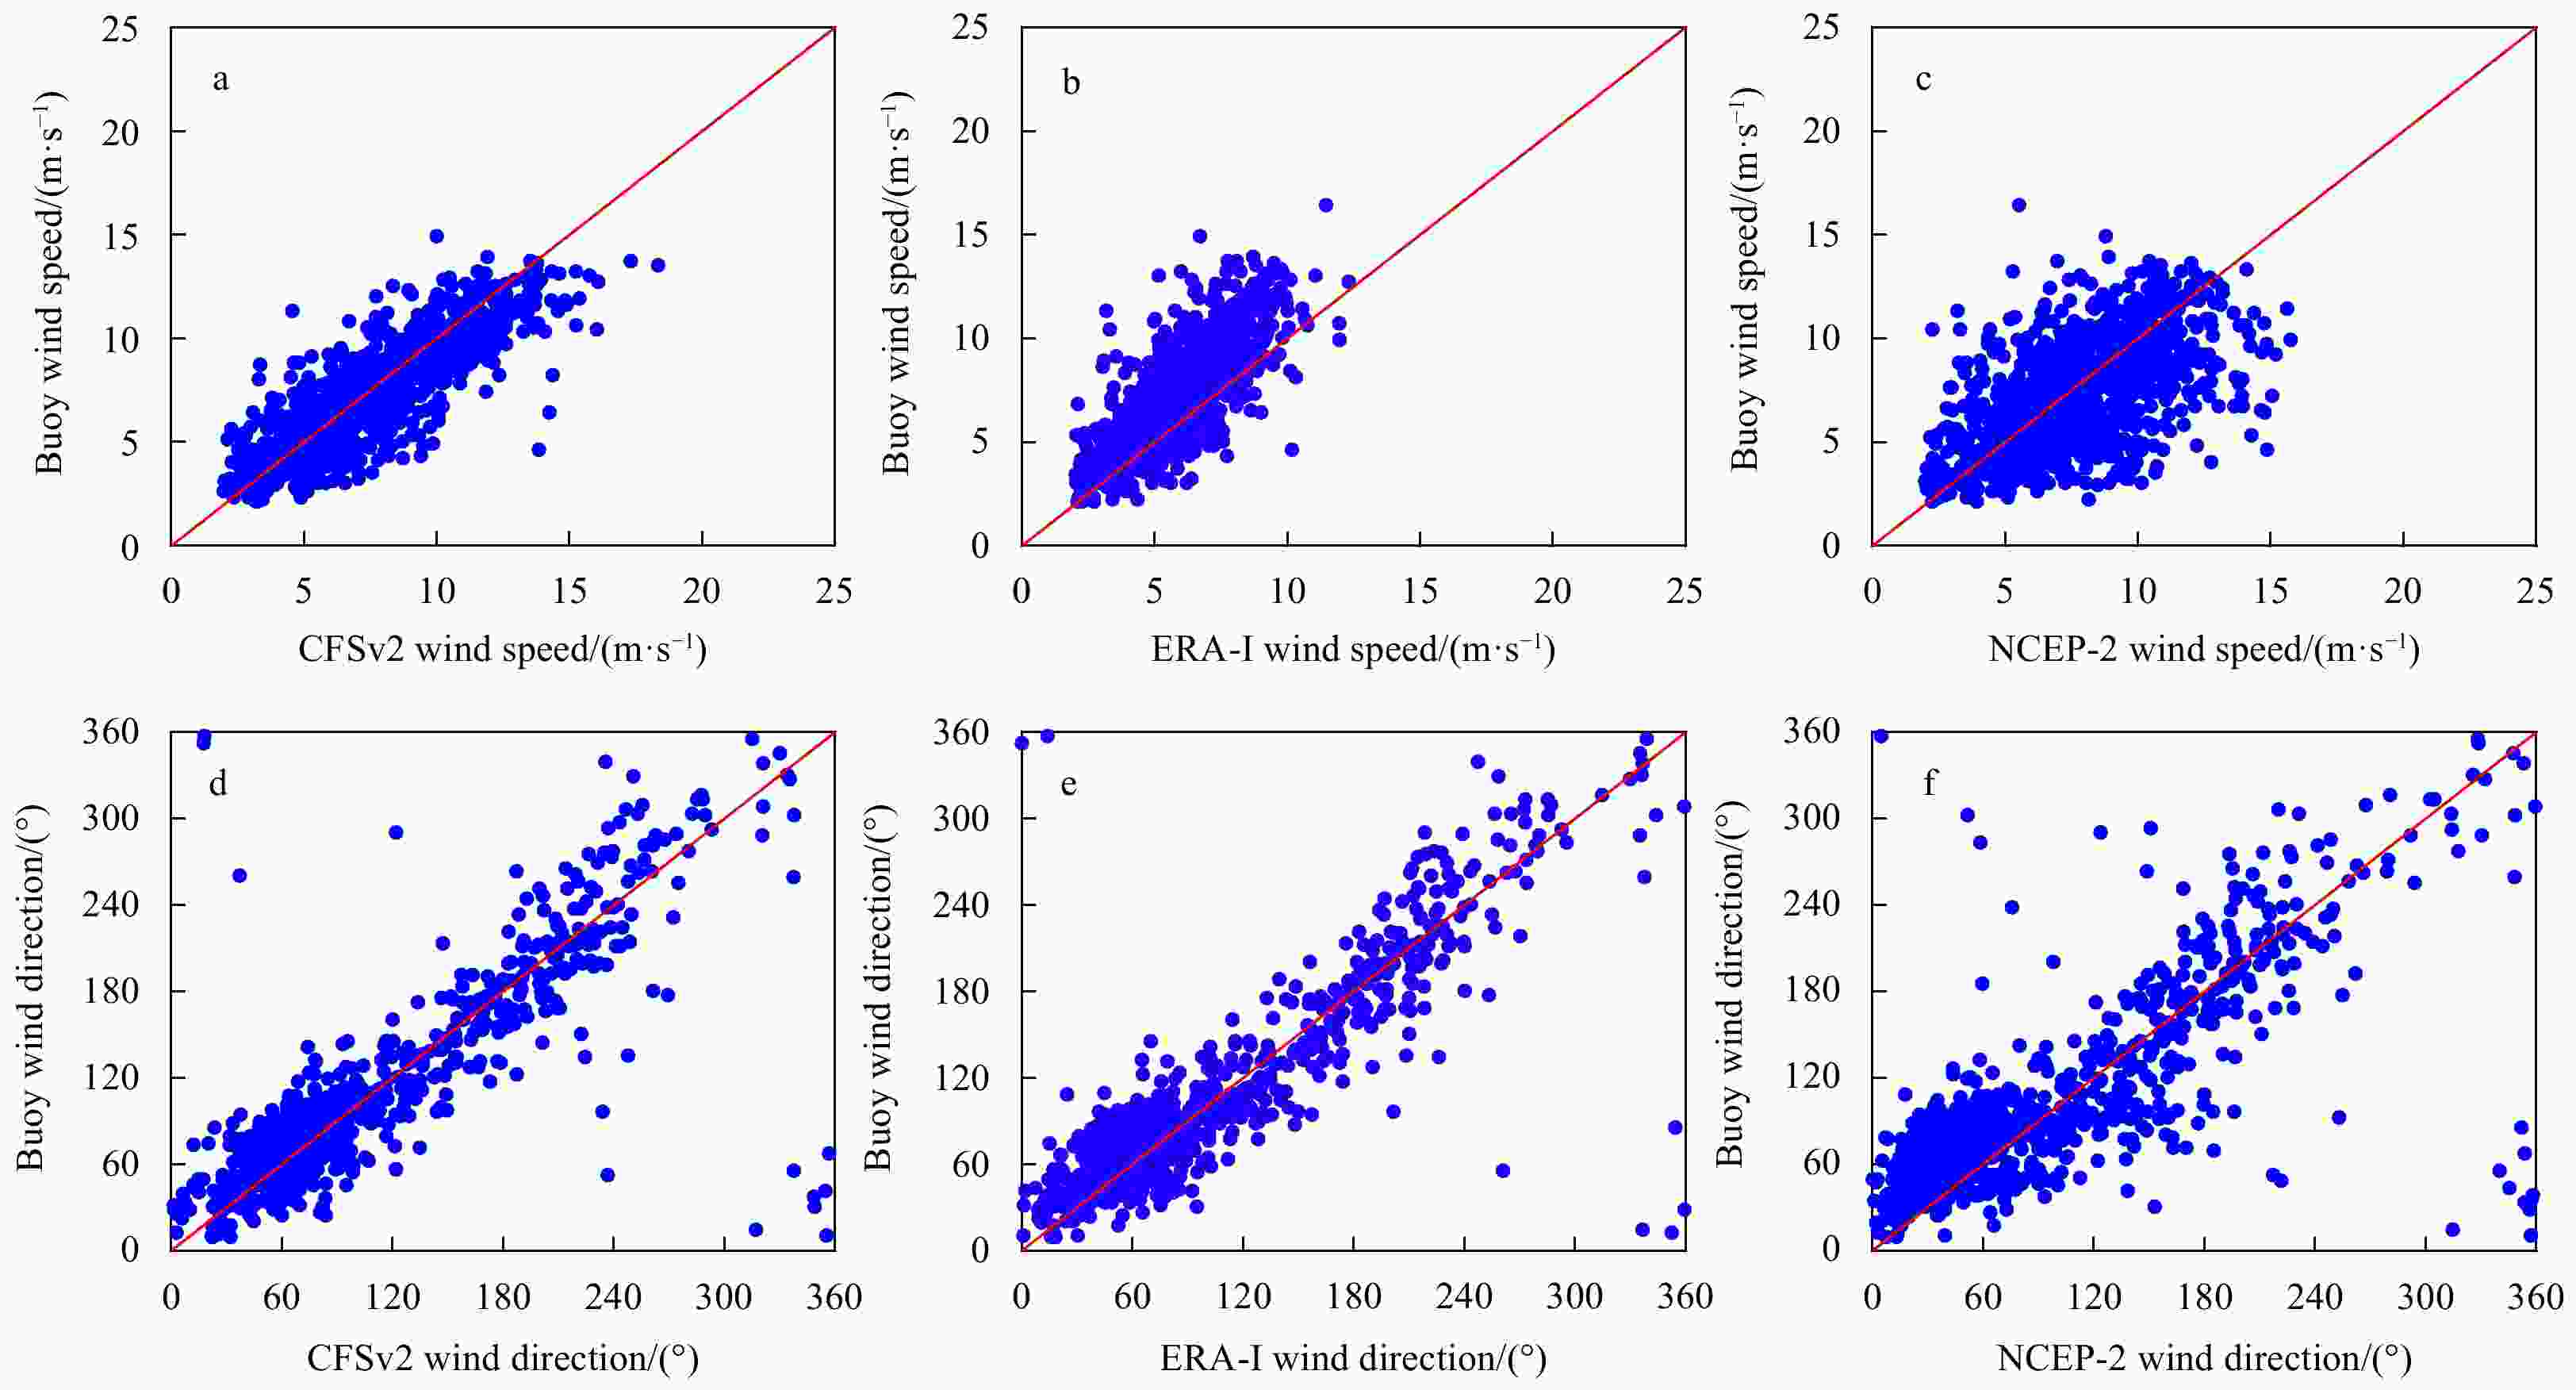
Figure 6. Scatterplots for the wind speed and direction of the comparisons between the reanalysis and wind data from Buoy 301 during 2013. a. CFSv2 wind speed; b. ERA-I wind speed; c. NCEP-2 wind speed; d. CFSv2 wind direction; e. ERA-I wind direction; and f. NCEP-2 wind direction.
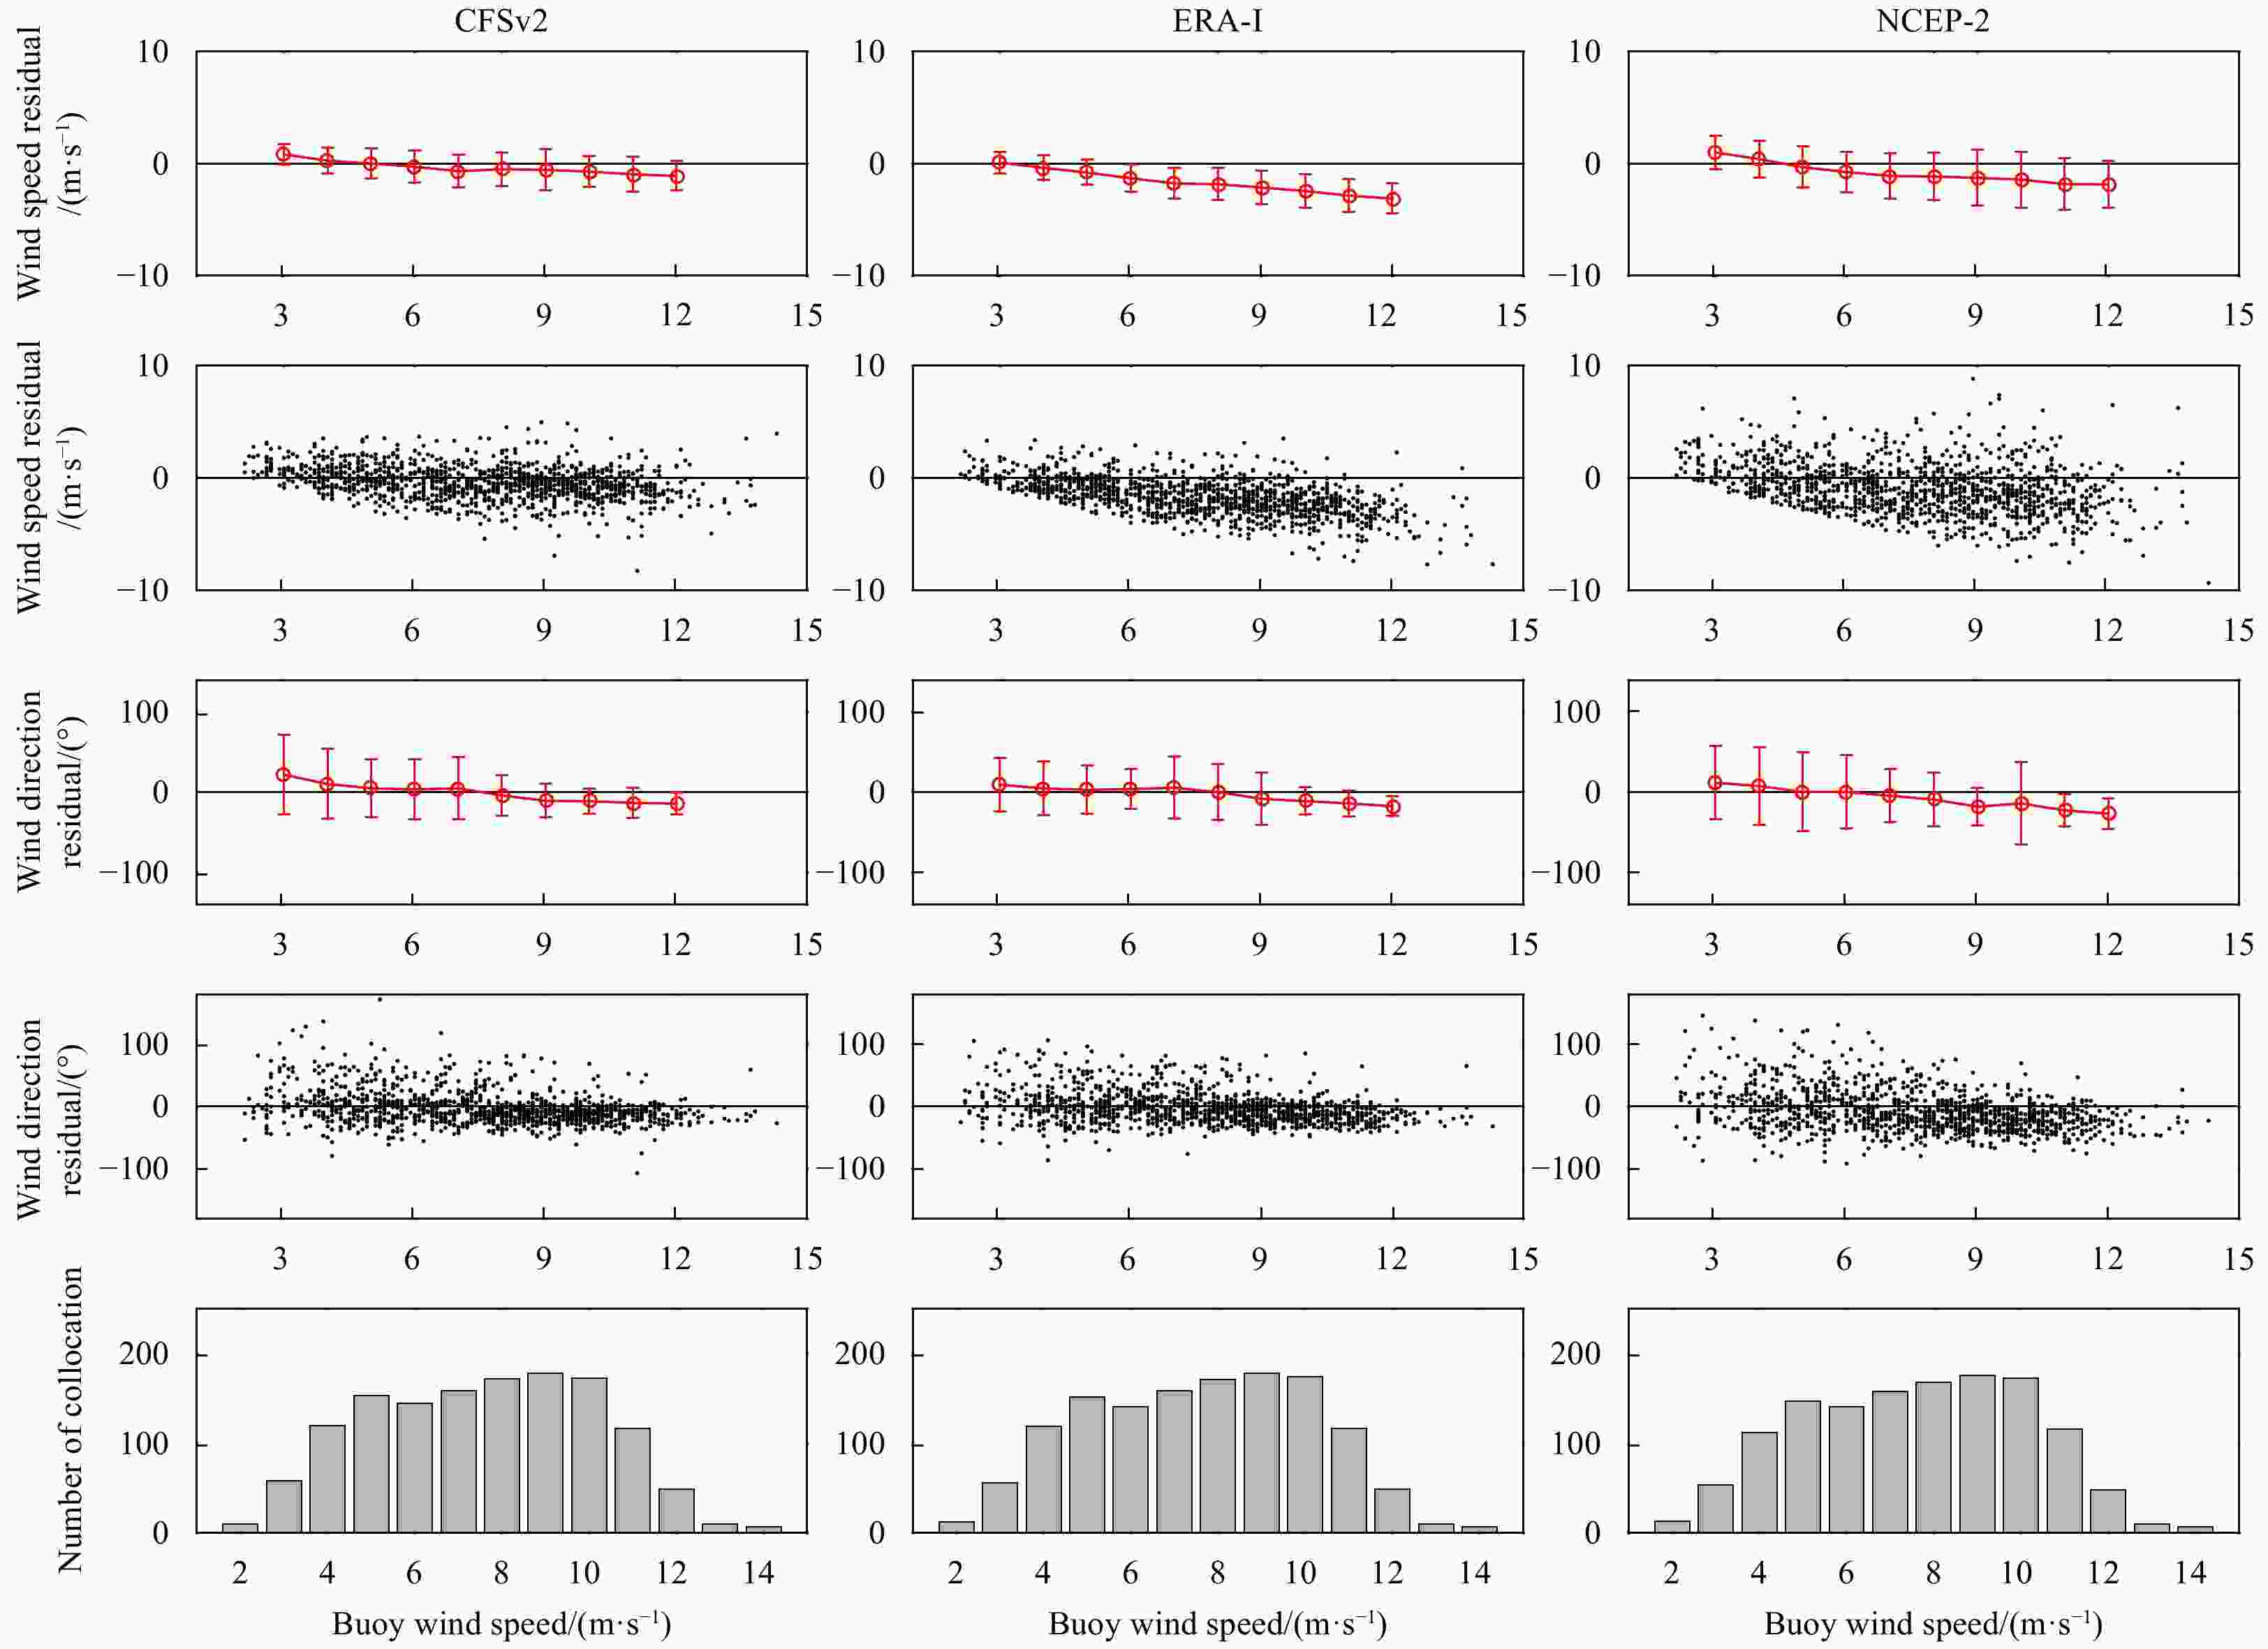
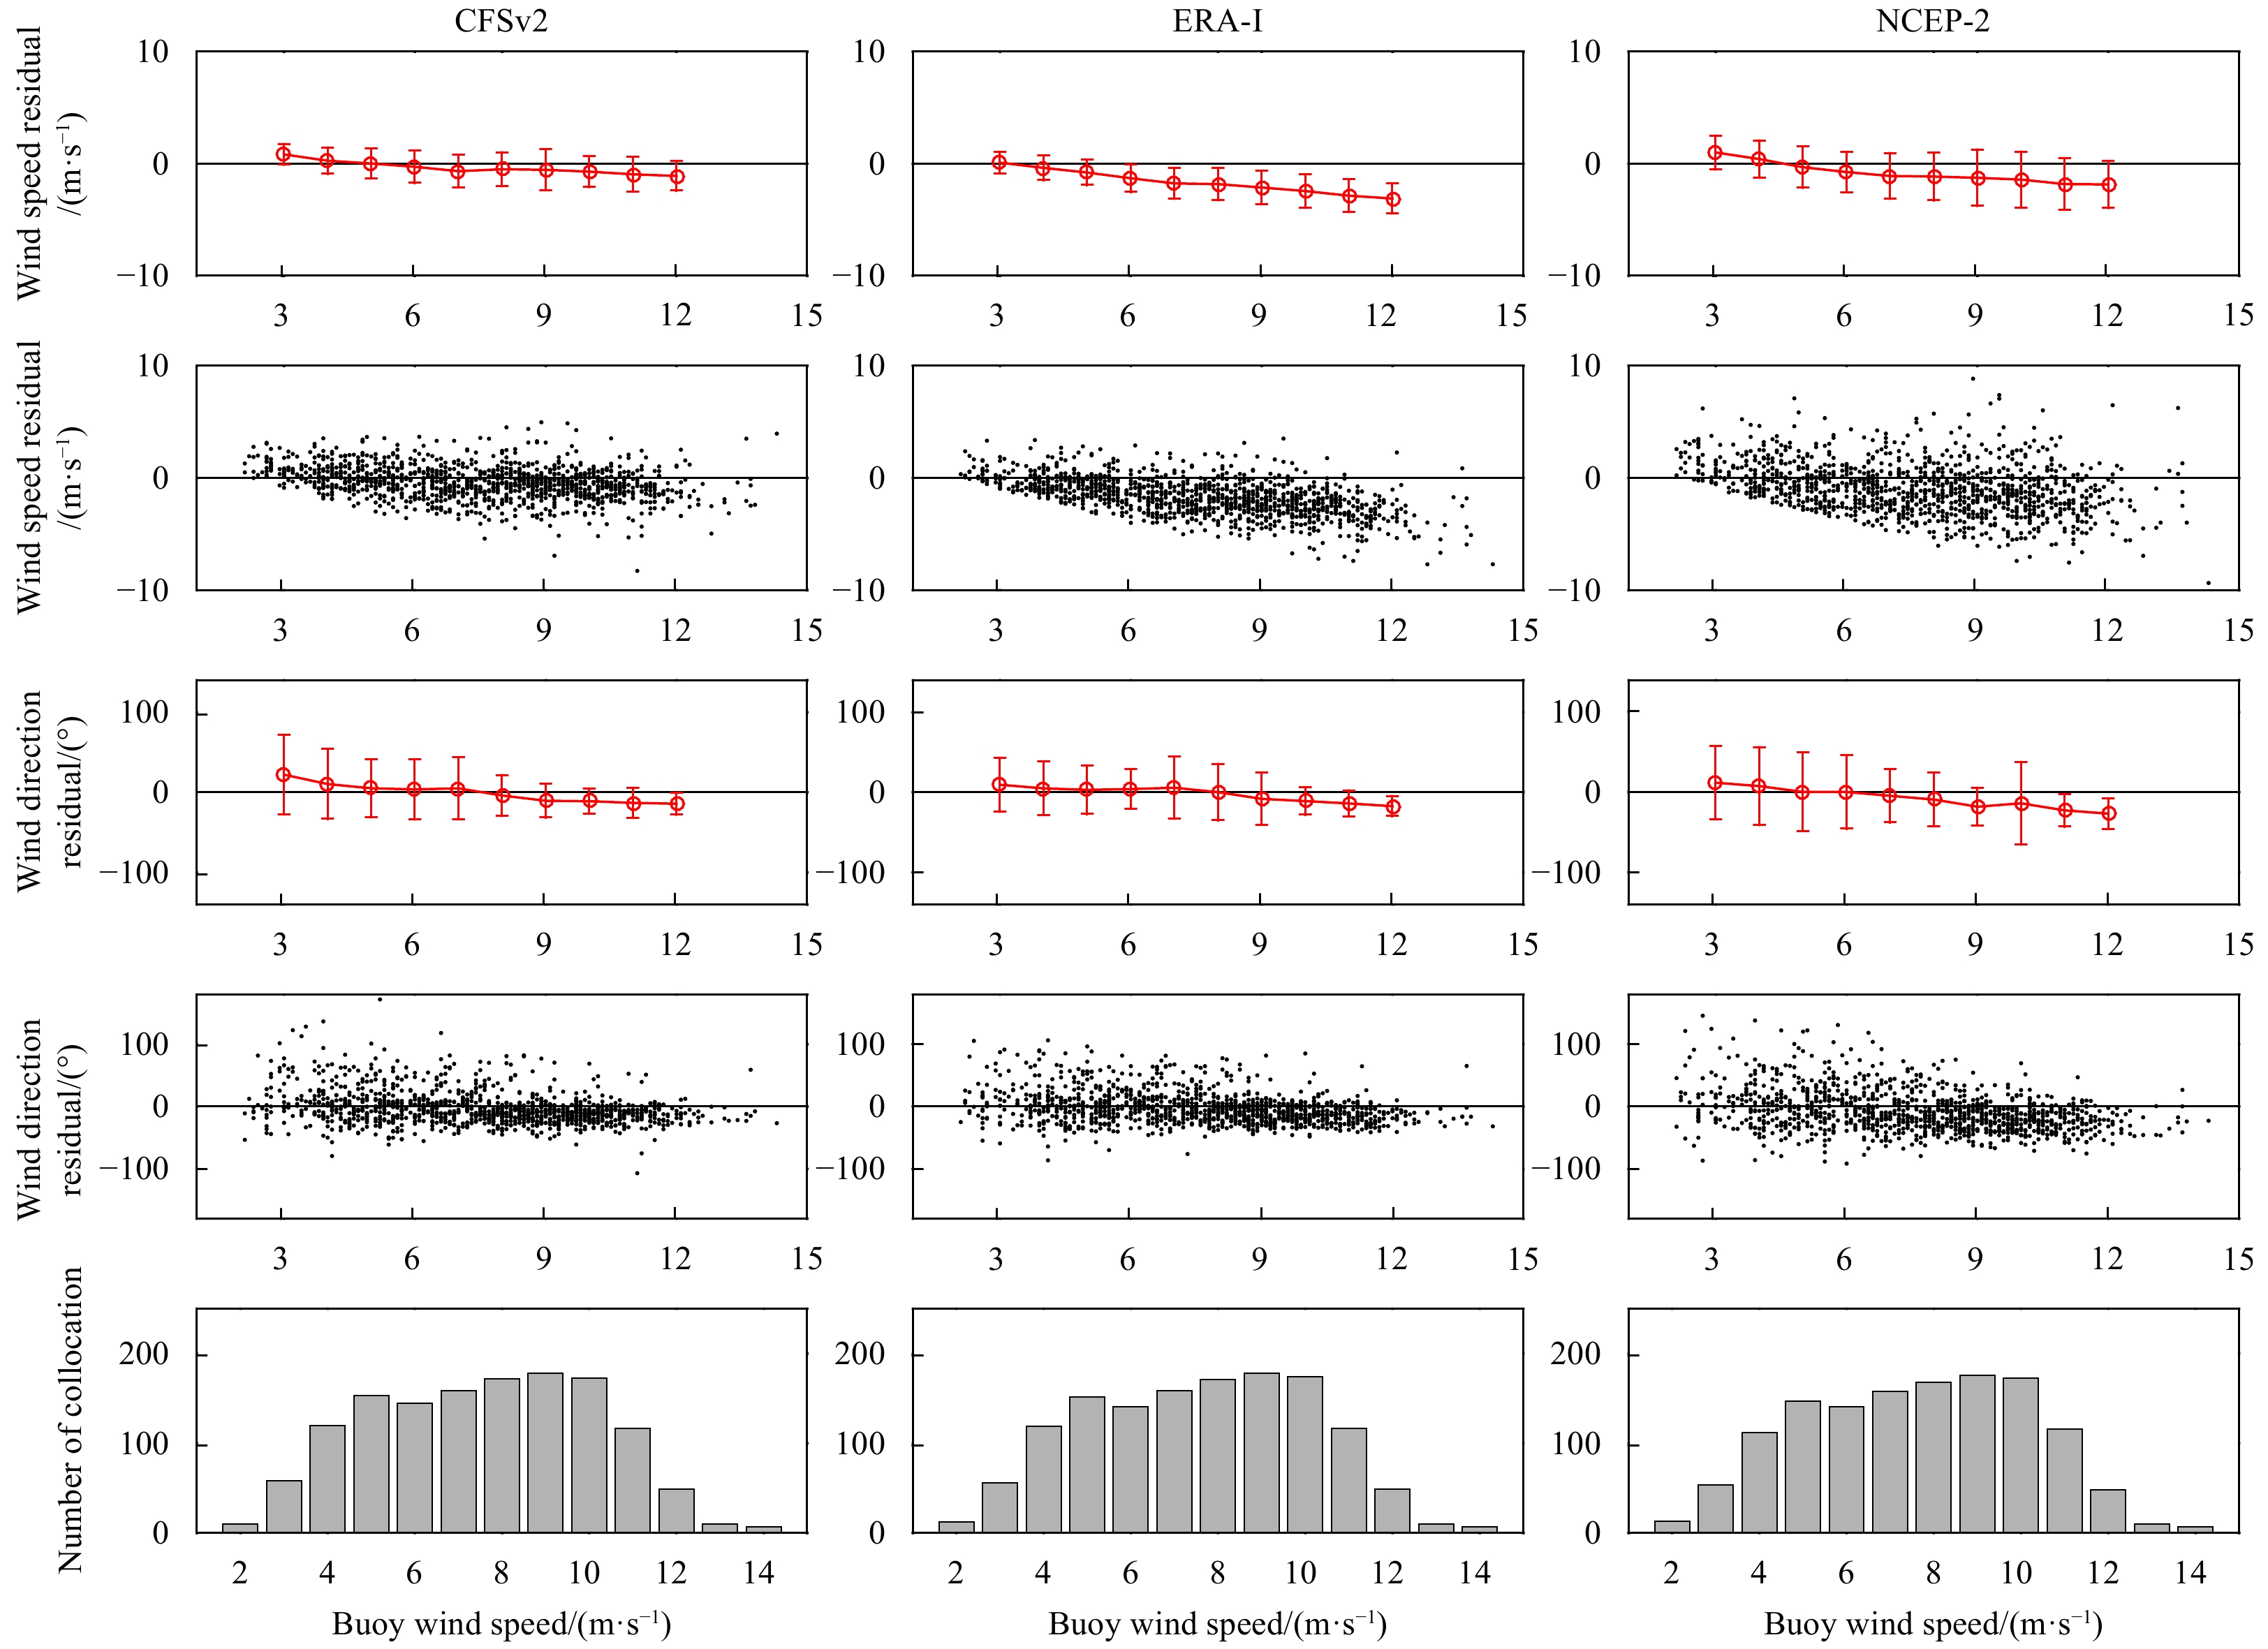
Figure 7. Dependence of the collocation numbers and wind speed and wind direction residuals (reanalysis-buoy) on the buoy wind speeds during 2012. Buoy wind speeds over 15 m/s (less than 1% of the whole sample) are ignored due to their small statistical value.
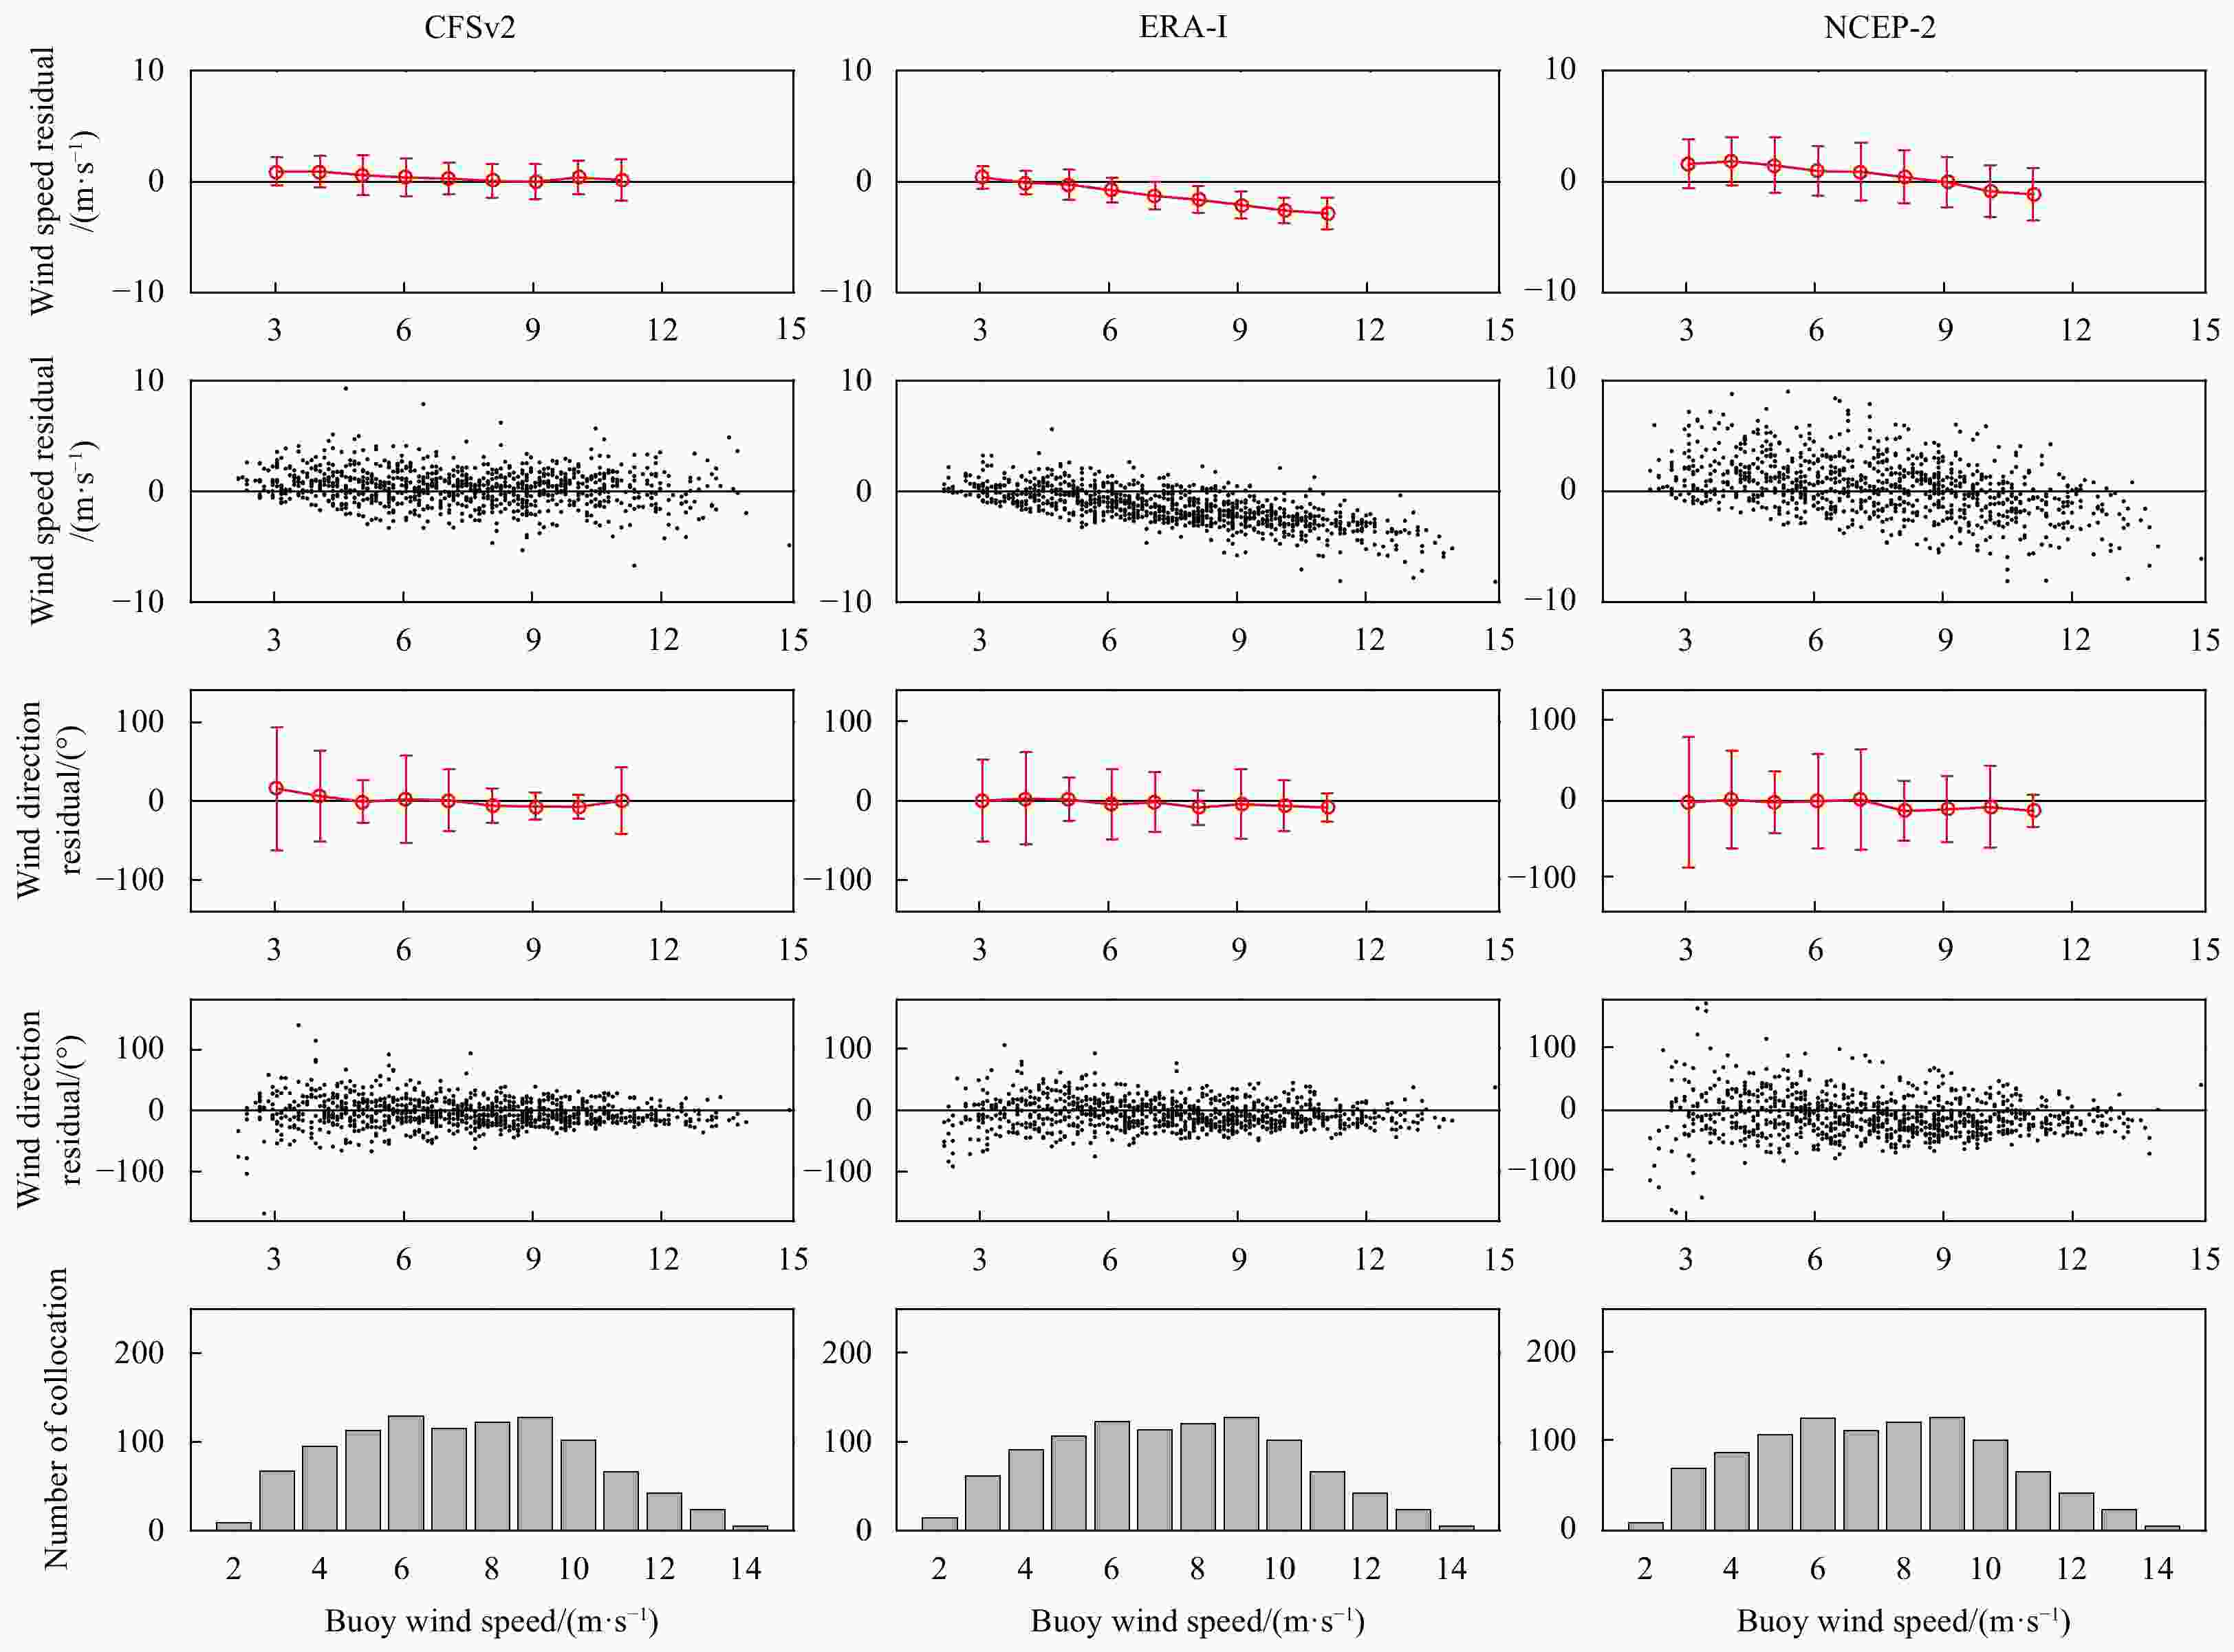
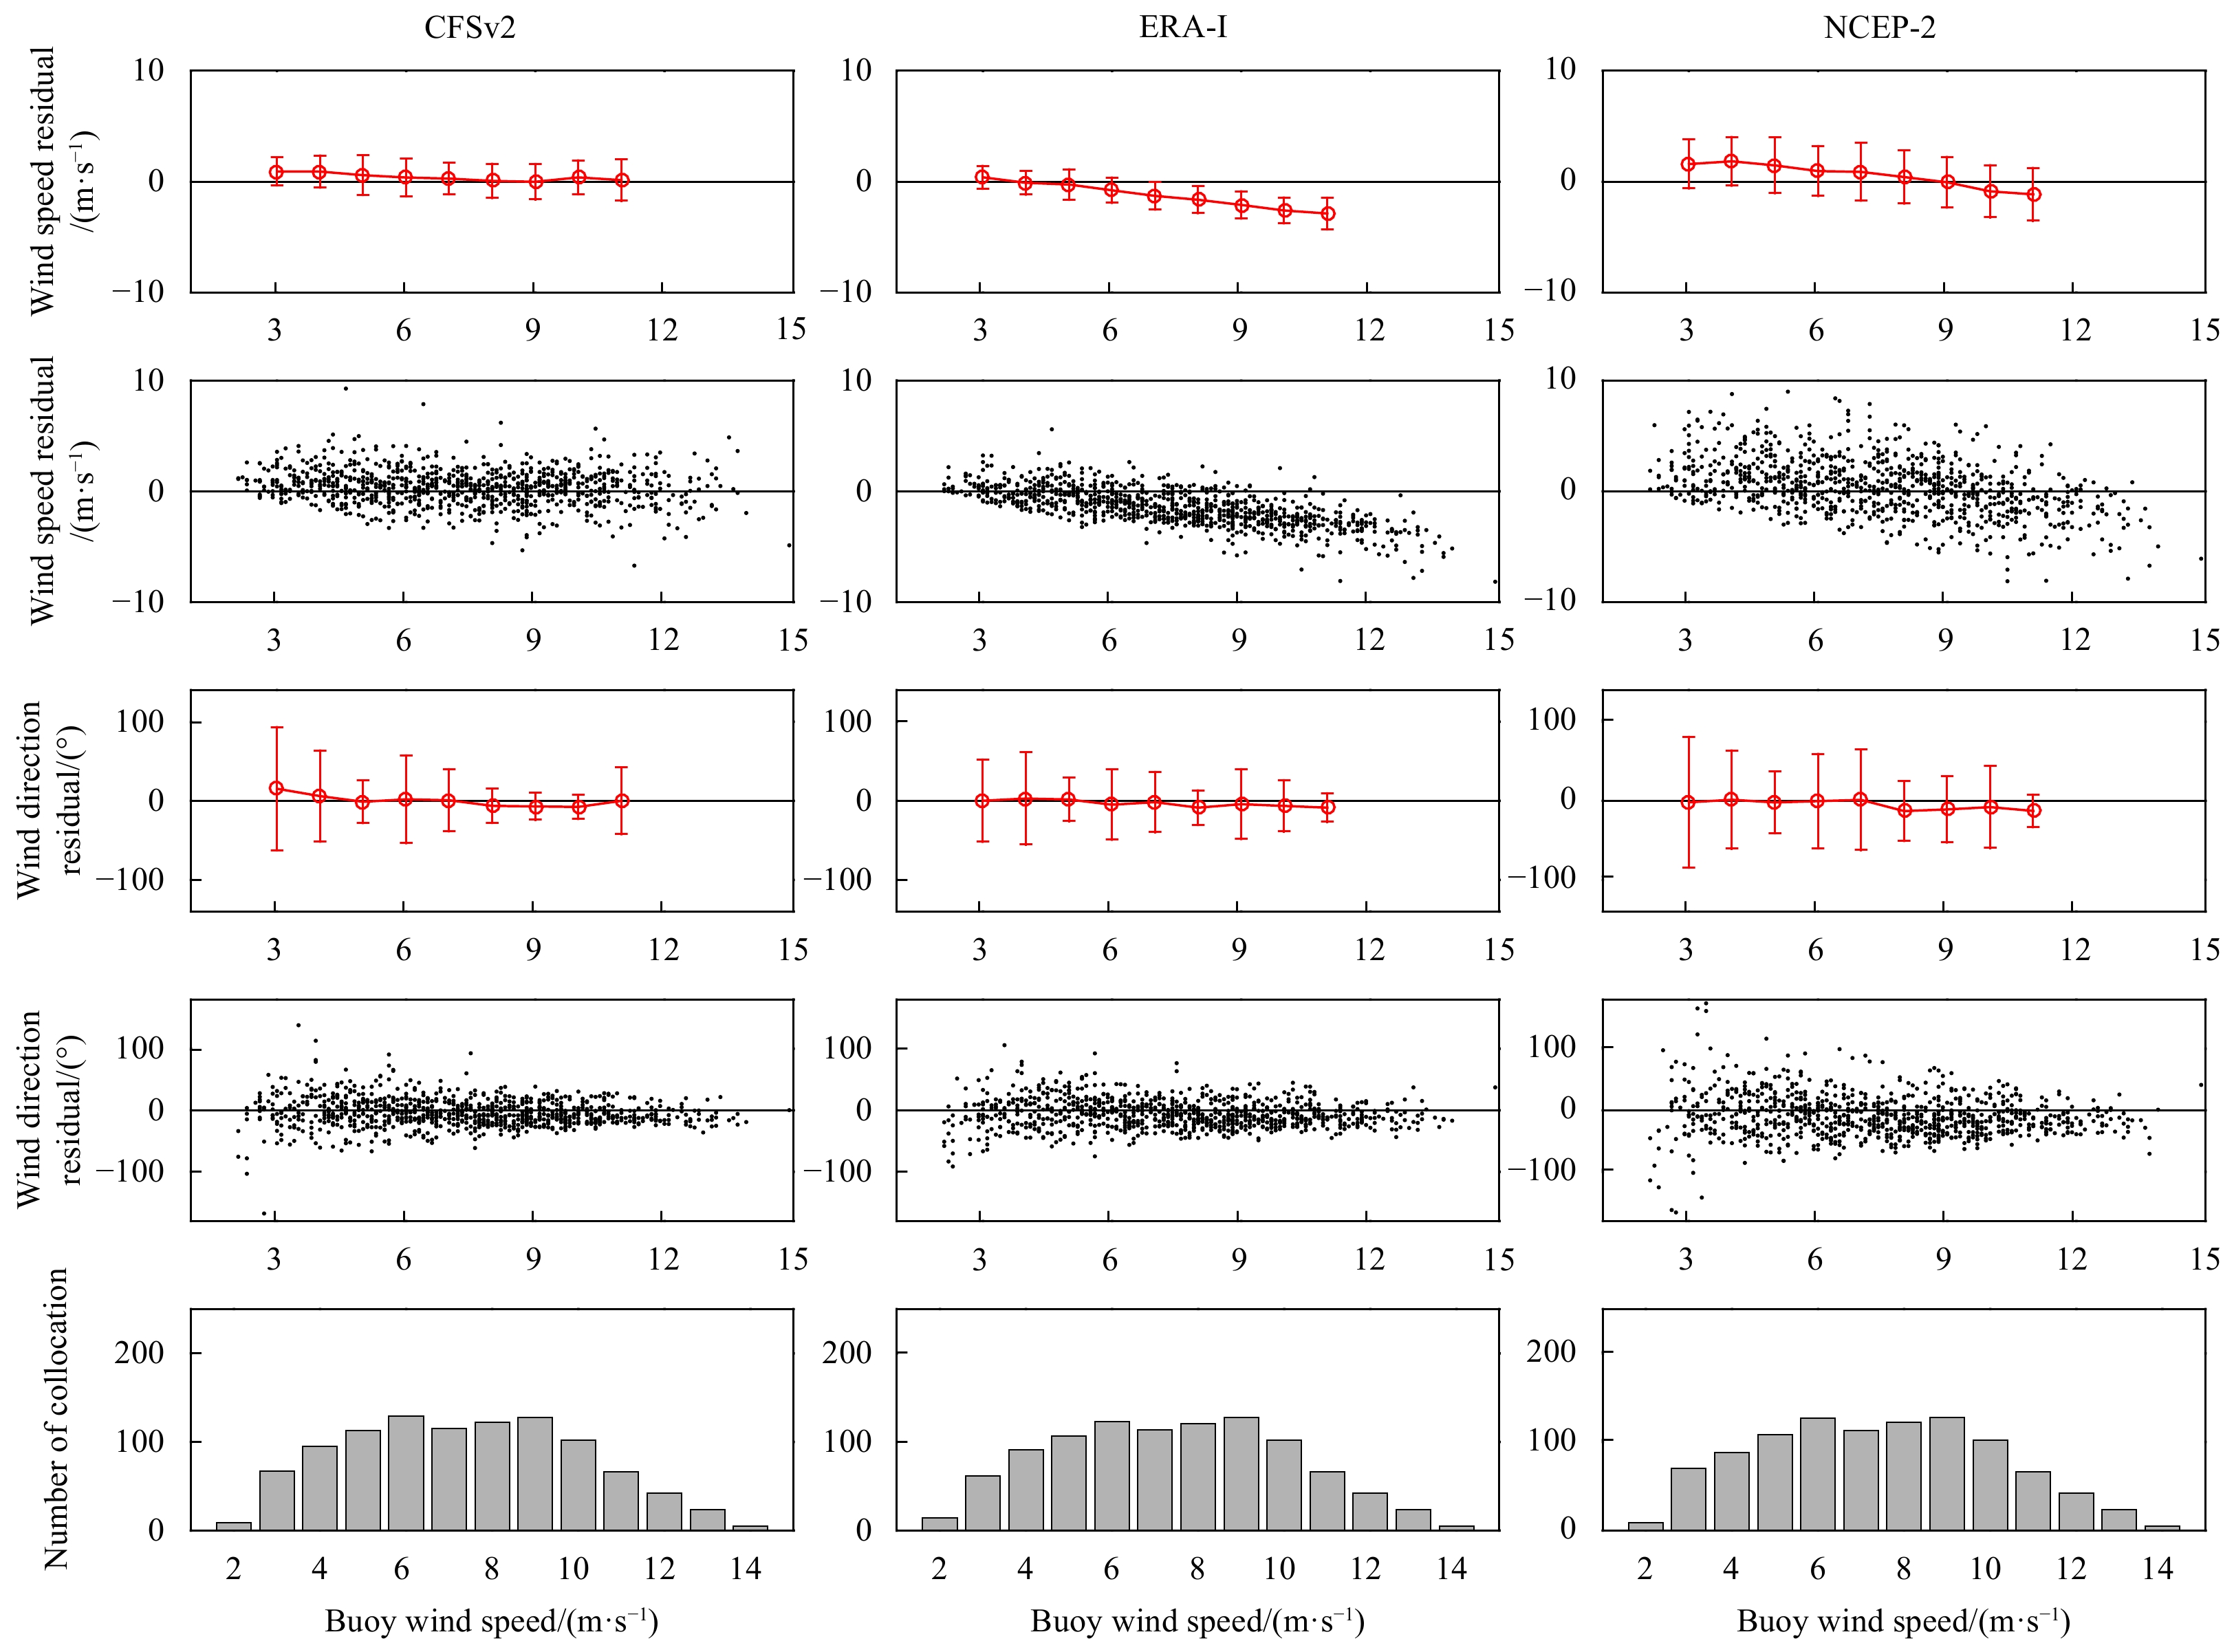
Figure 8. Dependence of the collocation numbers and wind speed and wind direction residuals (reanalysis-buoy) on the buoy wind speeds during 2013.
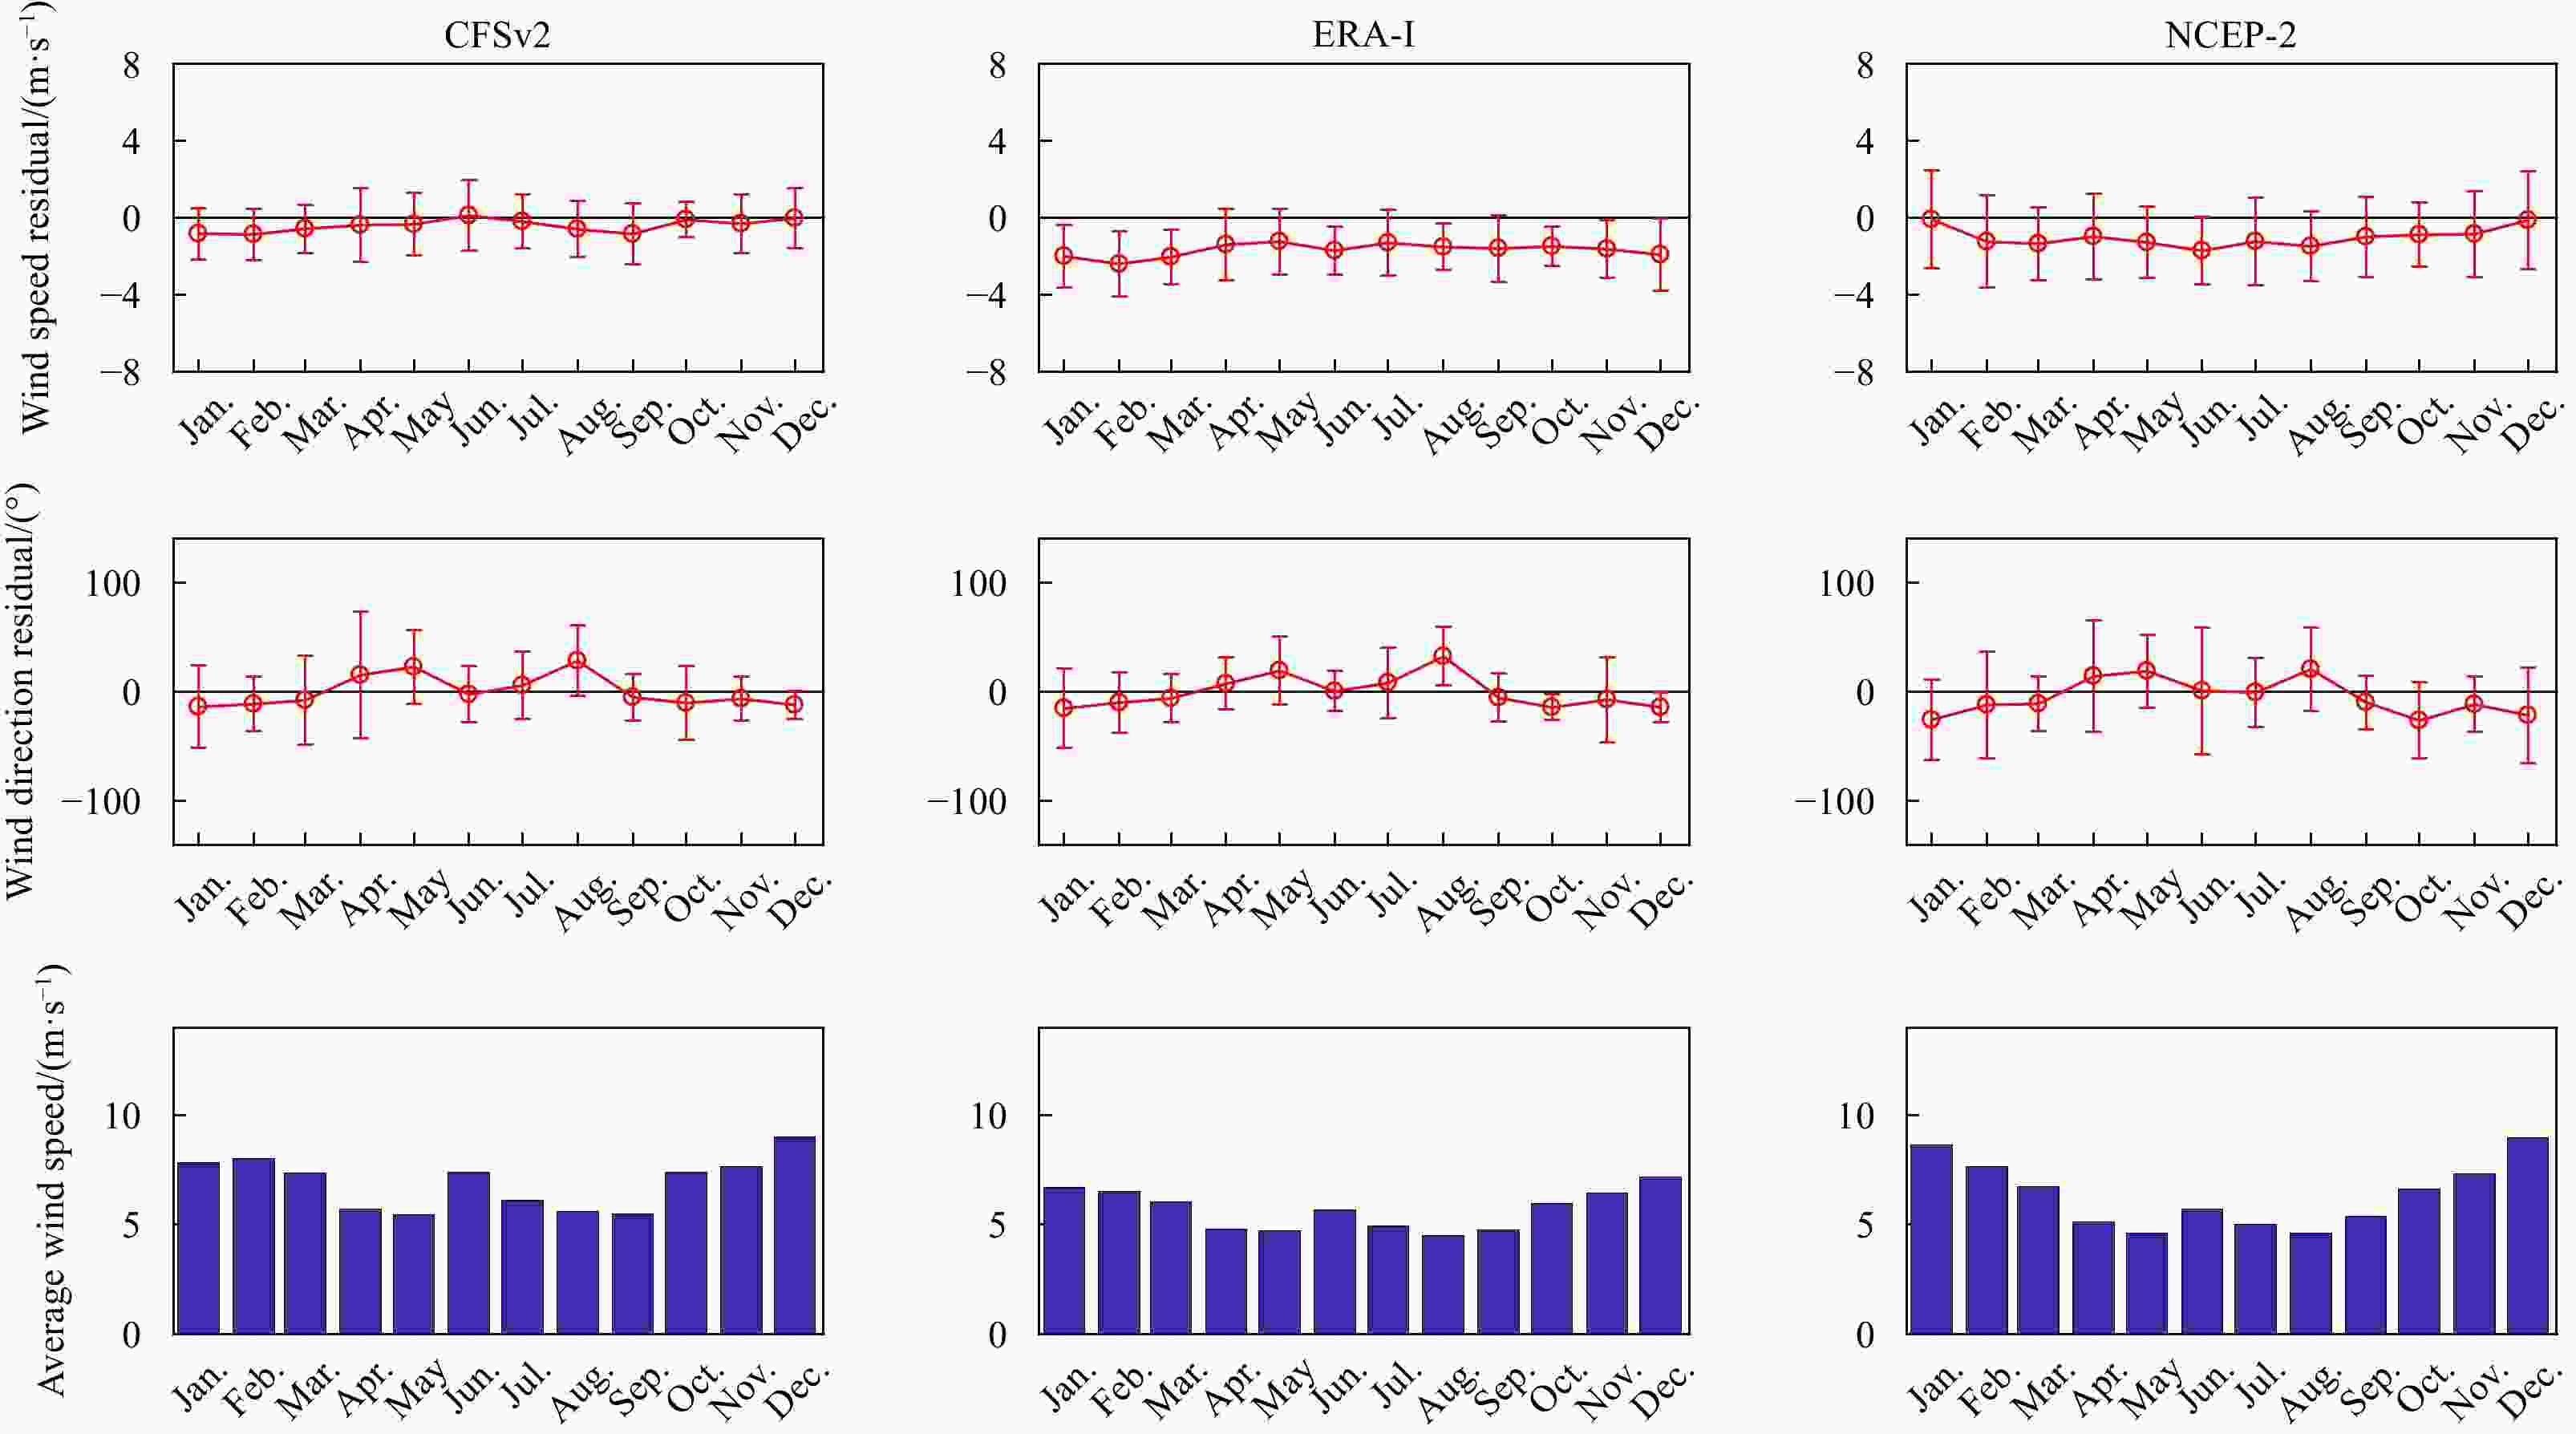
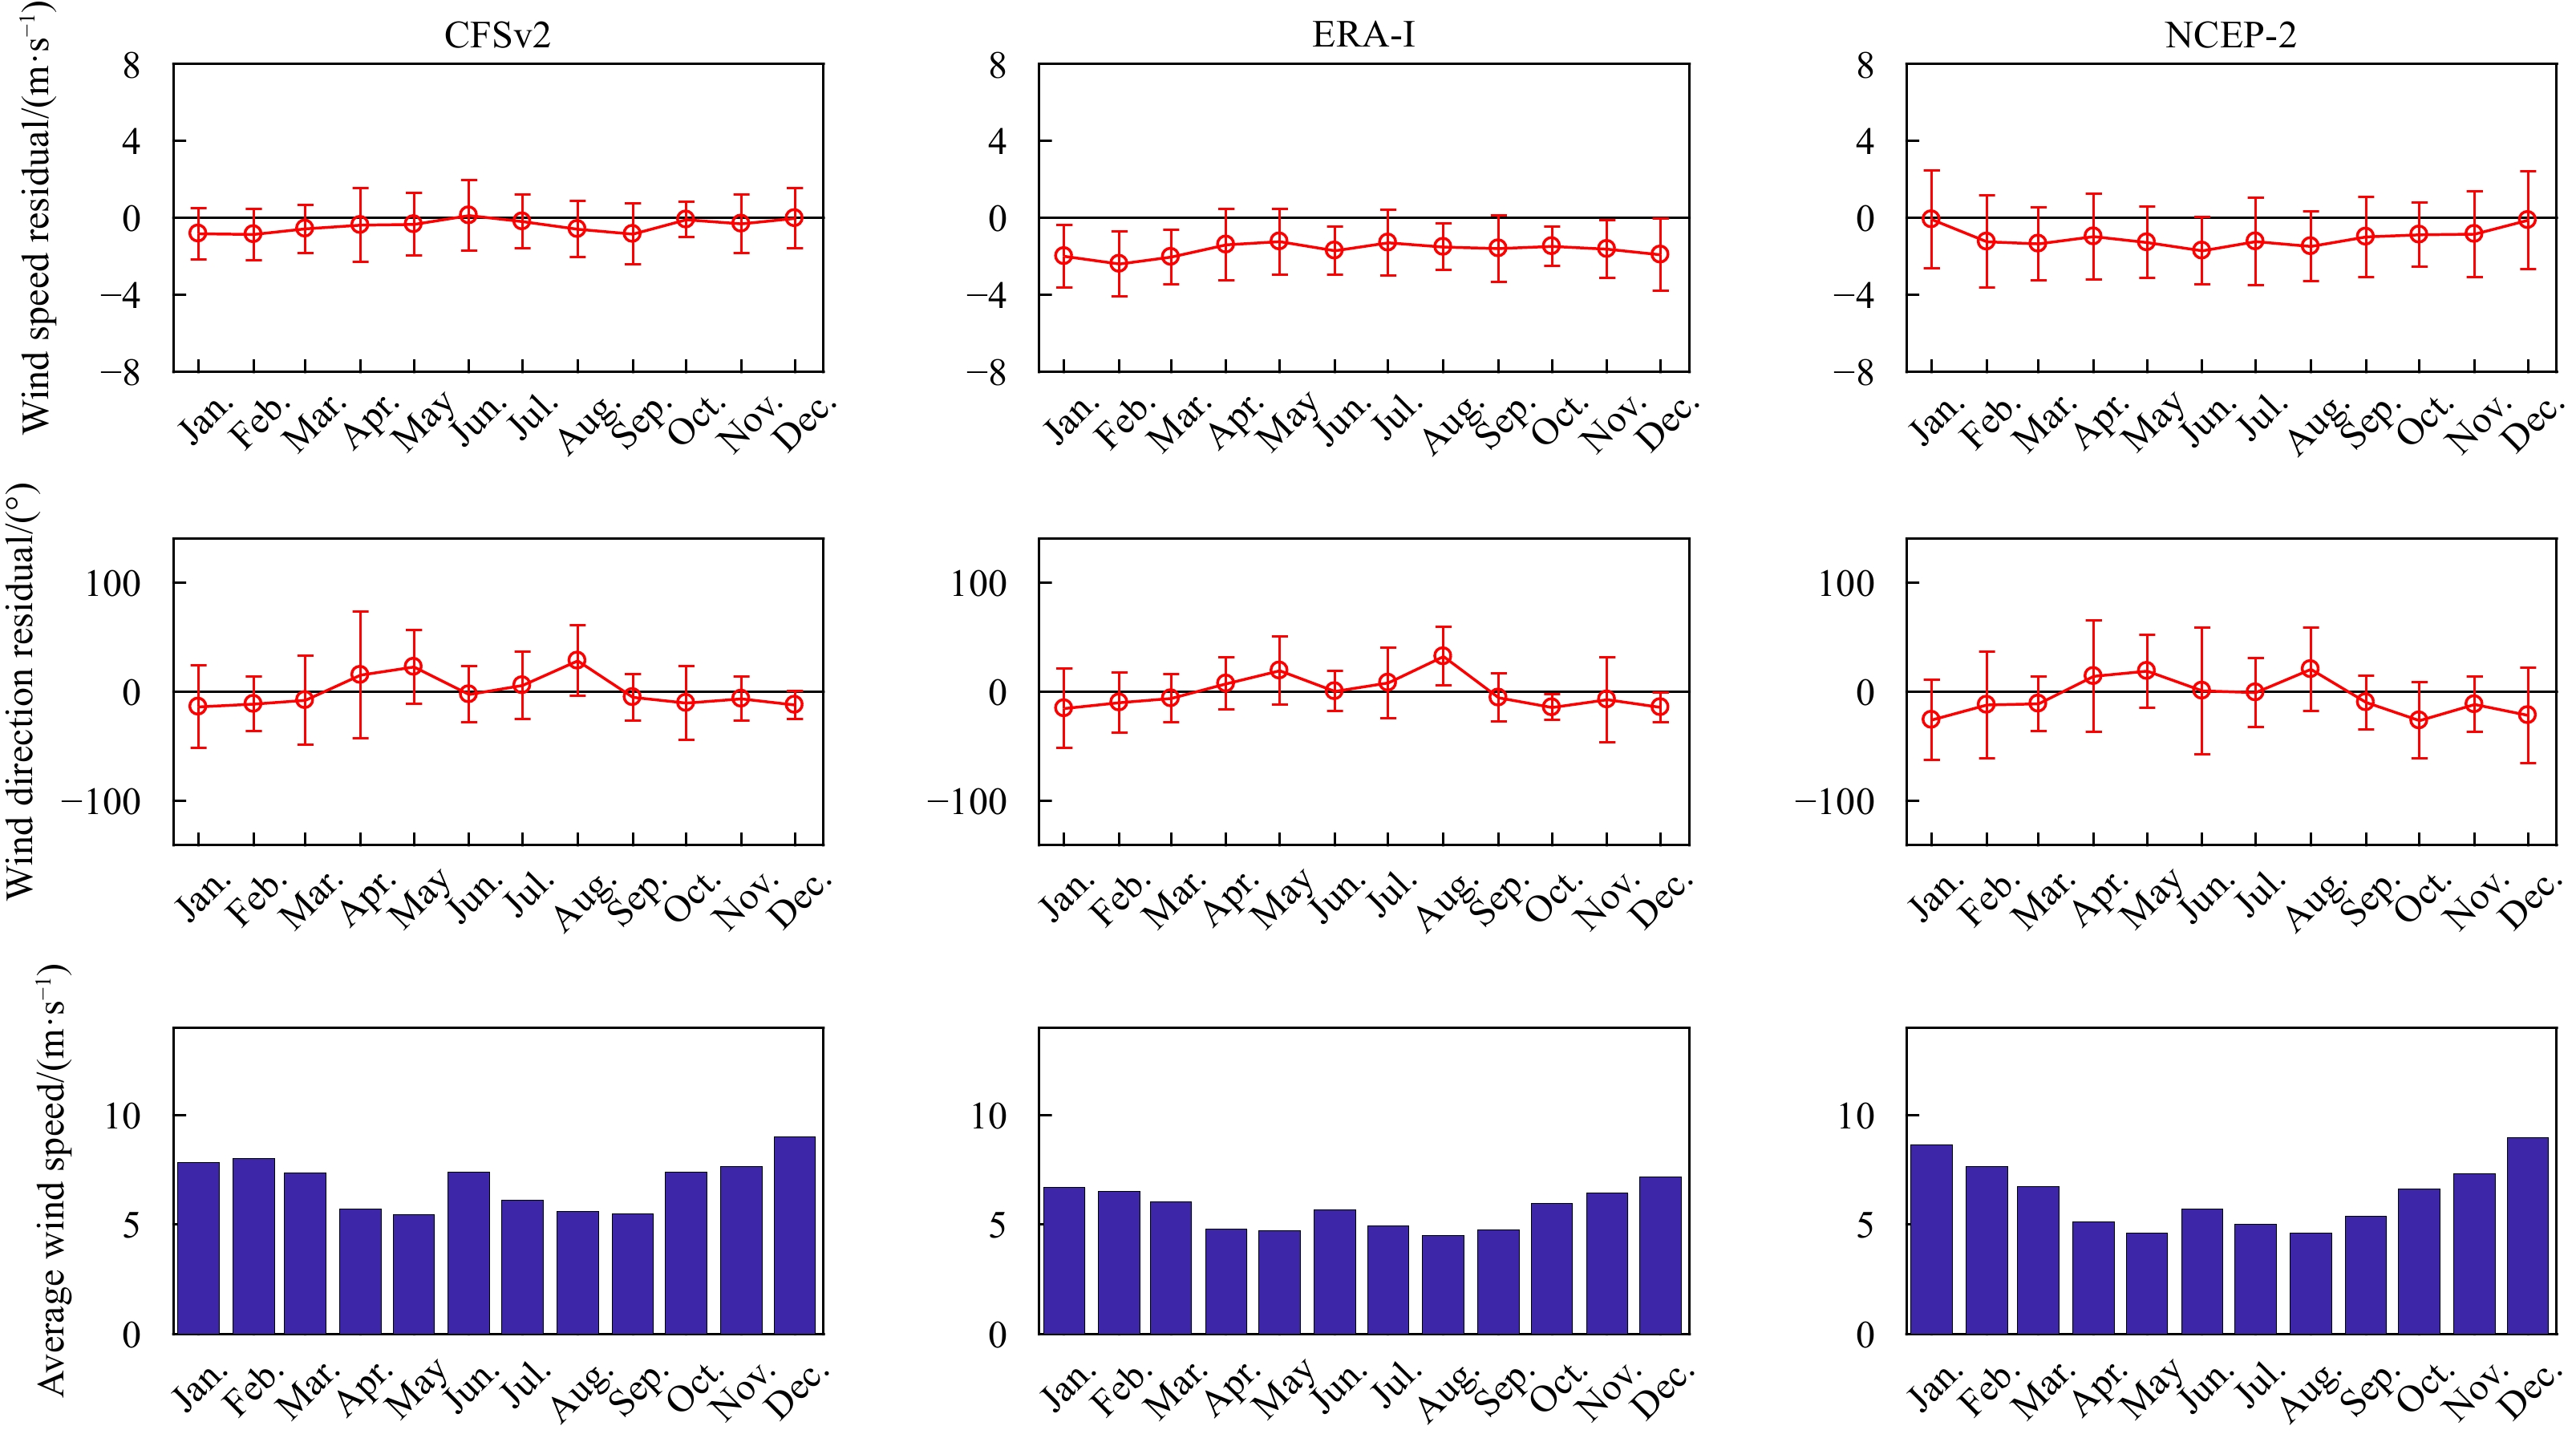
Figure 9. Errors of the three reanalysis wind vectors (reanalysis-buoy) and the average wind speeds in different months of 2012.
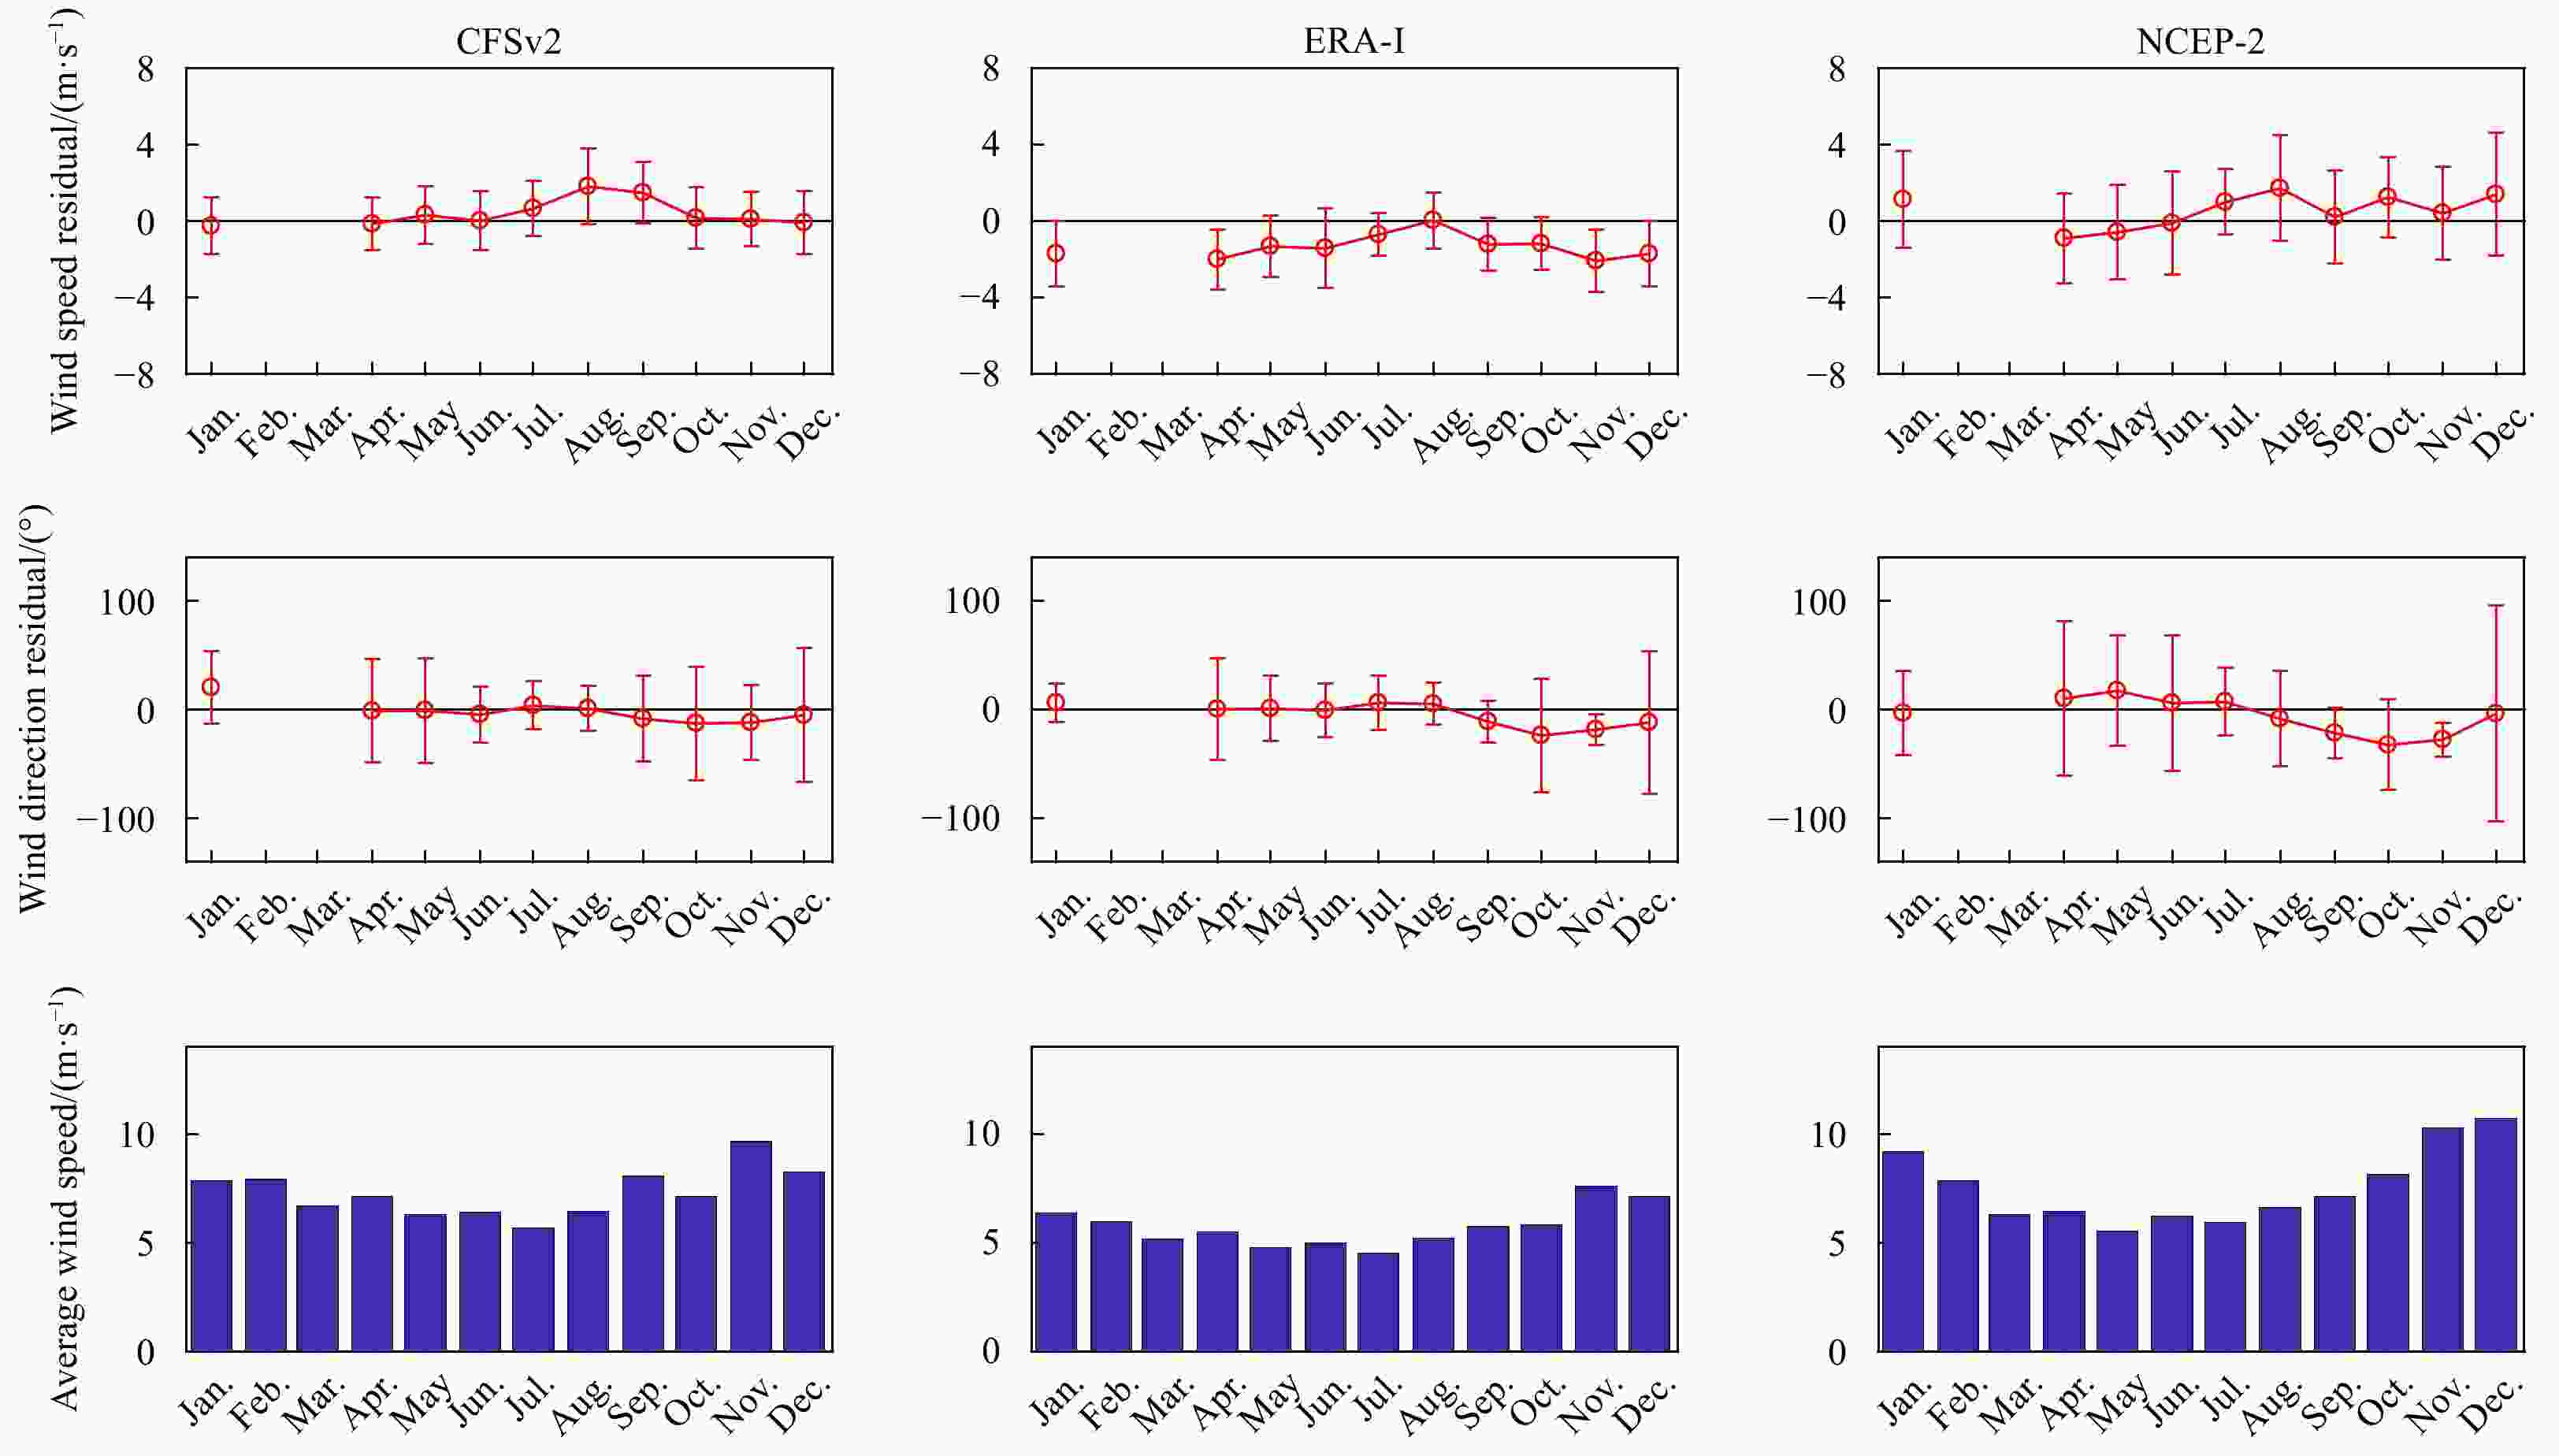
Figure 10. Errors of the three reanalysis wind vectors (reanalysis-buoy) and the average wind speeds in different months of 2013. Months without bars denote no buoy wind data during these periods.
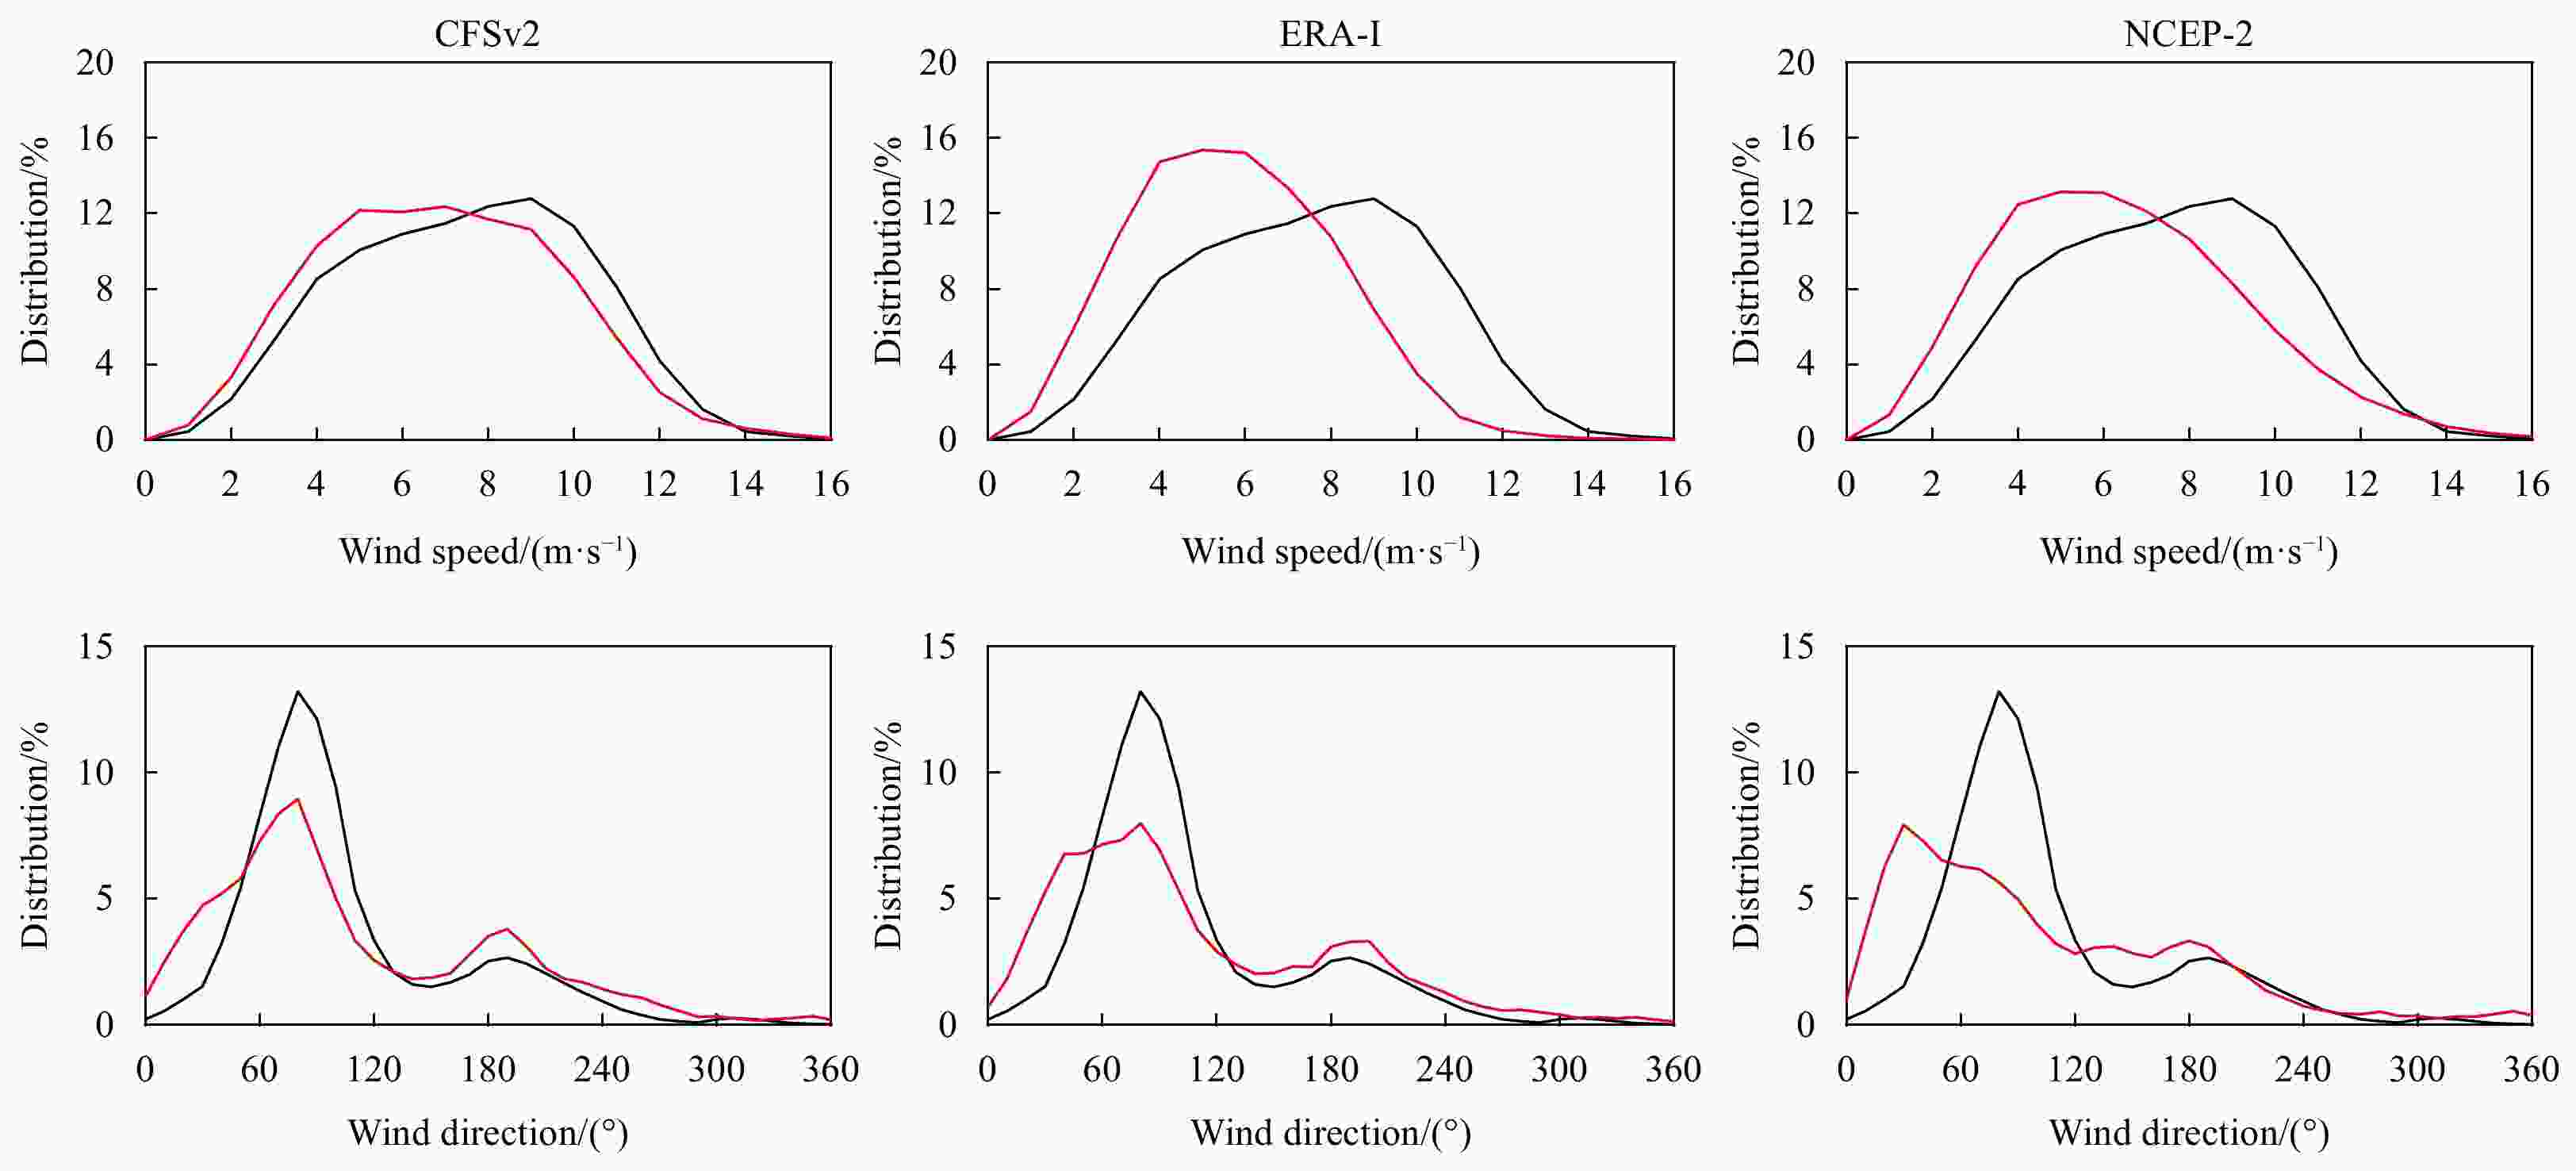
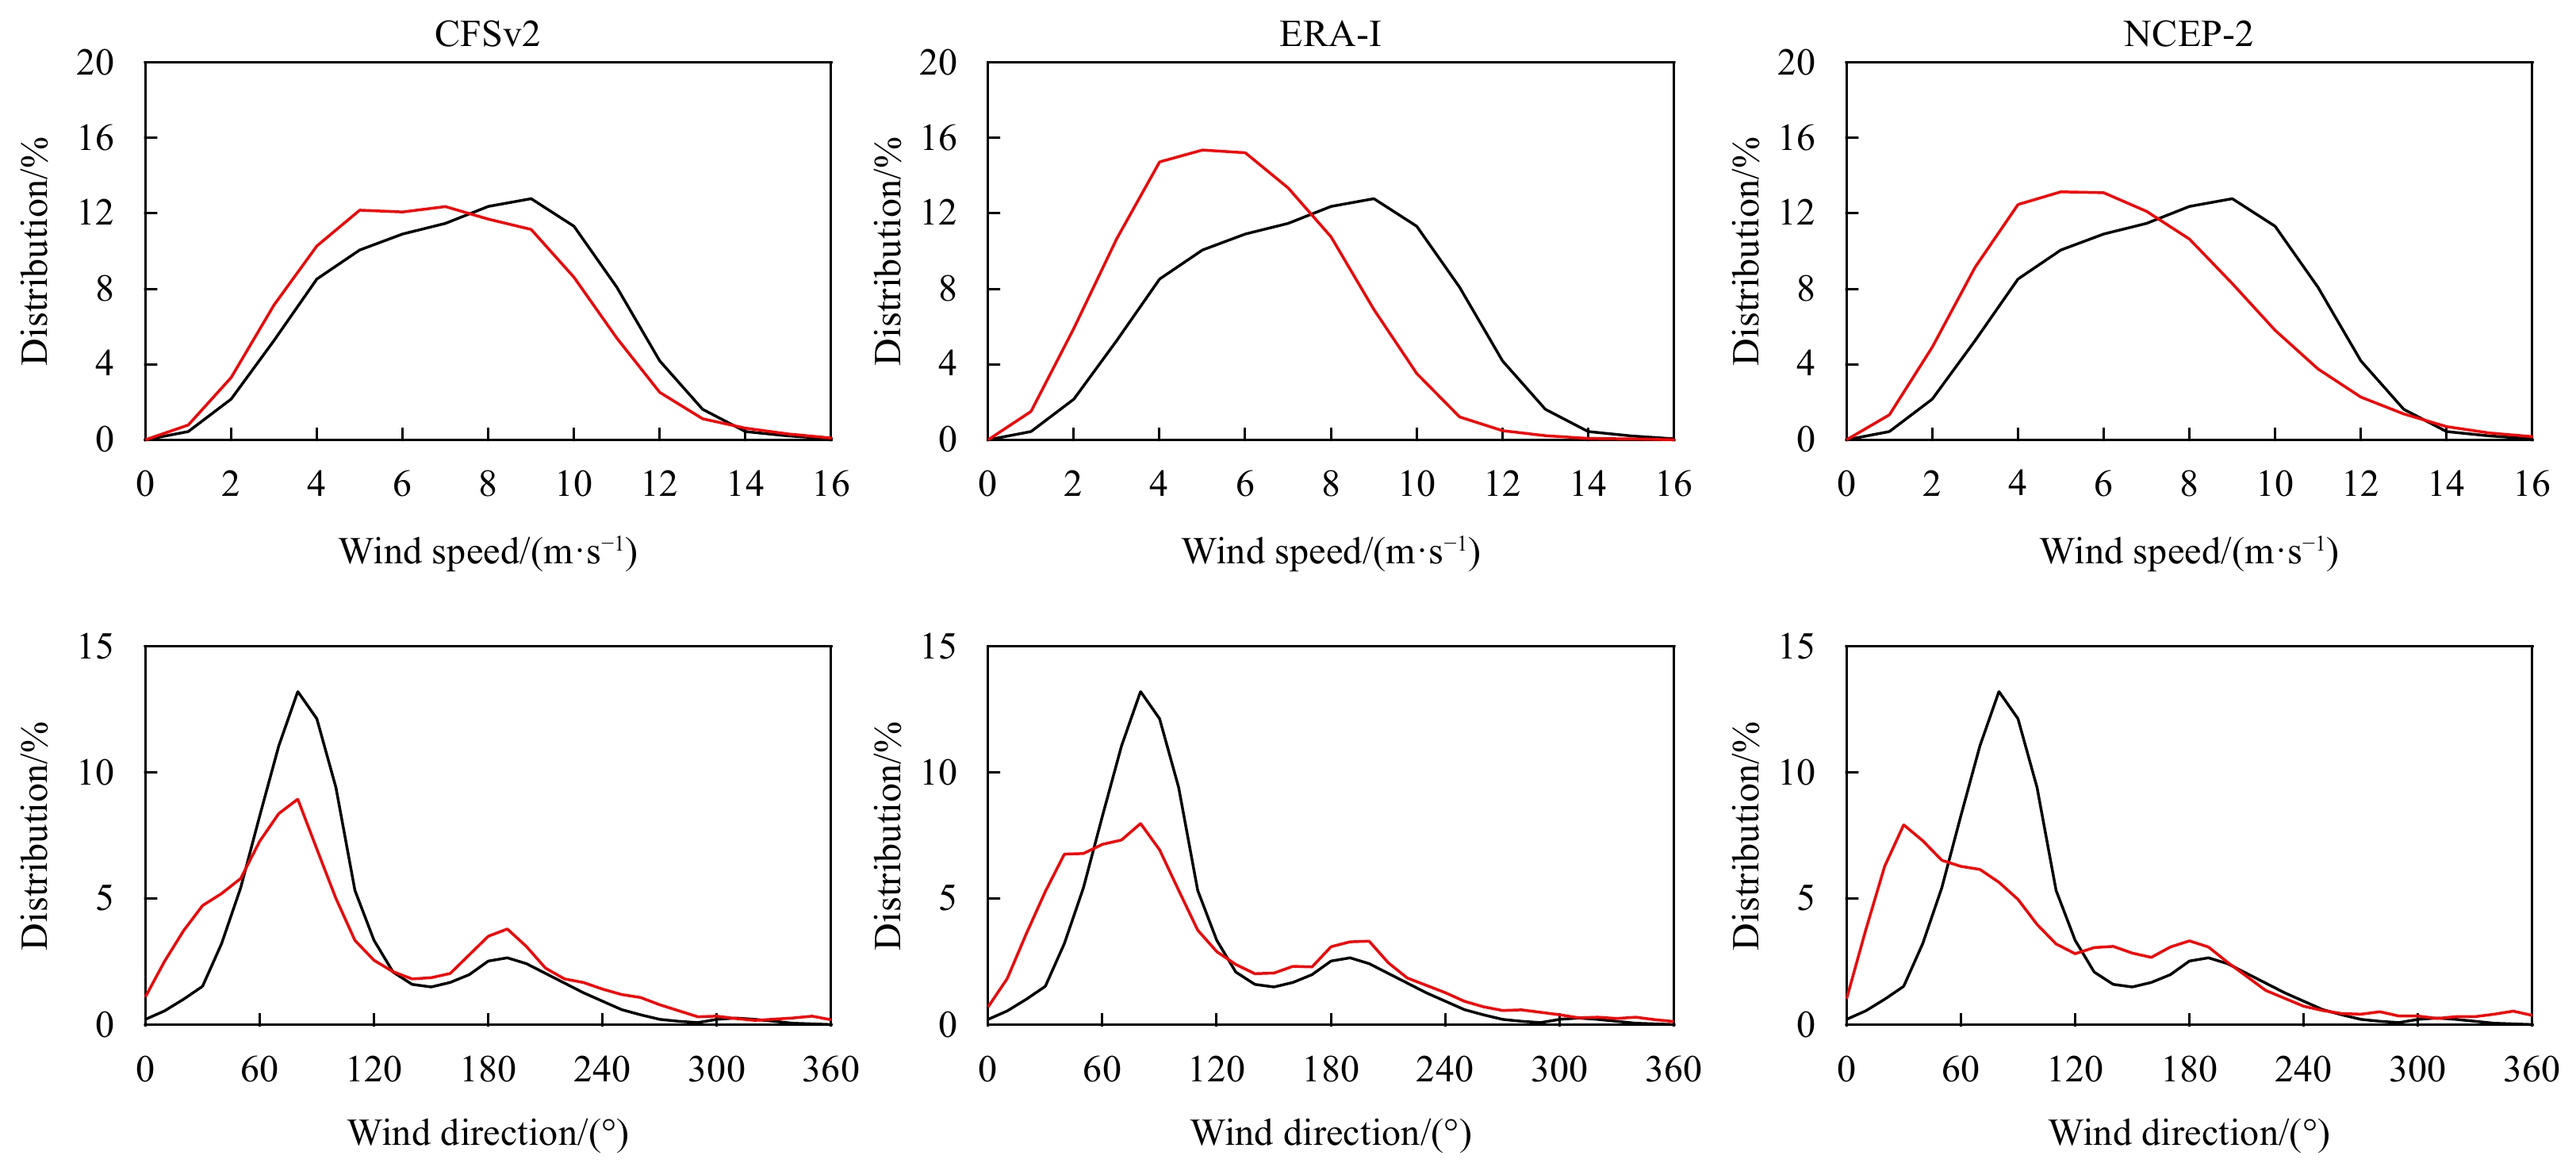
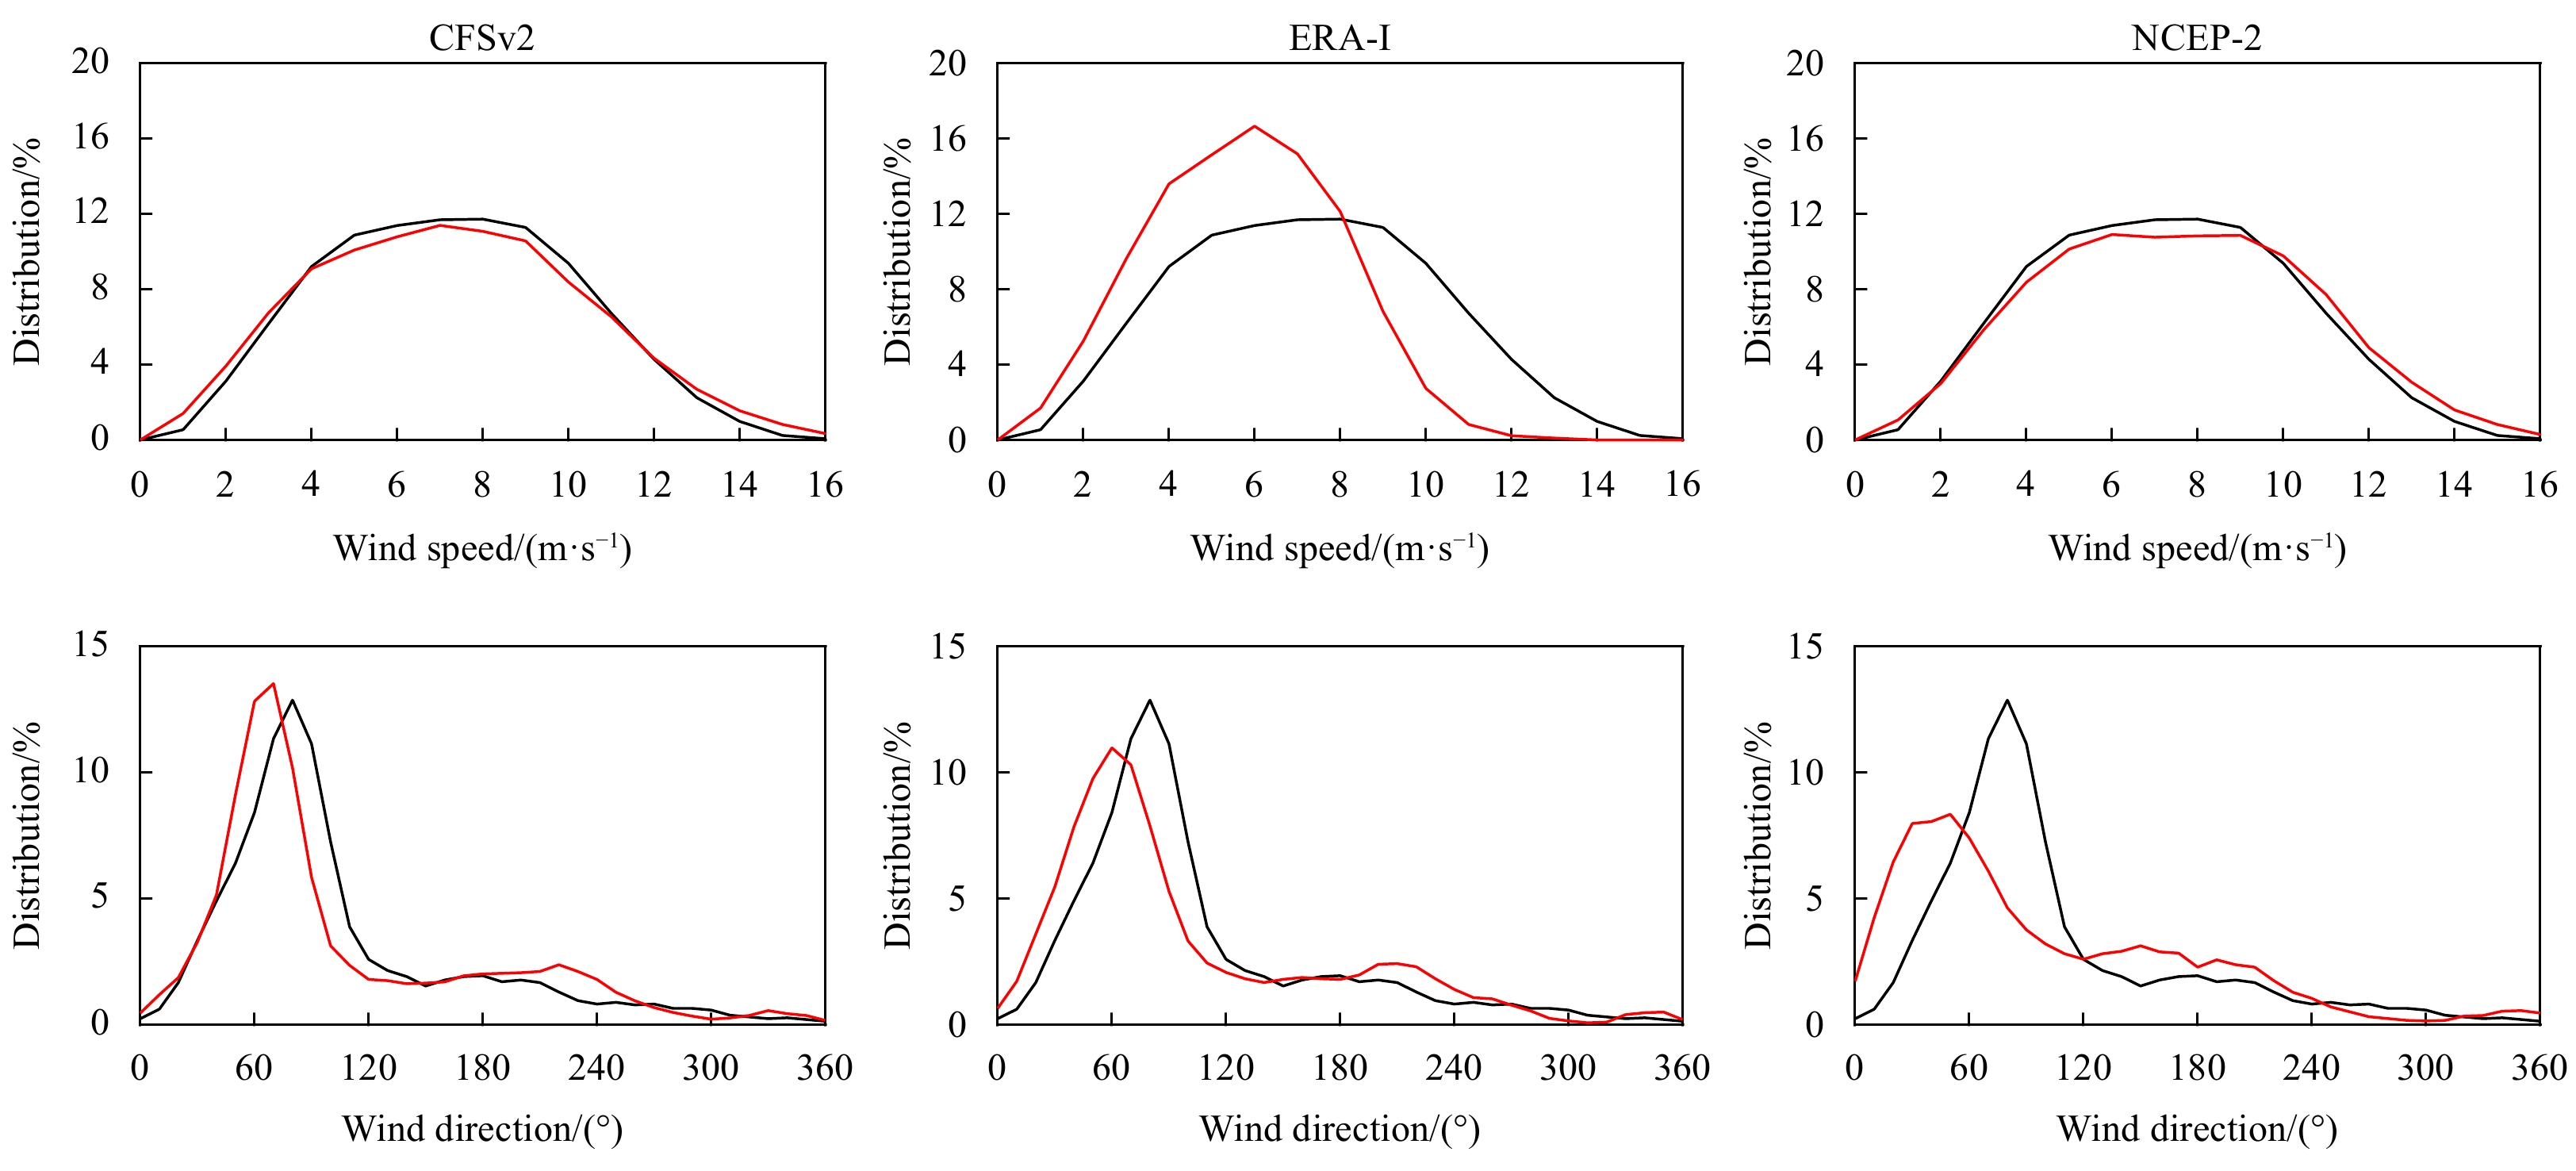
Figure 11. PDFs of the reanalysis and buoy wind speeds and directions during 2012 in the bins of 1 m/s and 10°, respectively. The black and red lines denote the buoy winds and reanalysis winds, respectively.
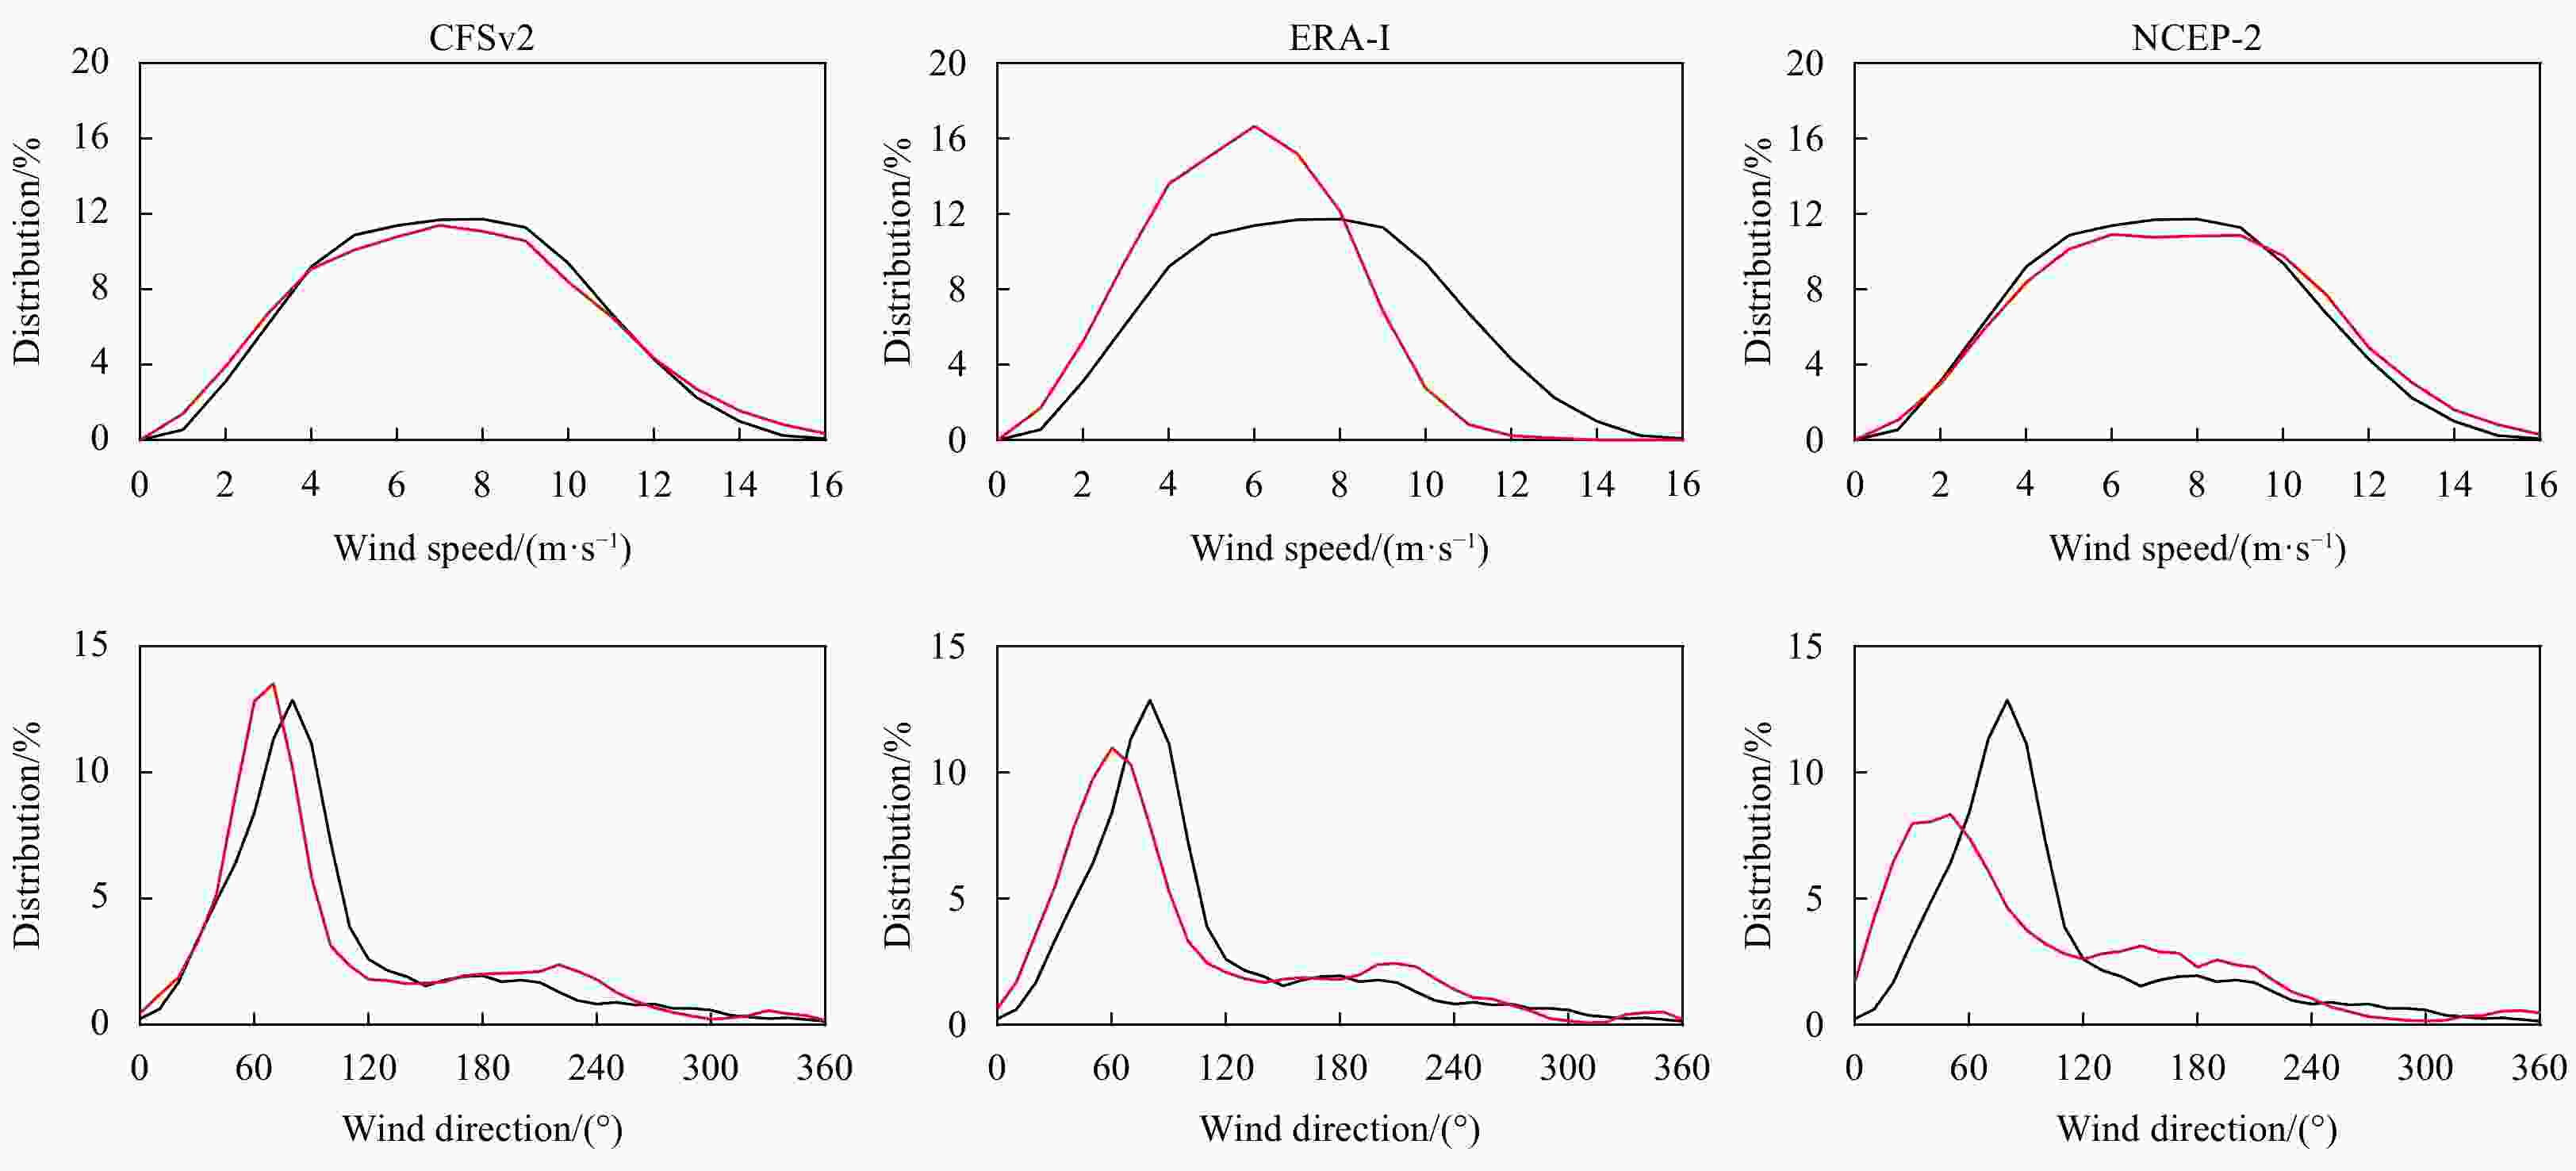
Figure 12. PDFs of the reanalysis and buoy wind speeds and directions during 2013 in the bins of 1 m/s and 10°, respectively. The black and red lines denote the buoy winds and reanalysis winds, respectively.

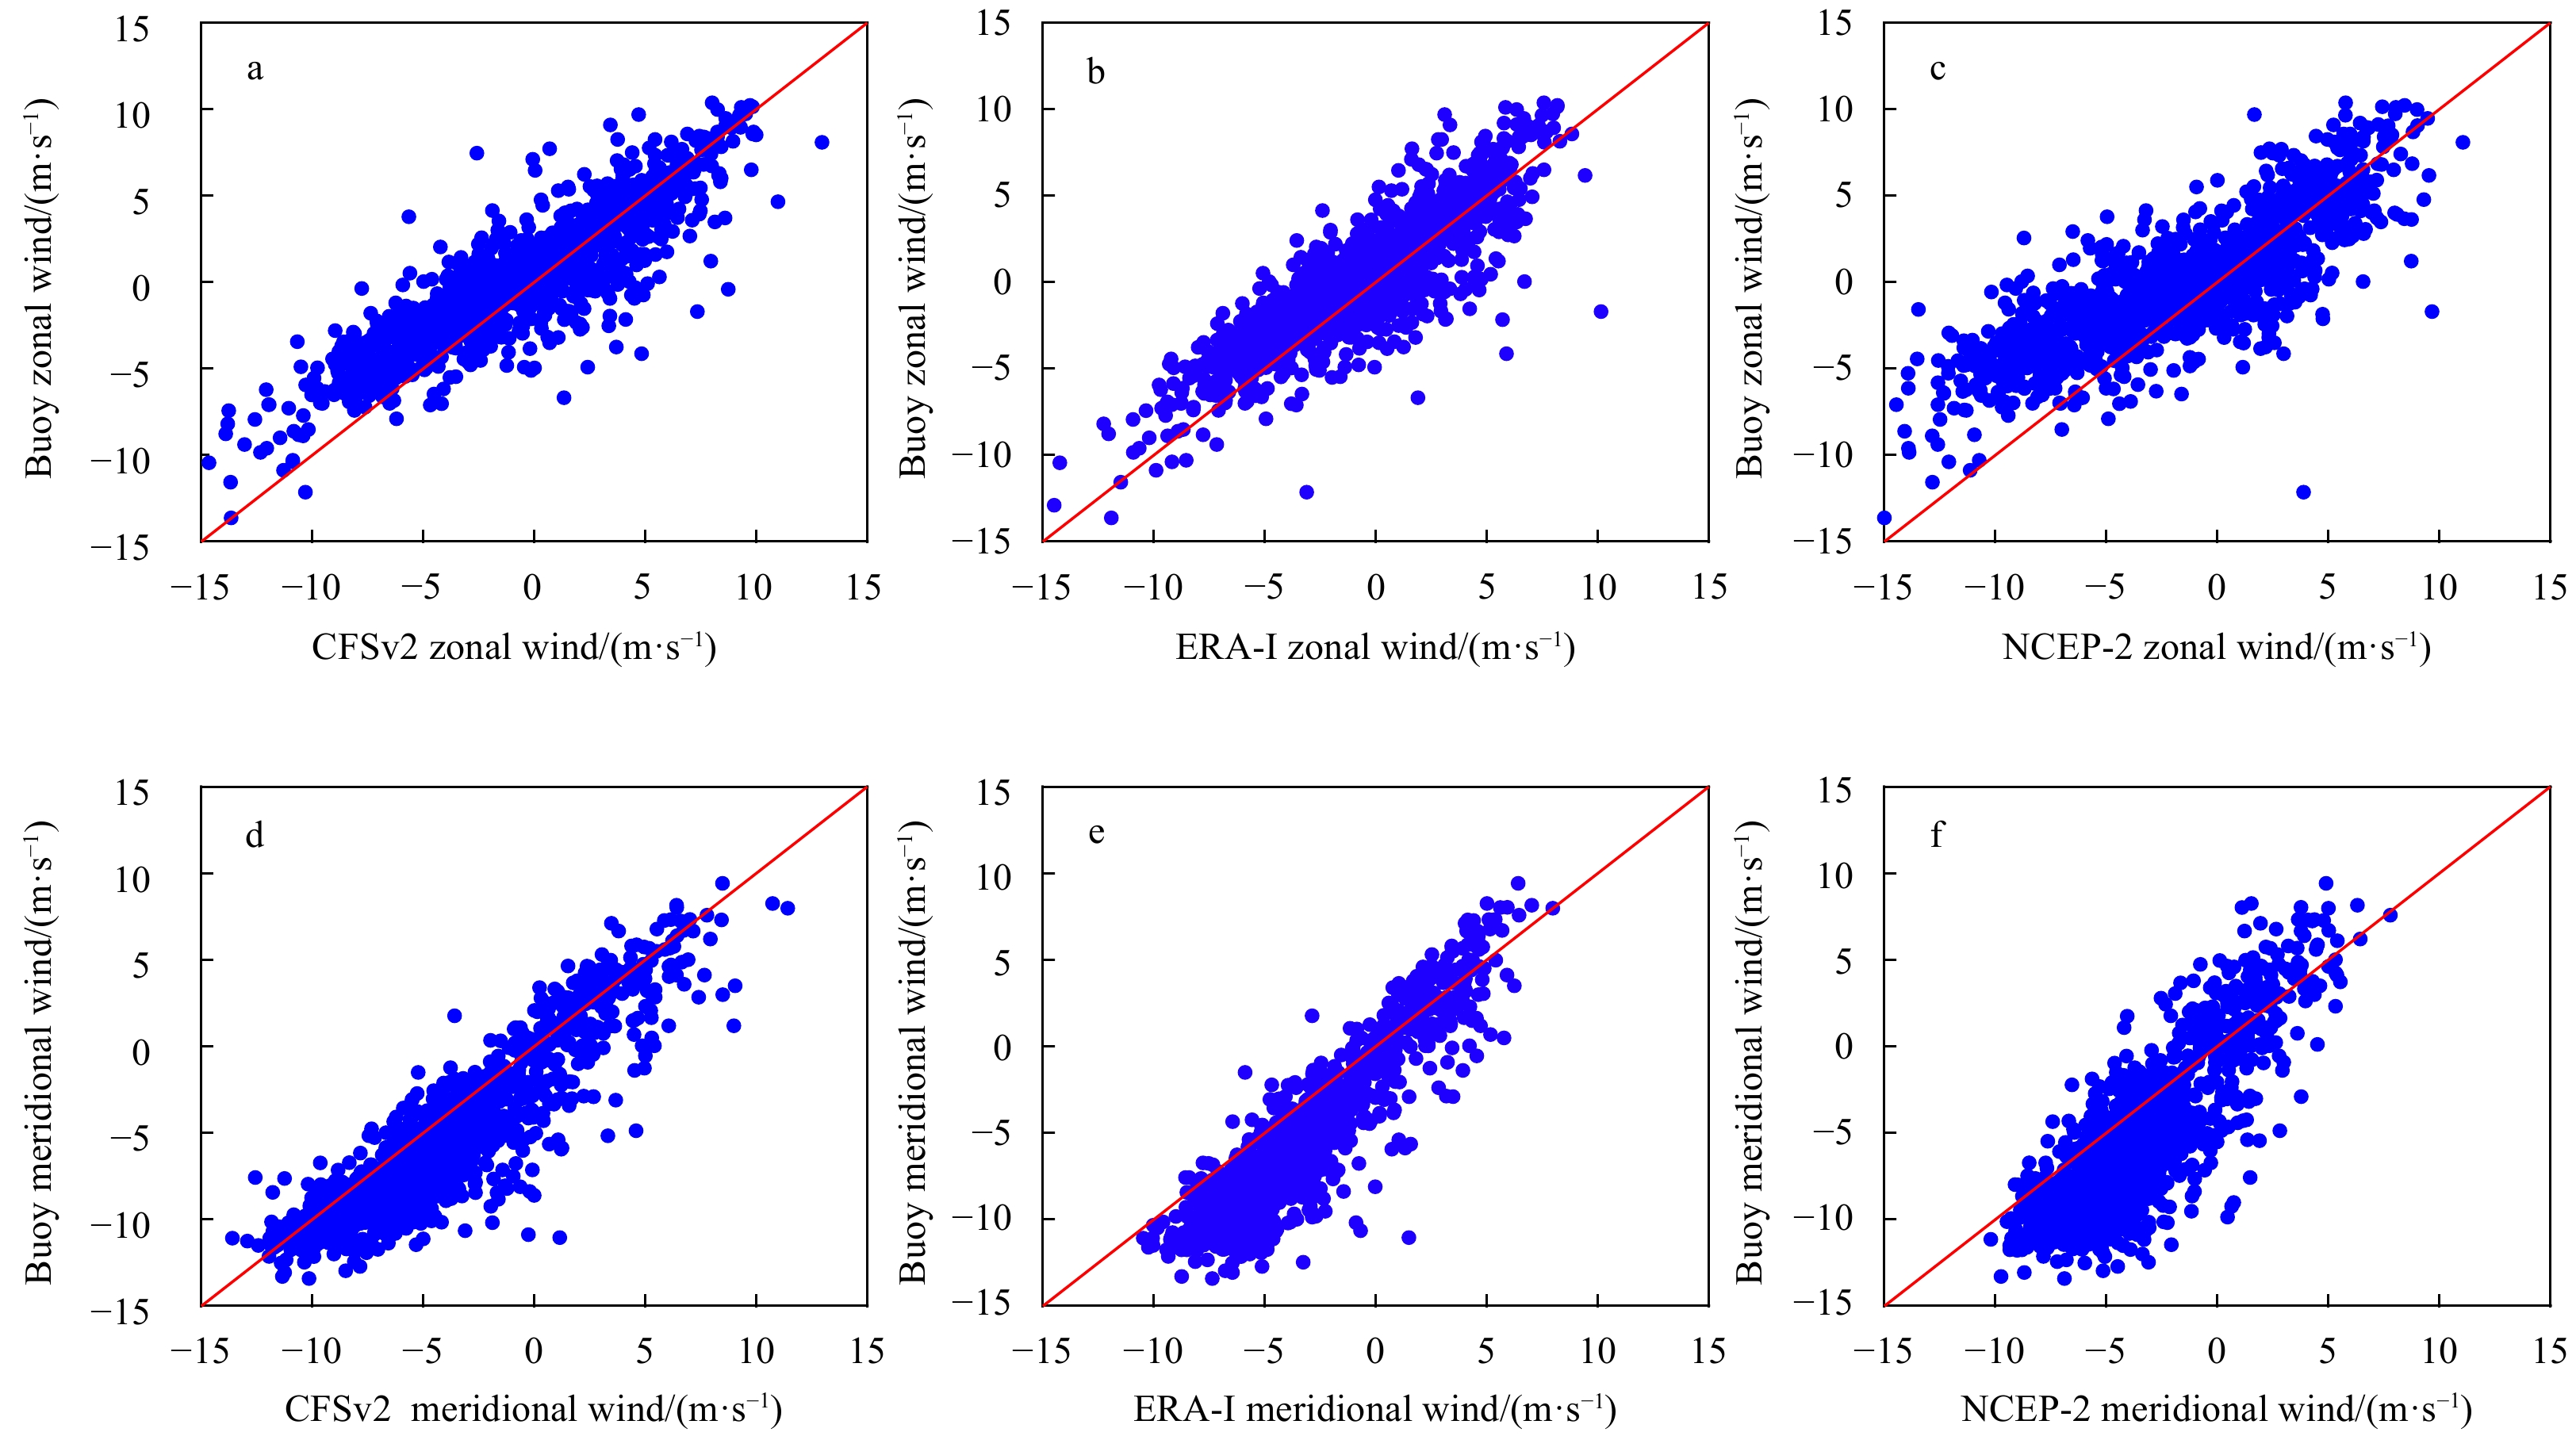
Figure 13. Scatterplots for the zonal and meridional wind in the comparisons between the reanalysis and wind data from Buoy 302 in 2012. a. CFSv2 zonal wind; b. ERA-I zonal wind; c. NCEP-2 zonal wind; d. CFSv2 meridional wind; e. ERA-I meridional wind; and f. NCEP-2 meridional wind.
Table 1. Variation of buoy location from 2012 to 2014
Buoy ID 2012 2013 2014 301 22.17°N, 115.36°E 22.17°N, 115.36°E – 302 21.30°N, 113.60°E 21.30°N, 113.60°E – 303 21.07°N, 112.38°E 21.07°N, 112.38°E 22.17°N, 115.36°E Note: – means no observation was conducted by this buoy.  下载: 导出CSV
Table 2. Major data quality control procedures
Measurement Range error checking Extreme-anomaly checking Consecutive anomalies checking Wind velocity speed values outside 2–
25 m/sspeed changes more than 3.0 STD
from the previous hourdifference between the original and 7-hour-running
mean wind speed outside –0.8 STD to 0.8 STDWind direction following the check of the
wind speed; the wind
direction outside 0°–360°following the check of the wind
speed; direction changes more than
10 STD from the previous hourfollowing the check of the wind speed; difference
between the original and 7-hour-running mean
wind direction outside –5.0 STD to 5.0 STD
下载: 导出CSV
Table 3. The error statistics of the comparison between CCMP and buoy wind data
Scatterometer dataset Number of collocations Wind speed Wind direction Bias/(m·s–1) RMSE/(m·s–1) R Bias/(°) RMSE/(°) R CCMP (2012) 1 210 0.47 1.61 0.80 2.31 29.78 0.89 CCMP (2013) 903 –0.08 1.57 0.82 5.58 35.61 0.86
下载: 导出CSV
Table 4. The error statistics of the comparison between the reanalysis and buoy wind data in 2012
Reanalysis dataset Number of collocations Wind speed Wind direction Bias/(m·s–1) RMSE/(m·s–1) R Bias/(°) RMSE/(°) R CFSv2 1 224 –0.40 1.54 0.82 –1.36 34.48 0.87 ERA-I 1 216 –1.70 1.67 0.76 –2.10 29.46 0.90 NCEP-2 1 200 –0.92 2.29 0.63 –7.26 41.10 0.82
下载: 导出CSV
Table 5. The error statistics for the comparison between the reanalysis and buoy wind data in 2013
Reanalysis dataset Number of collocations Wind speed Wind direction Bias/(m·s–1) RMSE/(m·s–1) R Bias/(°) RMSE/(°) R CFSv2 925 0.38 1.67 0.83 –2.16 40.42 0.82 ERA-I 911 –1.44 1.69 0.78 –4.88 36.36 0.86 NCEP-2 913 0.40 2.61 0.55 –6.33 51.51 0.74
下载: 导出CSV
-
[1] Bourassa M A, Meissner T, Cerovecki I, et al. 2010. Remotely sensed winds and wind stresses for marine forecasting and ocean modeling. In: Hall J, Harrison D E, Stammer D, eds. Proceedings of the OceanObs’09: Sustained Ocean Observations and Information for Society Conference. Venice, Italy: Space Agency [2] Carvalho D, Rocha A, Gómez-Gesteira M, et al. 2013. Comparison between CCMP, QuikSCAT and buoy winds along the Iberian Peninsula coast. Remote Sensing of Environment, 137: 173–183. doi: 10.1016/j.rse.2013.06.005 [3] Chelton D B. 2005. The impact of SST specification on ECMWF surface wind stress fields in the Eastern Tropical Pacific. Journal of Climate, 18(4): 530–550. doi: 10.1175/JCLI-3275.1 [4] Chelton D B, Freilich M H. 2005. Scatterometer-based assessment of 10-m wind analyses from the operational ECMWF and NCEP numerical weather prediction models. Monthly Weather Review, 133(2): 409–429. doi: 10.1175/MWR-2861.1 [5] Chelton D B, Schlax M G, Freilich M H, et al. 2004. Satellite measurements reveal persistent small-scale features in ocean winds. Science, 303: 978–983. doi: 10.1126/science.1091901 [6] Dee D P, Uppala S M, Simmons A J, et al. 2011. The ERA-Interim reanalysis: configuration and performance of the data assimilation system. Quarterly Journal of the Royal Meteorological Society, 137(656): 553–597. doi: 10.1002/qj.828 [7] Ebuchi N, Graber H C, Caruso M J. 2002. Evaluation of wind vectors observed by QuikSCAT/SeaWinds using ocean buoy data. Journal of Atmospheric and Oceanic Technology, 19(12): 2049–2062. doi: 10.1175/1520-0426(2002)019<2049:EOWVOB>2.0.CO;2 [8] Gilhousen D B. 1998. Improved real-time quality control of NDBC measurements. In: 10th Symposium on Meteorological Observations and Instrumentation. Preprints. Phoenix, AZ: American Meteorological Society, 363–366 [9] Josse P, Caniaux G, Giordani H, et al. 1999. Intercomparison of oceanic and atmospheric forced and coupled mesoscale simulations. Part I: Surface fluxes. Annales Geophysicae, 17(4): 566–576 [10] Kanamitsu M, Ebisuzaki W, Woollen J, et al. 2002. NCEP–DOE AMIP-II reanalysis (R-2). Bulletin of the American Meteorological Society, 83(11): 1631–1644. doi: 10.1175/BAMS-83-11-1631 [11] Large W G, Holland W R, Evans J C. 1991. Quasi-geostrophic ocean response to real wind forcing: the effects of temporal smoothing. Journal of Physical Oceanography, 21(7): 998–1017. doi: 10.1175/1520-0485(1991)021<0998:QGORTR>2.0.CO;2 [12] Peng Ge. 2004. Validation of a global reanalysis model in representing synoptic-scale eddies using scatterometer data: A case study. Geophysical Research Letter, 31: L16201. doi: 10.1029/2004GL020297 [13] Peng Ge, Zhang Huaimin, Frank H P, et al. 2013. Evaluation of various surface wind products with OceanSITES buoy measurements. Weather and Forecasting, 28(6): 1281–1303. doi: 10.1175/WAF-D-12-00086.1 [14] Saha S, Moorthi S, Wu Xingren, et al. 2014. The NCEP climate forecast system version 2. Journal of Climate, 27(6): 2185–2208. doi: 10.1175/JCLI-D-12-00823.1 [15] Schmidt K M, Swart S, Reason C, et al. 2017. Evaluation of satellite and reanalysis wind products with in situ wave glider wind observations in the southern Ocean. Journal of Atmospheric and Oceanic Technology, 34(12): 2551–2568. doi: 10.1175/JTECH-D-17-0079.1 [16] Tang Wenqing, Liu W T, Stiles B W. 2004. Evaluation of high-resolution ocean surface vector winds measured by QuikSCAT scatterometer in coastal regions. IEEE Transactions on Geoscience and Remote Sensing, 42(8): 1762–1769. doi: 10.1109/TGRS.2004.831685 [17] Yang Jungang, Zhang Jie. 2018. Evaluation of ISS-RapidScat wind vectors using buoys and ASCAT data. Remote Sensing, 10(4): 648. doi: 10.3390/rs10040648 -


 点击查看大图
计量
- 文章访问数: 524
- HTML全文浏览量: 182
- PDF下载量: 22
- 被引次数: 0

