

-
Abstract: The response relationship between equivalent neutral wind speed anomaly (ENWSA) and sea-air temperature difference anomaly (SATDA) has been analyzed over four typical sea regions, i.e., the Kuroshio Extension, the Gulf Stream, the Brazil-Malvinas Confluence and the Agulhas Return Current. The results show that ENWSA is more sensitive to SATDA than sea surface temperature anomaly (SSTA), which implies that SATDA seems to be a more suitable parameter than SSTA to analyze the mesoscale air-sea interactions. Here, the slope of the linear relation between ENWSA and SATDA is defined as the air-sea coupling coefficient. It is found that the values of the coupling coefficient over the four typical sea areas have obvious seasonal variations and geographical differences. In order to reveal the reason of the seasonal variation and geographical difference of the coupling coefficient, the influences of some environmental background factors, such as the spatially averaged sea surface temperature (SST), the spatially averaged air temperature, the spatially averaged sea-air temperature difference and the spatially averaged equivalent neutral wind speed, on the coupling coefficient are discussed in detail. The results reveal that the background sea-air temperature difference is an important environmental factor which directly affects the magnitude of the coupling coefficients, meanwhile, the seasonal and geographical variations of the coupling coefficient.
-

Figure 1. Four typical sea areas for studying in this paper. The map is the monthly-averaged equivalent neutral wind speed (ENWS) acquired by the advanced scatterometer in August 2013. GS. the Gulf Stream; KE. the Kuroshio Extension; BMC. the Brazil-Malvinas Confluence; ARC. the Agulhas Return Current.
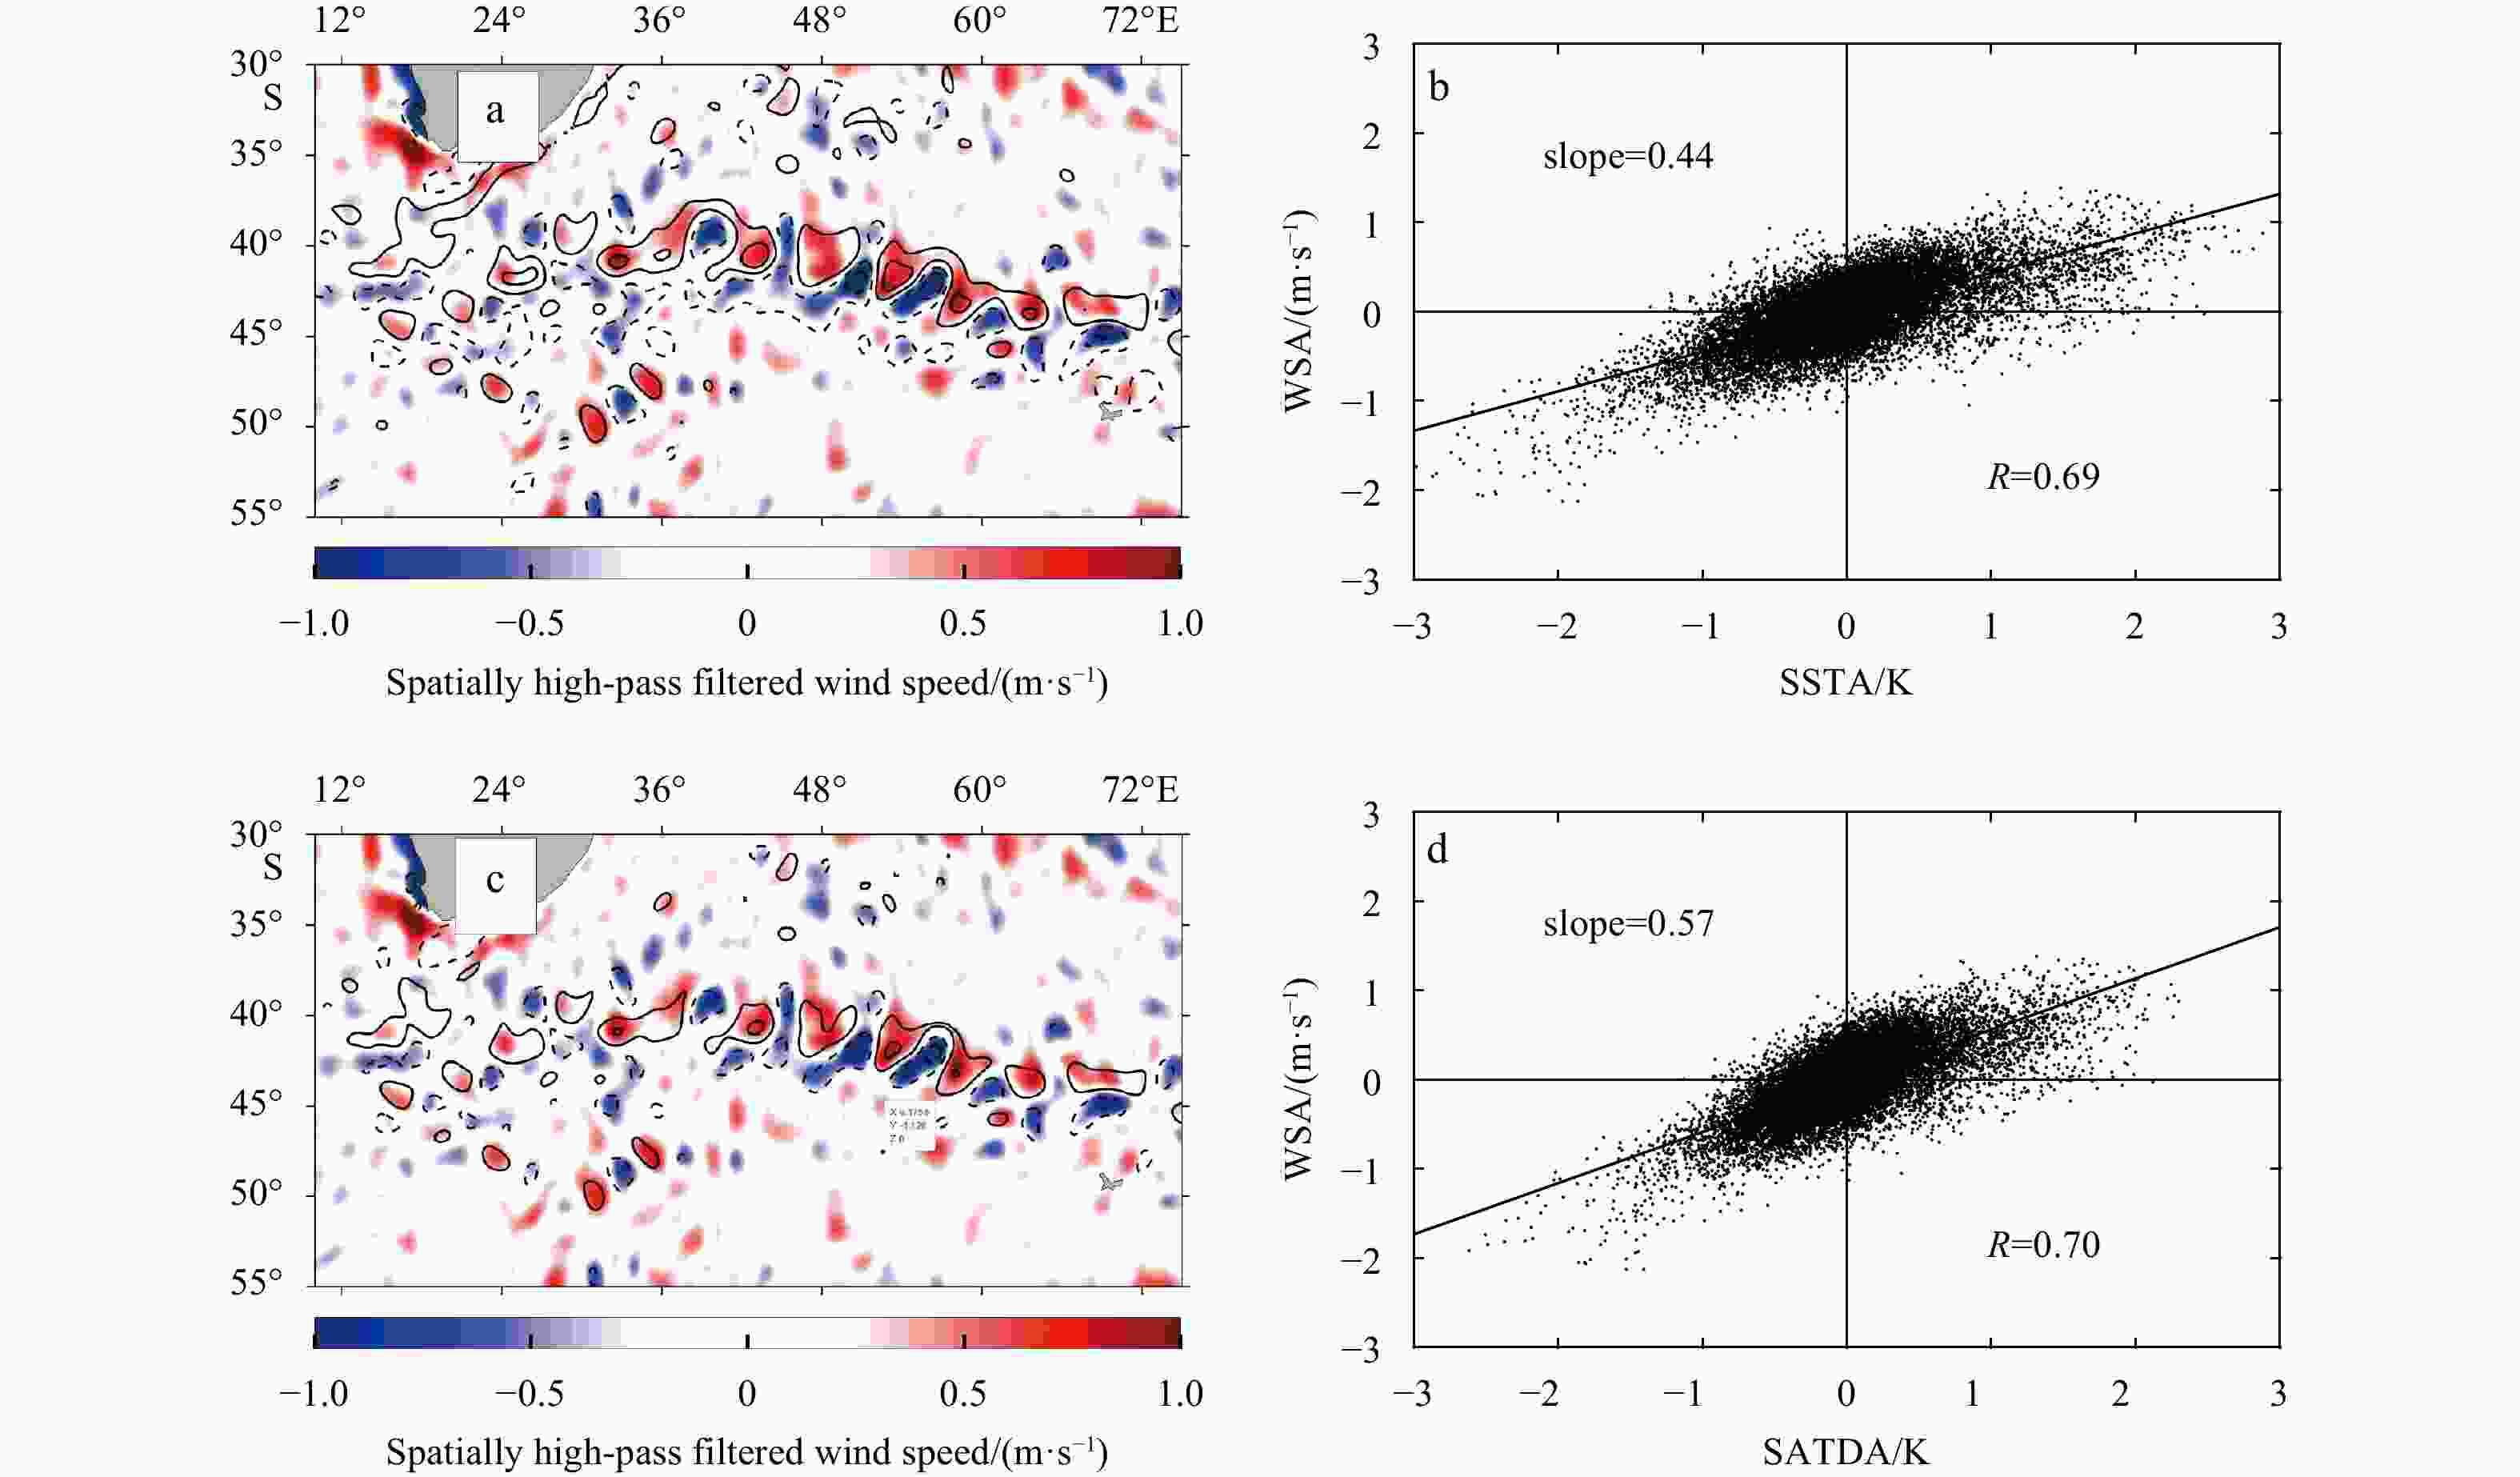
Figure 2. The map of sea surface temperature anomaly (SSTA) overlaid as contours on equivalent neutral wind speed anomaly (ENWSA) at the Agulhas Return Current region in December 2010 (a), and the corresponding scatter plot (b); the map of sea-air temperature difference anomaly (SATDA) overlaid as contours on ENWSA (c), and the corresponding scatter plot (d). The parameter
$R$ in b and d denotes the correlation coefficient, and the solid thick line is the linear least square fitting line to the points. WSA. wind speed anomaly.
Figure 3. The values of the
${k_{{\text{SSTA}}}}$ (blue dashed curves) and${k_{{\text{SATDA}}}}$ (red solid curves) from January 2008 to December 2017 over the four typical regions, i.e. the Kuroshio Extension (a), the Gulf Stream (b), the Brazil-Malvinas Confluence (c) and the Agulhas Return Current (d) region.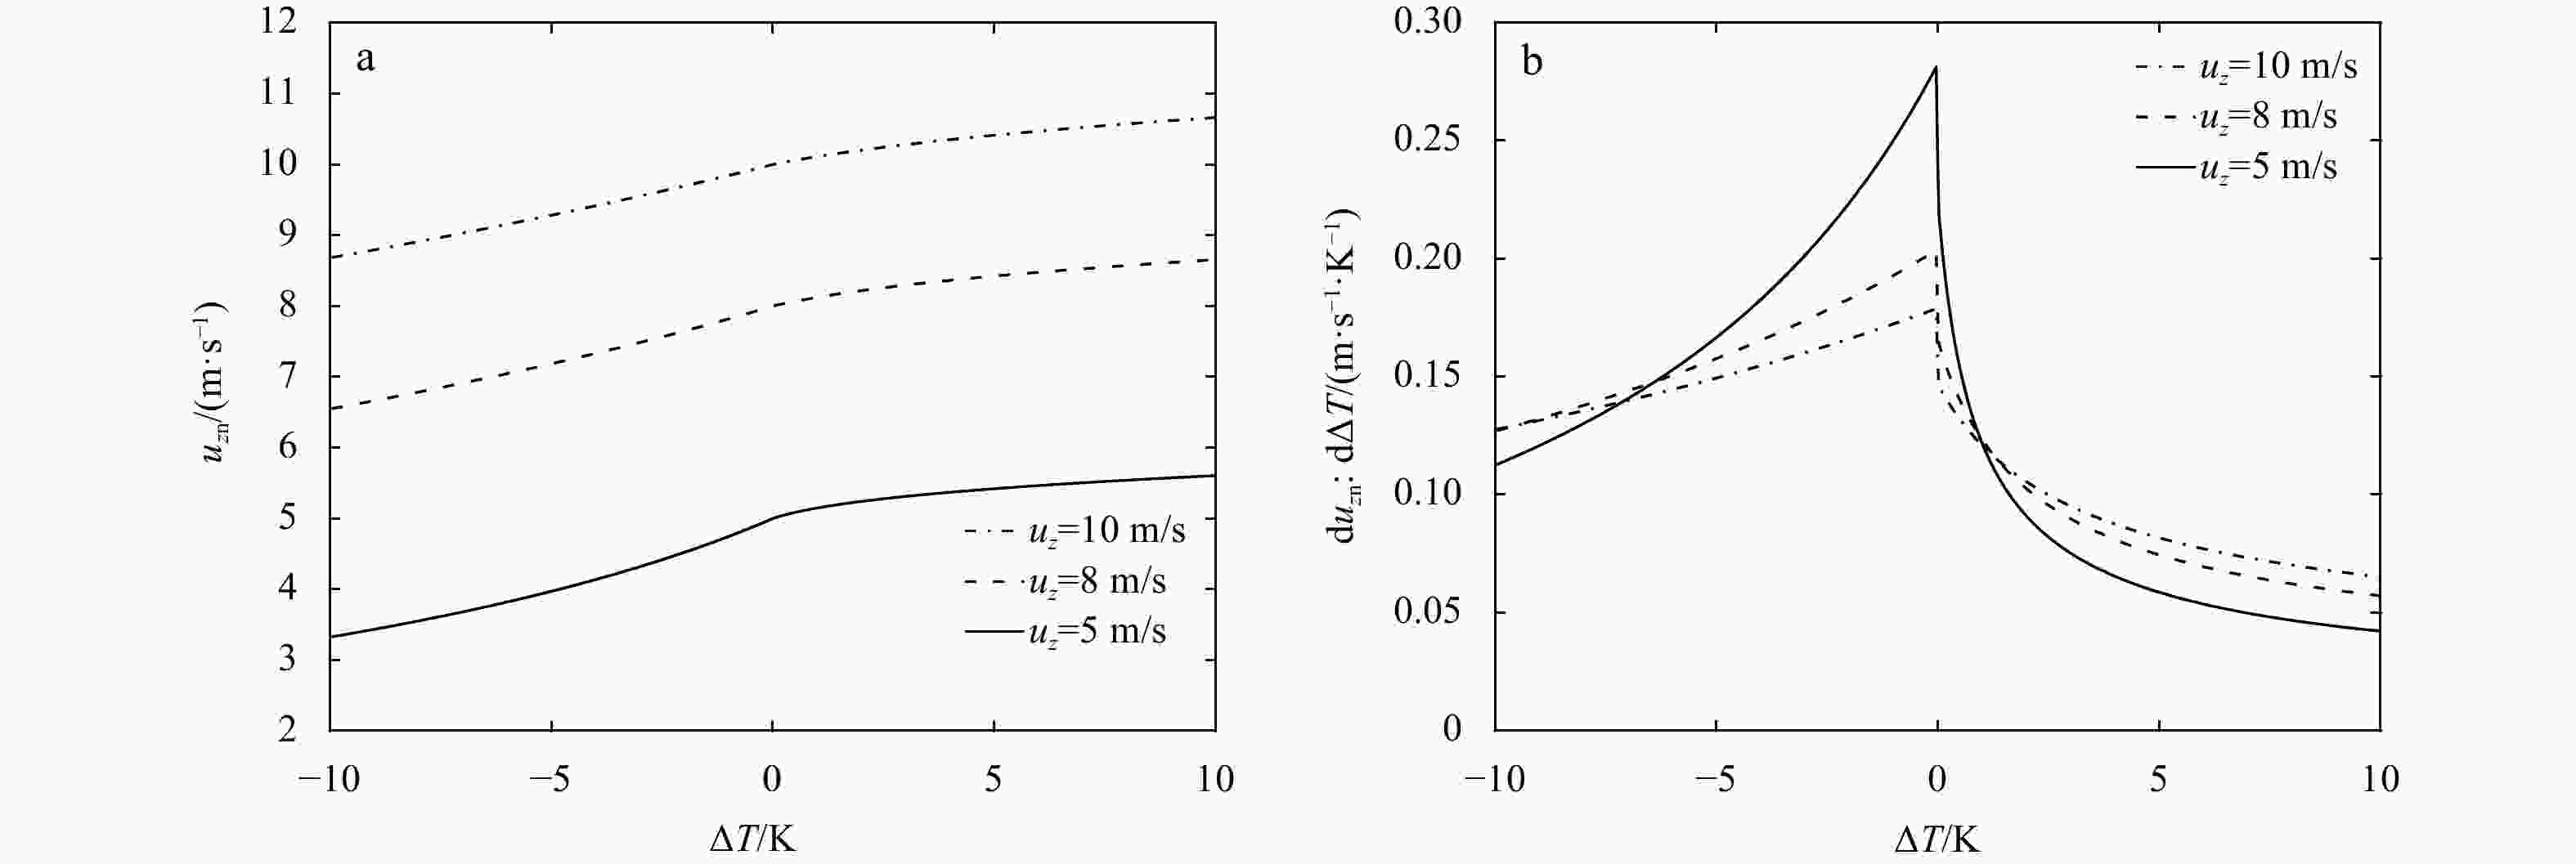
Figure 4. The ENWS evaluated by Eq. (9) (a) and the coupling coefficient evaluated by Eq. (16) (b) as functions of the sea-air temperature difference
$\Delta T$ .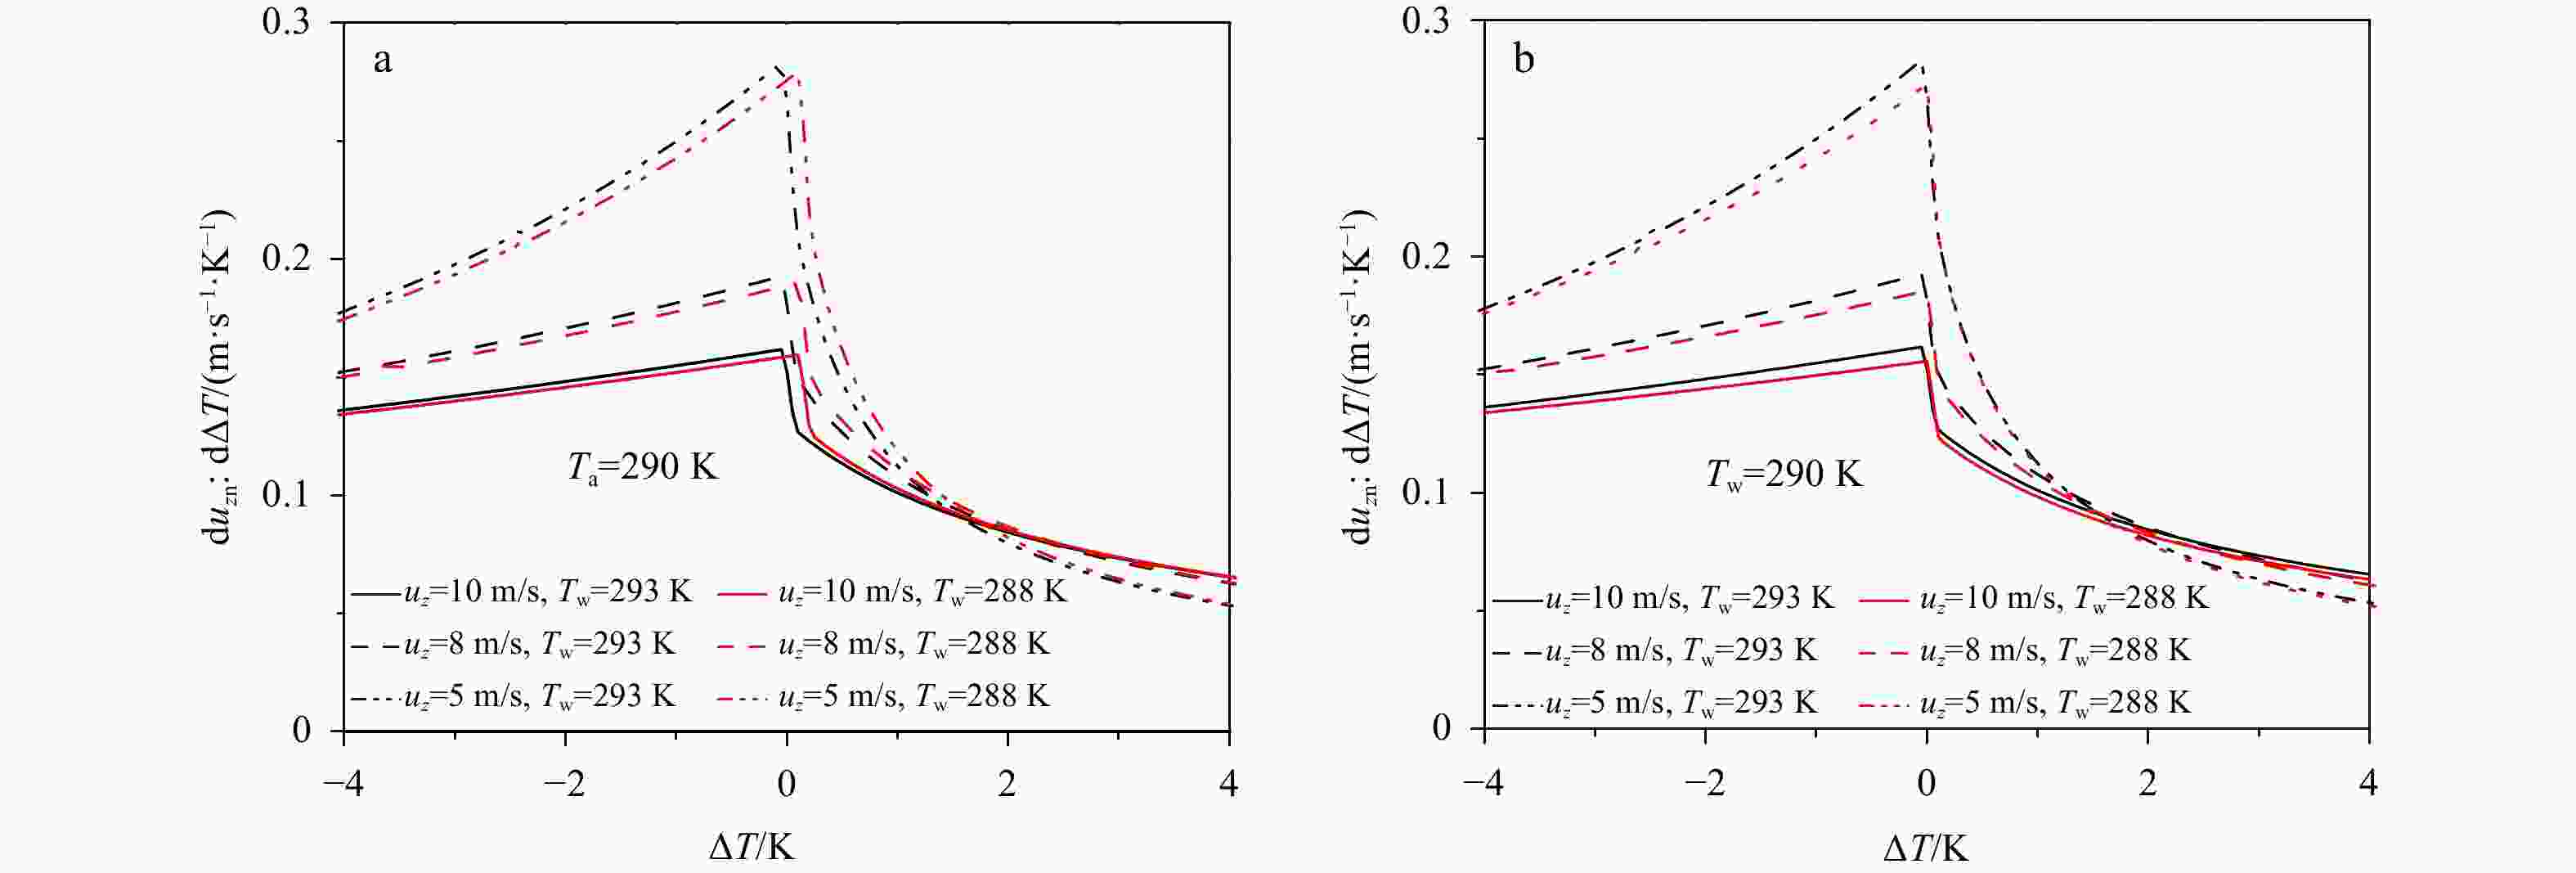
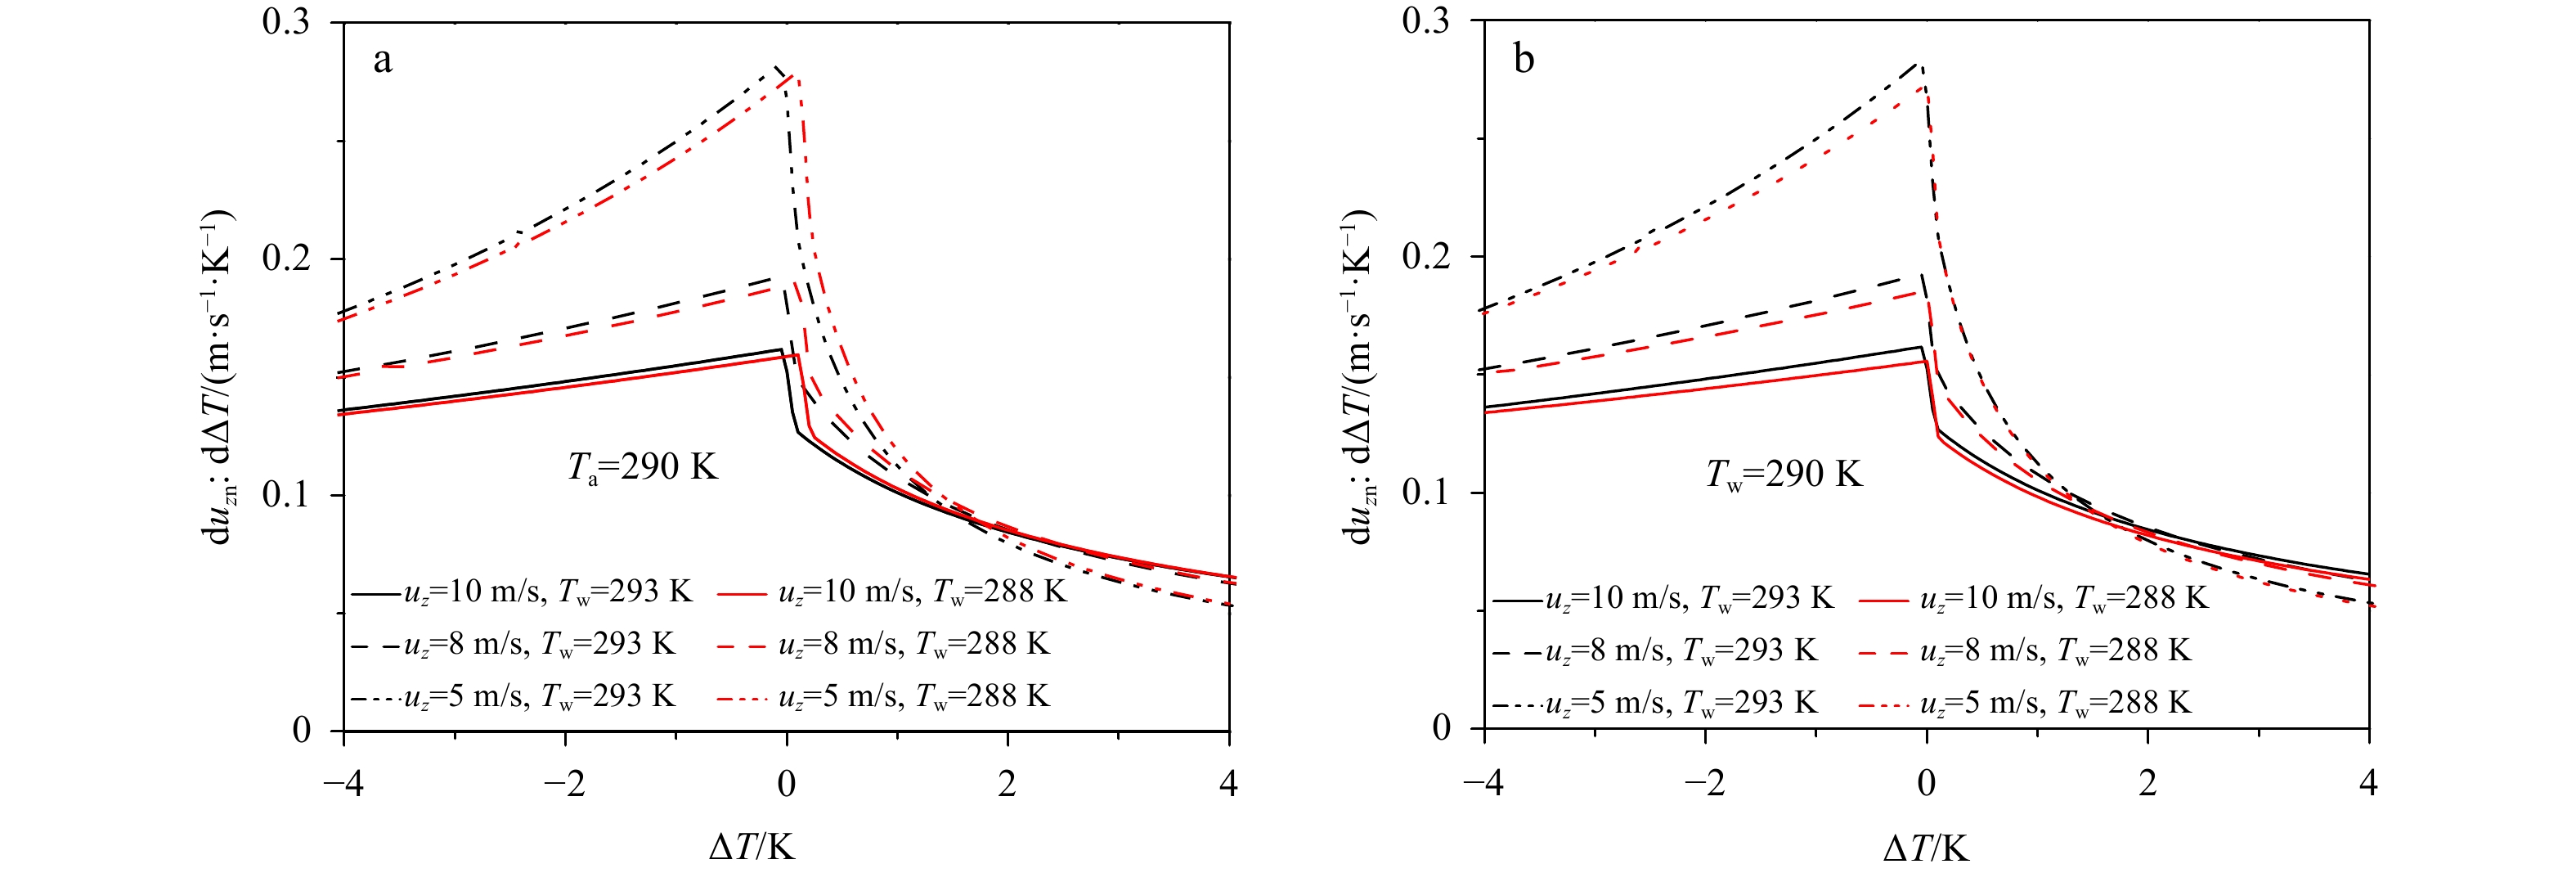
Figure 5. The coupling coefficient as functions of
$\Delta T$ for different${T_{\rm{w}}}$ and${T_{\rm{a}}}$ are presented in a and b, respectively.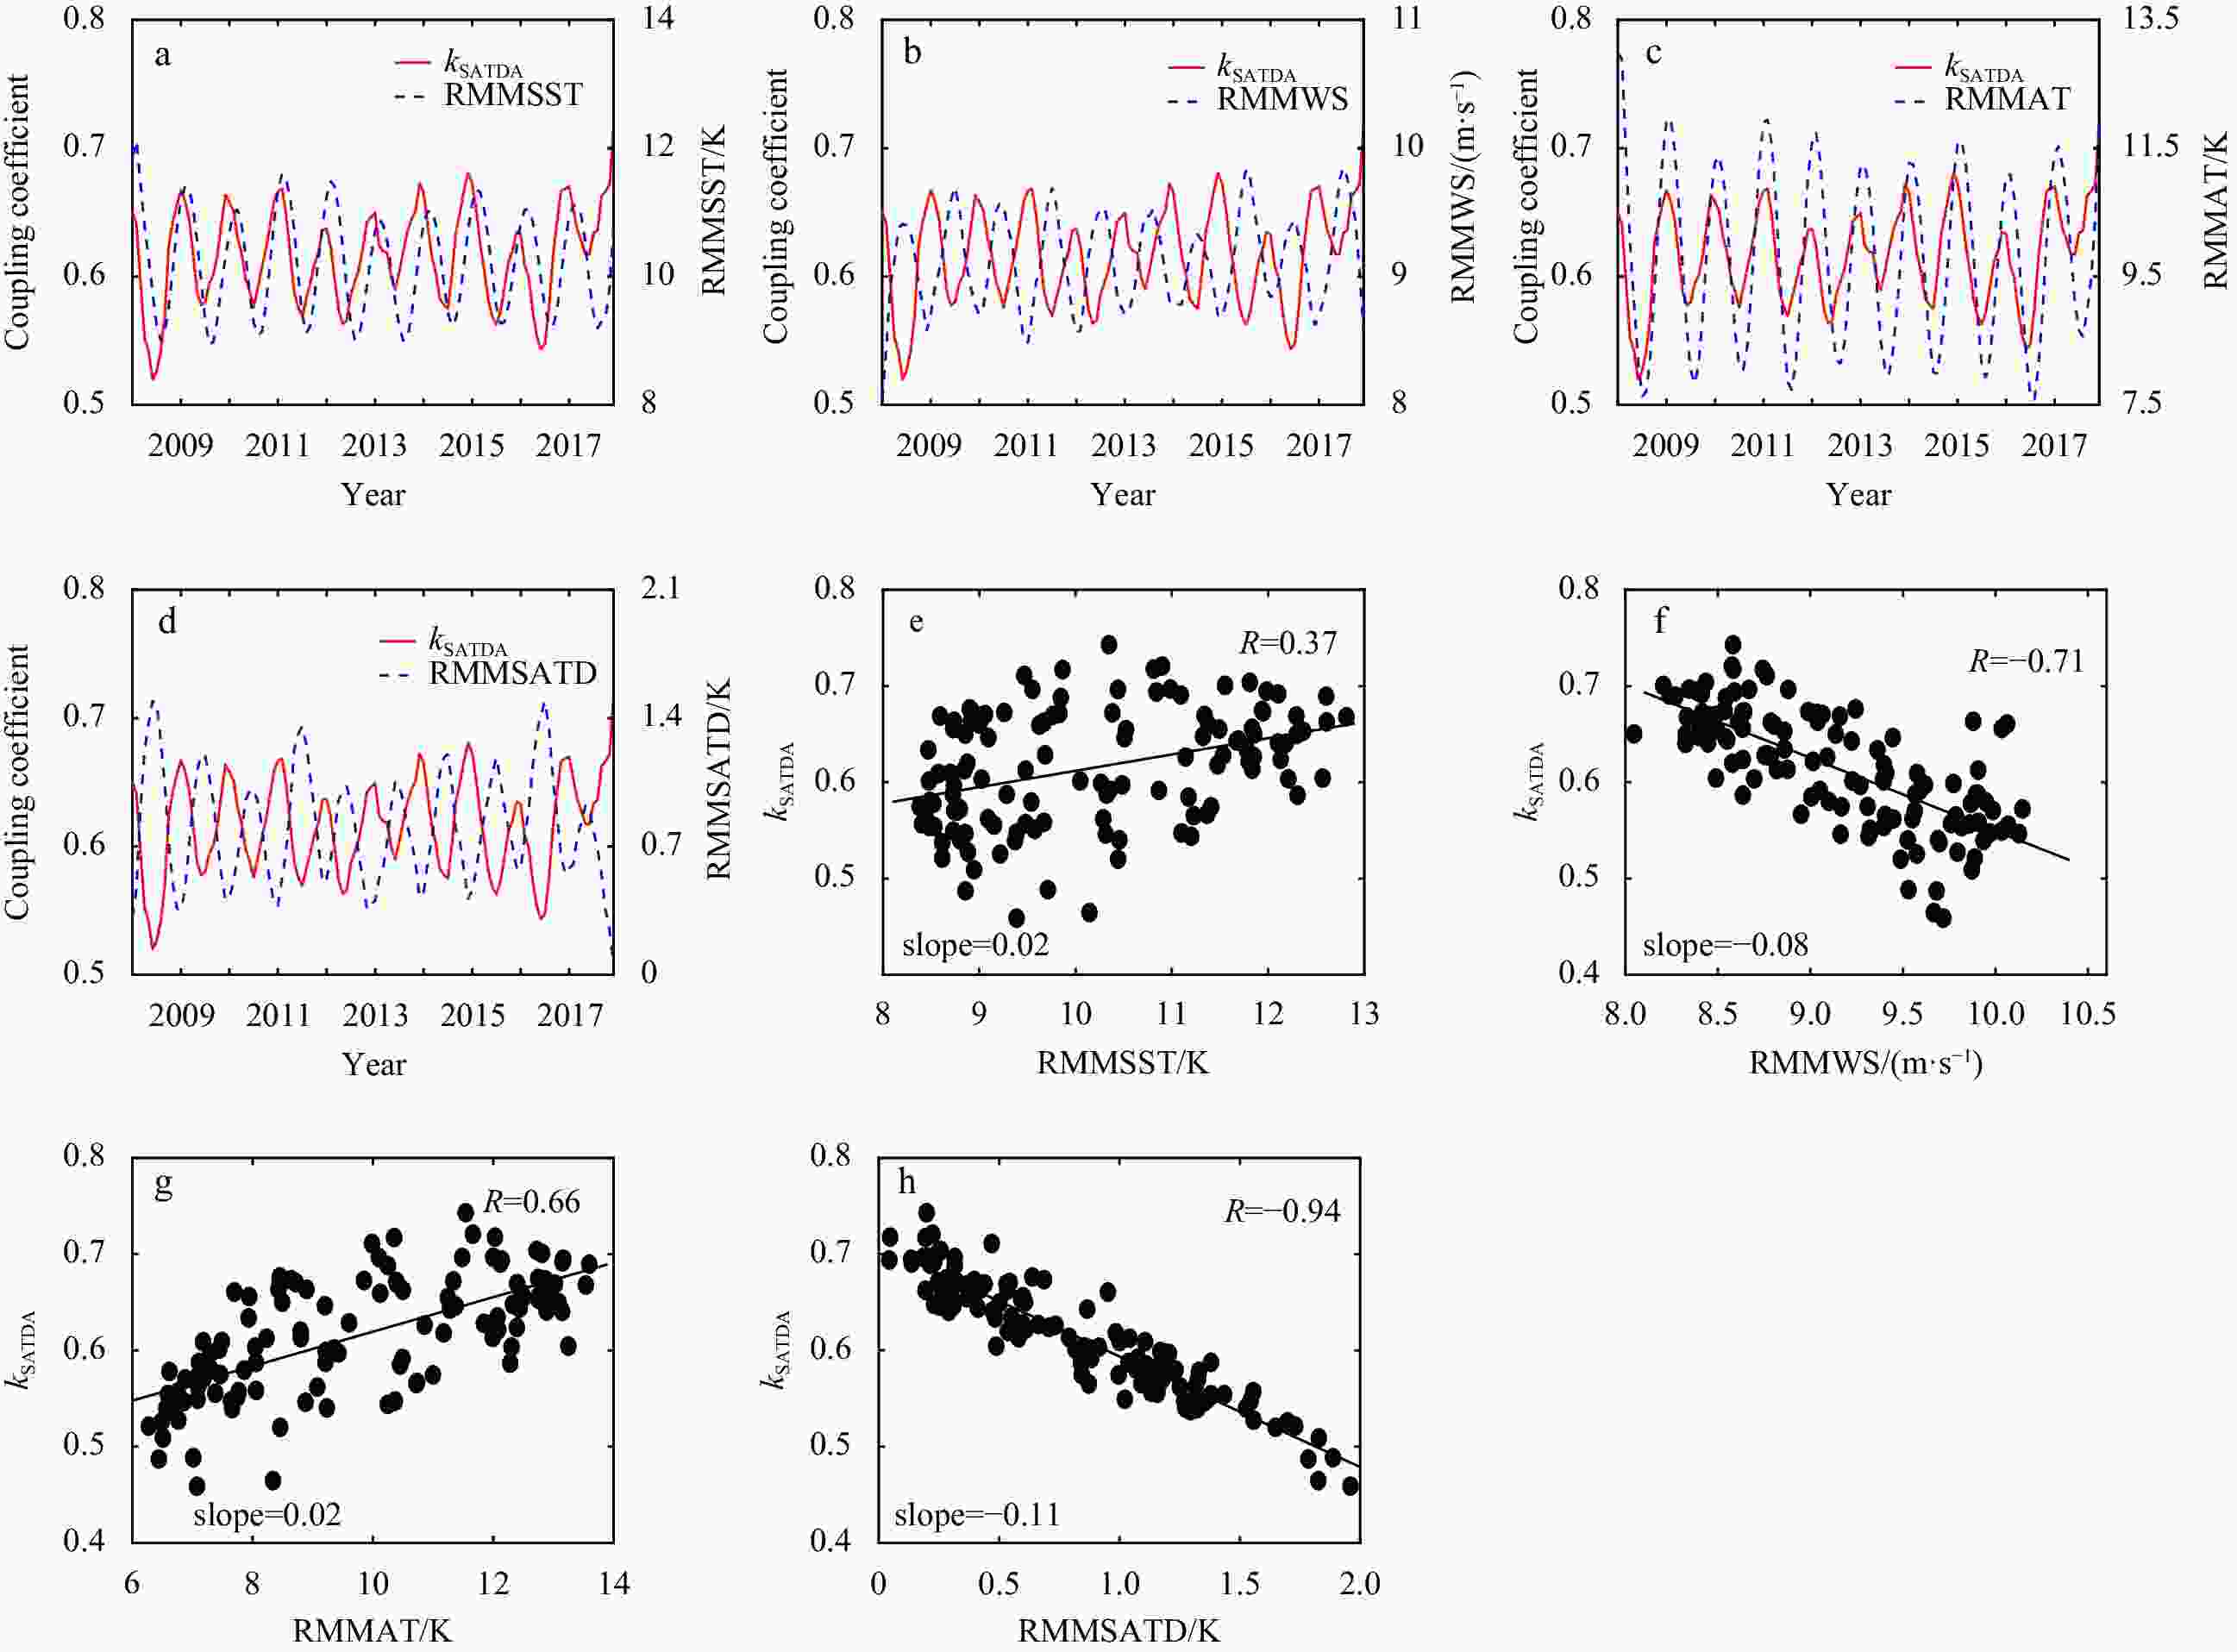
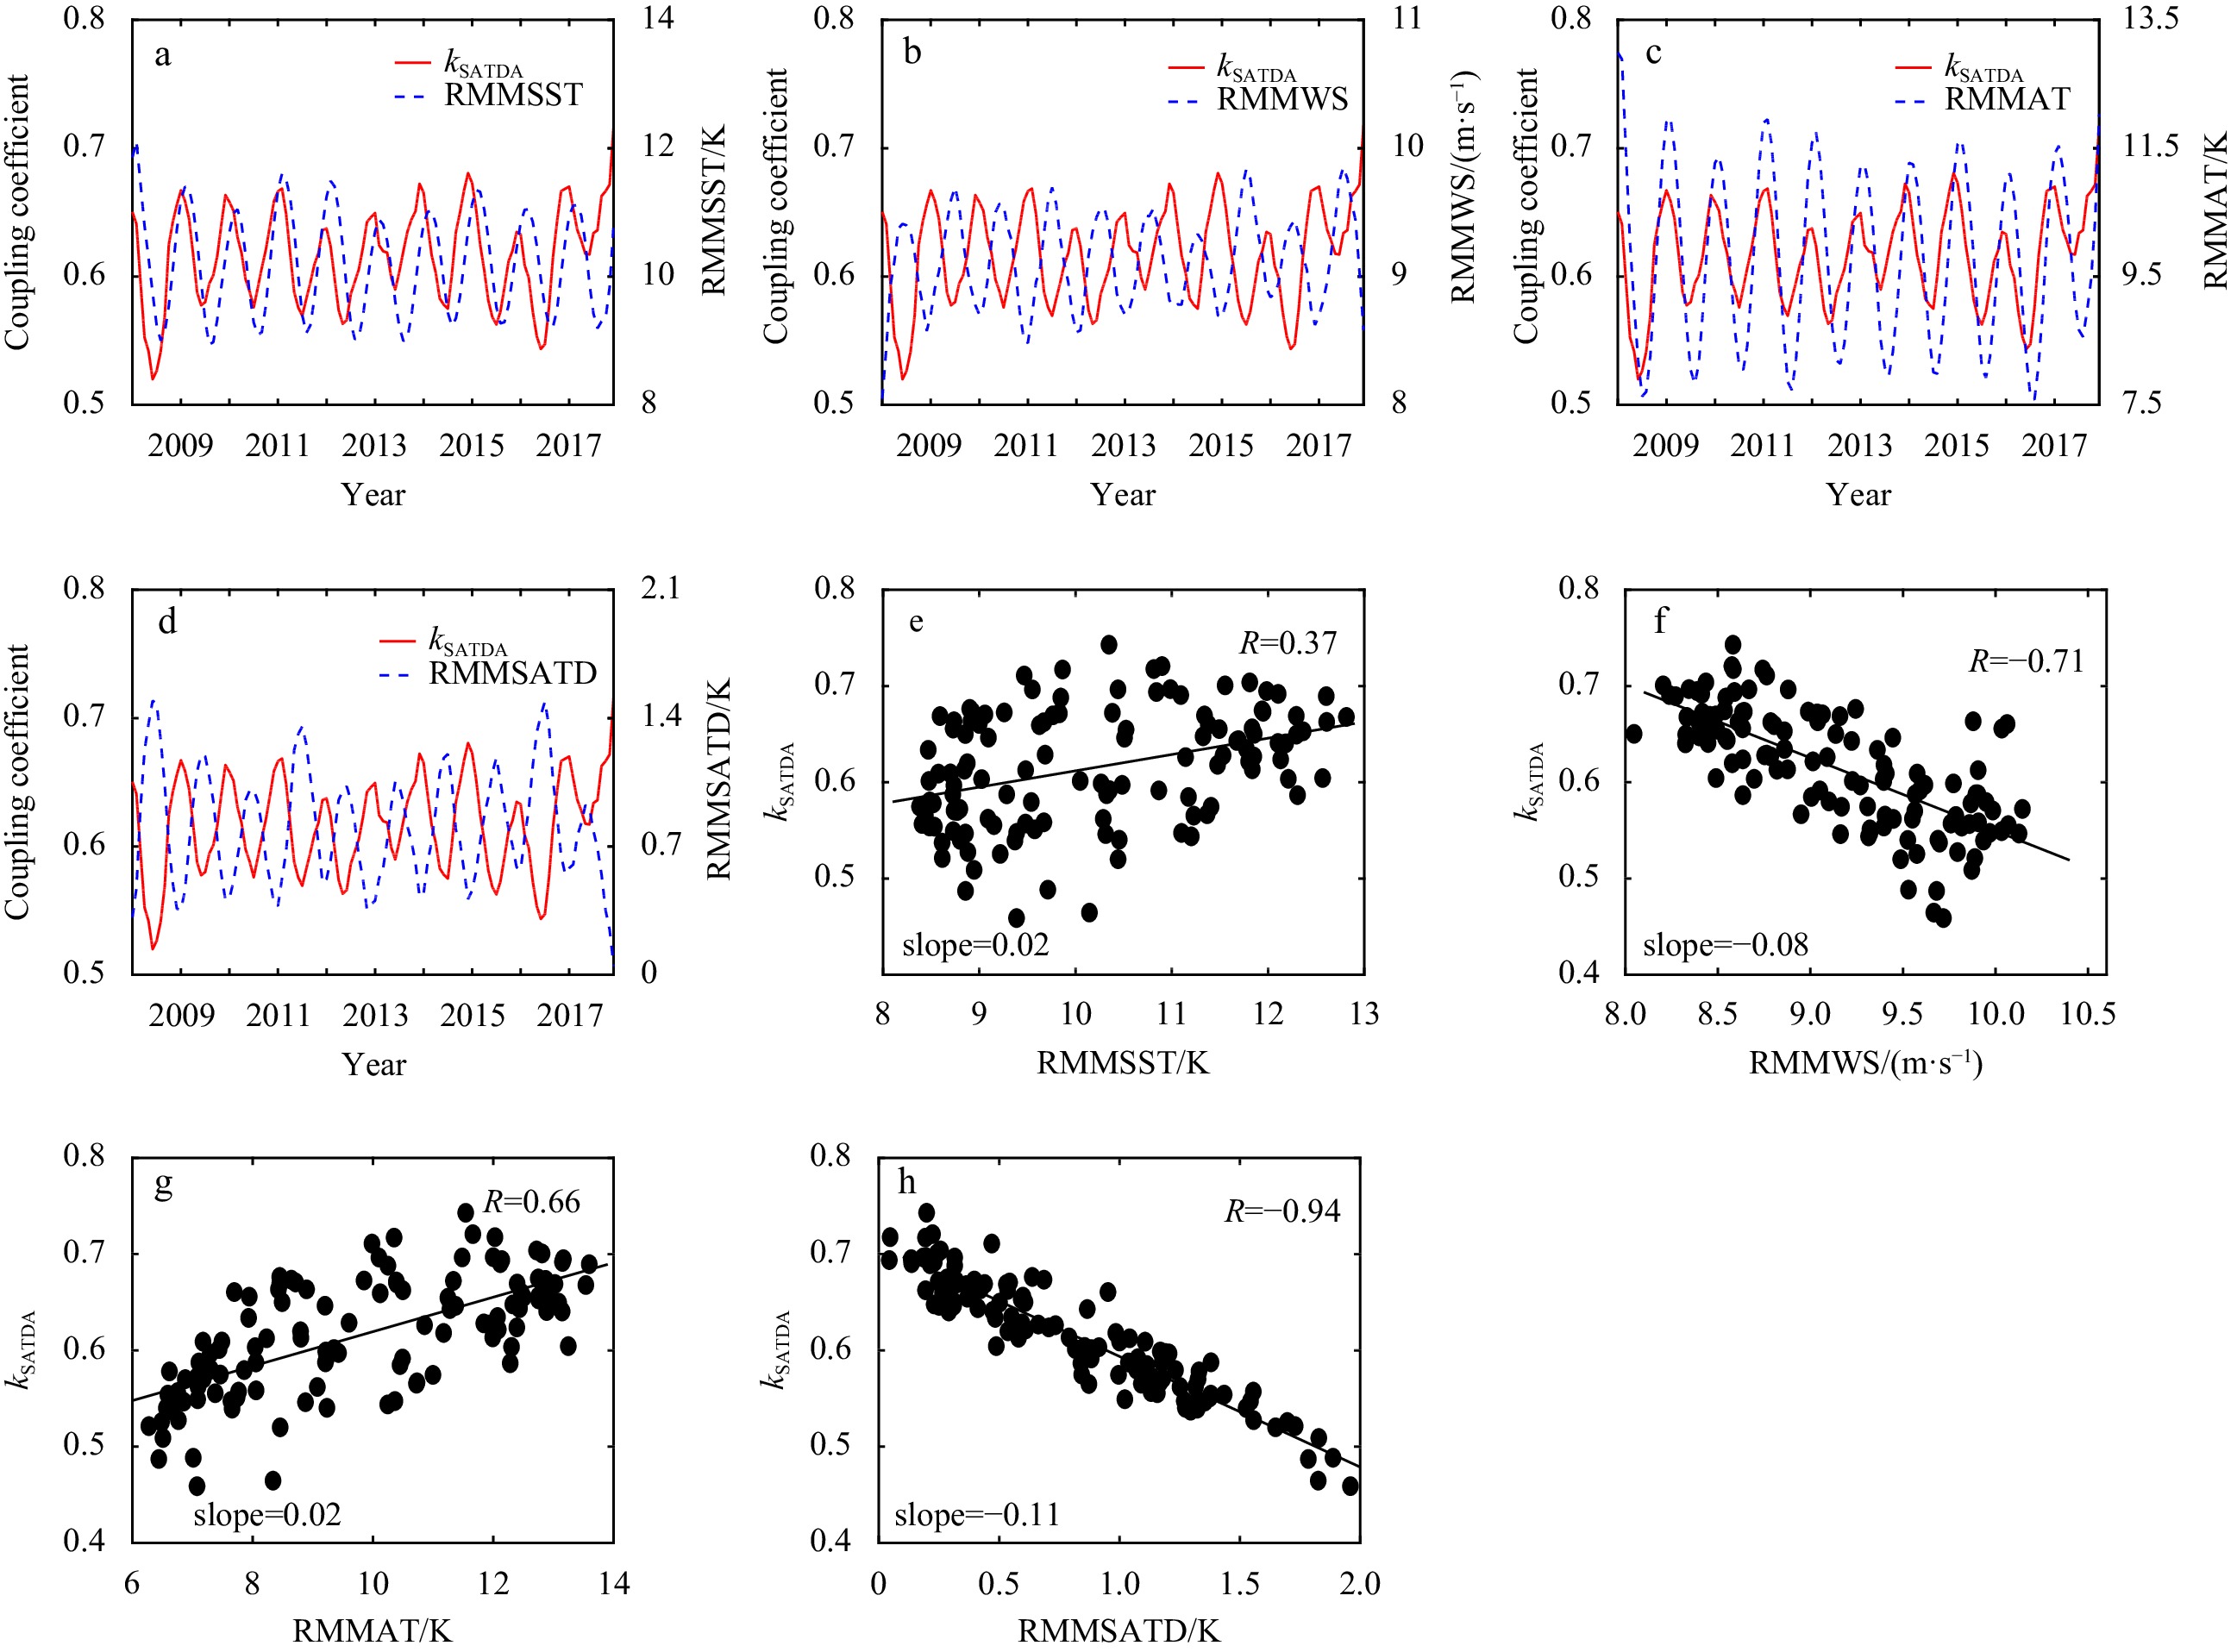
Figure 6. The values of the coupling coefficient (red solid curve) and RMMSST, RMMWS, RMMAT and RMMSATD (blue dashed curve) from January 2008 to December 2017 over the Brazil-Malvinas Confluence region (a−d), and the corresponding scatter plots (e−h). The parameter R denotes the correlation coefficient.
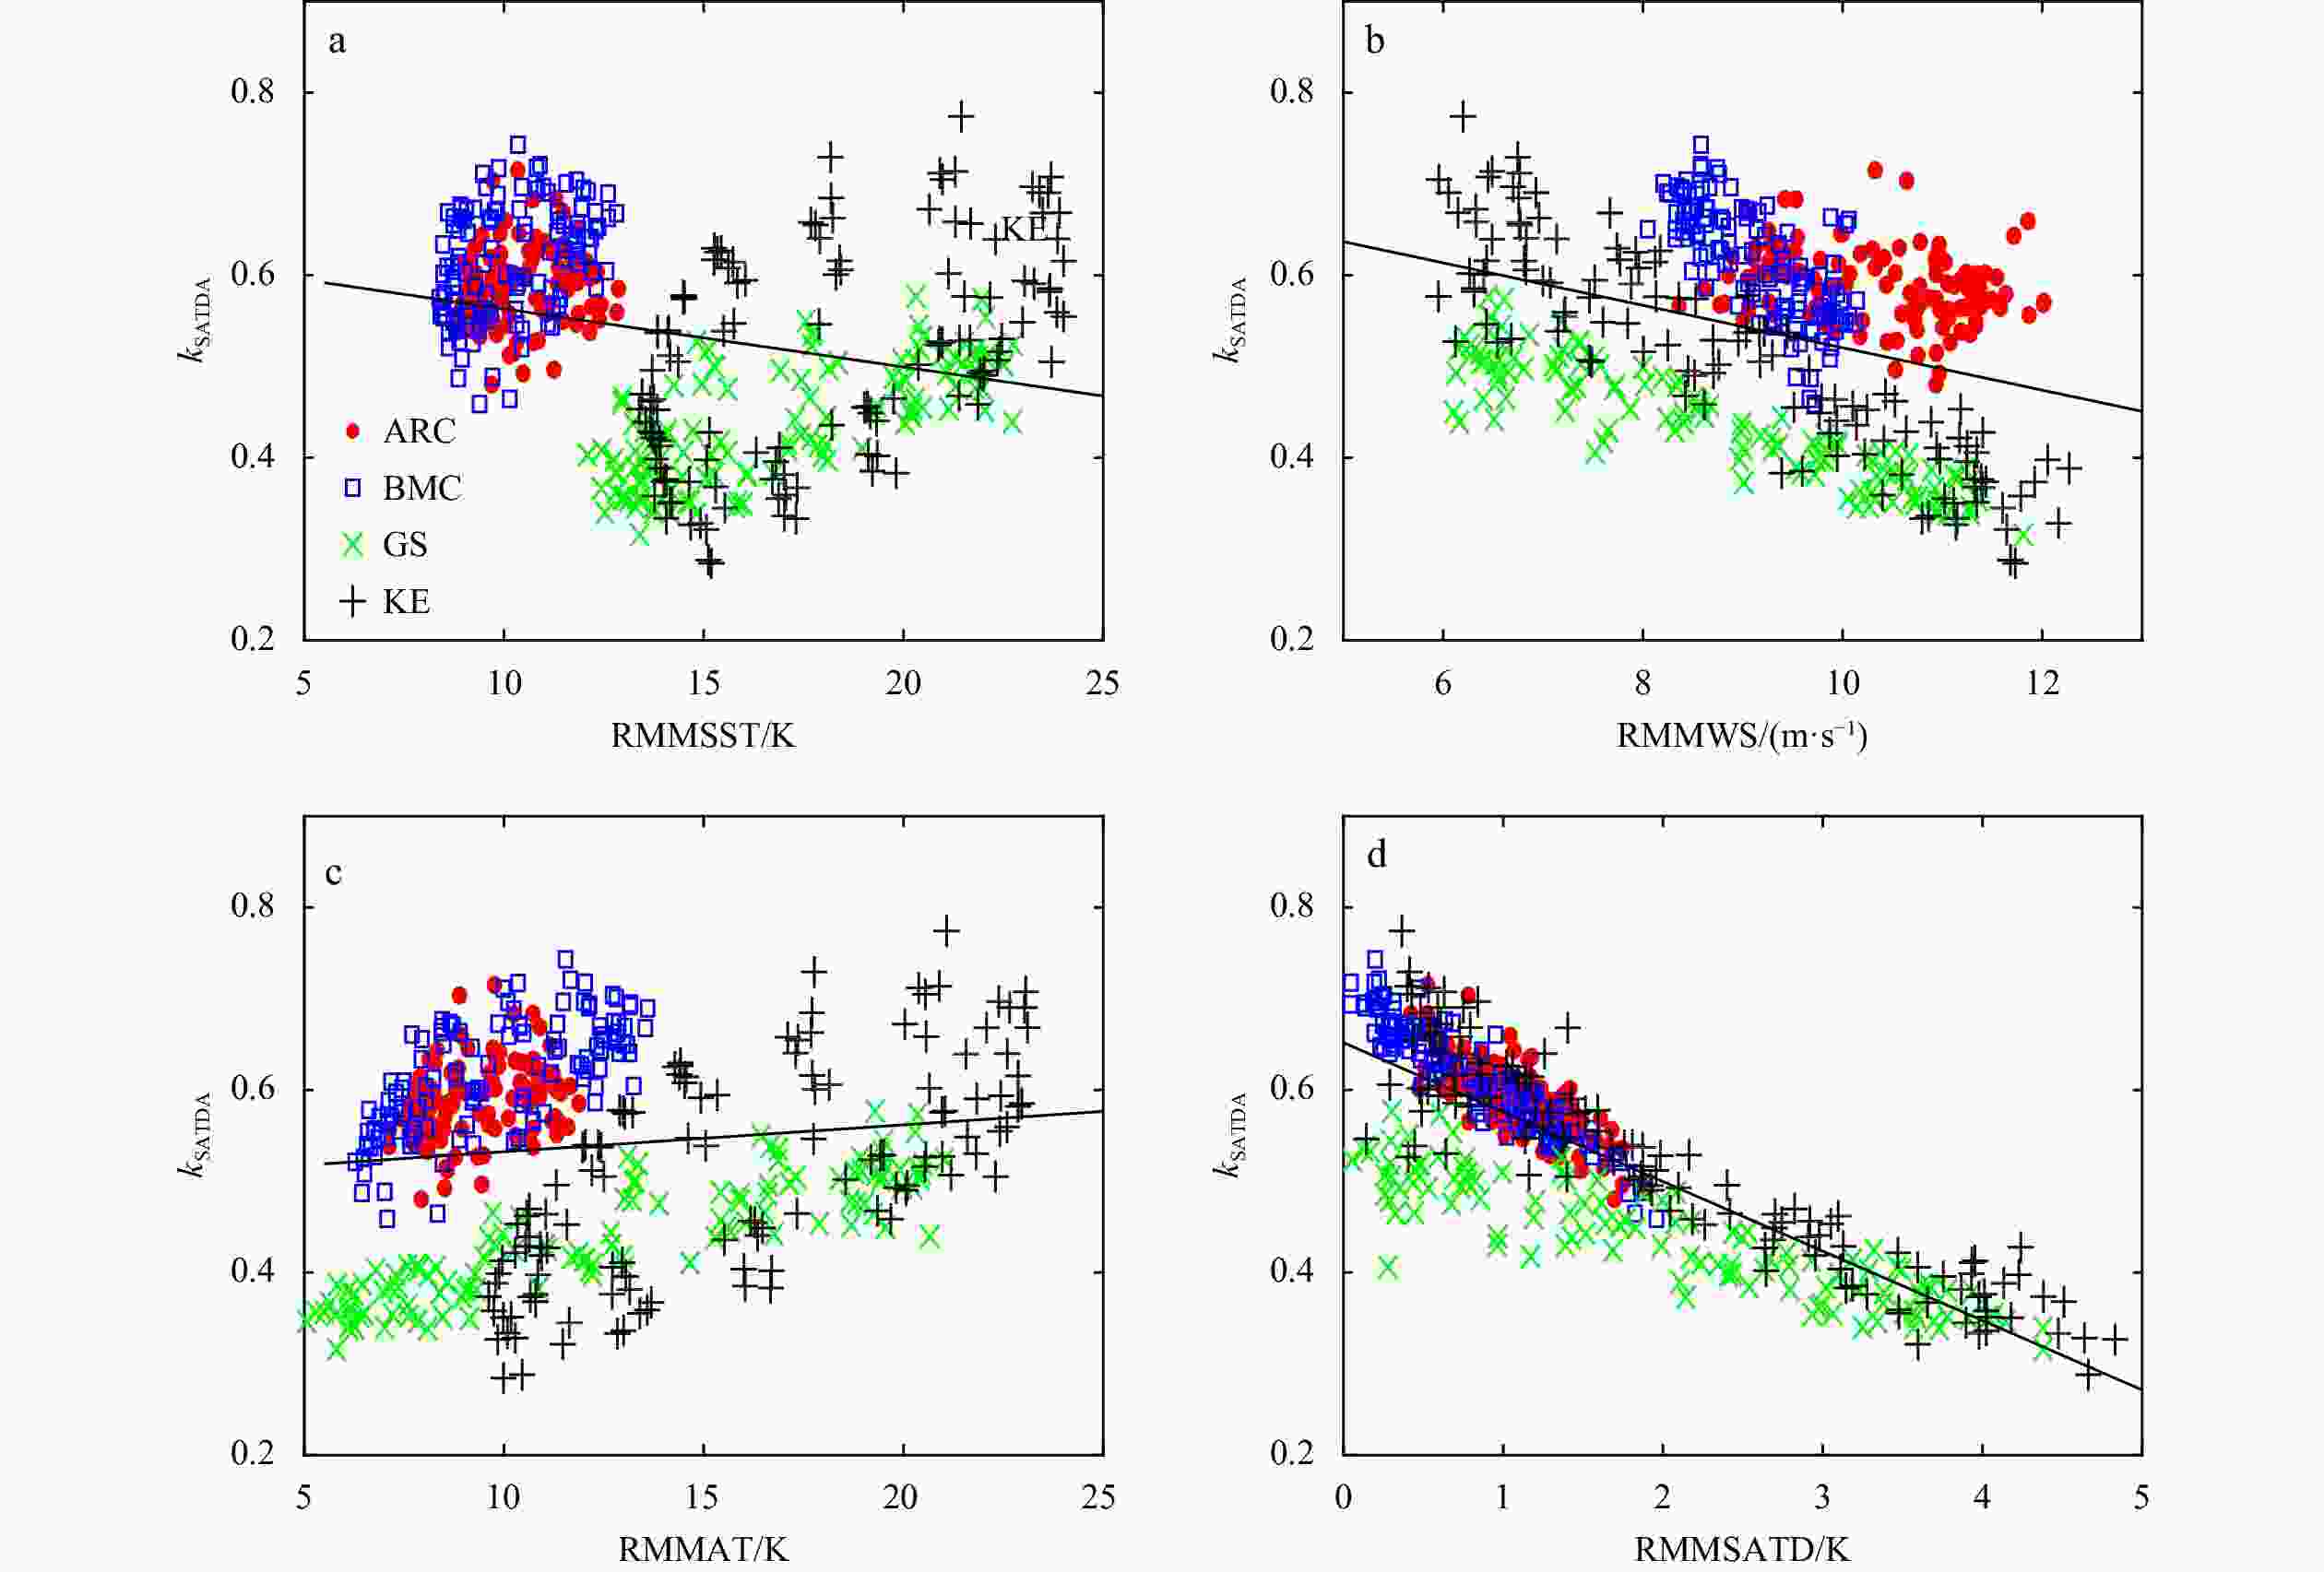
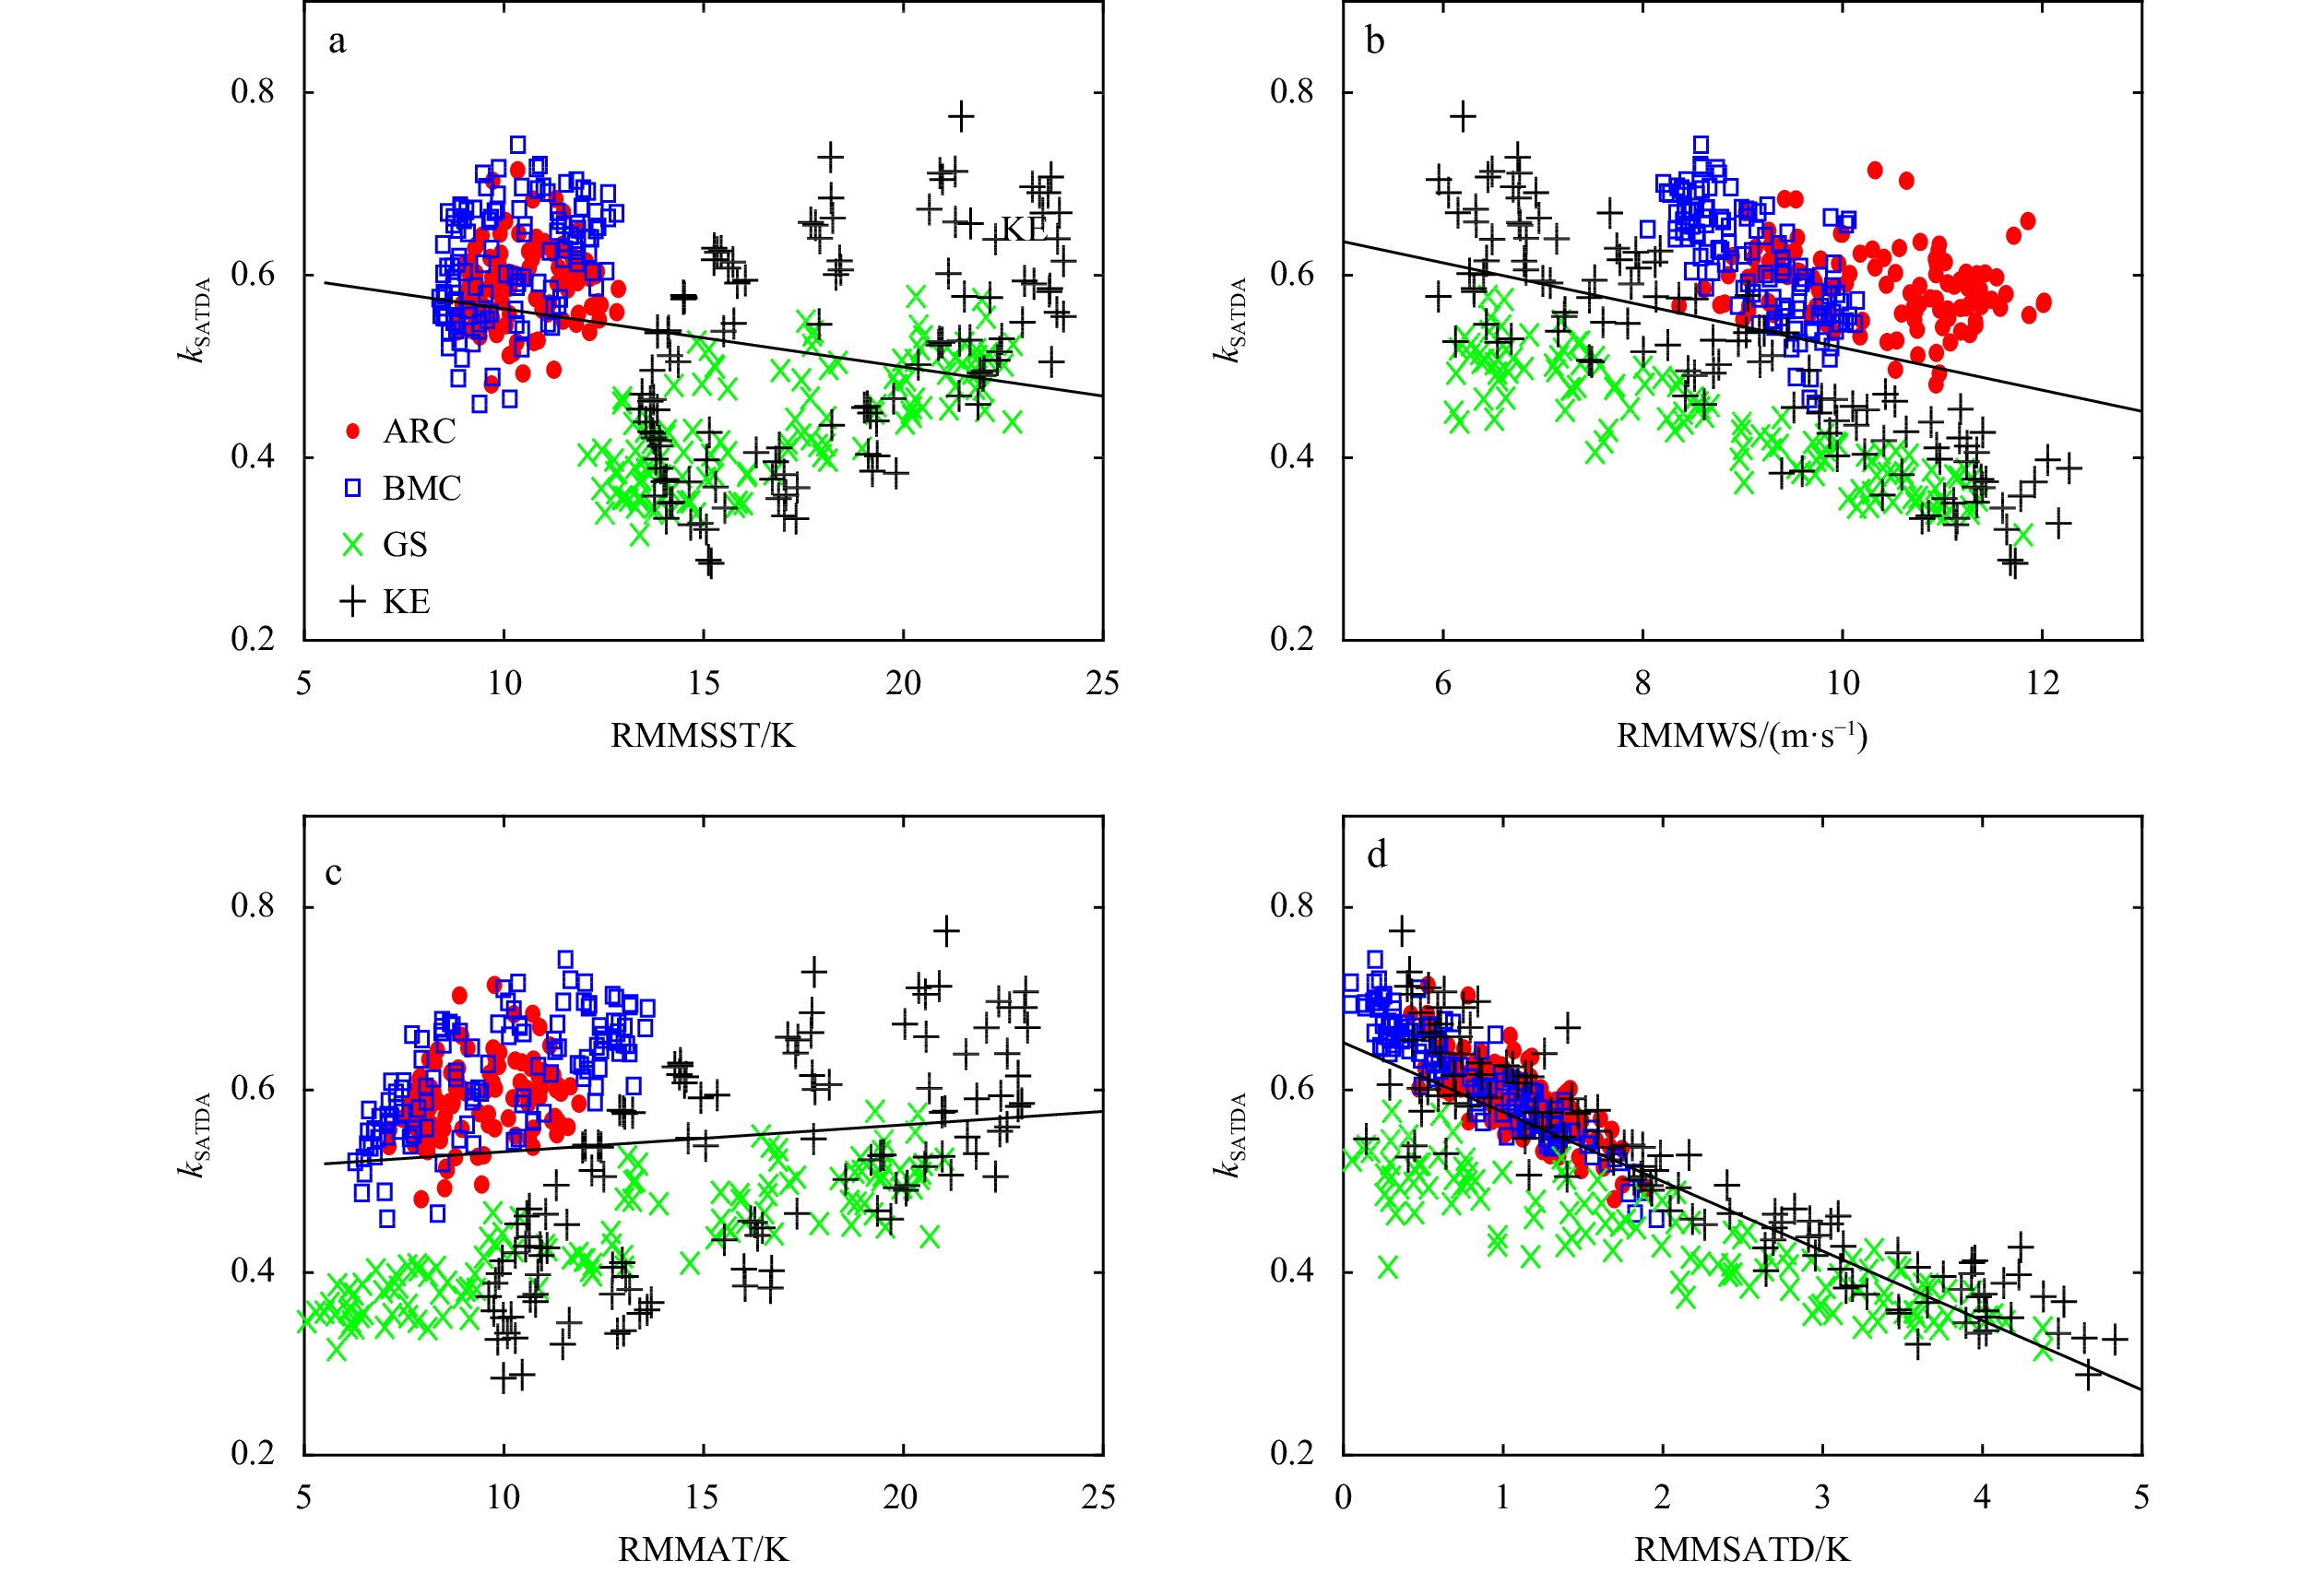
Figure 7. The scatter plots of the background environmental parameters and the coupling coefficient over the four sea regions. The red solid circles, the green asterisks, the blue squares and the black pluses represent the data in the Kuroshio Extension (KE), the Gulf Stream (GS), the Brazil-Malvinas Confluence (BMC) and the Agulhas Return Current (ARC) regions respectively.

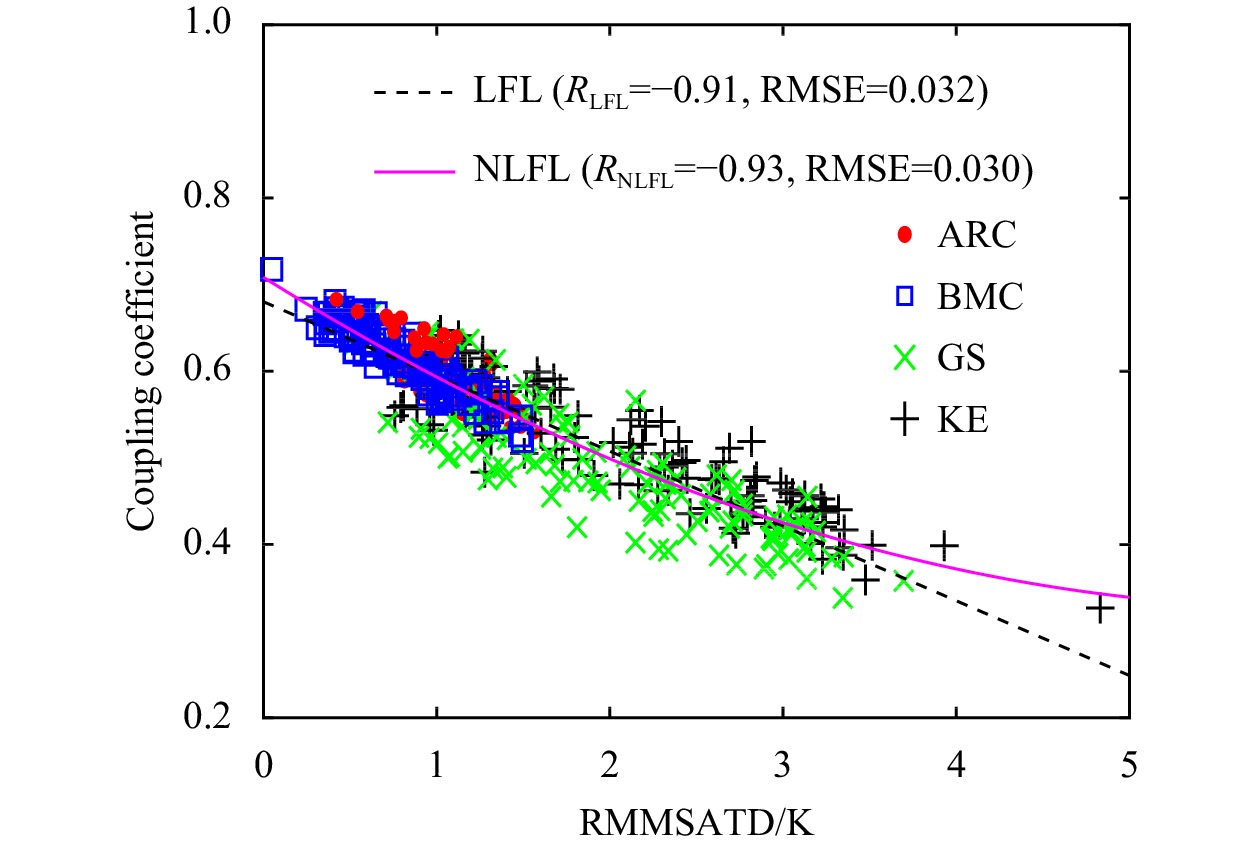
Figure 8. The linear and the nonlinear relationships between RMMSATD and the coupling coefficient. The dashed and the solid lines denote the linear (LFL) and the nonlinear fitting lines (NLFL), respectively. R and RMSE denote the correlation coefficient and the root-mean-square error.
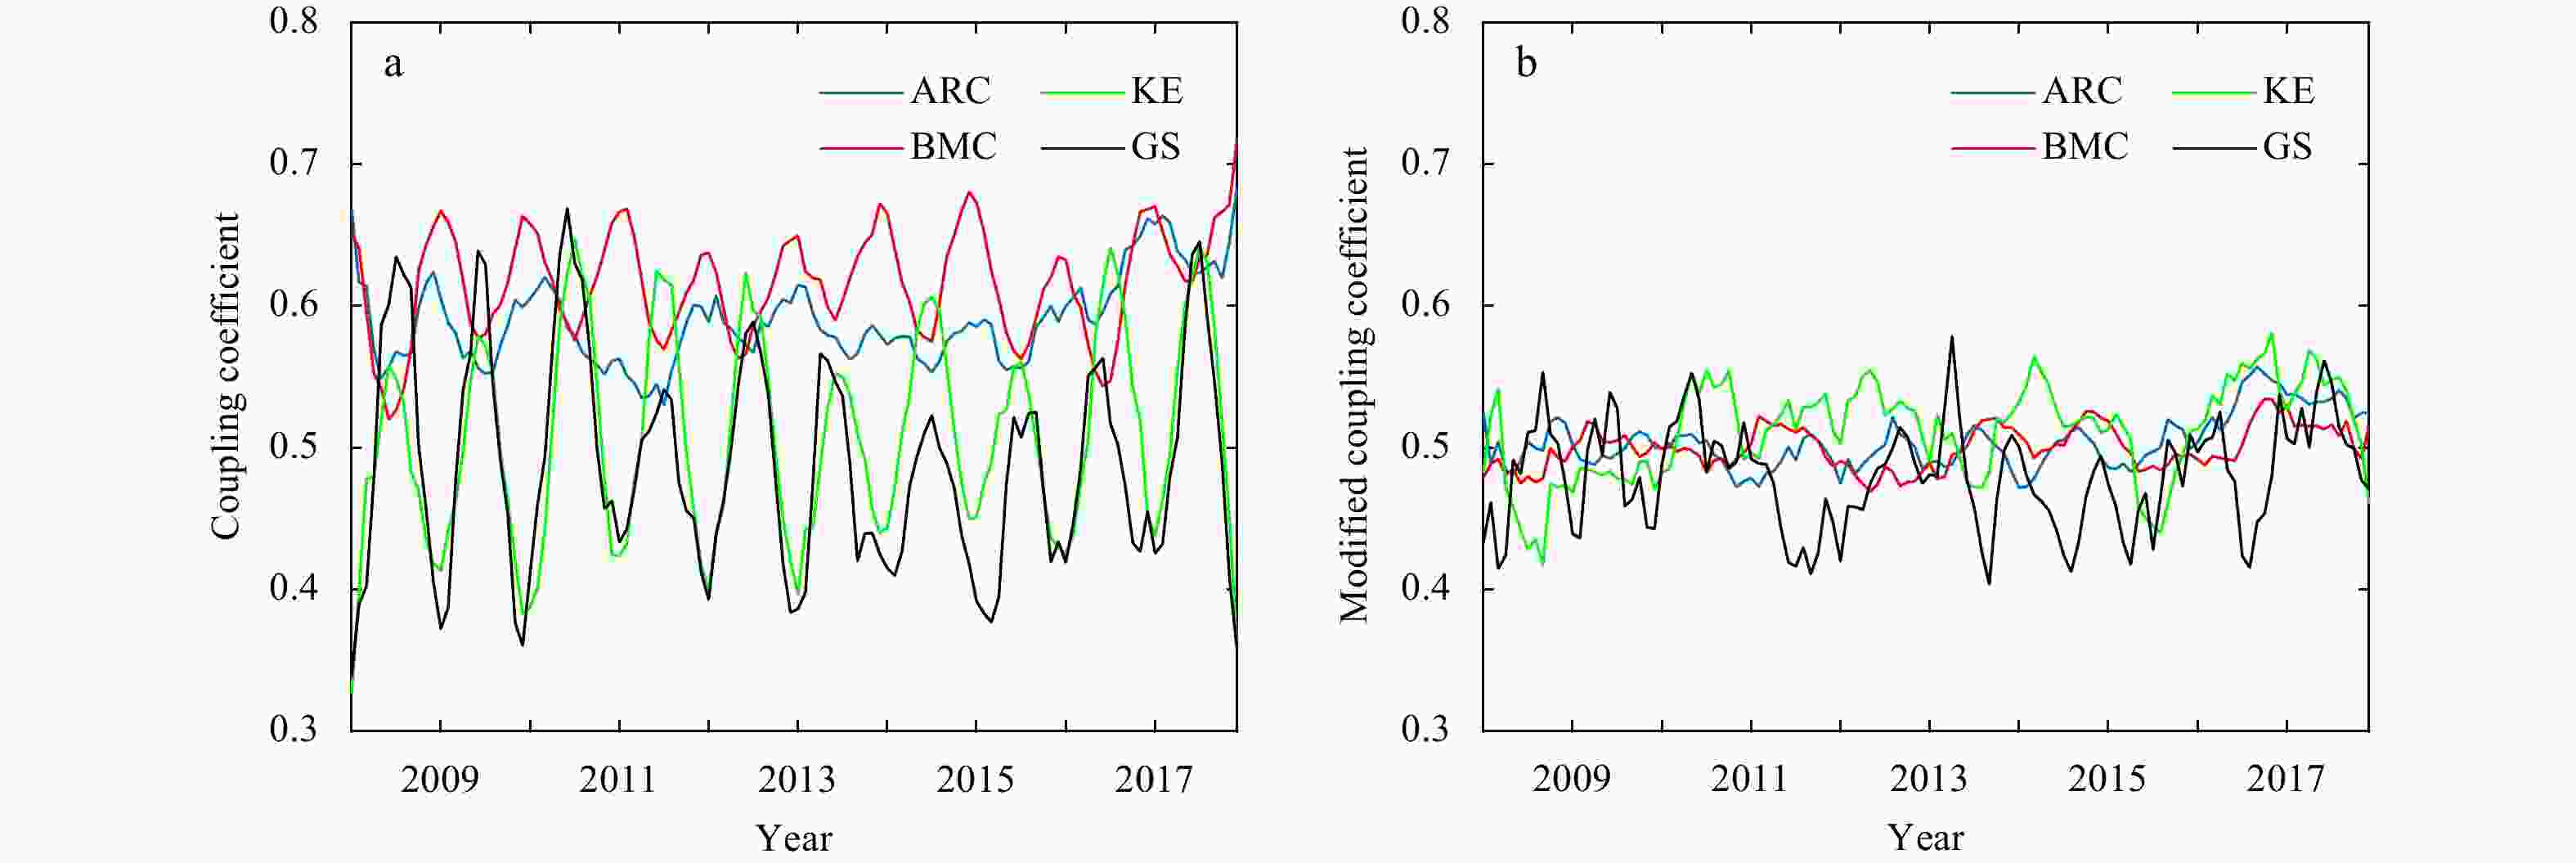
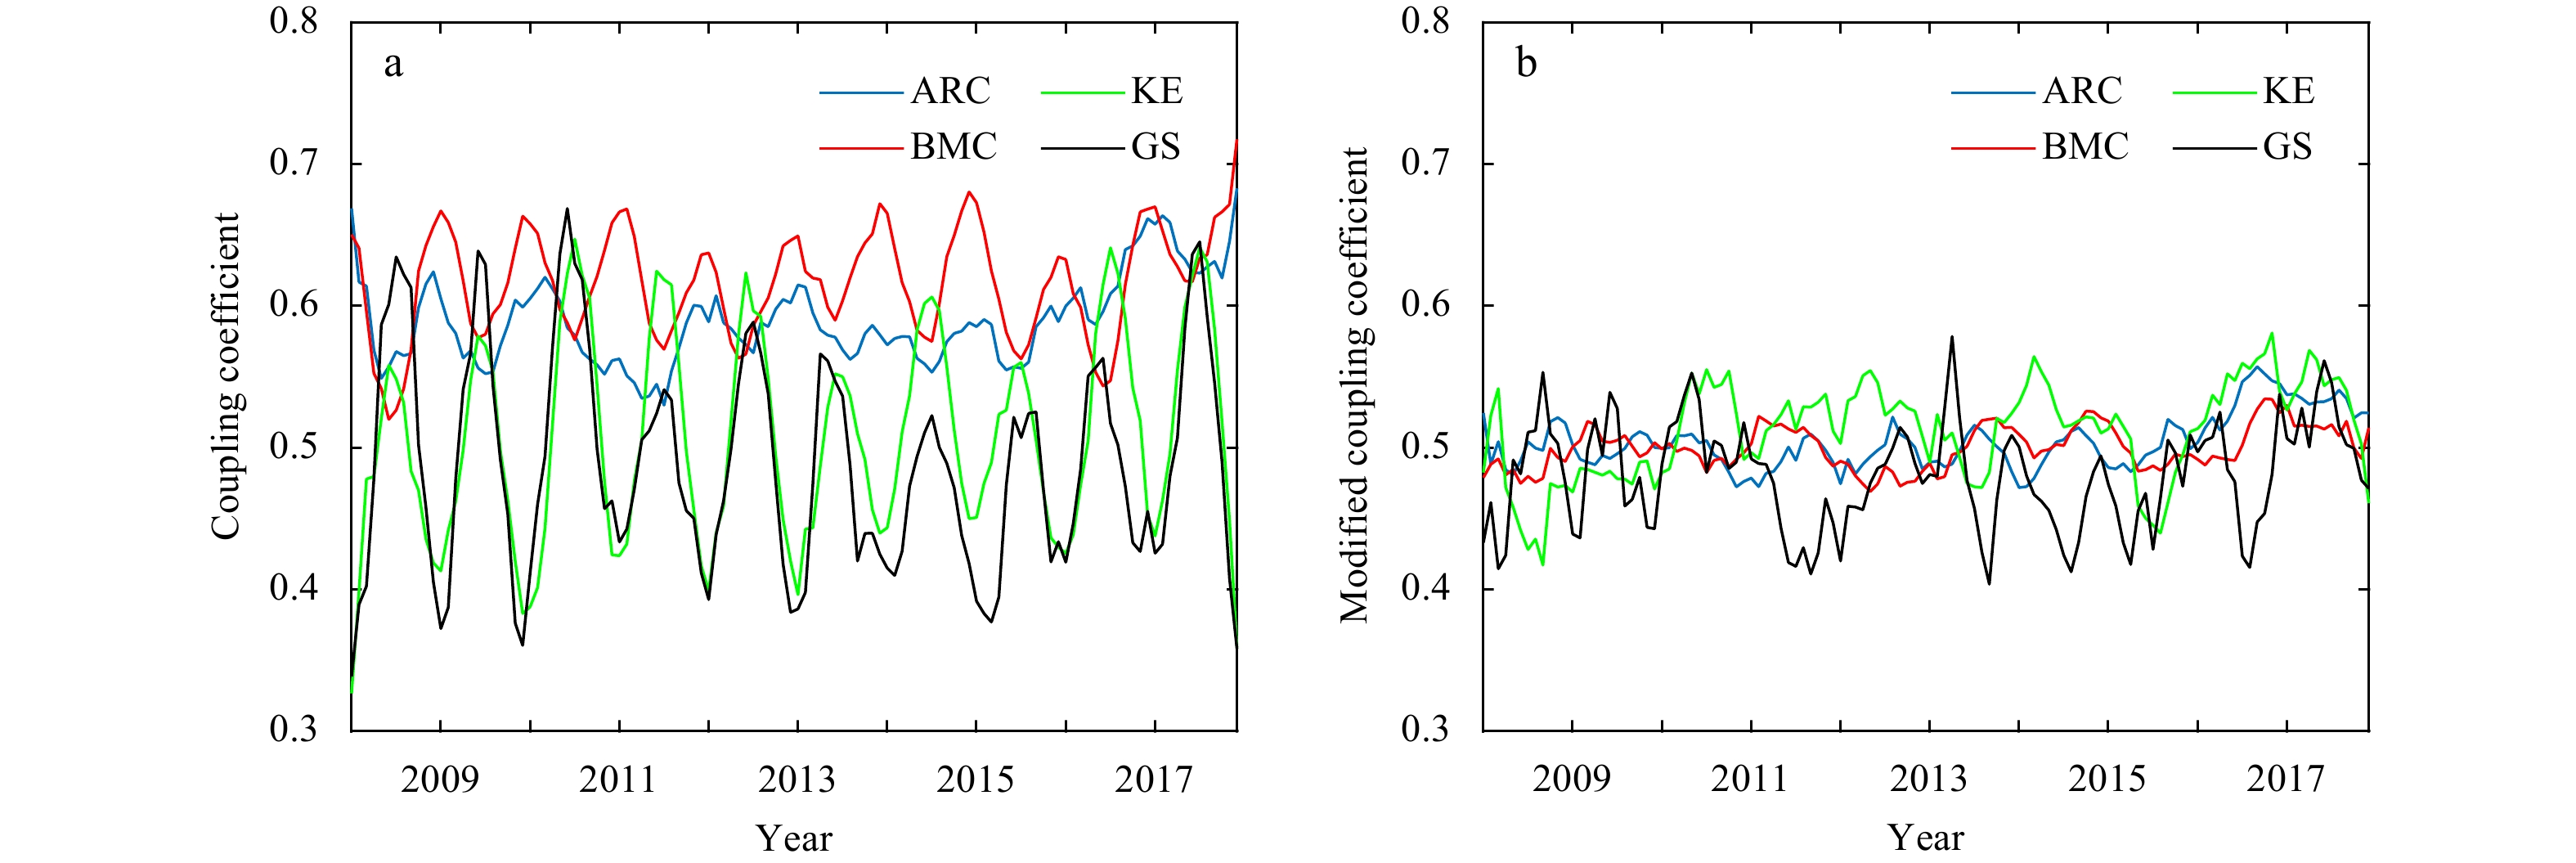
Figure 9. The coupling coefficient (a) and the modified coupling coefficient (b) from January 2008 to December 2017 over the four regions.
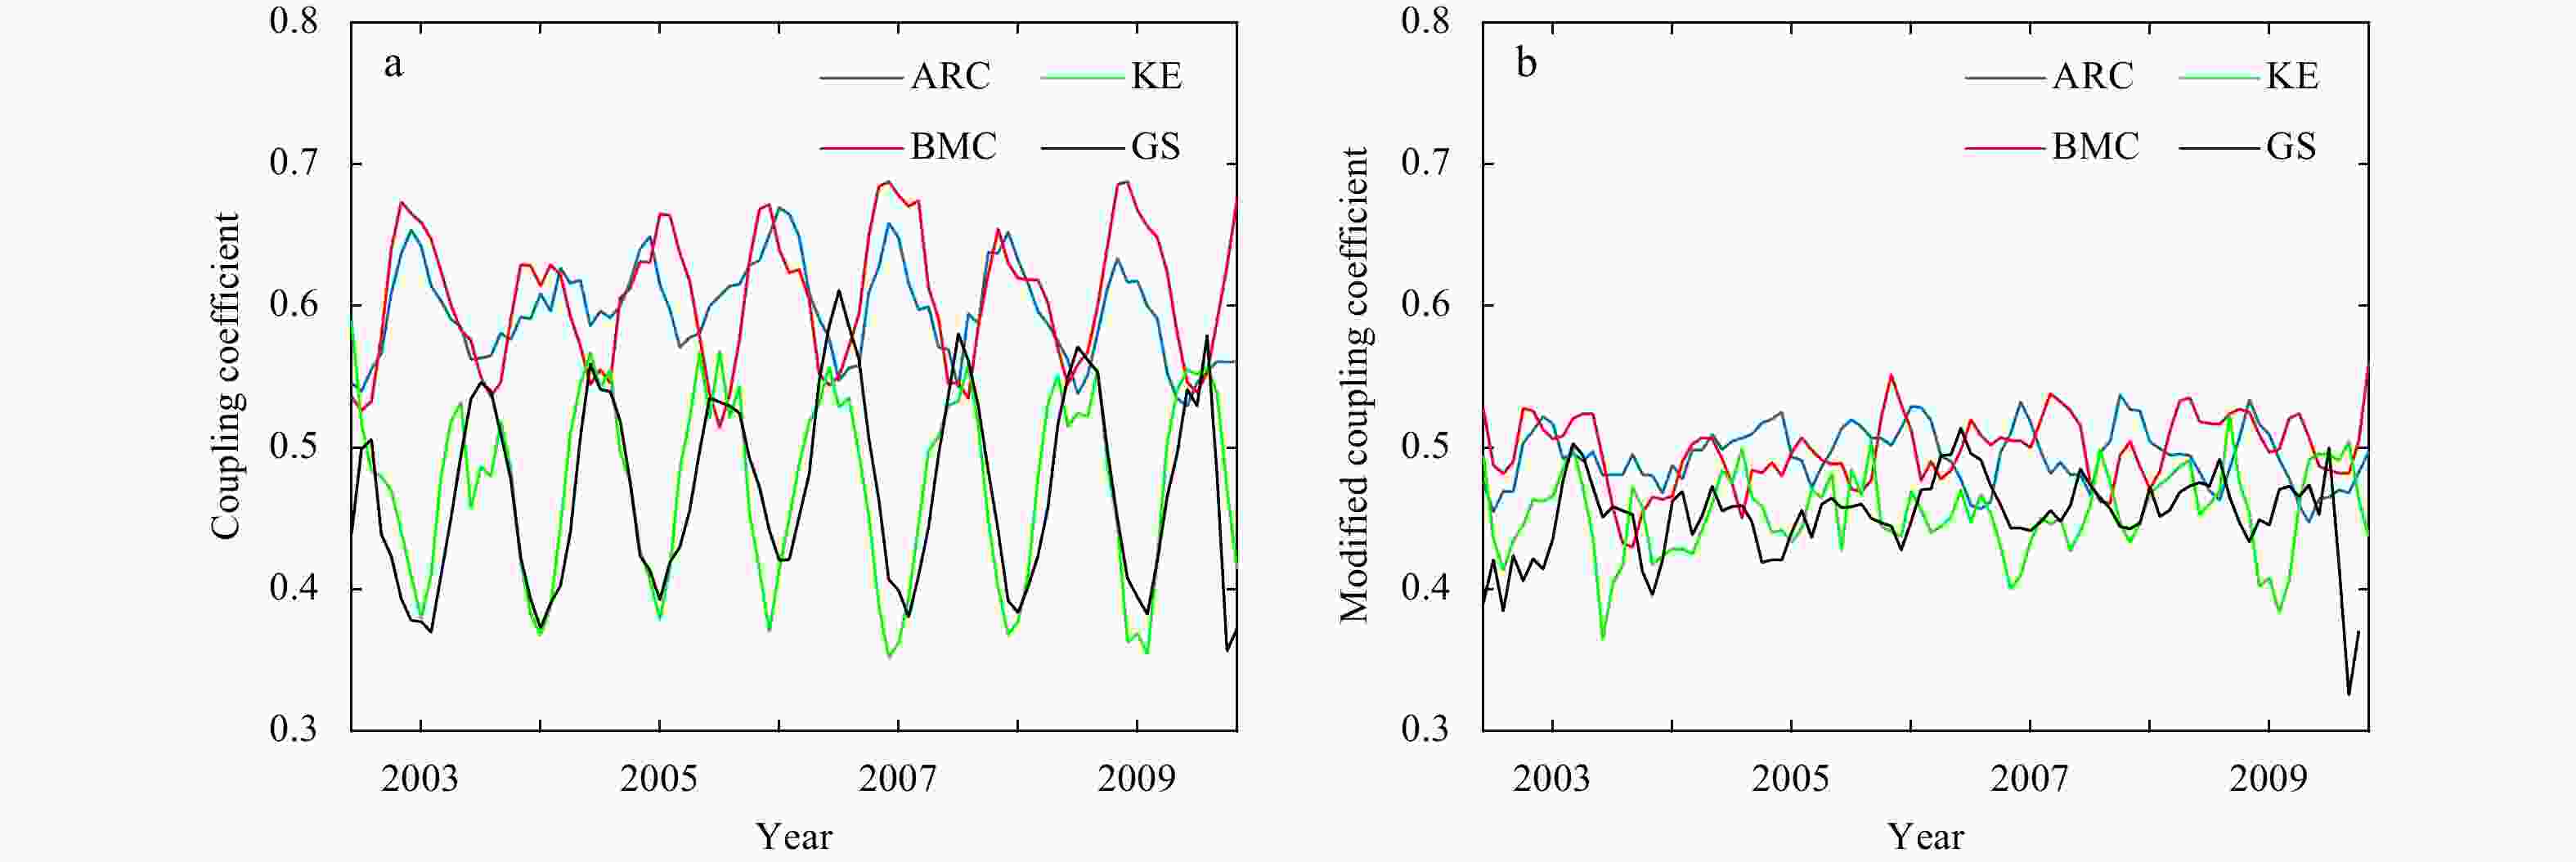
Figure 10. The coupling coefficient (a) and the modified coupling coefficient (b) , the wind filed and SST data were acquired by QSCAT and AMSR-E from June 2002 to November 2009, respectively.
Table 1. The correlation coefficients between coupling coefficient and the environment parameters over the four areas
Sea area Environment parameters Correlation coefficient Sea area Environment parameters Correlation coefficient KE RMMSST 0.43 BMC RMMSST 0.37 RMMWS −0.88 RMMWS −0.71 RMMAT 0.65 RMMAT 0.66 RMMSATD −0.93 RMMSATD −0.94 GS RMMSST 0.76 ARC RMMSST 0.45 RMMWS −0.83 RMMWS −0.62 RMMAT 0.87 RMMAT 0.55 RMMSATD −0.89 RMMSATD −0.86  下载: 导出CSV
Table 2. The cross-correlation coefficients between the four environment parameters
RMMSST RMMWS RMMAT RMMSATD RMMSST 1 −0.66 0.97 −0.51 RMMWS −0.66 1 −0.79 0.85 RMMAT 0.97 −0.79 1 −0.70 RMMSATD −0.51 0.85 −0.70 1
下载: 导出CSV
-
[1] Chelton D B, Esbensen S K, Schlax M G, et al. 2001. Observations of coupling between surface wind stress and sea surface temperature in the eastern tropical Pacific. Journal of Climate, 14(7): 1479–1498. doi: 10.1175/1520-0442(2001)014<1479:OOCBSW>2.0.CO;2 [2] Chelton D B, Schlax M G, Freilich M H, et al. 2004. Satellite measurements reveal persistent small-scale features in ocean winds. Science, 303(5660): 978–983. doi: 10.1126/science.1091901 [3] Chelton D B, Schlax M G, Samelson R M. 2007. Summertime coupling between sea surface temperature and wind stress in the California Current System. Journal of Physical Oceanography, 37(3): 495–517. doi: 10.1175/JPO3025.1 [4] Chelton D B, Xie Shangping. 2010. Coupled ocean-atmosphere interaction at oceanic mesoscales. Oceanography, 23(4): 52–69. doi: 10.5670/oceanog.2010.05 [5] Large W G, Pond S. 1981. Open ocean momentum flux measurements in moderate to strong winds. Journal of Physical Oceanography, 11(3): 324–336. doi: 10.1175/1520-0485(1981)011<0324:OOMFMI>2.0.CO;2 [6] Liu W T, Xie Xiaosu. 2008. Ocean-atmosphere momentum coupling in the Kuroshio Extension observed from space. Journal of Oceanography, 64(4): 631–637. doi: 10.1007/s10872-008-0053-x [7] Liu W T, Xie Xiaosu, Niiler P P. 2007. Ocean-atmosphere interaction over Agulhas Extension meanders. Journal of Climate, 20(23): 5784–5797. doi: 10.1175/2007JCLI1732.1 [8] Liu W T, Xie Xiaosu, Polito P S, et al. 2000. Atmospheric manifestation of tropical instability wave observed by QuikSCAT and tropical rain measuring mission. Geophysical Research Letter, 27(16): 2545–2548. doi: 10.1029/2000GL011545 [9] Liu W T, Zhang Anzhen, Bishop J K B. 1994. Evaporation and solar irradiance as regulators of sea surface temperature in annual and interannual changes. Journal of Geophysical Research: Oceans, 99(C6): 12623–12637. doi: 10.1029/94JC00604 [10] Maloney E D, Chelton D B. 2006. An assessment of the sea surface temperature influence on surface wind stress in numerical weather prediction and climate models. Journal of Climate, 19(12): 2743–2762. doi: 10.1175/JCLI3728.1 [11] Mantua N J, Hare S R, Zhang Yuan, et al. 1997. A pacific interdecadal climate oscillation with impacts on salmon production. Bulletin of the American Meteorological Society, 78(6): 1069–1080. doi: 10.1175/1520-0477(1997)078<1069:APICOW>2.0.CO;2 [12] Monin A S, Yaglom A M, Lumley J L. 1971. Statistical Fluid Mechanics: Mechanics of Turbulence. Cambridge, MA, USA: MIT Press [13] Namias J, Cayan D R. 1981. Large-scale air-sea interactions and short-period climatic fluctuatioins. Science, 214(4523): 869–876. doi: 10.1126/science.214.4523.869 [14] Nonaka M, Xie Shangping. 2003. Covariations of sea surface temperature and wind over the Kuroshio and its extension: evidence for ocean-to-atmosphere feedback. Journal of Climate, 16(9): 1404–1413. doi: 10.1175/1520-0442(2003)16<1404:COSSTA>2.0.CO;2 [15] Okumura Y, Xie Shangping, Numaguti A, et al. 2001. Tropical Atlantic air-sea interaction and its influence on the NAO. Geophysical Research Letter, 28(8): 1507–1510. doi: 10.1029/2000GL012565 [16] O’Neill L W. 2012. Wind speed and stability effects on coupling between surface wind stress and SST observed from buoys and satellite. Journal of Climate, 25(5): 1544–1569. doi: 10.1175/JCLI-D-11-00121.1 [17] O’Neill L W, Chelton D B, Esbensen S K. 2003. Observations of SST-induced perturbations of the wind stress field over the Southern Ocean on seasonal timescales. Journal of Climate, 16(14): 2340–2354. doi: 10.1175/2780.1 [18] O’Neill L W, Chelton D B, Esbensen S K, et al. 2005. High-resolution satellite measurements of the atmospheric boundary layer response to SST variations along the Agulhas Return Current. Journal of Climate, 18(14): 2706–2723. doi: 10.1175/JCLI3415.1 [19] O’Neill L W, Chelton D B, Esbensen S K. 2010. The effects of SST-induced surface wind speed and direction gradients on midlatitude surface vorticity and divergence. Journal of Climate, 23(2): 255–281. doi: 10.1175/2009JCLI2613.1 [20] Park K A, Cornillon P C. 2002. Stability-induced modification of sea surface winds over Gulf Stream rings. Geophysical Research Letter, 29(24): 64-1–64-4 [21] Park K A, Cornillon P C, Codiga D L. 2006. Modification of surface winds near ocean fronts: effects of Gulf Stream rings on scatterometer (QuikSCAT, NSCAT) wind observations. Journal of Geophysical Research: Oceans, 111(C3): C03021 [22] Pezzi L P, Souza R B, Dourado M S, et al. 2005. Ocean-atmosphere in situ observations at the Brazil-Malvinas Confluence region. Geophysical Research Letter, 32(22): L22603 [23] Small R J, deSzoeke S P, Xie S P, et al. 2008. Air–sea interaction over ocean fronts and eddies. Dynamics of Atmospheres and Oceans, 45(3–4): 274–319 [24] Small R J, Xie Shangping, Wang Yuqing. 2003. Numerical simulation of atmospheric response to Pacific tropical instability waves. Journal of Climate, 16(22): 3723–3741. doi: 10.1175/1520-0442(2003)016<3723:NSOART>2.0.CO;2 [25] Song Qingtao, Chelton D B, Esbensen S K, et al. 2009. Coupling between sea surface temperature and low-level winds in mesoscale numerical models. Journal of Climate, 22(1): 146–164. doi: 10.1175/2008JCLI2488.1 [26] Tokinaga H, Tanimoto Y, Xie Shangping. 2005. SST-induced surface wind variations over the Brazil-Malvinas Confluence: satellite and in situ observations. Journal of Climate, 18(17): 3470–3482. doi: 10.1175/JCLI3485.1 [27] Vecchi G A, Xie Shangping, Fischer A S. 2004. Ocean-atmosphere covariability in the western Arabian Sea. Journal of Climate, 17(6): 1213–1224. doi: 10.1175/1520-0442(2004)017<1213:OCITWA>2.0.CO;2 [28] Wallace J M, Smith C, Jiang Quanrong. 1990. Spatial patterns of atmosphere-ocean interaction in the northern winter. Journal of Climate, 3(9): 990–998. doi: 10.1175/1520-0442(1990)003<0990:SPOAOI>2.0.CO;2 [29] Wang Yunhua, Zhang Yanmin, Chen Haihua, et al. 2014. Effects of atmospheric stability and wind fetch on microwave sea echoes. IEEE Transactions on Geoscience and Remote Sensing, 52(2): 929–935. doi: 10.1109/TGRS.2013.2245673 [30] Wu Jin. 1980. Wind-stress coefficients over sea surface near neutral conditions—a revisit. Journal of Physical Oceanography, 10(5): 727–740. doi: 10.1175/1520-0485(1980)010<0727:WSCOSS>2.0.CO;2 [31] Xie Shangping. 2004. Satellite observations of cool ocean-atmosphere interaction. Bulletin of the American Meteorological Society, 85(2): 195–208. doi: 10.1175/BAMS-85-2-195 [32] Xie Shangping, Ishiwatari M, Hashizume H, et al. 1998. Coupled ocean-atmospheric waves on the equatorial front. Geophysical Research Letter, 25(20): 3863–3866. doi: 10.1029/1998GL900014 [33] Xu Haiming, Tokinaga H, Xie Shangping. 2010. Atmospheric effects of the Kuroshio large meander during 2004–05. Journal of Climate, 23(17): 4704–4715. doi: 10.1175/2010JCLI3267.1 -


 点击查看大图

计量
- 文章访问数: 339
- HTML全文浏览量: 117
- PDF下载量: 16
- 被引次数: 0

