-
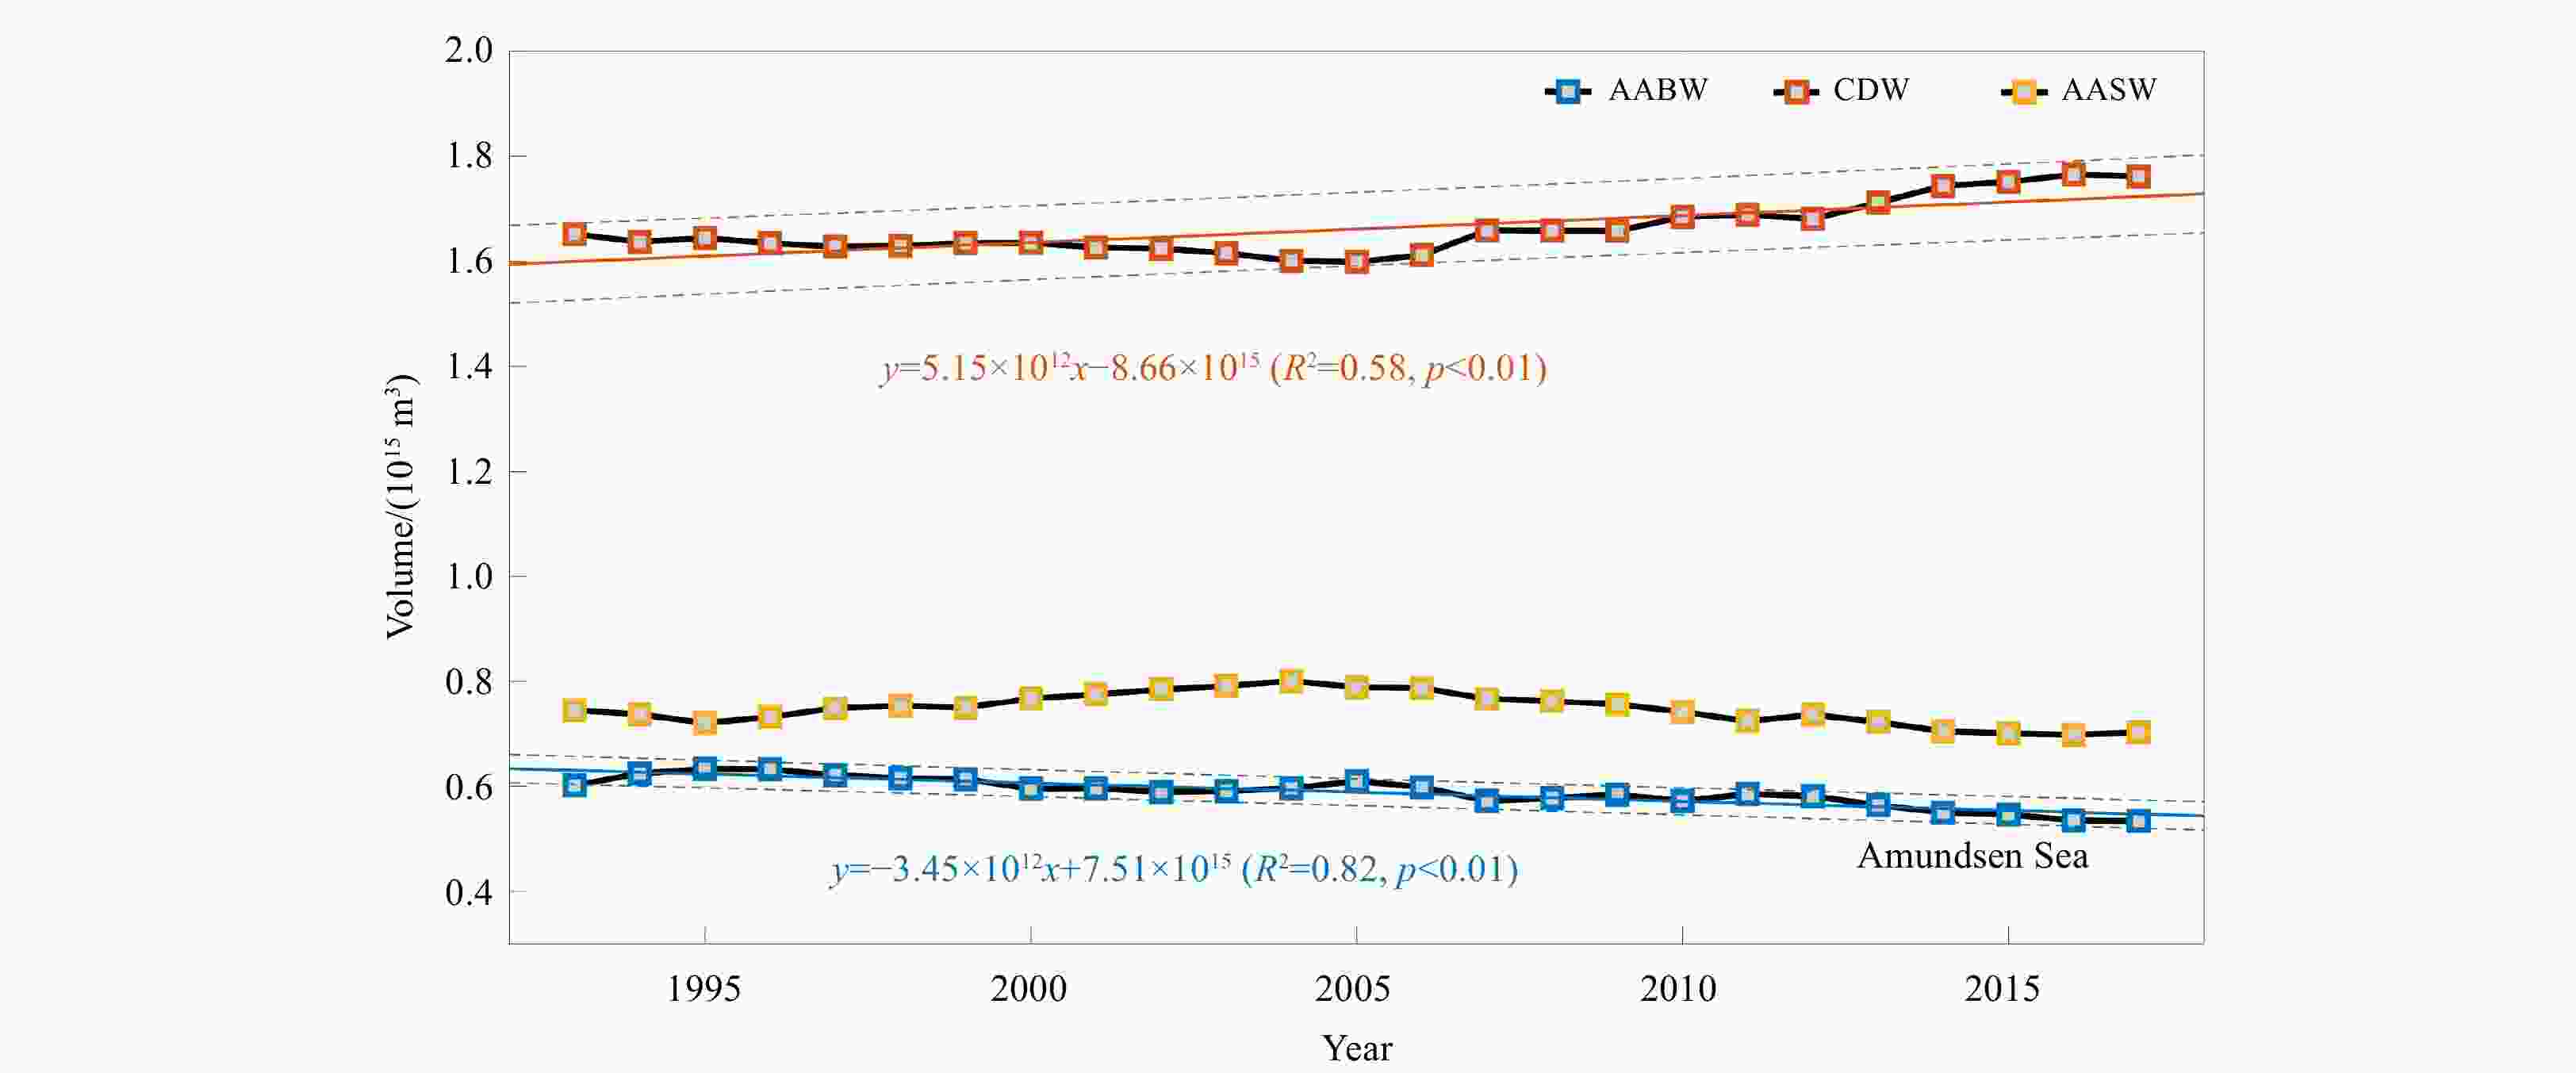
Abstract: Antarctic Bottom Water (AABW) plays an important role in the meridional overturning circulation and contributes significantly to global heat transport and sea level rise (SLR). Based on the Global Ocean (1/12)° Physical Reanalysis (GLORYS12V1) products and conductivity-temperature-depth instrument data from the World Ocean Circulation Experiment hydrographic program, we analyzed the trends in the thickness, volume, temperature, salinity, and neutral density of the AABW in the Amundsen Sea from 1993 to 2017. Over the past 25 years, the volume has decreased by 3.45×10¹² m3/a, thinning at a rate of 5 m/a. In the vertical direction, the contraction of the AABW is compensated by the volume expansion of the Circumpolar Deep Water. As the volume of AABW decreases, the temperature of the AABW increases by about 0.002°C/a. This warming is equivalent to a heat flux of 0.27 W/m2. A local SLR is produced due to thermal expansion of 0.35 mm/a. During the study period, the neutral density decreased by 0.000 3 kg/(m3∙a) due to warming. In the horizontal direction, the volume of AABW flowing from the Ross Sea into the Amundsen Sea gradually decreases and the temperature of the AABW increases continuously. The horizontal transport loss of the AABW volume is 4.07×10¹⁴ m3 and the horizontal heat transport results in a 0.03°C increase in the temperature of the AABW.
-
Key words:
- Antarctic Bottom Water /
- Amundsen Sea /
- thickness /
- volume /
- hydrographic property
-
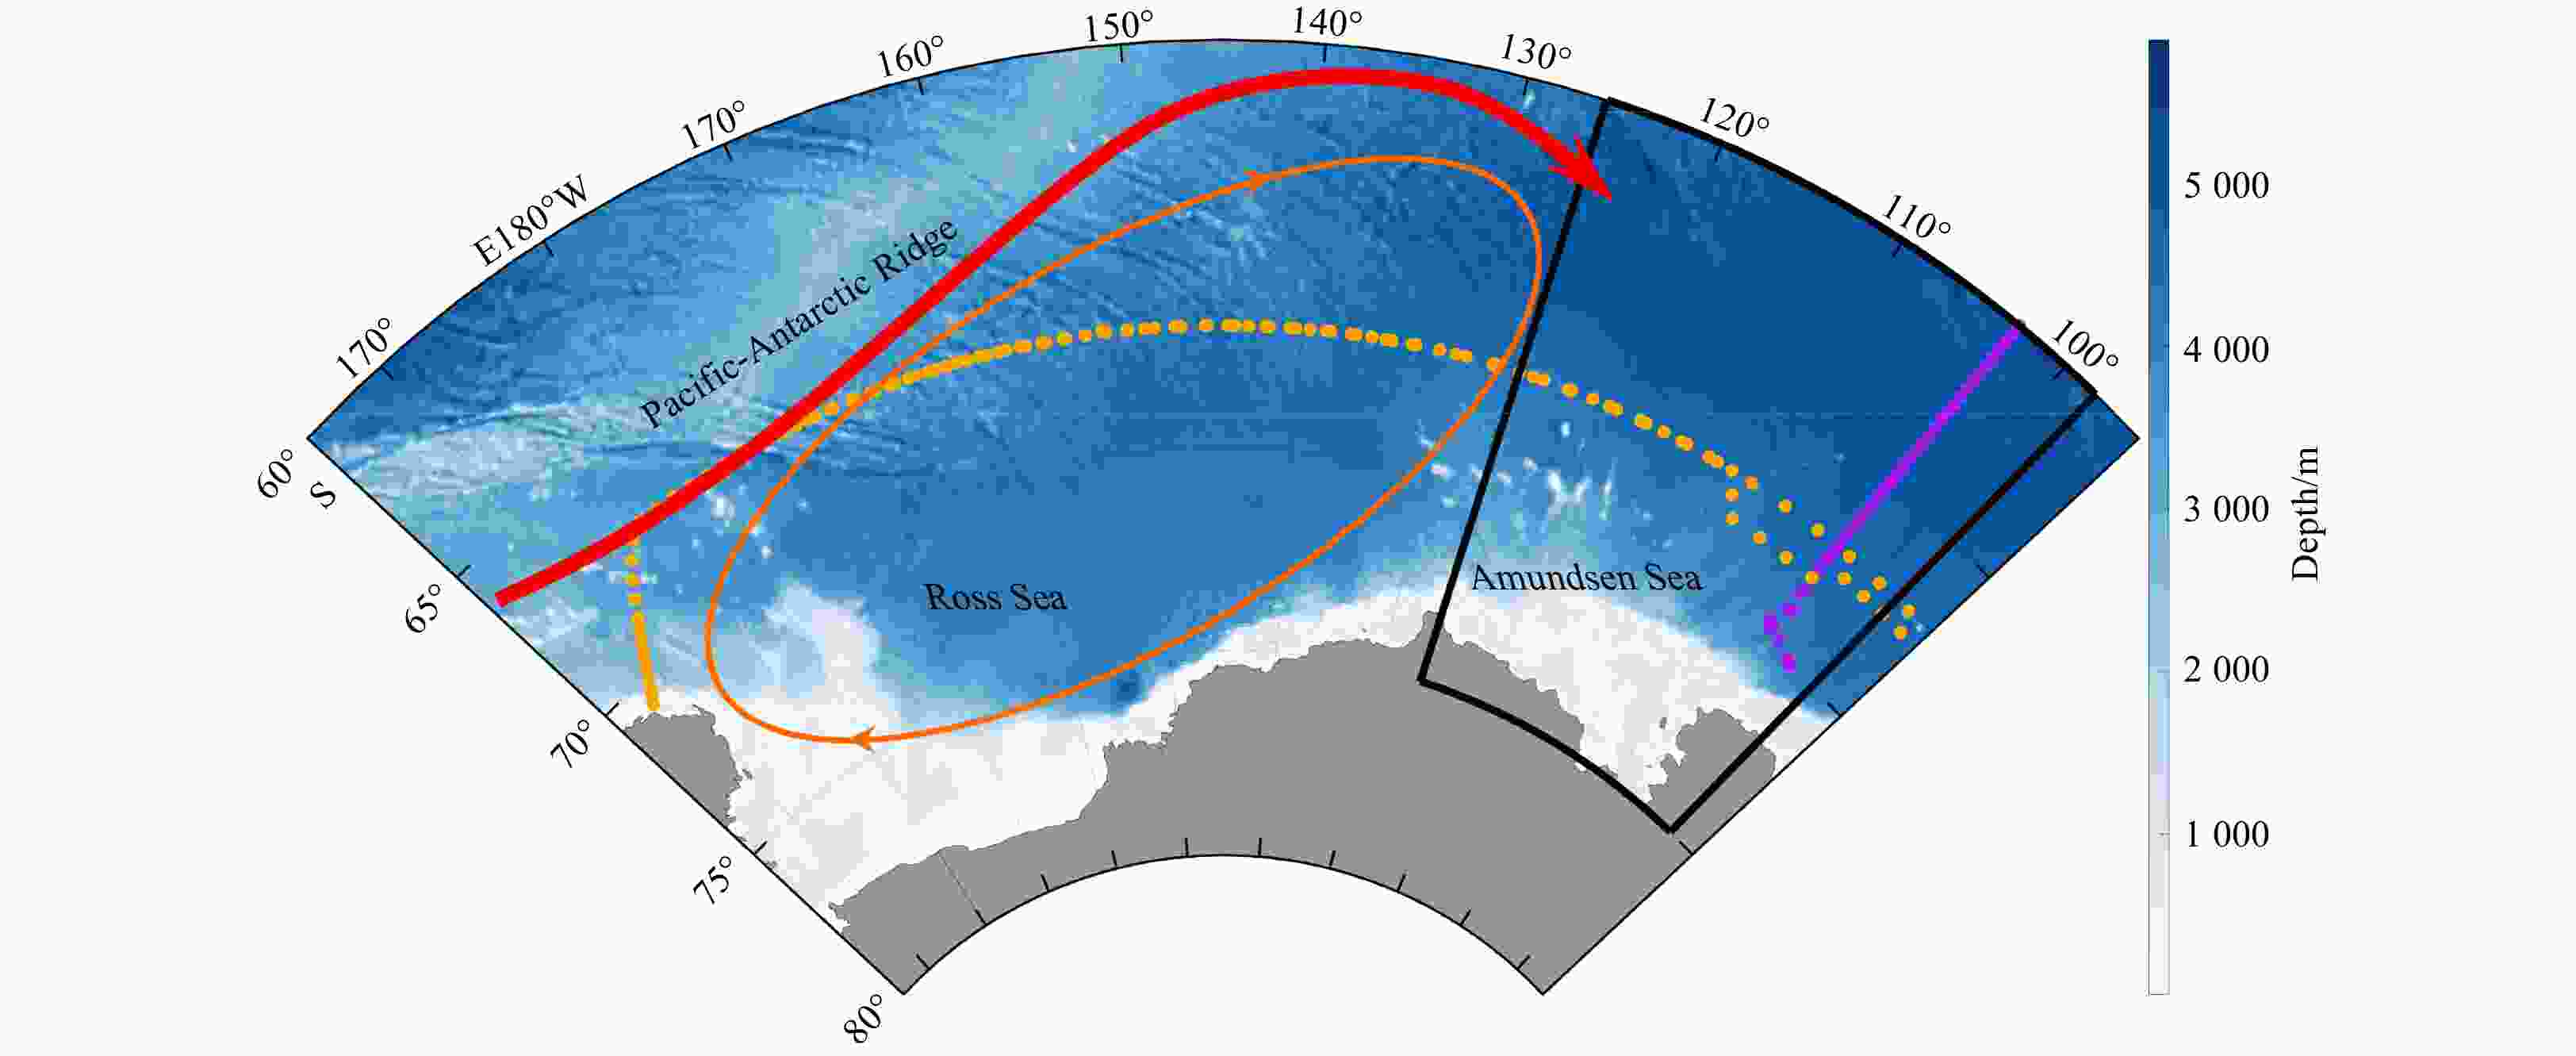
Figure 1. The bathymetry and station locations in the main study area, with purple dots for the P18 (including 1994, 2007, and 2016), yellow dots for the S04P (including 2011 and 2018), and the Amundsen Sea within the black box. The red and orange arrows represent the schematic pathway of the Antarctic Bottom Water and Ross Gyre, respectively.
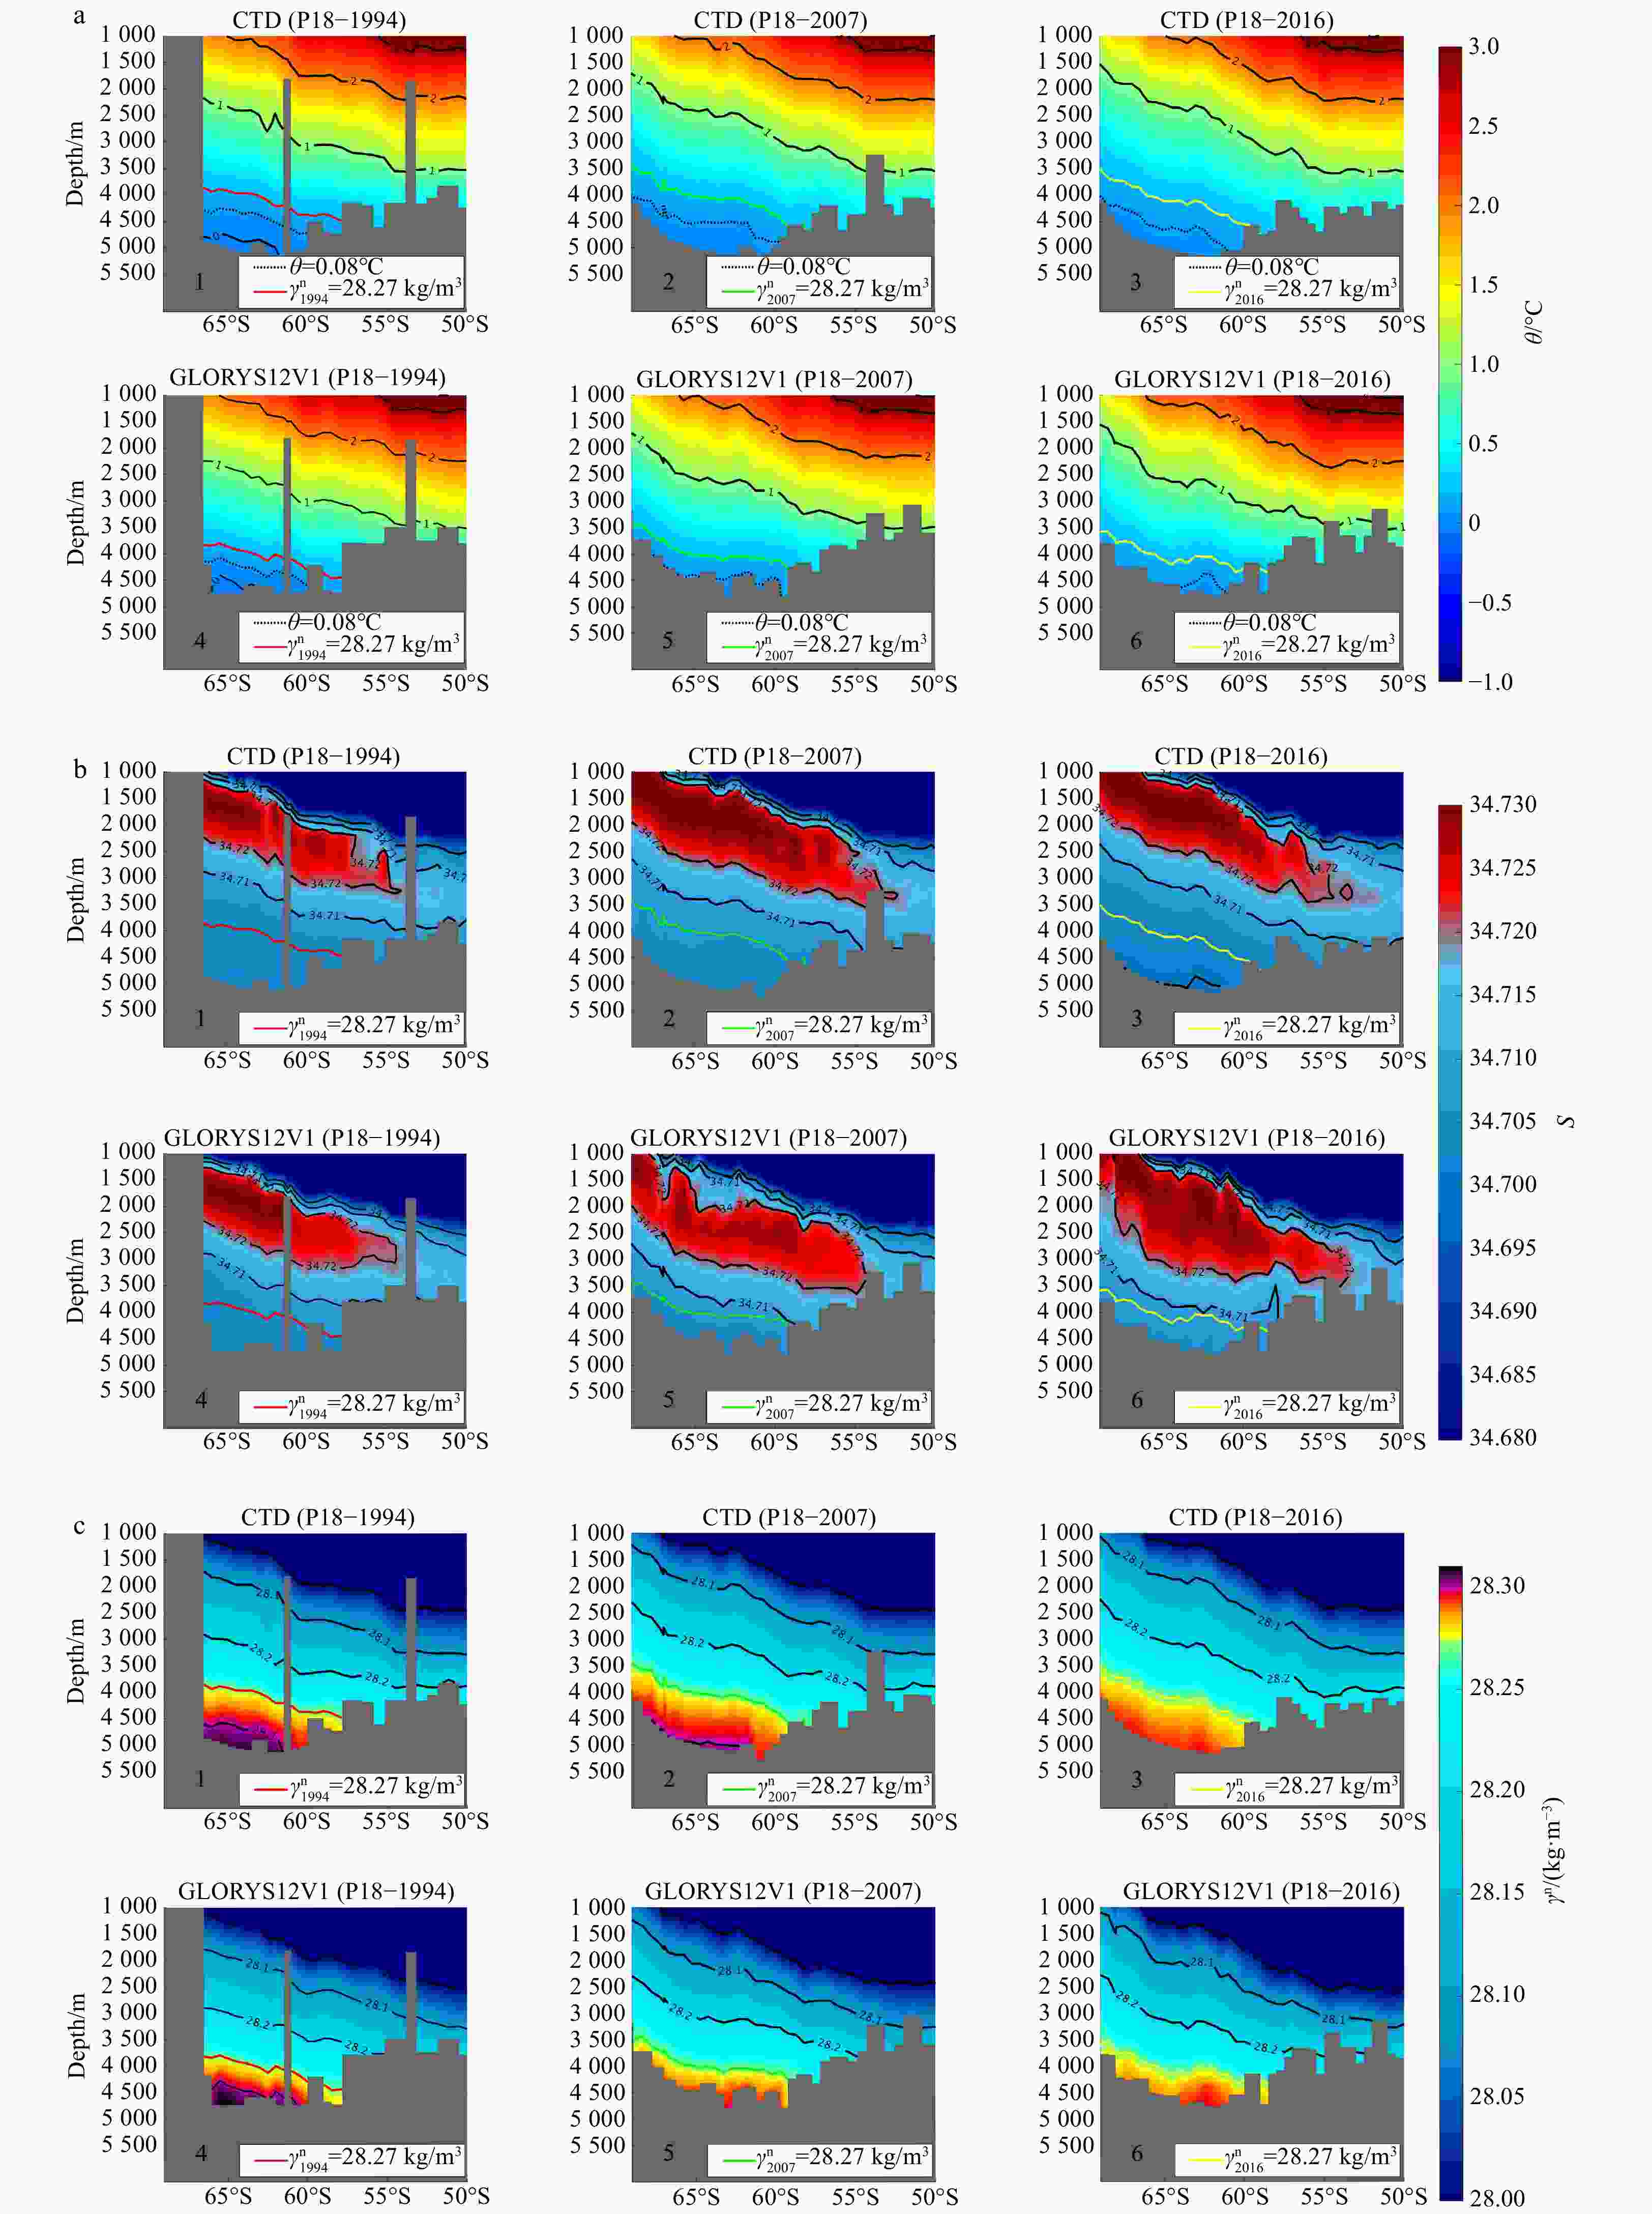
Figure 2. Comparison of conductivity temperature depth (CTD) section with GLORYS12V1 section in the P18, where the black solid line represents the contour; the black dashed line in a represents the 0.08°C contour; the red solid line represents the 1994 Antarctic Bottom Water (AABW) upper boundary position; the green solid line represents the 2007 AABW upper boundary position; and the yellow solid line represents the 2016 AABW upper boundary position. a, b, and c show the temperature (θ), salinity (S), and neutral density (γn) comparisons, respectively.
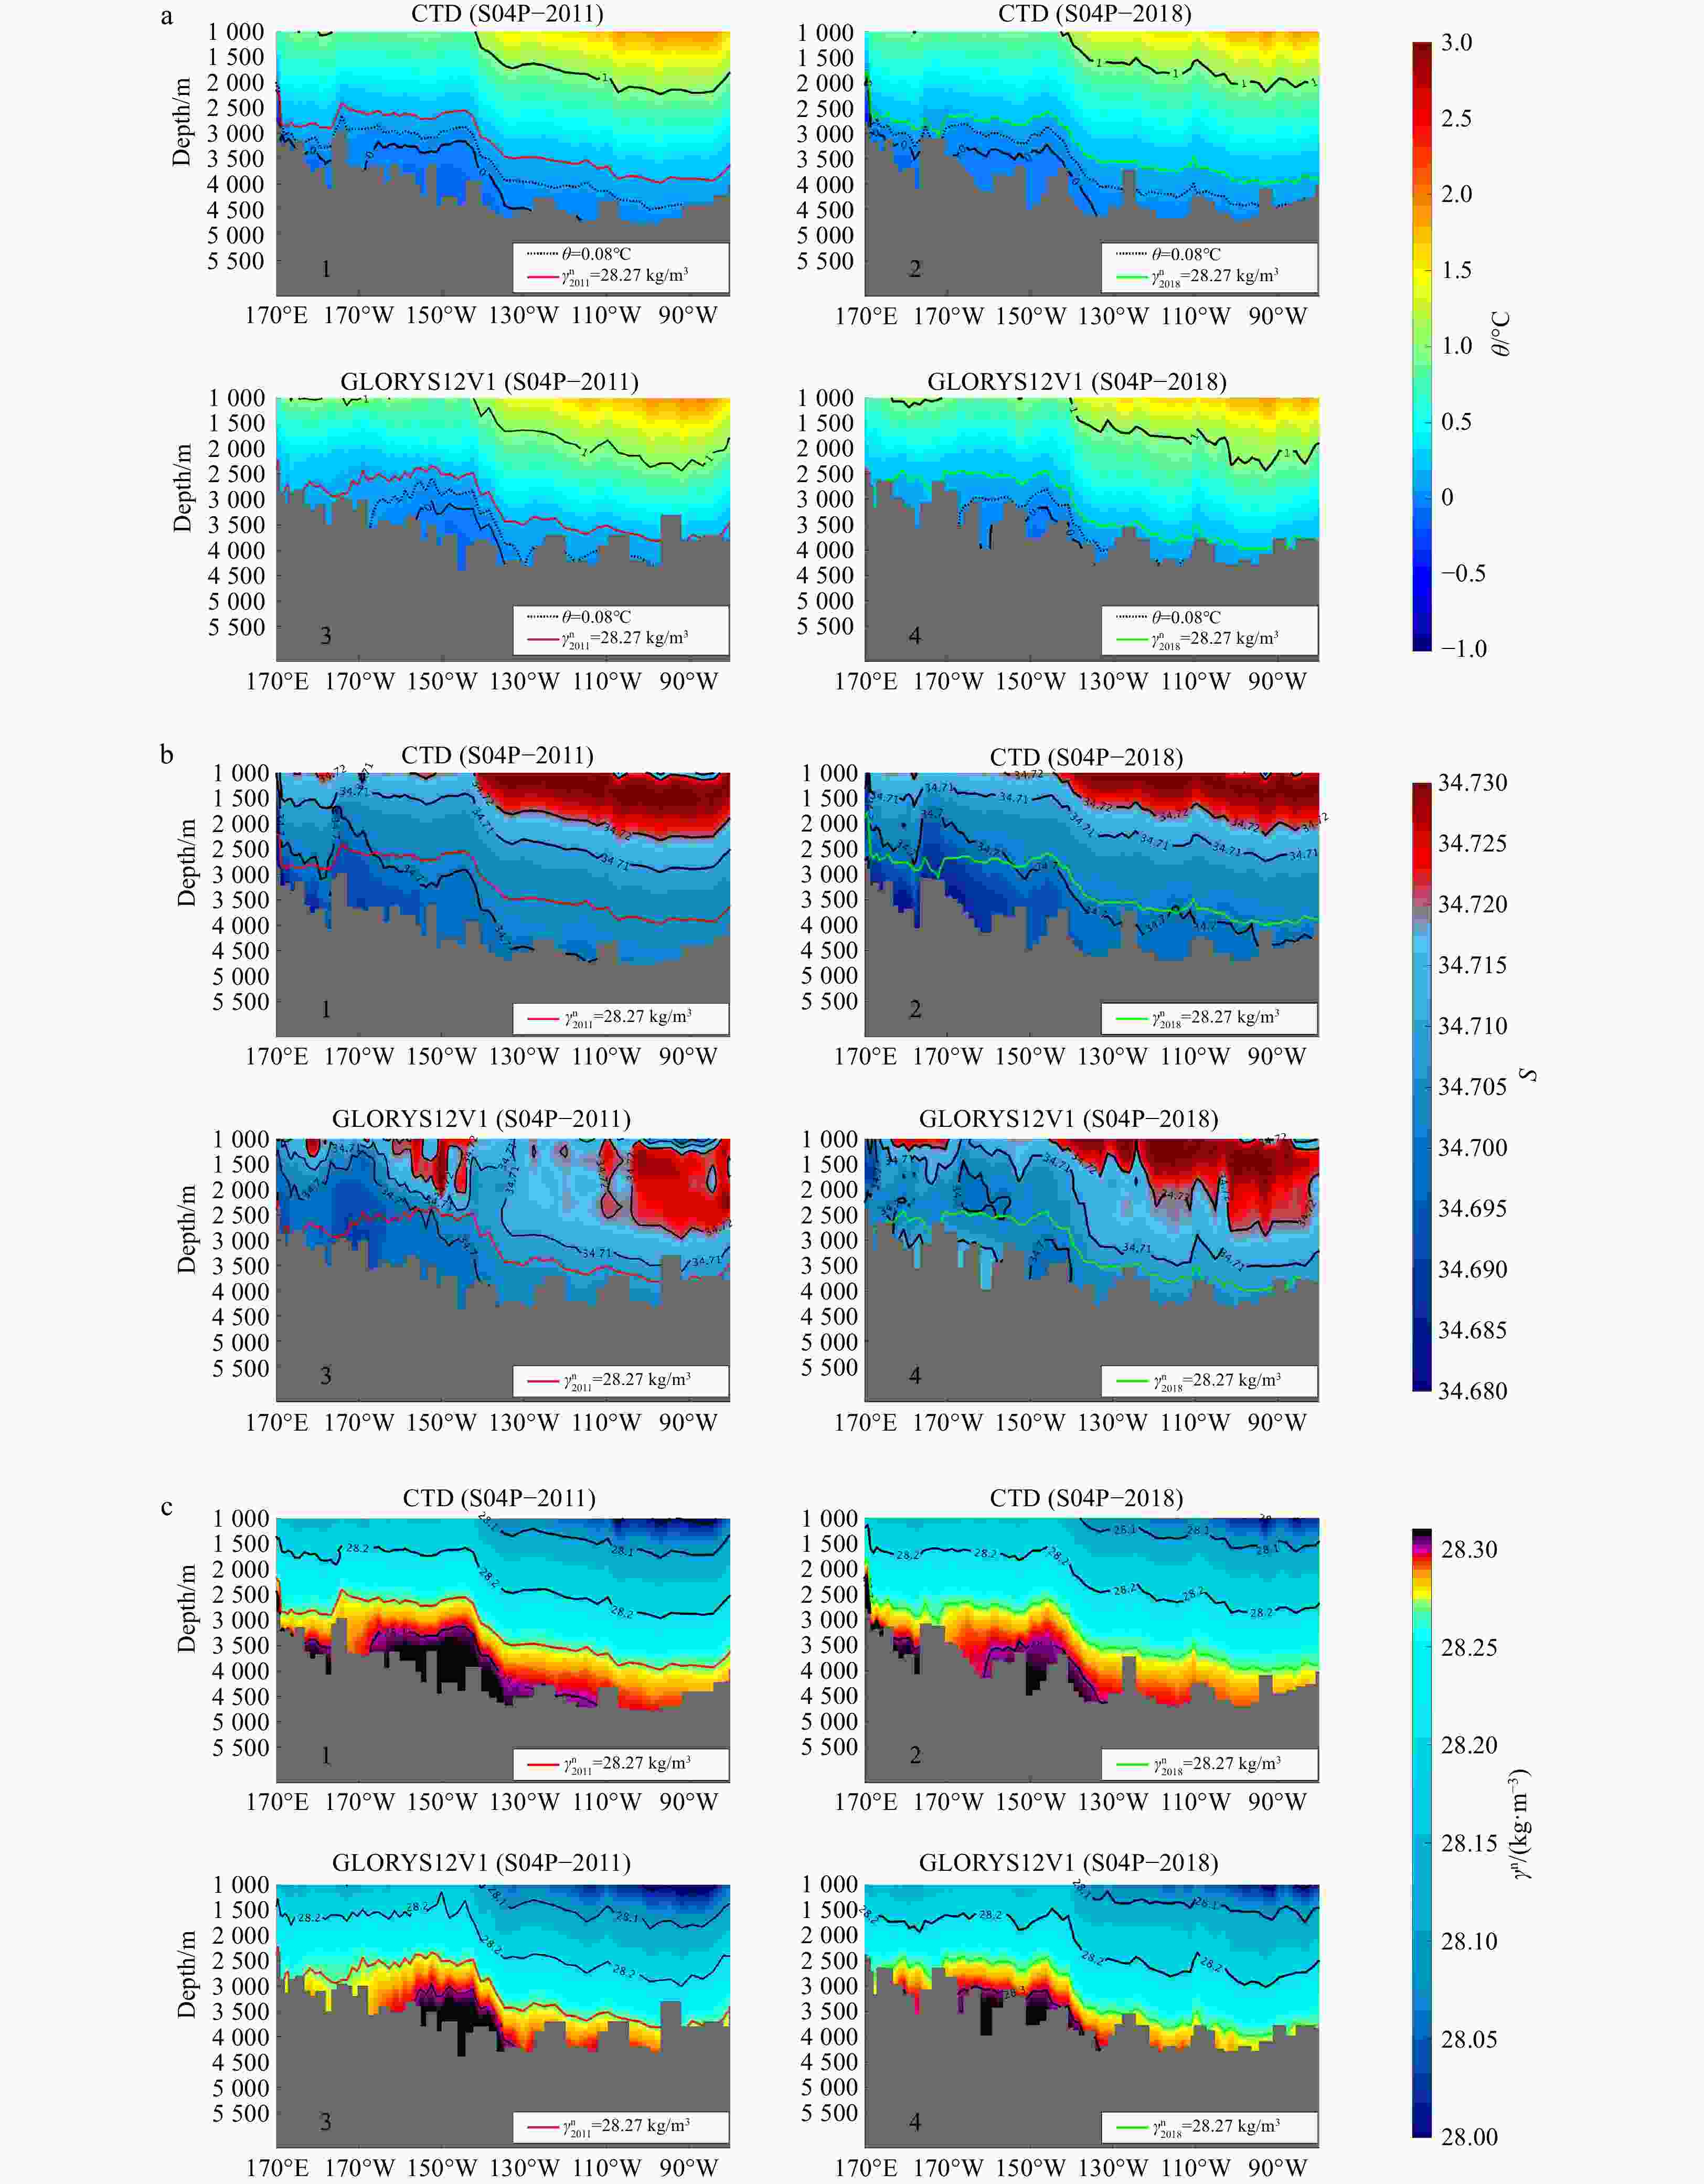
Figure 3. Comparison of conductivity temperature depth (CTD) section with GLORYS12V1 section in the S04P, where the black solid line represents the contour, the black dashed line in a represents the 0.08°C contour; the red solid line represents the 2011 Antarctic Bottom Water (AABW) upper boundary position; and the green solid line represents the 2018 AABW upper boundary position. a, b, and c show the temperature (θ), salinity (S), and neutral density (γn) comparisons, respectively.
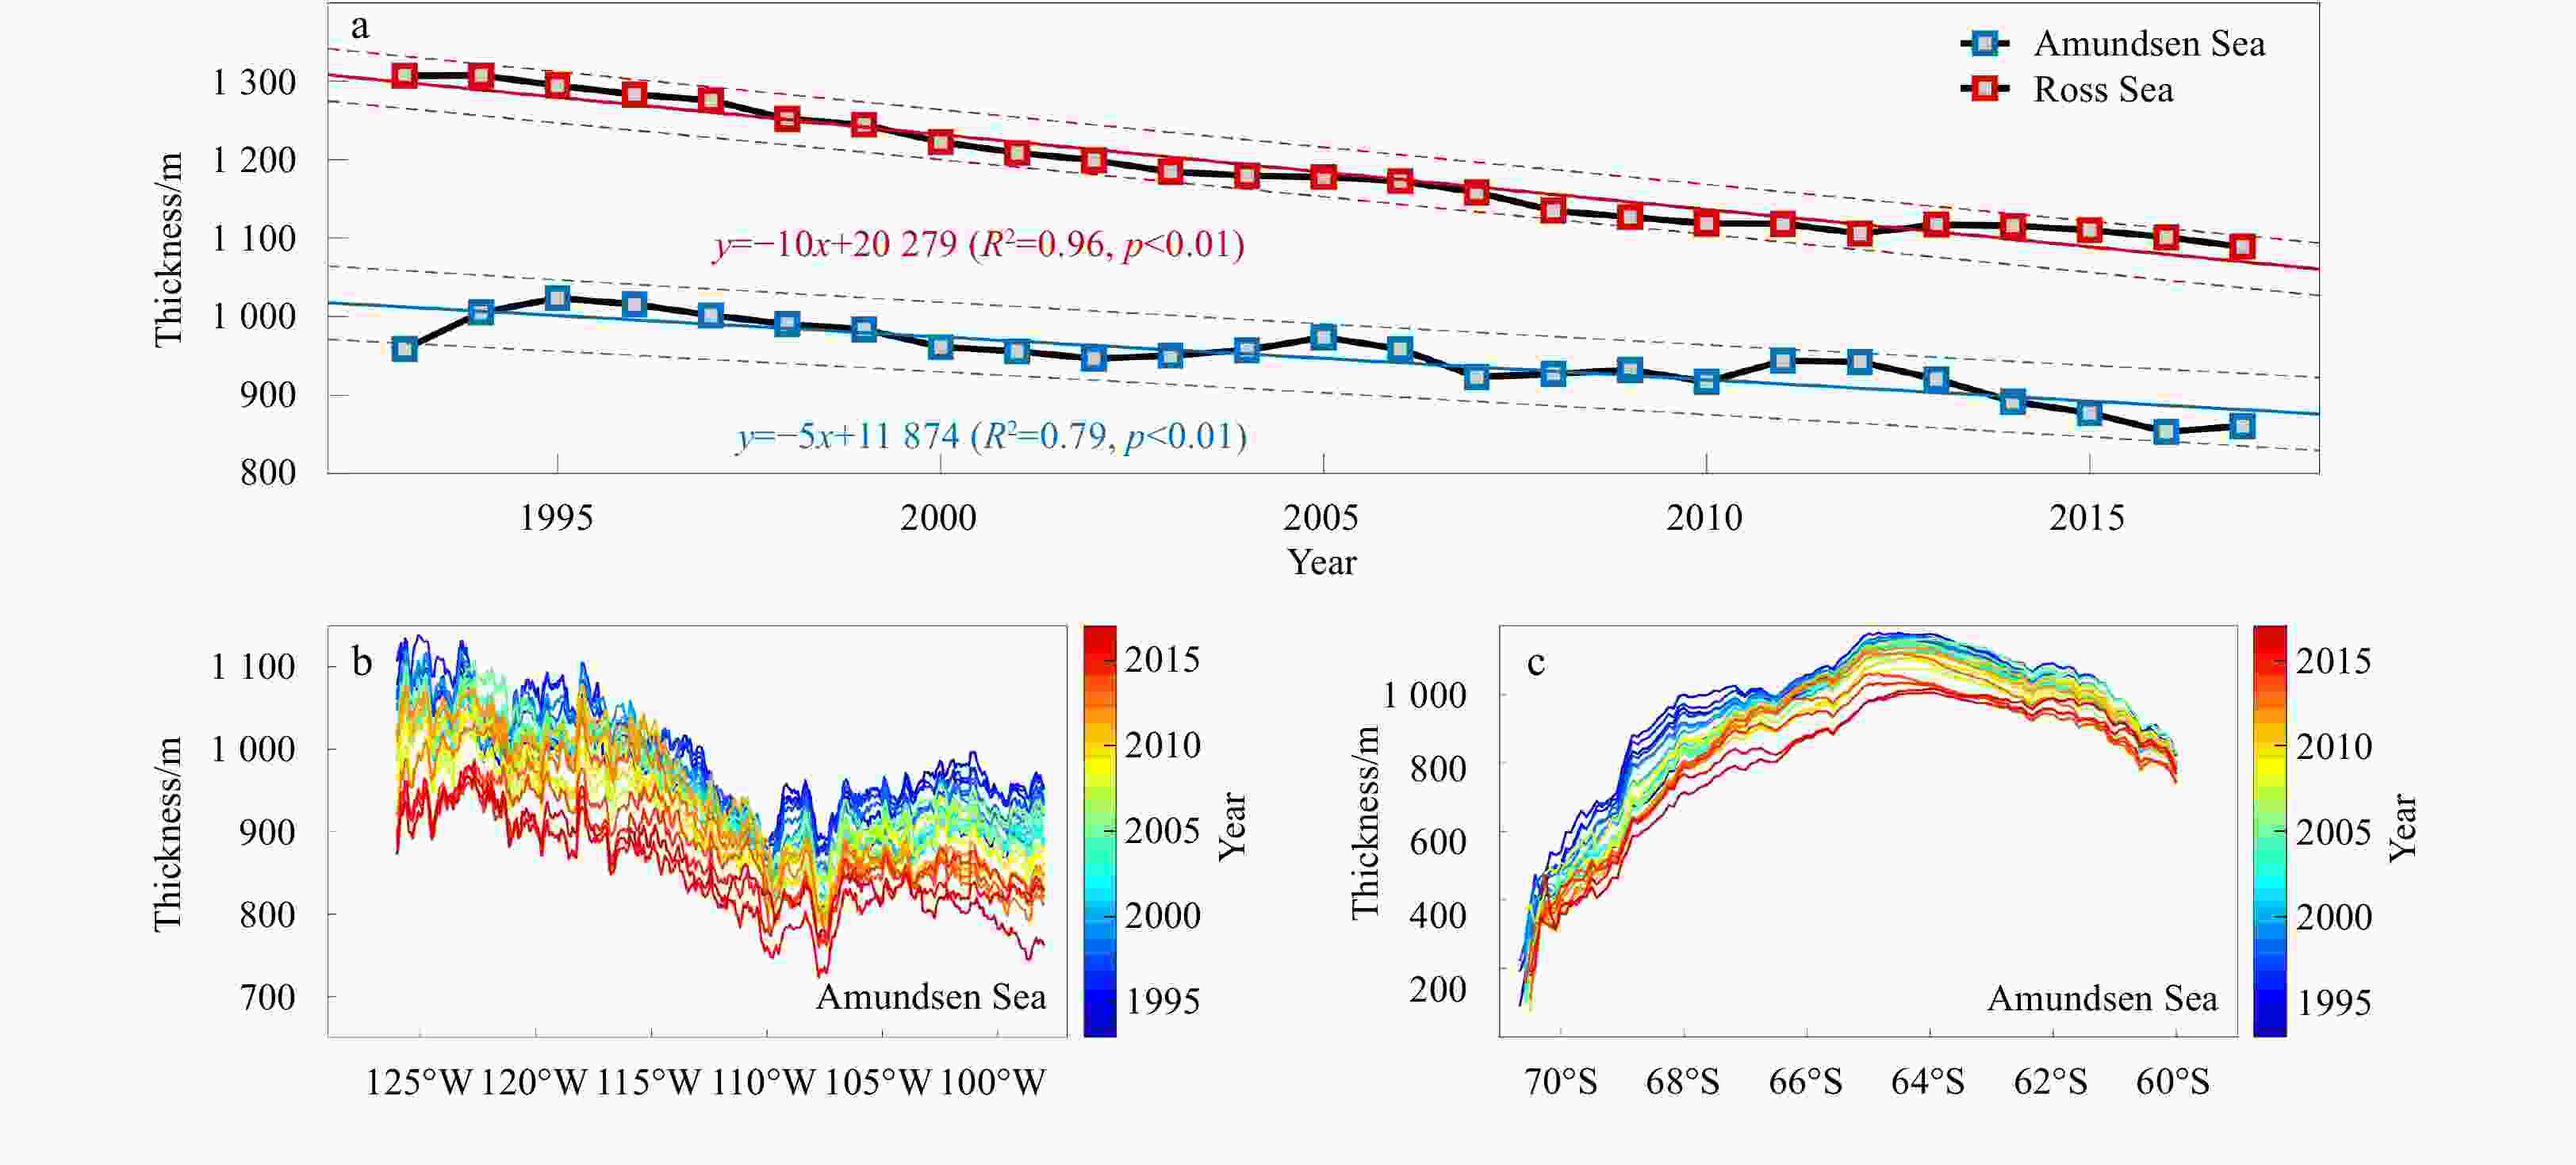
Figure 5. The annual variation of the thickness in the Antarctic Bottom Water (AABW). In a, blue squares indicate the thickness in the Amundsen Sea and red squares indicate the thickness in the Ross Sea. R2 and p in a denote the coefficient of determination and the statistical p value (same as in Figs 6, 8a, 8d, 10a and 11). b. The latitudinal annual variation in the thickness of the AABW in the Amundsen Sea was derived by meridional mean. c. The longitudinal annual variation in the thickness of the AABW in the Amundsen Sea was derived by zonal mean. The different colors in b and c represent different years.
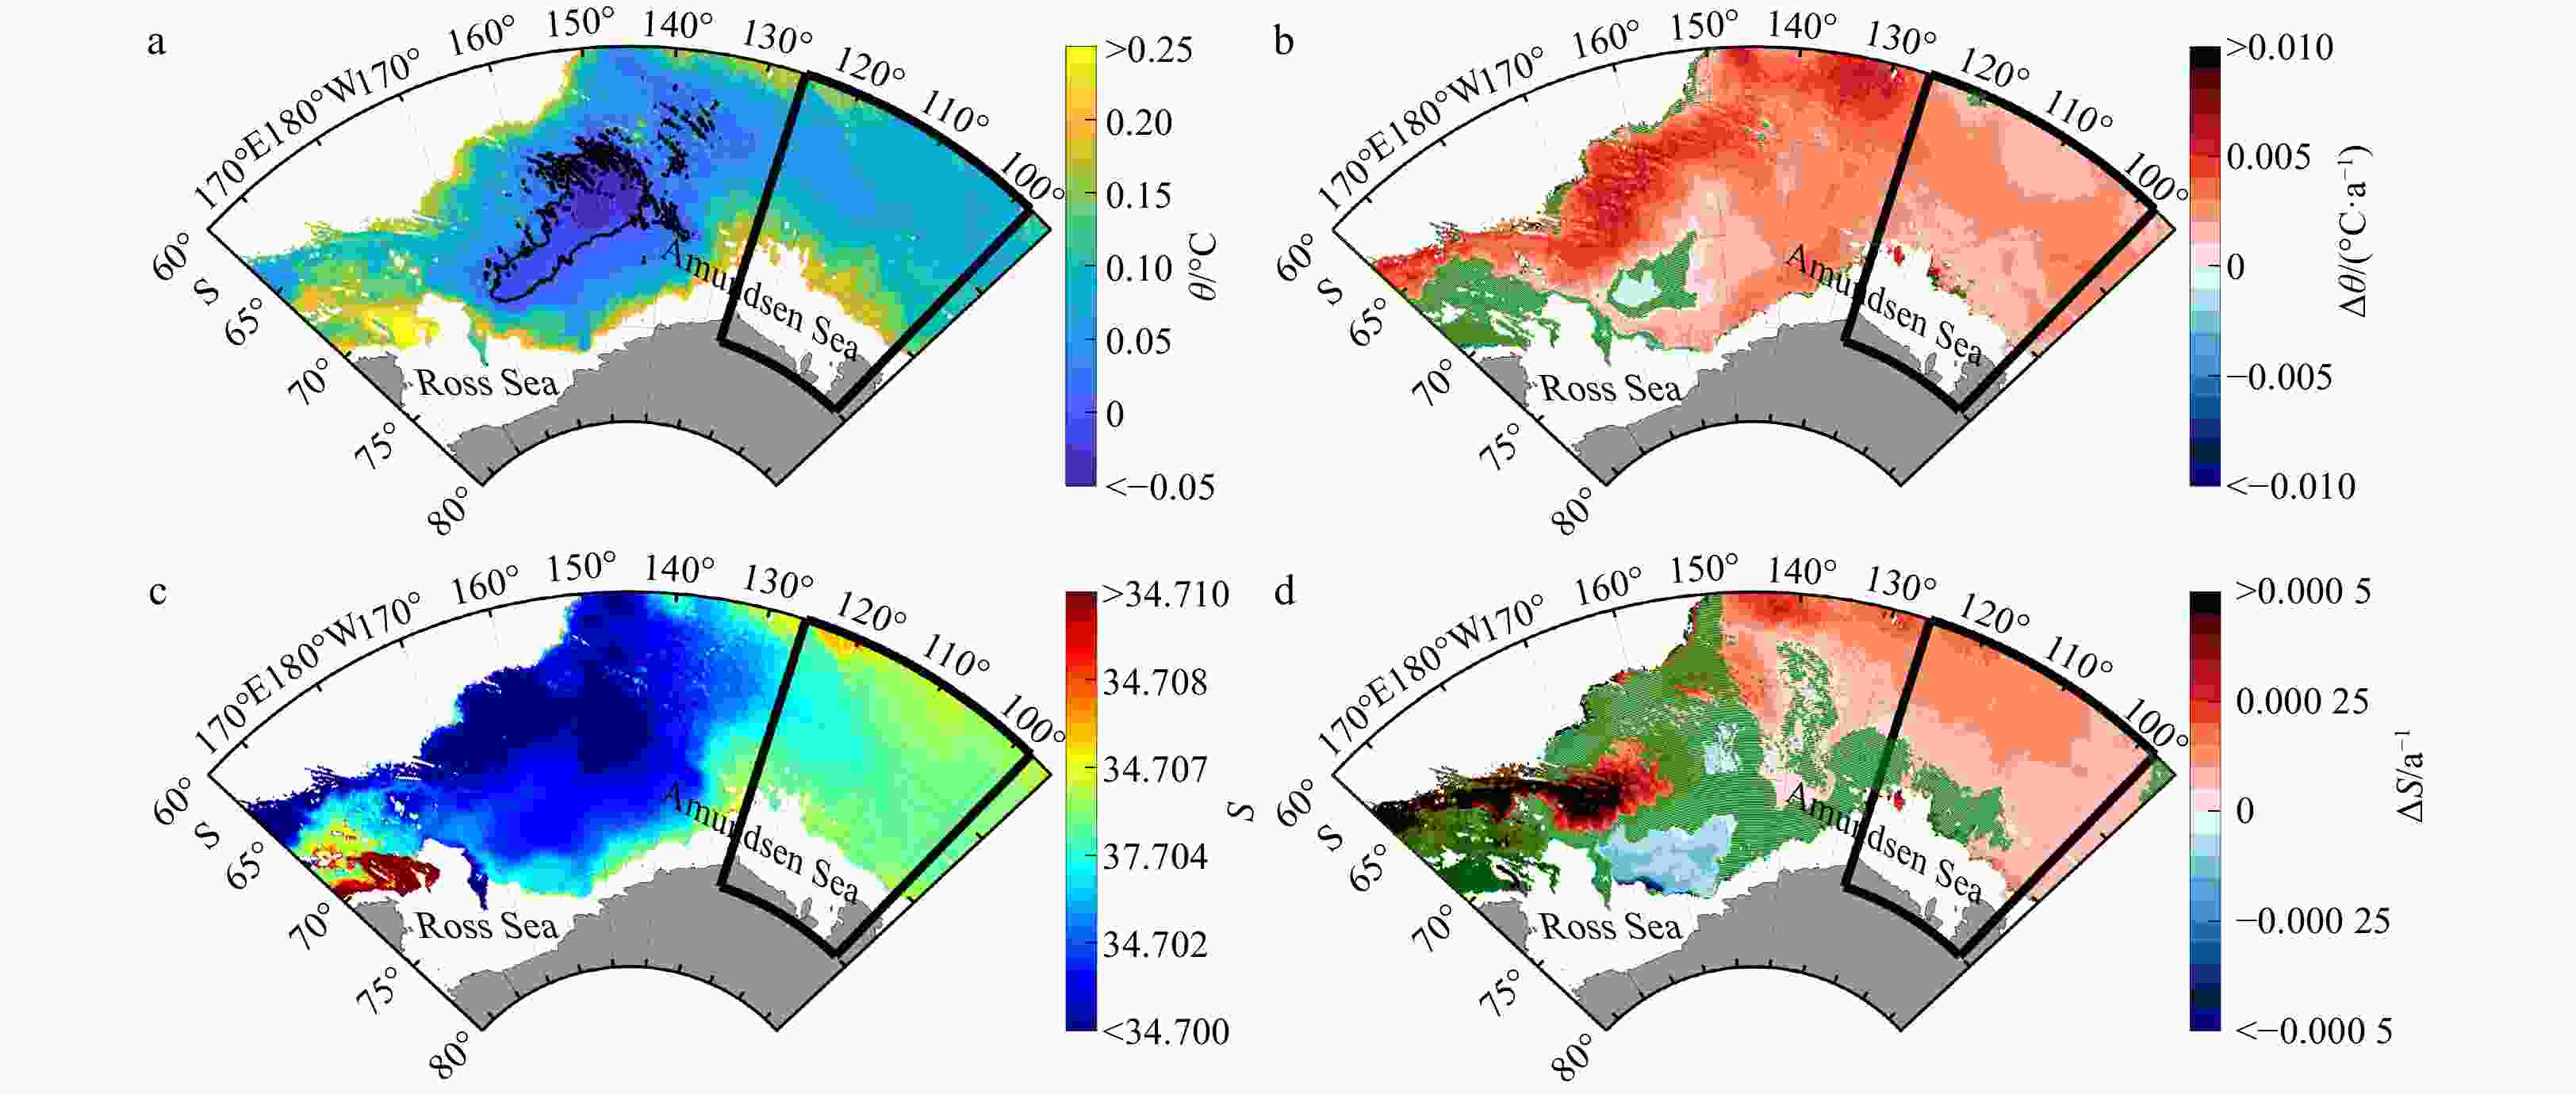
Figure 8. The annual variations of the temperature and salinity in the Antarctic Bottom Water (AABW). In a, blue squares represent the temperature in the Amundsen Sea and red squares represent the temperature in the Ross Sea. b. The latitudinal annual variation in the temperature of the AABW in the Amundsen Sea was derived by meridional mean. c. The longitudinal annual variation in the temperature of the AABW in the Amundsen Sea was derived by zonal mean. The different colors in b and c represent different years. d–f are same as a–c but for salinity.
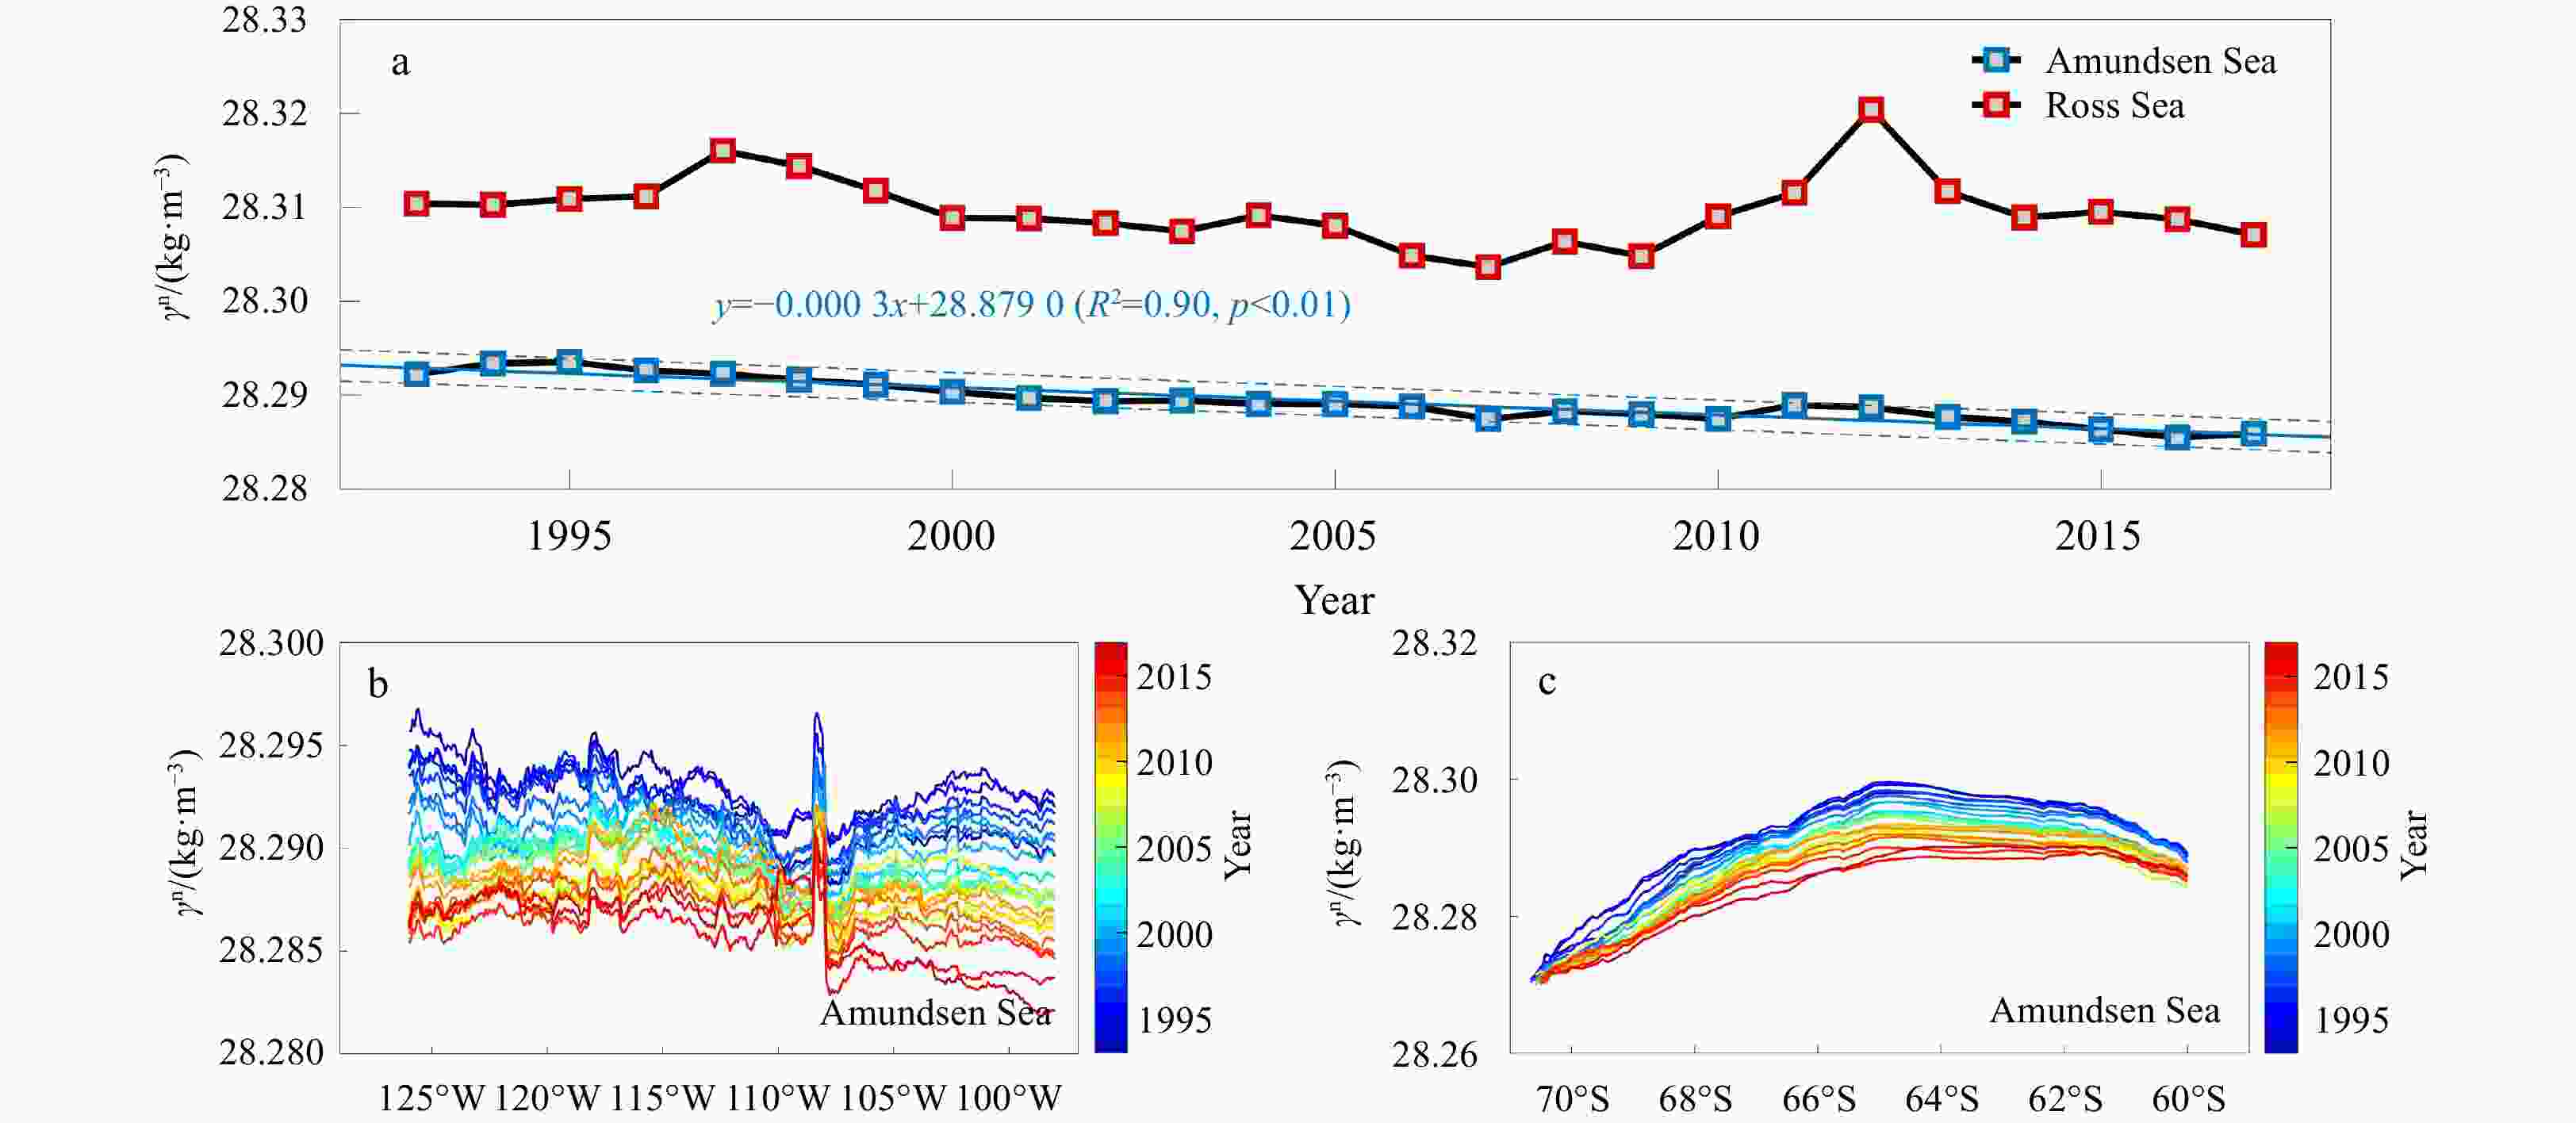
Figure 10. The annual variation of the neutral density in the Antarctic Bottom Water (AABW). In a, the blue squares represent the neutral density in the Amundsen Sea and the red squares represent the neutral density in the Ross Sea. b. The latitudinal annual variation in the neutral density of the AABW in the Amundsen Sea was derived by meridional mean. c. The longitudinal annual variation in the neutral density of the AABW in the Amundsen Sea was derived by zonal mean. The different colors in b and c represent different years.
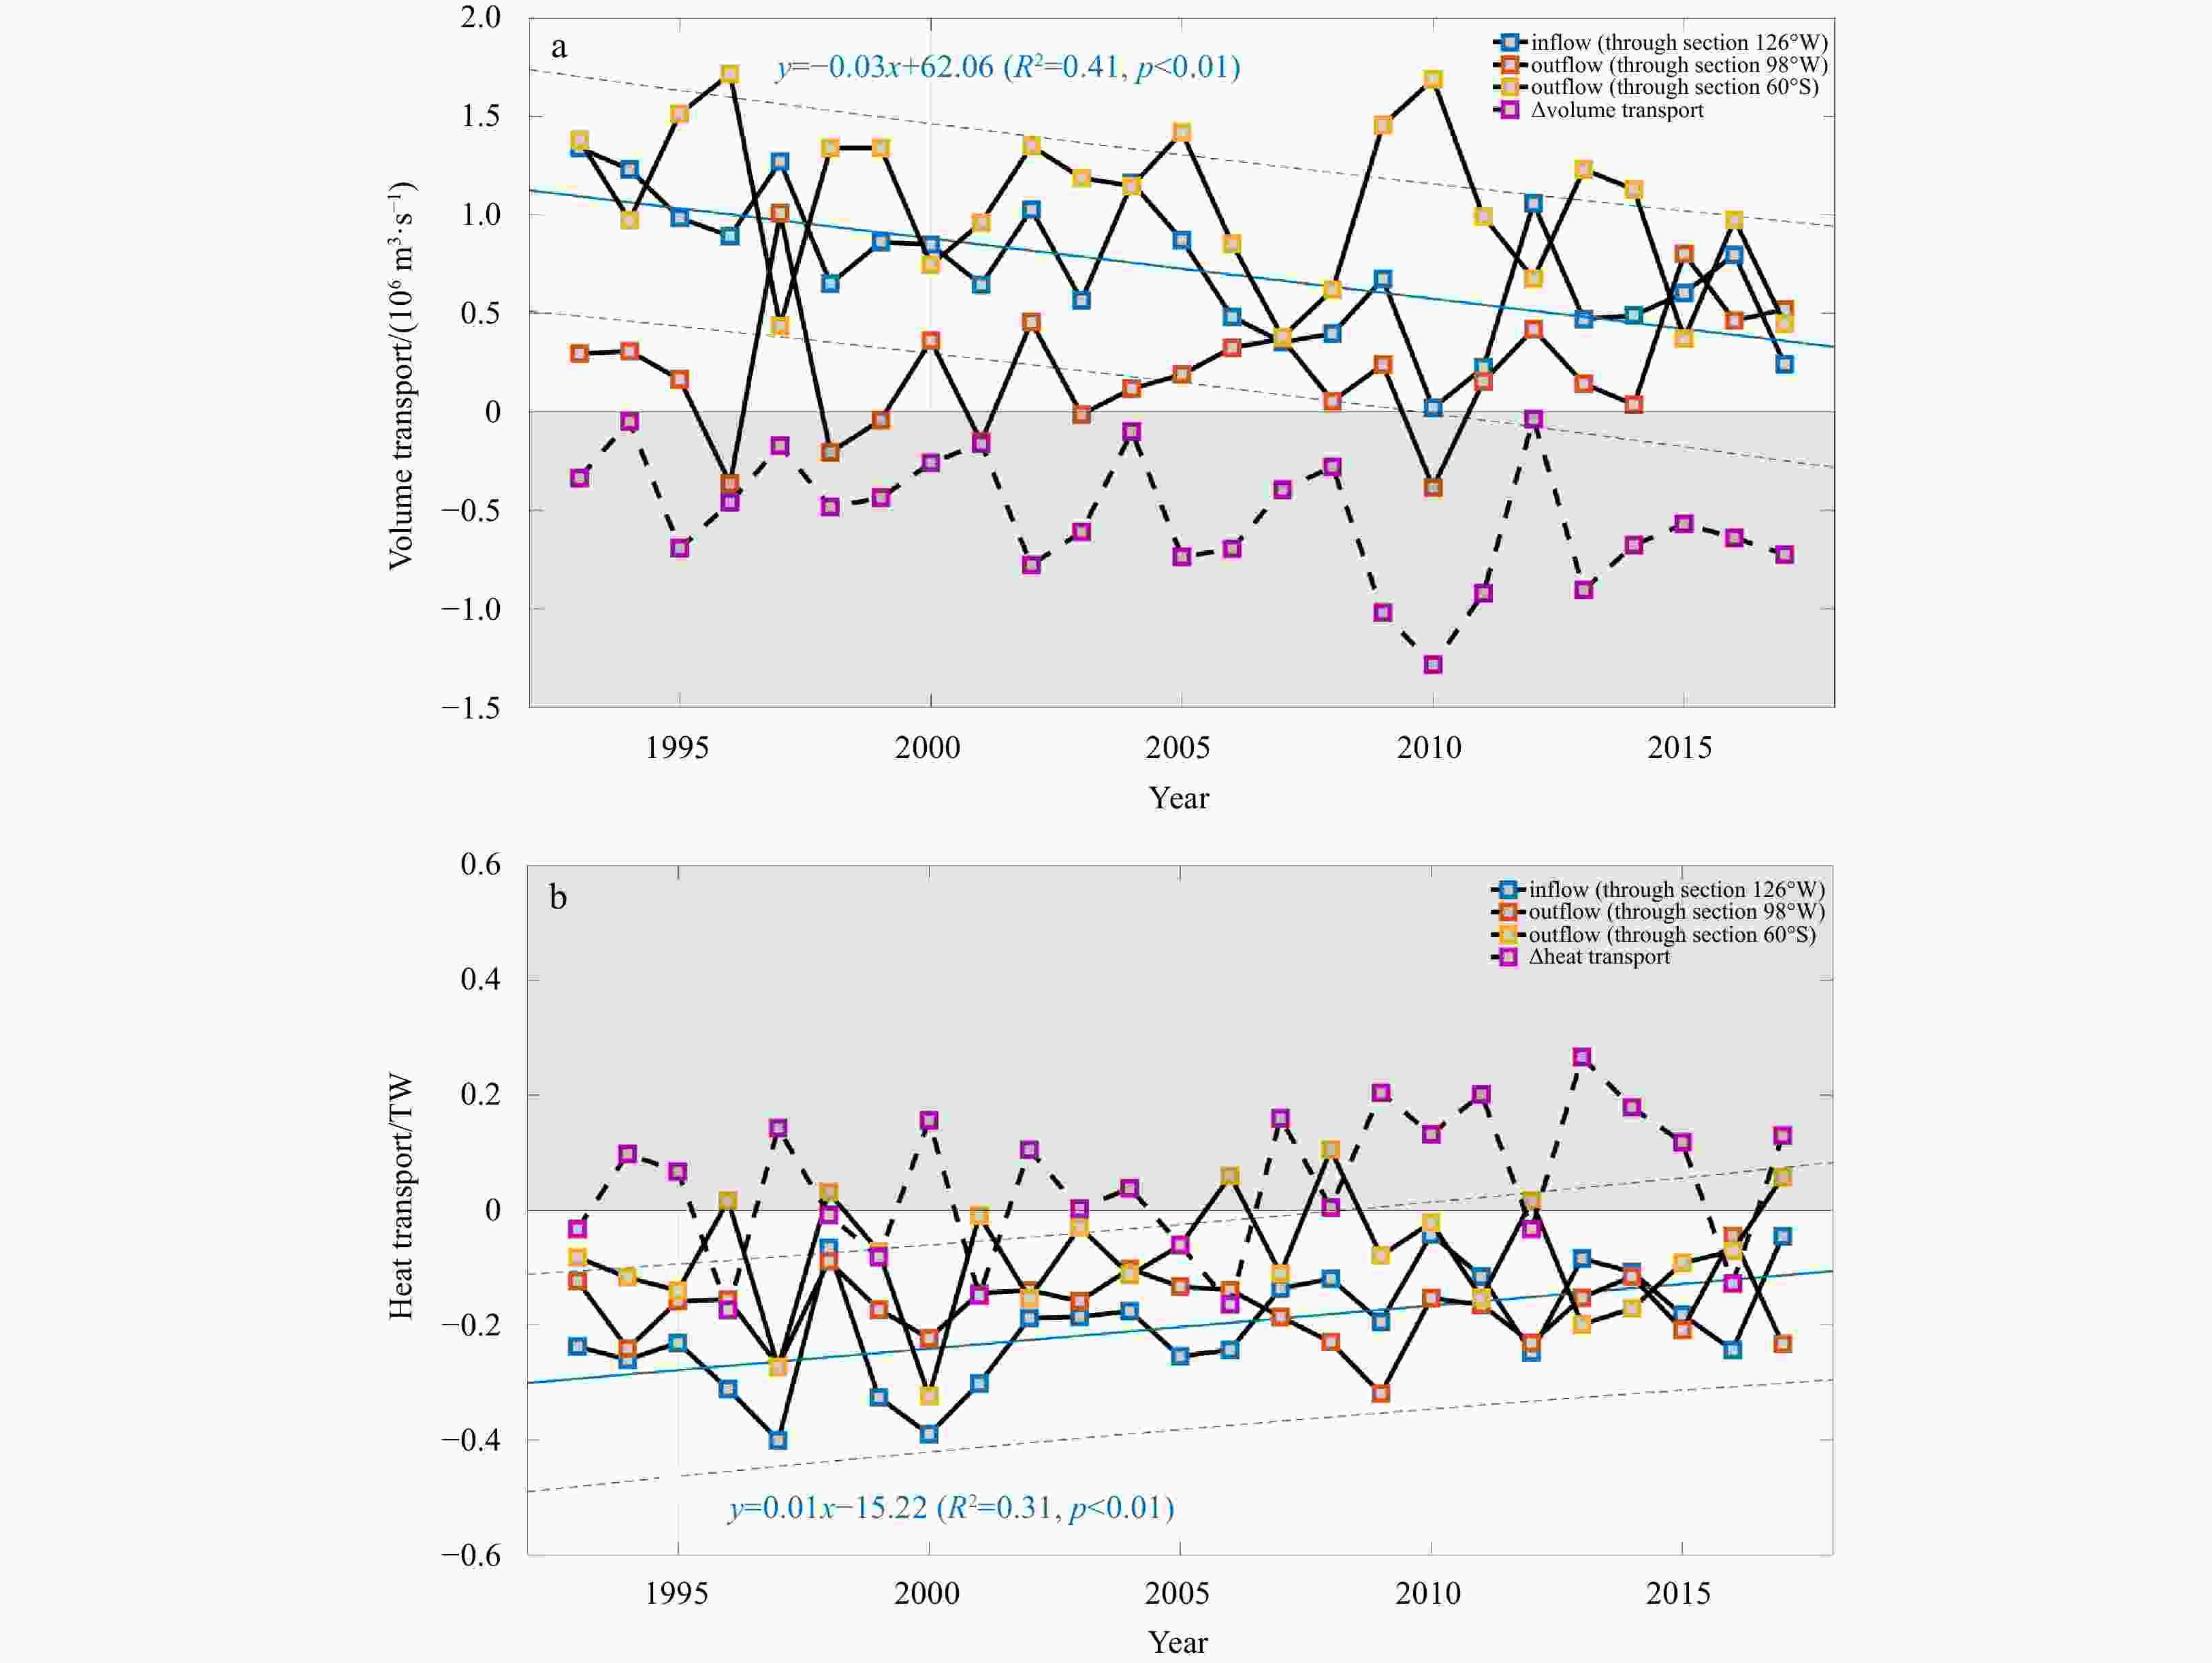
Figure 11. Volume transport (a) and heat transport (b) in the three boundary sections of the Amundsen Sea. Blue squares indicate the inflow into the Amundsen Sea through 126°W, red squares indicate the outflow from the Amundsen Sea through 98°W, yellow squares indicate the outflow from the Amundsen Sea through 60°S, and purple squares indicate the sum of the transport (total transport) in the three sections. The shaded area in a indicates a volume transport less than 0 m3/s and the shaded area in b indicates a heat transport more than 0 TW.
-
[1] Azaneu M, Kerr R, Mata M M, et al. 2013. Trends in the deep Southern Ocean (1958–2010): Implications for Antarctic Bottom Water properties and volume export. Journal of Geophysical Research: Oceans, 118(9): 4213–4227. doi: 10.1002/jgrc.20303 [2] Carter L, McCave I N, Williams M J M. 2008. Circulation and water masses of the Southern Ocean: a review. Developments in Earth and Environmental Sciences, 8: 85–114. doi: 10.1016/S1571-9197(08)00004-9 [3] Foster T D, Carmack E C. 1976. Frontal zone mixing and Antarctic Bottom Water formation in the southern Weddell Sea. Deep Sea Research and Oceanographic Abstracts, 23(4): 301–317. doi: 10.1016/0011-7471(76)90872-X [4] Ganachaud A, Wunsch C. 2000. Improved estimates of global ocean circulation, heat transport and mixing from hydrographic data. Nature, 408(6811): 453–457. doi: 10.1038/35044048 [5] Jackson L C, Dubois C, Forget G, et al. 2019. The mean state and variability of the North Atlantic circulation: a perspective from ocean reanalyses. Journal of Geophysical Research: Oceans, 124(12): 9141–9170. doi: 10.1029/2019JC015210 [6] Jacobs S S. 2004. Bottom water production and its links with the thermohaline circulation. Antarctic Science, 16(4): 427–437. doi: 10.1017/S095410200400224X [7] Jacobs S S, Fairbanks R G, Horibe Y. 1985. Origin and evolution of water masses near the Antarctic continental margin: Evidence from H218O/H216O ratios in seawater. In: Jacobs S S, ed. Oceanology of the Antarctic Continental Shelf. Washington, DC: American Geophysical Union, 59–85, [8] Jacobs S S, Giulivi C F. 2010. Large multidecadal salinity trends near the Pacific–Antarctic continental margin. Journal of Climate, 23(17): 4508–4524. doi: 10.1175/2010JCLI3284.1 [9] Jacobs S S, Giulivi C F, Mele P A. 2002. Freshening of the Ross Sea during the late 20th century. Science, 297(5580): 386–389. doi: 10.1126/science.1069574 [10] Johnson G C. 2008. Quantifying Antarctic bottom water and North Atlantic deep water volumes. Journal of Geophysical Research: Oceans, 113(C5): C05027. doi: 10.1029/2007JC004477 [11] Johnson G C, Doney S C. 2006. Recent western South Atlantic bottom water warming. Geophysical Research Letters, 33(14): L14614. doi: 10.1029/2006GL026769 [12] Johnson G C, McTaggart K E, Wanninkhof R. 2014. Antarctic Bottom Water temperature changes in the western South Atlantic from 1989 to 2014. Journal of Geophysical Research: Oceans, 119(12): 8567–8577. doi: 10.1002/2014JC010367 [13] Johnson G C, Purkey S G, Bullister J L. 2008a. Warming and freshening in the abyssal southeastern Indian Ocean. Journal of Climate, 21(20): 5351–5363. doi: 10.1175/2008JCLI2384.1 [14] Johnson G C, Purkey S G, Toole J M. 2008b. Reduced Antarctic meridional overturning circulation reaches the North Atlantic Ocean. Geophysical Research Letters, 35(22): L22601. doi: 10.1029/2008GL035619 [15] Kawano T, Fukasawa M, Kouketsu S, et al. 2006. Bottom water warming along the pathway of lower circumpolar deep water in the Pacific Ocean. Geophysical Research Letters, 33(23): L23613. doi: 10.1029/2006GL027933 [16] Koshlyakov M N, Tarakanov R Y. 2003. Antarctic bottom water in the Pacific sector of the Southern Ocean. Oceanology, 43(1): 1–15 [17] Lumpkin R, Speer K. 2007. Global ocean meridional overturning. Journal of Physical Oceanography, 37(10): 2550–2562. doi: 10.1175/JPO3130.1 [18] Mantyla A W, Reid J L. 1983. Abyssal characteristics of the World Ocean waters. Deep-Sea Research Part A. Oceanographic Research Papers, 30(8): 805–833. doi: 10.1016/0198-0149(83)90002-X [19] Masuda S, Awaji T, Sugiura N, et al. 2010. Simulated rapid warming of abyssal North Pacific waters. Science, 329(5989): 319–322. doi: 10.1126/science.1188703 [20] Meredith M P. 2013. Oceanography: replenishing the abyss. Nature Geoscience, 6(3): 166–167. doi: 10.1038/ngeo1743 [21] Meredith M P, Ducklow H W, Schofield O, et al. 2016. The interdisciplinary marine system of the Amundsen Sea, Southern Ocean: recent advances and the need for sustained observations. Deep-Sea Research Part II: Topical Studies in Oceanography, 123: 1–6. doi: 10.1016/j.dsr2.2015.12.002 [22] Meredith M P, Gordon A L, Garabato A C N, et al. 2011. Synchronous intensification and warming of Antarctic Bottom Water outflow from the Weddell Gyre. Geophysical Research Letters, 38(3): L03603. doi: 10.1029/2010GL046265 [23] Nardelli B B. 2020. A multi-year time series of observation-based 3D horizontal and vertical quasi-geostrophic global ocean currents. Earth System Science Data, 12(3): 1711–1723. doi: 10.5194/essd-12-1711-2020 [24] Ohshima K I, Fukamachi Y, Williams G D, et al. 2013. Antarctic Bottom Water production by intense sea-ice formation in the Cape Darnley polynya. Nature Geoscience, 6(3): 235–240. doi: 10.1038/ngeo1738 [25] Orsi A H, Johnson G C, Bullister J L. 1999. Circulation, mixing, and production of Antarctic Bottom Water. Progress in Oceanography, 43(1): 55–109. doi: 10.1016/S0079-6611(99)00004-X [26] Orsi A H, Smethie Jr W M, Bullister J L. 2002. On the total input of Antarctic waters to the deep ocean: a preliminary estimate from chlorofluorocarbon measurements. Journal of Geophysical Research: Oceans, 107(C8): 3122. doi: 10.1029/2001JC000976 [27] Orsi A H, Wiederwohl C L. 2009. A recount of Ross Sea waters. Deep-Sea Research Part II: Topical Studies in Oceanography, 56(13−14): 778–795. doi: 10.1016/j.dsr2.2008.10.033 [28] Ozaki H, Obata H, Naganobu M, et al. 2009. Long-term bottom water warming in the north Ross Sea. Journal of Oceanography, 65(2): 235–244. doi: 10.1007/s10872-009-0022-z [29] Patara L, Böning C W. 2014. Abyssal ocean warming around Antarctica strengthens the Atlantic overturning circulation. Geophysical Research Letters, 41(11): 3972–3978. doi: 10.1002/2014GL059923 [30] Purkey S G, Johnson G C. 2010. Warming of global abyssal and deep Southern Ocean waters between the 1990s and 2000s: contributions to global heat and sea level rise budgets. Journal of Climate, 23(23): 6336–6351. doi: 10.1175/2010JCLI3682.1 [31] Purkey S G, Johnson G C. 2012. Global contraction of Antarctic bottom water between the 1980s and 2000s. Journal of Climate, 25(17): 5830–5844. doi: 10.1175/JCLI-D-11-00612.1 [32] Purkey S G, Johnson G C, Talley L D, et al. 2019. Unabated bottom water warming and freshening in the South Pacific Ocean. Journal of Geophysical Research: Oceans, 124(3): 1778–1794. doi: 10.1029/2018JC014775 [33] Purkey S G, Smethie Jr W M, Gebbie G, et al. 2018. A synoptic view of the ventilation and circulation of Antarctic Bottom Water from chlorofluorocarbons and natural tracers. Annual Review of Marine Science, 10(1): 503–527. doi: 10.1146/annurev-marine-121916-063414 [34] Reid J L. 1997. On the total geostrophic circulation of the Pacific Ocean: flow patterns, tracers, and transports. Progress in Oceanography, 39(4): 263–352. doi: 10.1016/S0079-6611(97)00012-8 [35] Rintoul S R. 2018. The global influence of localized dynamics in the Southern Ocean. Nature, 558(7709): 209–218. doi: 10.1038/s41586-018-0182-3 [36] Schmittner A, Chiang J C H, Hemming S R. 2007. Introduction: the ocean's meridional overturning circulation. In: Schmittner A, Chiang J C H, Hemming S R, eds. Ocean Circulation: Mechanisms and Impacts—Past and Future Changes of Meridional Overturning. Washington, DC: American Geophysical Union, 1–4, [37] Shimada K, Aoki S, Ohshima K I, et al. 2012. Influence of Ross Sea Bottom Water changes on the warming and freshening of the Antarctic Bottom Water in the Australian-Antarctic Basin. Ocean Science, 8(4): 419–432. doi: 10.5194/os-8-419-2012 [38] Uenzelmann-Neben G, Gohl K. 2012. Amundsen Sea sediment drifts: archives of modifications in oceanographic and climatic conditions. Marine Geology, 299–302: 51–62, [39] van Wijk E M, Rintoul S R. 2014. Freshening drives contraction of Antarctic Bottom Water in the Australian Antarctic Basin. Geophysical Research Letters, 41(5): 1657–1664. doi: 10.1002/2013GL058921 [40] Whitworth III T, Orsi A H, Kim S J, et al. 1985. Water masses and mixing near the Antarctic Slope Front. In: Jacobs S S, Weiss R F, eds. Ocean, Ice, and Atmosphere: Interactions at the Antarctic Continental Margin. Washington, DC: American Geophysical Union, 1–27. doi: 10.1029/AR075p0001 [41] Zanowski H, Hallberg R, Sarmiento J L. 2015. Abyssal ocean warming and salinification after Weddell polynyas in the GFDL CM2G coupled climate model. Journal of Physical Oceanography, 45(11): 2755–2772. doi: 10.1175/JPO-D-15-0109.1 -


 下载:
下载:
