

Interannual variability in the sea surface cooling induced by tropical cyclones in the South China Sea
-
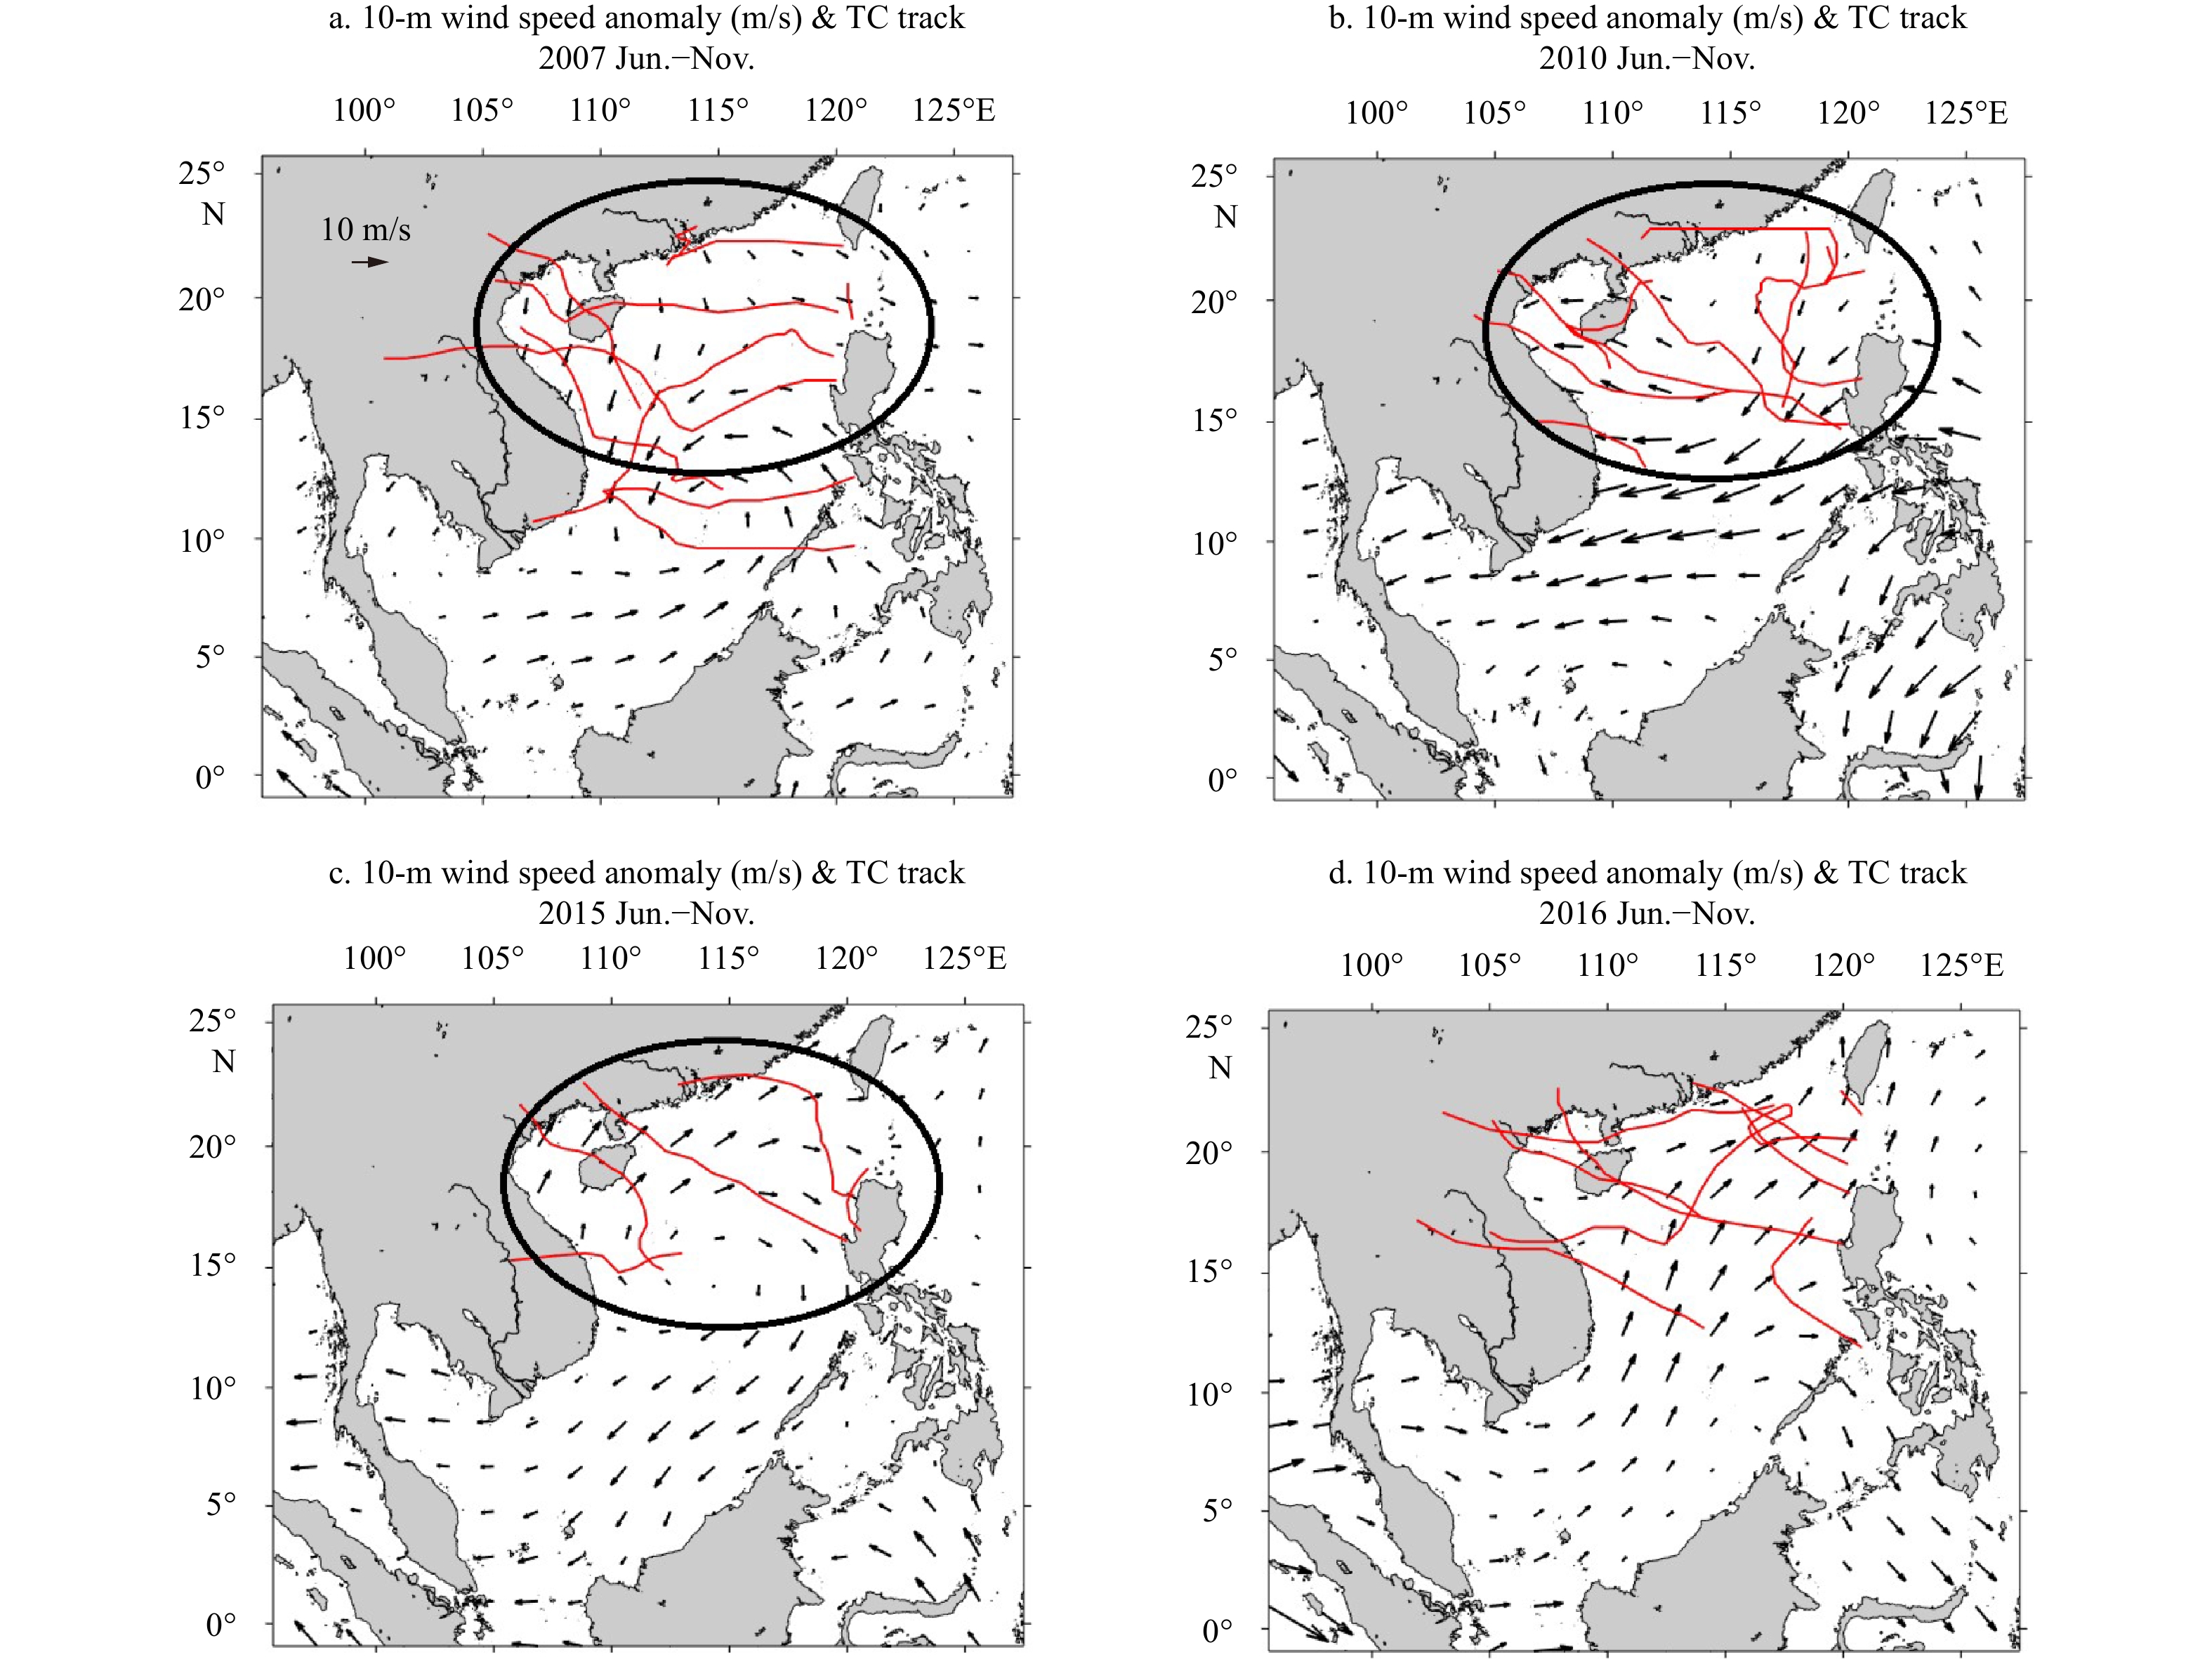
Abstract: Sea surface cooling induced by tropical cyclones (TCs) is an important component of air-sea interactions. Using coordinate transformation and composite analysis methods, we examined the interannual variability in TC-induced sea surface cooling (TCSSC) in the South China Sea (SCS). The frequency of surface cooling cases was over 86% and that of surface warming cases was less than 14%. The magnitude of TCSSC was defined as the absolute value of TCSSC. The maximum magnitude of TCSSC occurred on the right side of the TC track, and the mean magnitude of TCSSC decreased by 0.04°C/a from 2006 to 2018. The interannual variability in TCSSC was highly correlated with the TC translation speed and pre-TC mixed layer depth. Notably, TCSSC got enhanced in El Niño years of 2007, 2010, and 2015. The El Niño types were suggested to determine the occurring periods of strong TCSSC via controlling the positions of SCS anticyclones, which brought pre-TC shallow mixed layer and caused strong TCSSC via vertical mixing process during El Niño events. To quantify how the anticyclone influences TCSSC, we need to use mixed layer heat balances model in the next study.
-
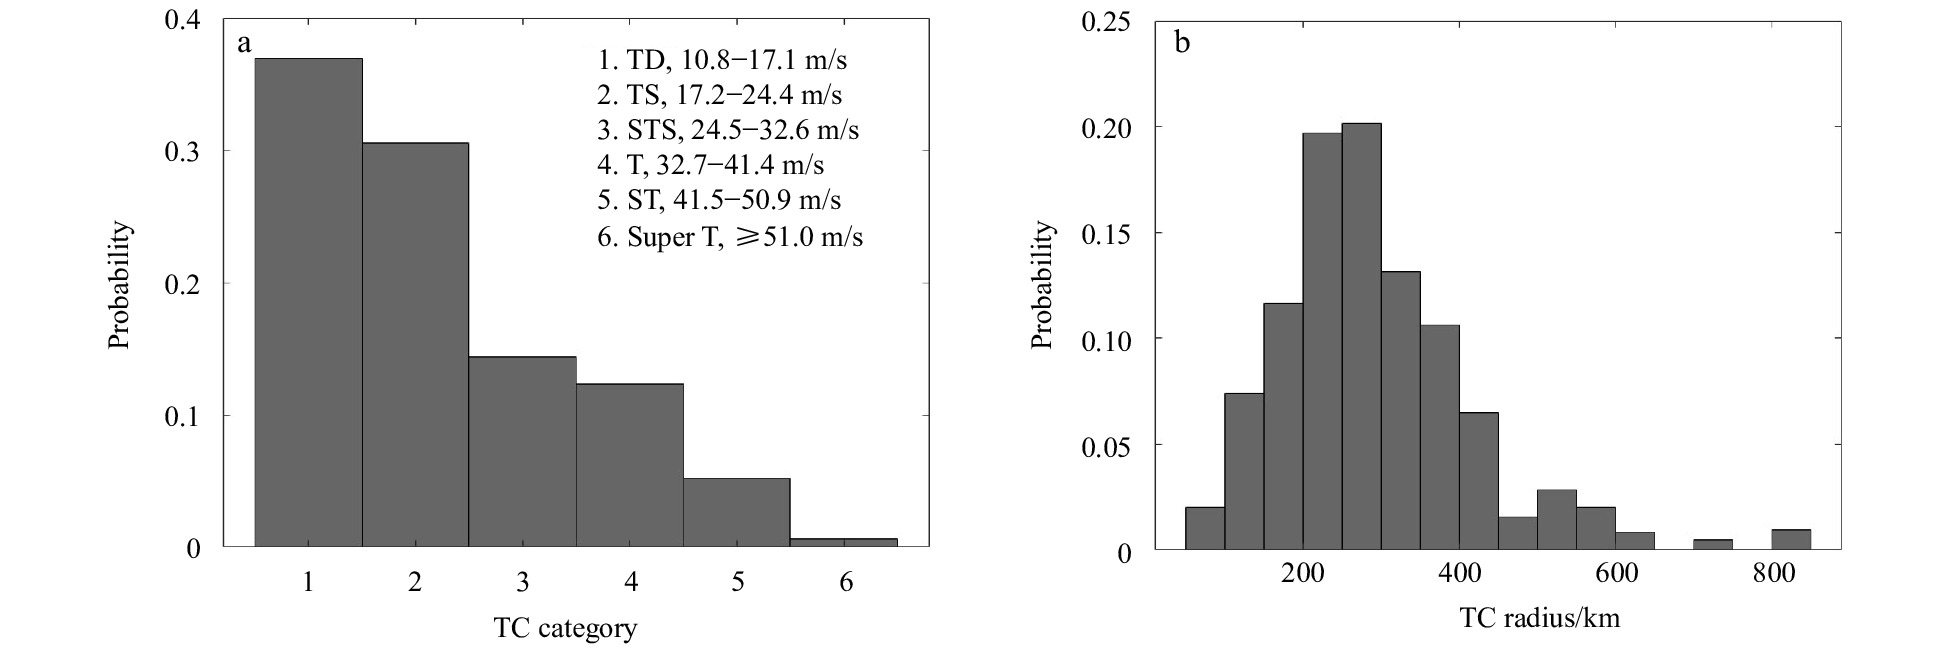
Figure 2. Probabilities of tropical cyclone (TC) category (a) and radius (b) in the SCS. 1–6 in a reprecent the tropical depression (TD), tropical storm (TS), super tropical storm (STS), typhoon (T), strong typhoon (ST), and super typhoon (Super T), respectively, classified by wind speed . The TC radius in b is defined as the longest radius of 30-kn (~15 m/s) wind speeds.
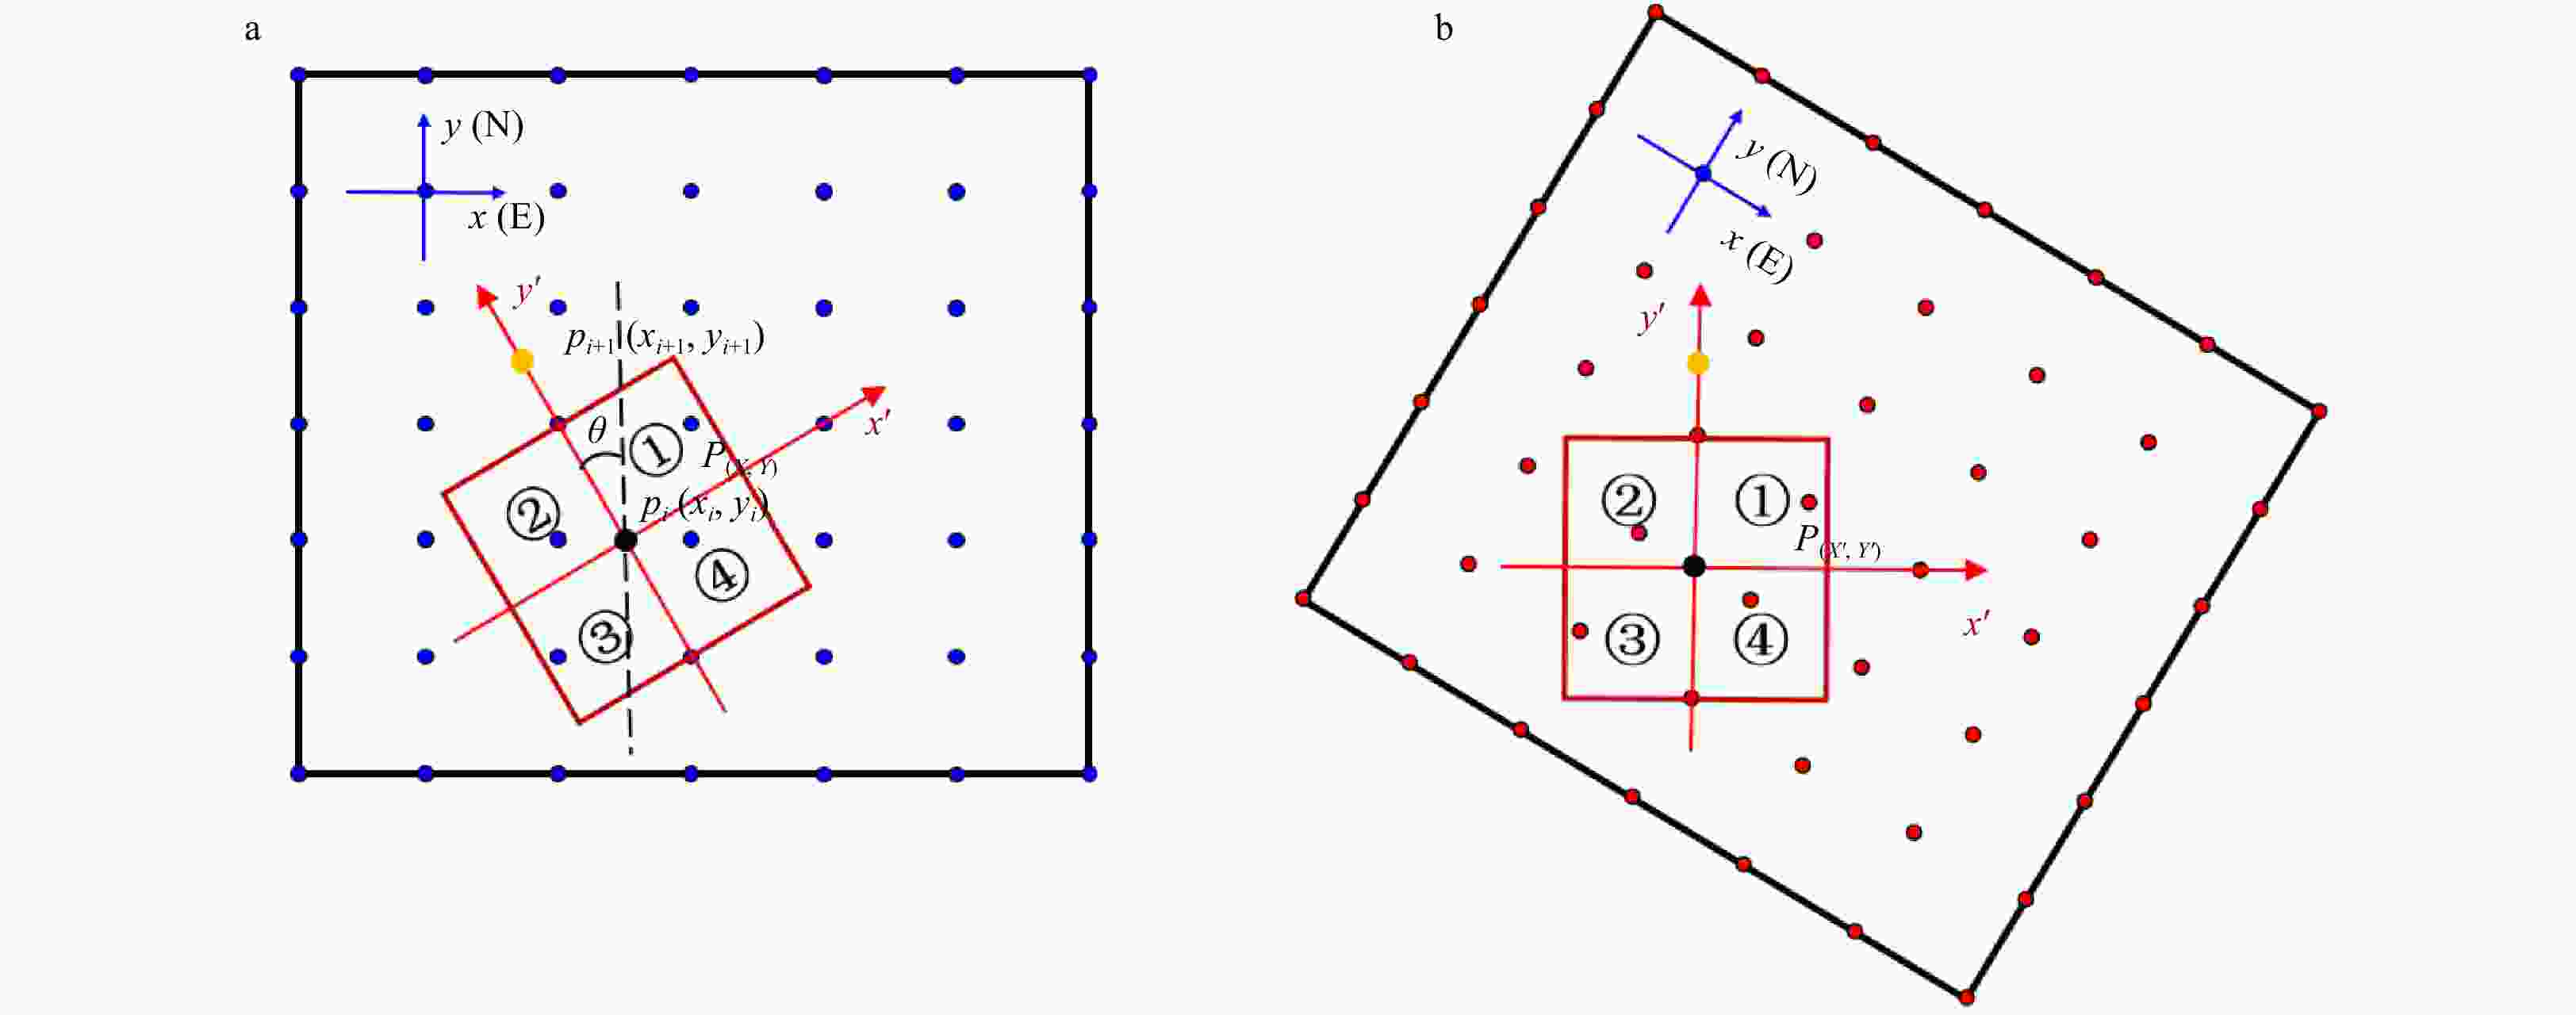
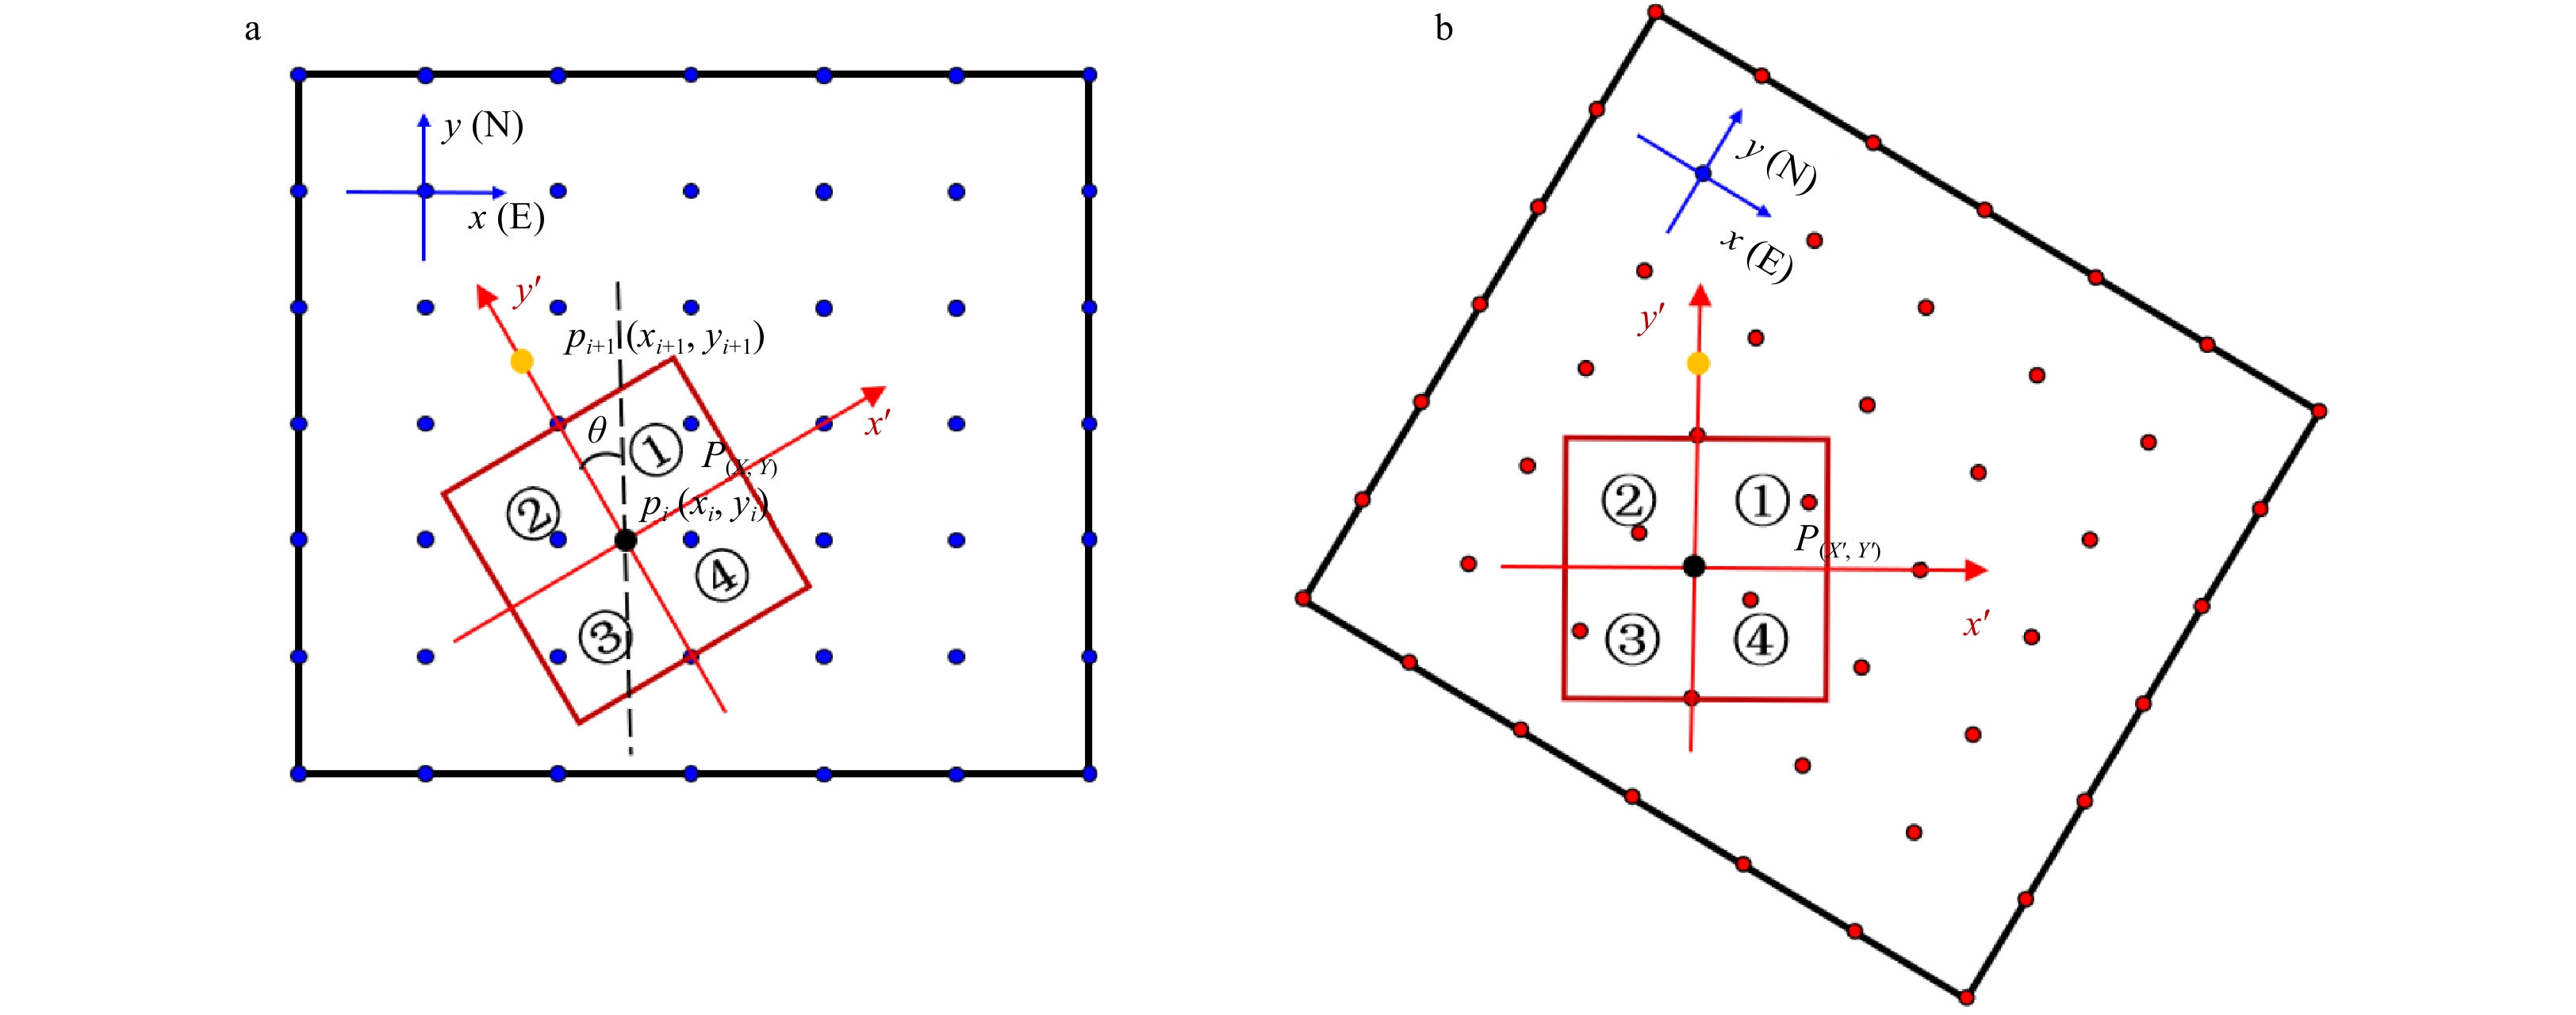
Figure 3. Schematic diagram of the rotating coordinate system of original (a) and transferred (b) coordinate systems. The red box is the SST response zone.
$ x $ and${y}$ direct eastward and northward, respectively,$ y{'} $ points to the direction of TC translated, and$ x{'} $ is perpendicular to$ y{'} $ . The black dot indicate point pi at time i, and the yellow dot indicate the next position pi+1 at time i+1.①,②,③ and ④ represent the first, second, third and forth quadrant, which take the direction of TC as the positive y'-axis.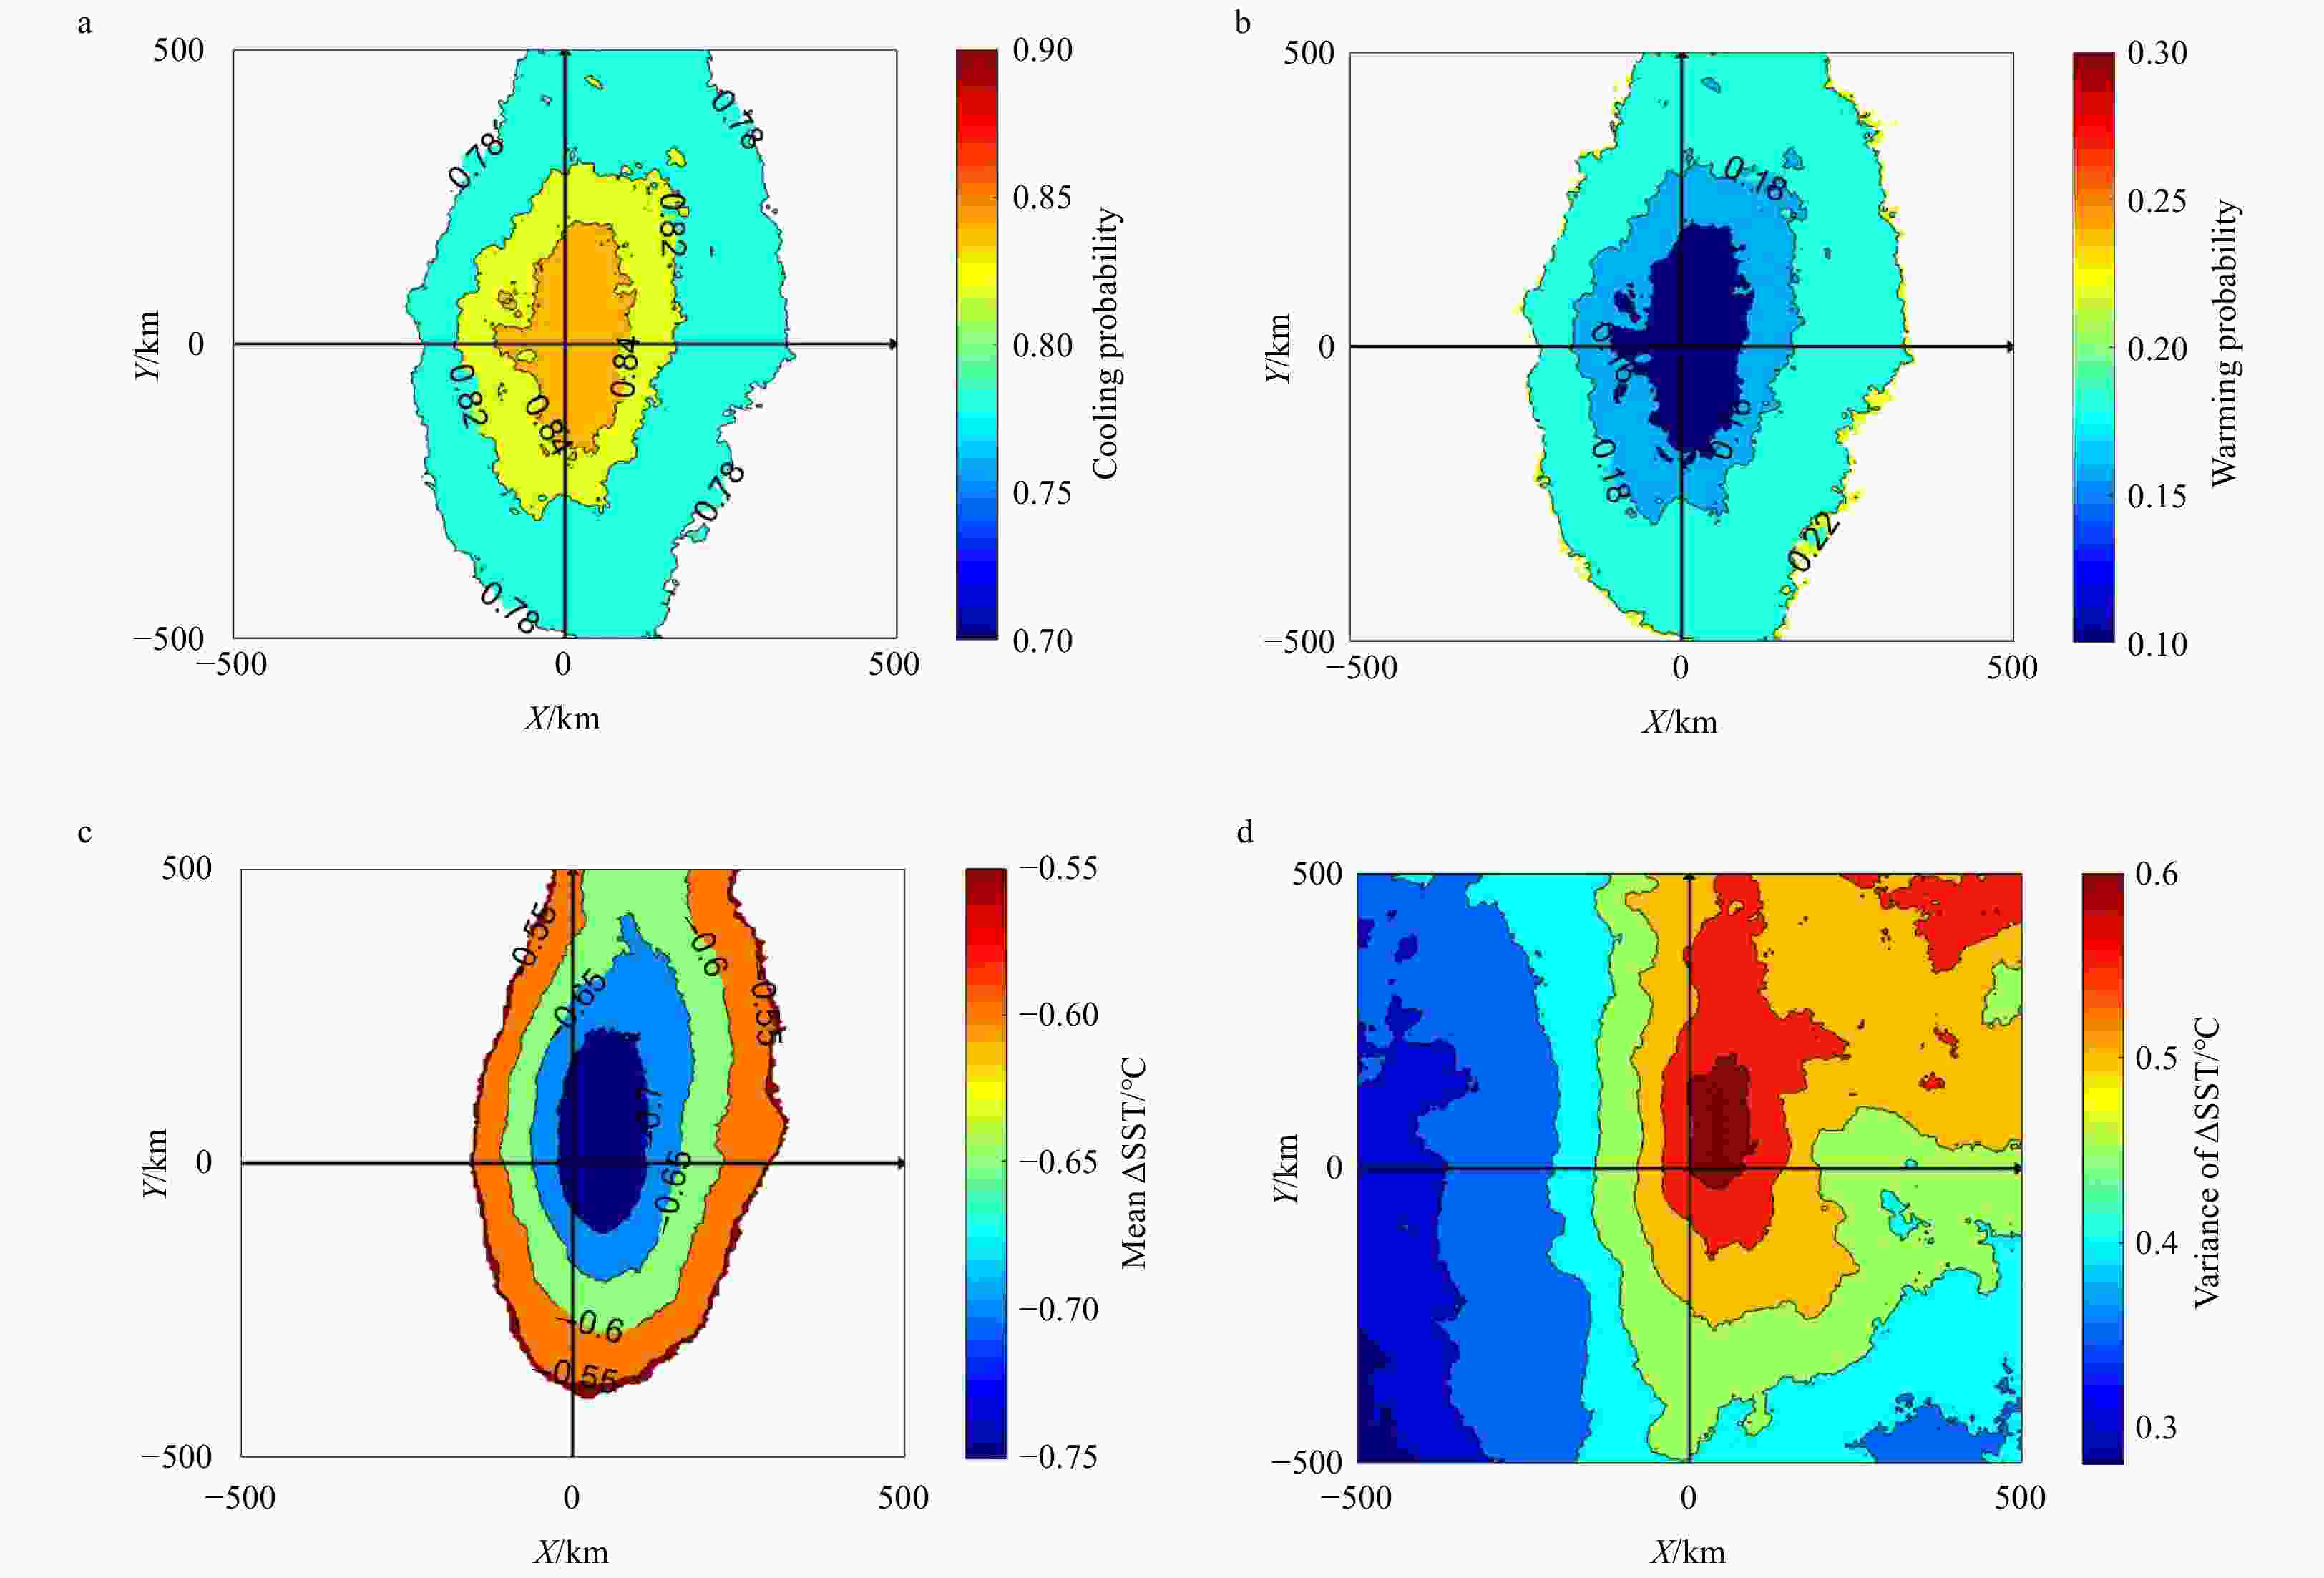
Figure 4. Probability of TC-induced surface cooling (a) and warming (b), and mean
$\Delta \mathrm{S}\mathrm{S}\mathrm{T}\mathrm{ }(\mathrm{c})$ and variance of$\Delta\mathrm{S}\mathrm{S}\mathrm{T}$ (d).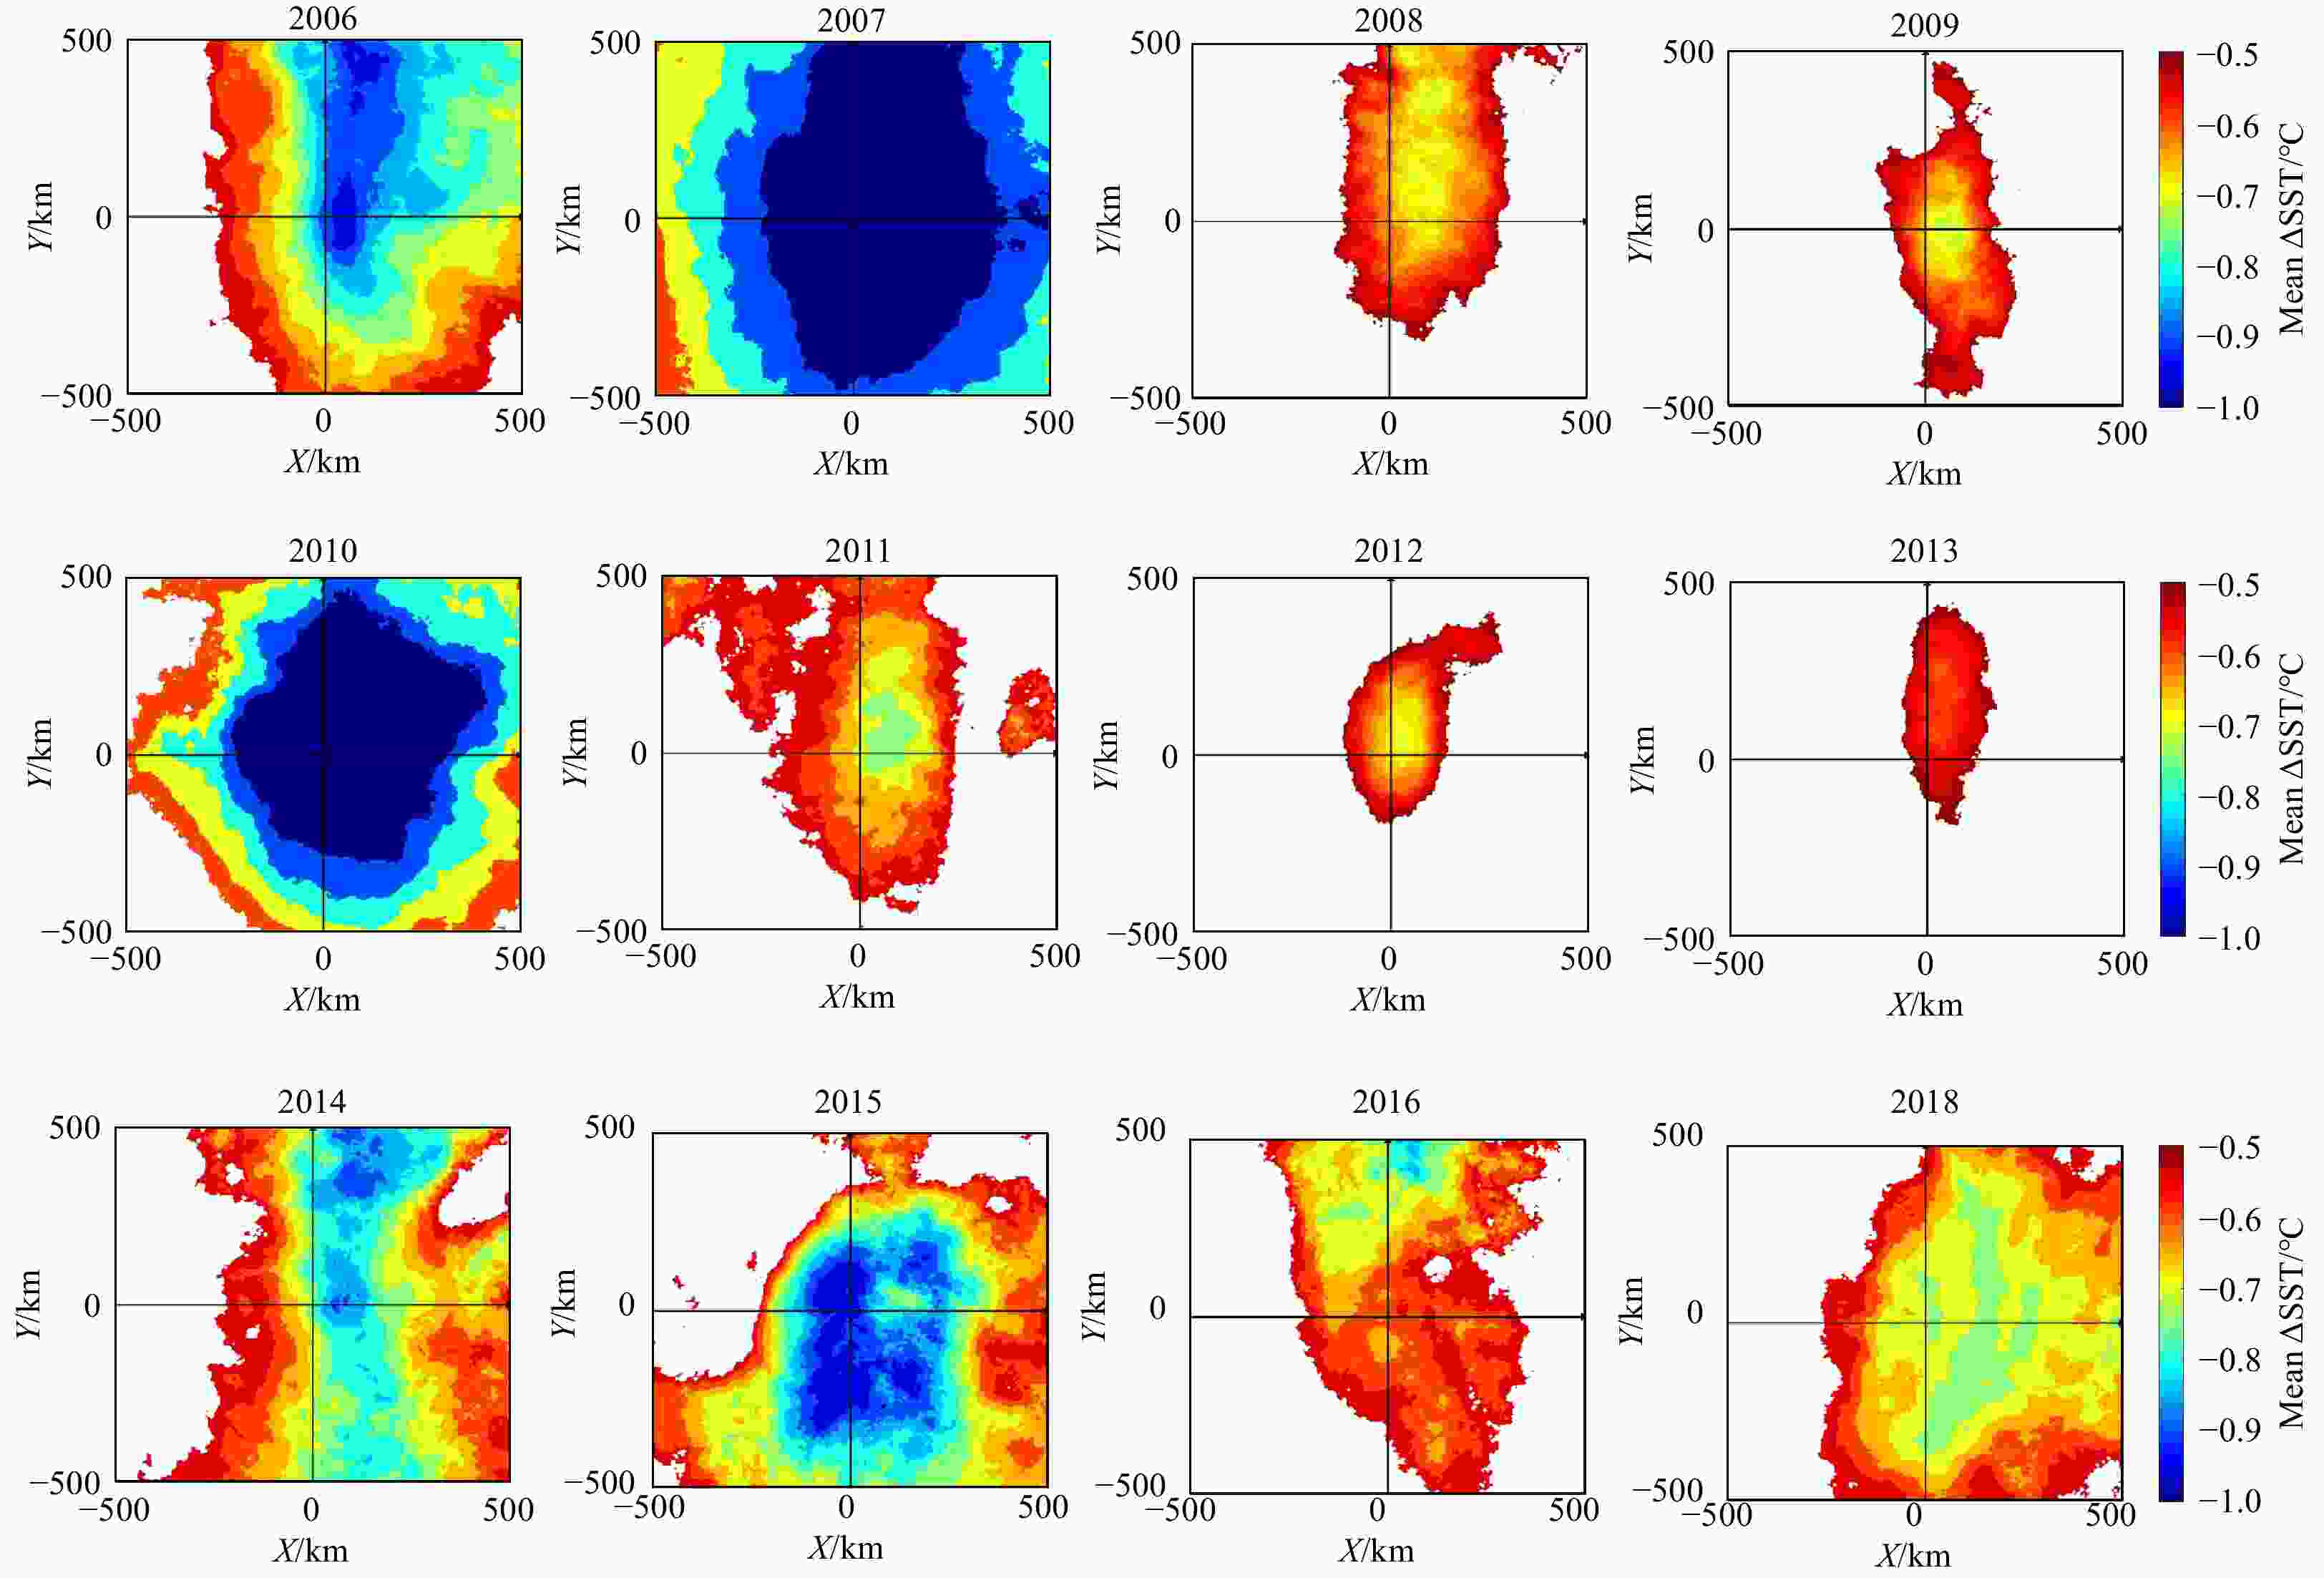
Figure 5. Spatial distributions of mean TC-included sea surface cooling
$ \Delta \text{SST} $ from 2006 to 2018.
Figure 6. Interannual variability of TC-included sea surface cooling
$ \left|{\Delta }\mathrm{S}\mathrm{S}\mathrm{T}\right| $ (black) and the Niño 3.4 index (red) (a); the number (black) and translation speed (red) of TCs (b); the mean central pressure (black) and radius (red) of TCs (c); and the pre-TC mixed layer depth (MLD) and pre-TC SST around the TC center (d). The dashed lines are linear regression lines.
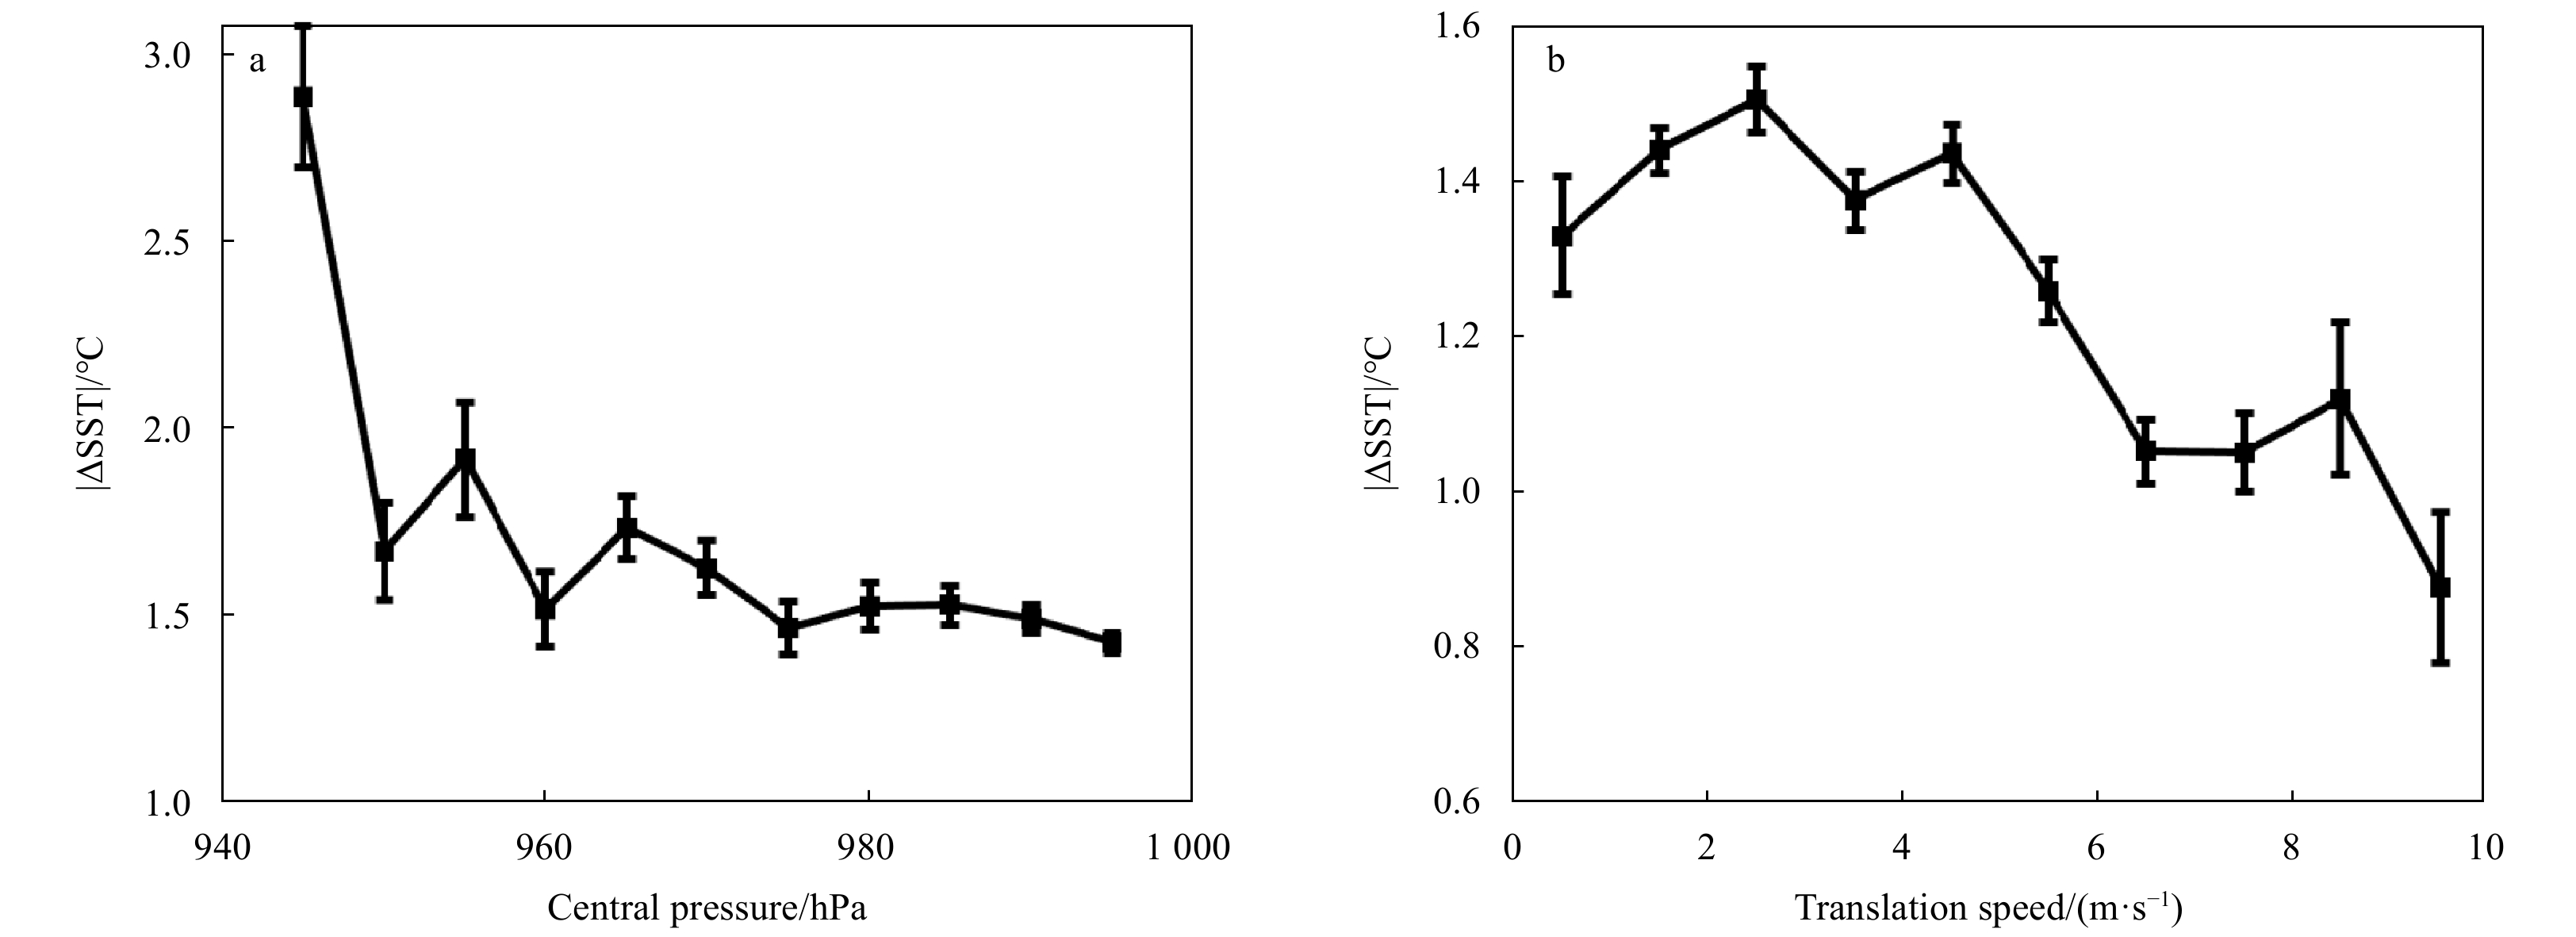
Figure 7. Relationships between the absolute value of TC-included sea surface cooling (
$ \Delta \text{SST} $ ) and TC central pressure (a), and TC translation speed (b). Error bars indicate the standard deviation of$ \;\left|{\Delta }\mathrm{S}\mathrm{S}\mathrm{T}\right| $ at every 5 hPa (a) and every 1 m/s (b).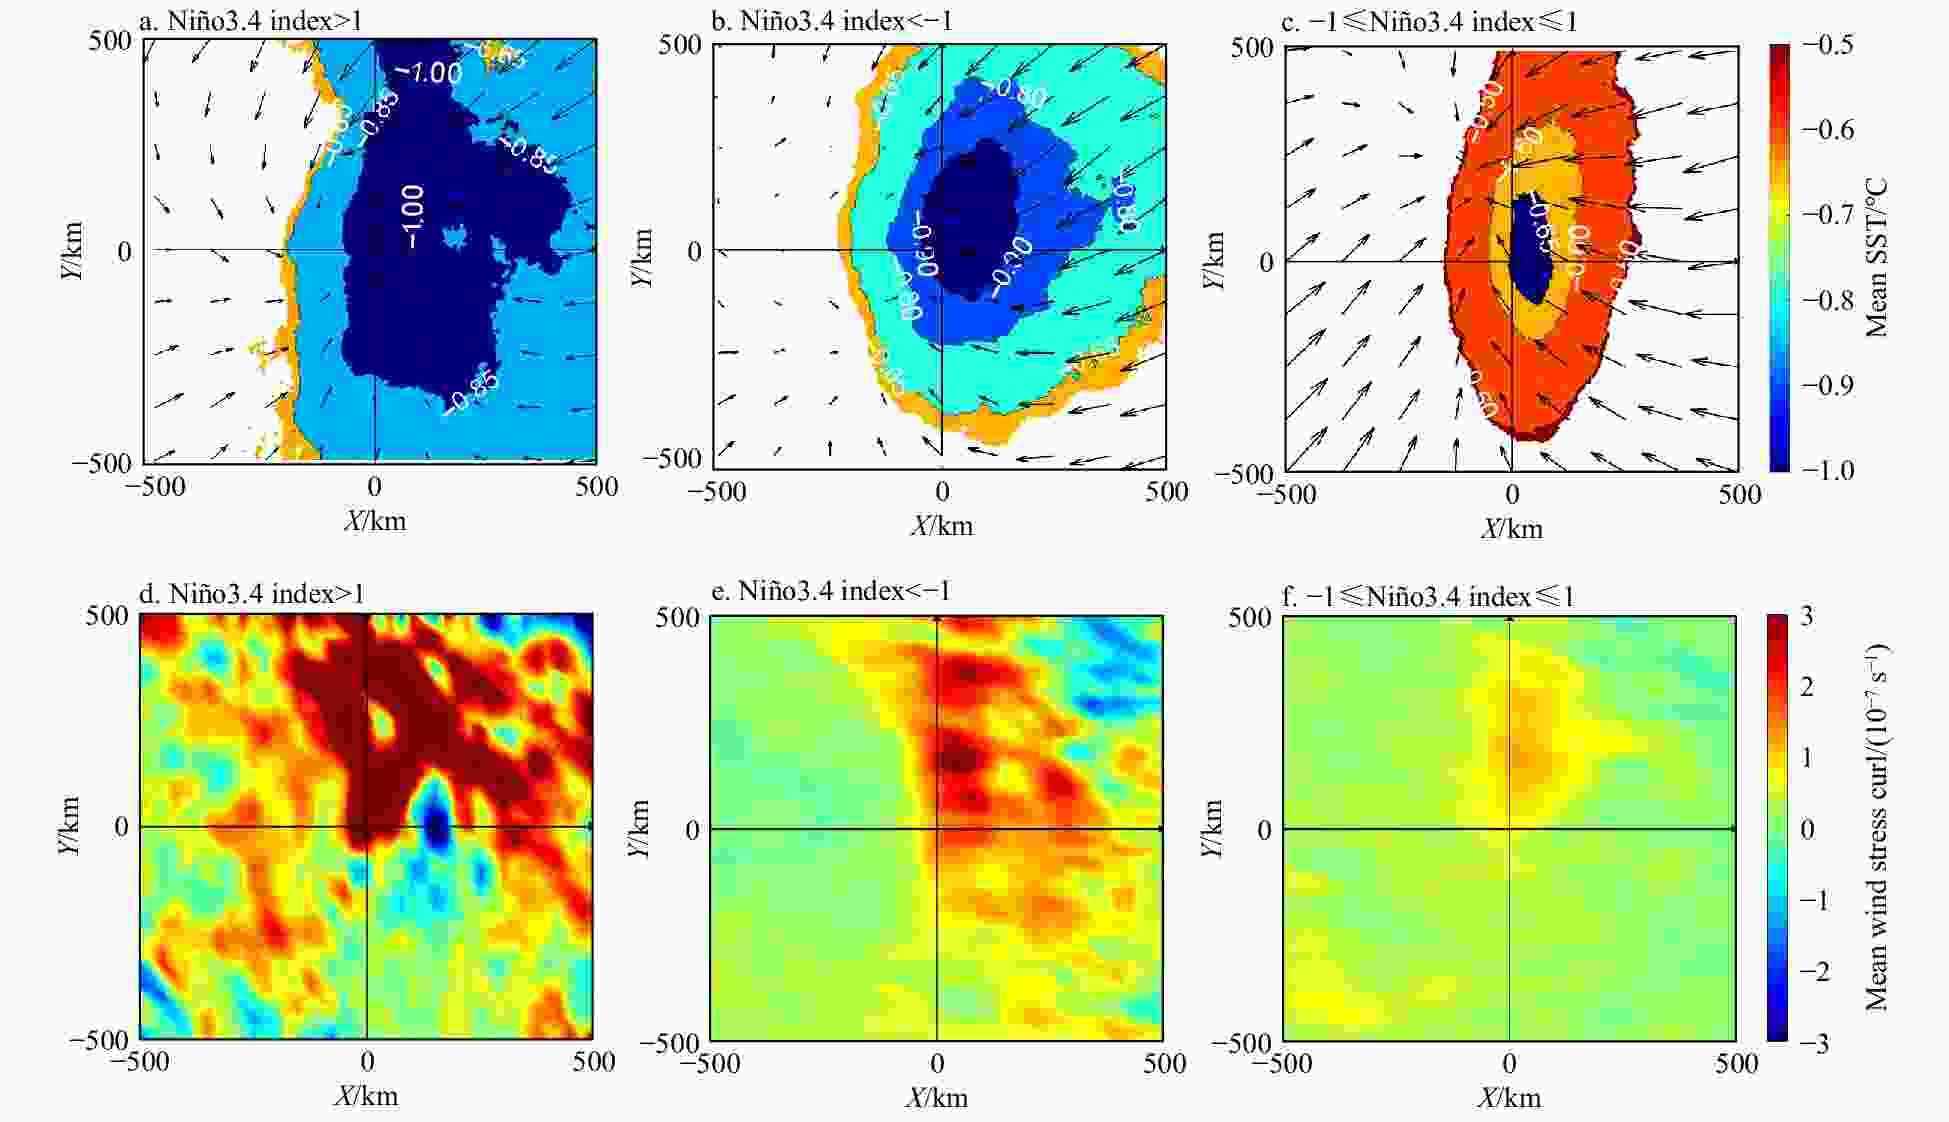
Figure 8. Composite average wind speed (vector) and
$ {\Delta }\text{SST} $ (colour scale) (a–c), and composite wind stress curl (d–f). The composite times are separated into El Niño years, La Niña years, and normal years from left to right panels. -
[1] Argo. 2021. Argo float data and metadata from Global Data Assembly Centre (Argo GDAC). SEANOE, https://www.seanoe.org/data/00311/42182/, (2021-08-06)[2021-08-20], doi: 10.17882/42182 [2] Brand S. 1971. The effects on a tropical cyclone of cooler surface waters due to upwelling and mixing produced by a prior tropical cyclone. Journal of Applied Meteorology and Climatology, 10(5): 865–874. doi: 10.1175/1520-0450(1971)010<0865:TEOATC>2.0.CO;2 [3] Chan J C L. 2000. Tropical cyclone activity over the western North Pacific associated with El Niño and La Niña events. Journal of Climate, 13(16): 2960–2972. doi: 10.1175/1520-0442(2000)013<2960:TCAOTW>2.0.CO;2 [4] Chang Yating, Lin I I, Huang H C, et al. 2020. The association of typhoon intensity increase with translation speed increase in the South China Sea. Sustainability, 12(3): 939. doi: 10.3390/su12030939 [5] Chiang T L, Wu C R, Oey L Y. 2011. Typhoon Kai-Tak: An ocean’s perfect storm. Journal of Physical Oceanography, 41(1): 221–233. doi: 10.1175/2010JPO4518.1 [6] Chu P C, Veneziano J M, Fan Chenwu, et al. 2000. Response of the South China Sea to tropical cyclone Ernie 1996. Journal of Geophysical Research: Oceans, 105(C6): 13991–14009. doi: 10.1029/2000JC900035 [7] Cione J J, Uhlhorn E W. 2003. Sea surface temperature variability in hurricanes: Implications with respect to intensity change. Monthly Weather Review, 131(8): 1783–1796. doi: 10.1175//2562.1 [8] D’Asaro E, Black P, Centurioni L, et al. 2011. Typhoon-ocean interaction in the Western North Pacific: Part 1. Oceanography, 24(4): 24–31. doi: 10.5670/oceanog.2011.91 [9] D’Asaro E A, Sanford T B, Niiler P P, et al. 2007. Cold wake of hurricane Frances. Geophysical Research Letters, 34(15): L15609 [10] Dare R A, McBride J L. 2011. Sea surface temperature response to tropical cyclones. Monthly Weather Review, 139(12): 3798–3808. doi: 10.1175/MWR-D-10-05019.1 [11] Goh A Z C, Chan J C L. 2010. Interannual and interdecadal variations of tropical cyclone activity in the South China Sea. International Journal of Climatology, 30(6): 827–843. doi: 10.1002/joc.1943 [12] Hazelworth J B. 1968. Water temperature variations resulting from hurricanes. Journal of Geophysical Research, 73(16): 5105–5123. doi: 10.1029/JB073i016p05105 [13] Jansen M F, Ferrari R, Mooring T A. 2010. Seasonal versus permanent thermocline warming by tropical cyclones. Geophysical Research Letters, 37(3): L03602 [14] Ko D S, Chao S Y, Wu C C, et al. 2014. Impacts of typhoon Megi (2010) on the South China Sea. Journal of Geophysical Research: Oceans, 119(7): 4474–4489. doi: 10.1002/2013JC009785 [15] Large W G, Pond S. 1981. Open ocean momentum flux measurements in moderate to strong winds. Journal of Physical Oceanography, 11(3): 324–336. doi: 10.1175/1520-0485(1981)011<0324:OOMFMI>2.0.CO;2 [16] Leipper D F. 1967. Observed ocean conditions and hurricane Hilda, 1964. Journal of the Atmospheric Sciences, 24(2): 182–186. doi: 10.1175/1520-0469(1967)024<0182:OOCAHH>2.0.CO;2 [17] Lin I I. 2012. Typhoon-induced phytoplankton blooms and primary productivity increase in the western North Pacific subtropical ocean. Journal of Geophysical Research: Oceans, 117(C3): C03039 [18] Lin I I, Liu W T, Wu C C, et al. 2003a. New evidence for enhanced ocean primary production triggered by tropical cyclone. Geophysical Research Letters, 30(13): 1718 [19] Lin I I, Liu W T, Wu C C, et al. 2003b. Satellite observations of modulation of surface winds by typhoon-induced upper ocean cooling. Geophysical Research Letters, 30(3): 1131. doi: 10.1029/2002GL015674 [20] Lin I I, Wu C C, Emanuel K A, et al. 2005. The interaction of supertyphoon Maemi (2003) with a warm ocean eddy. Monthly Weather Review, 133(9): 2635–2649. doi: 10.1175/MWR3005.1 [21] Mei Wei, Lien C C, Lin I I, et al. 2015. Tropical cyclone-induced ocean response: A comparative study of the South China Sea and tropical Northwest Pacific. Journal of Climate, 28(15): 5952–5968. doi: 10.1175/JCLI-D-14-00651.1 [22] Mei Wei, Pasquero C. 2013. Spatial and temporal characterization of sea surface temperature response to tropical cyclones. Journal of Climate, 26(11): 3745–3765. doi: 10.1175/JCLI-D-12-00125.1 [23] Price J F. 1981. Upper ocean response to a hurricane. Journal of Physical Oceanography, 11(2): 153–175. doi: 10.1175/1520-0485(1981)011<0153:UORTAH>2.0.CO;2 [24] Price J F, Morzel J, Niiler P P. 2008. Warming of SST in the cool wake of a moving hurricane. Journal of Geophysical Research: Oceans, 113(C7): C07010 [25] Price J F, Sanford T B, Forristall G Z. 1994. Forced stage response to a moving hurricane. Journal of Physical Oceanography, 24(2): 233–260. doi: 10.1175/1520-0485(1994)024<0233:FSRTAM>2.0.CO;2 [26] Schade L R, Emanuel K A. 1999. The ocean’s effect on the intensity of tropical cyclones: Results from a simple coupled atmosphere-ocean model. Journal of the Atmospheric Sciences, 56(4): 642–651. doi: 10.1175/1520-0469(1999)056<0642:TOSEOT>2.0.CO;2 [27] Shay L K, Black P G, Mariano A J, et al. 1992. Upper ocean response to Hurricane Gilbert. Journal of Geophysical Research: Oceans, 97(C12): 20227–20248. doi: 10.1029/92JC01586 [28] Sriver R L, Huber M. 2010. Modeled sensitivity of upper thermocline properties to tropical cyclone winds and possible feedbacks on the Hadley circulation. Geophysical Research Letters, 37(8): L08704 [29] Stark J D, Donlon C J, Martin M J, et al. 2007. OSTIA: An operational, high resolution, real time, global sea surface temperature analysis system. In: OCEANS 2007-Europe. Aberdeen, UK: IEEE, 1–4 [30] Wang Guihua, Su Jilan, Ding Yihui, et al. 2007. Tropical cyclone genesis over the South China Sea. Journal of Marine Systems, 68(3–4): 318–326 [31] Wang Xin, Tan Wei, Wang Chunzai. 2018. A new index for identifying different types of El Niño Modoki events. Climate Dynamics, 50(7–8): 2753–2765 [32] Wang Guihua, Wu Lingwei, Johnson N C, et al. 2016. Observed three-dimensional structure of ocean cooling induced by Pacific tropical cyclones. Geophysical Research Letters, 43(14): 7632–7638. doi: 10.1002/2016GL069605 [33] Wang Bin, Yang Jing, Zhou Tianjun, et al. 2008. Interdecadal changes in the major modes of Asian-Australian monsoon variability: Strengthening relationship with ENSO since the Late 1970s. Journal of Climate, 21(8): 1771–1789. doi: 10.1175/2007JCLI1981.1 [34] Wu Renguang, Chen Wen, Wang Guihua, et al. 2014. Relative contribution of ENSO and East Asian winter monsoon to the South China Sea SST anomalies during ENSO decaying years. Journal of Geophysical Research: Atmospheres, 119(9): 5046–5064. doi: 10.1002/2013JD021095 [35] Ying Ming, Zhang Wei, Yu Hui, et al. 2014. An overview of the China meteorological administration tropical cyclone database. Journal of Atmospheric and Oceanic Technology, 31(2): 287–301. doi: 10.1175/JTECH-D-12-00119.1 [36] Yuan Yuan, Yang Song, Zhang Zuqiang. 2012. Different evolutions of the Philippine Sea Anticyclone between the Eastern and Central Pacific El Niño: Possible effects of Indian Ocean SST. Journal of Climate, 25(22): 7867–7883. doi: 10.1175/JCLI-D-12-00004.1 [37] Zhao Haikun, Wang Chunzai. 2019. On the relationship between ENSO and tropical cyclones in the western North Pacific during the boreal summer. Climate Dynamics, 52(1–2): 275–288 -

 下载:
下载:


 点击查看大图
计量
- 文章访问数: 598
- HTML全文浏览量: 252
- PDF下载量: 29
- 被引次数: 0

