

Comparison of nominal and standardized catch per unit effort data in quantifying habitat suitability of skipjack tuna in the equatorial Pacific Ocean
-
Abstract: In the western and central Pacific Ocean, upper strata waters exhibit highly dynamic oceanographic features under ENSO variability. This has been proved to be responsible for the dynamic change of both abundance and zonal distribution of skipjack tuna (Katsuwonus pelamis). Although causality has been suggested by researchers using physical–biological interaction models, cumulative evidence needs to be obtained and the tenability of assertion needs to be tested from an ecological habitat perspective, based on fisheries data. For purse seine fishery, the use of catch per unit effort (CPUE) as an indication of the abundance is confusing because of technical improvements over the whole exploitation history and unbalanced individual fishing characteristic of vessels. It is particularly interesting to discriminate between habitat characteristics in comparative scenarios of CPUE application. This study identified habitat traits based on a series of oceanographic factors from a global ocean reanalysis model. A comparison was conducted between two habitat models based on unprocessed purse seine CPUE and standardized CPUE considering fishing characteristics. The results suggest that standardized CPUE could model the regular zonal shift of habitat compatible with the observed fishing efforts transfer, and achieved better prediction capacity than unprocessed CPUE. Furthermore, the habitat of skipjack tuna was also characterized and linked with surface and subsurface thermal environment, ocean current, dissolved oxygen, biotic environment, and ENSO variability. The monthly-averaged habitat suitable index, derived from the optimal habitat model prediction, showed a significant linear relationship with the southern oscillation index, which suggested that El Niño episodes eventually provide more preferable habitat for skipjack tuna under ENSO variability.
-
Key words:
- skipjack tuna /
- free-swimming schools /
- habitat characteristics /
- ENSO events /
- CPUE standardization
-
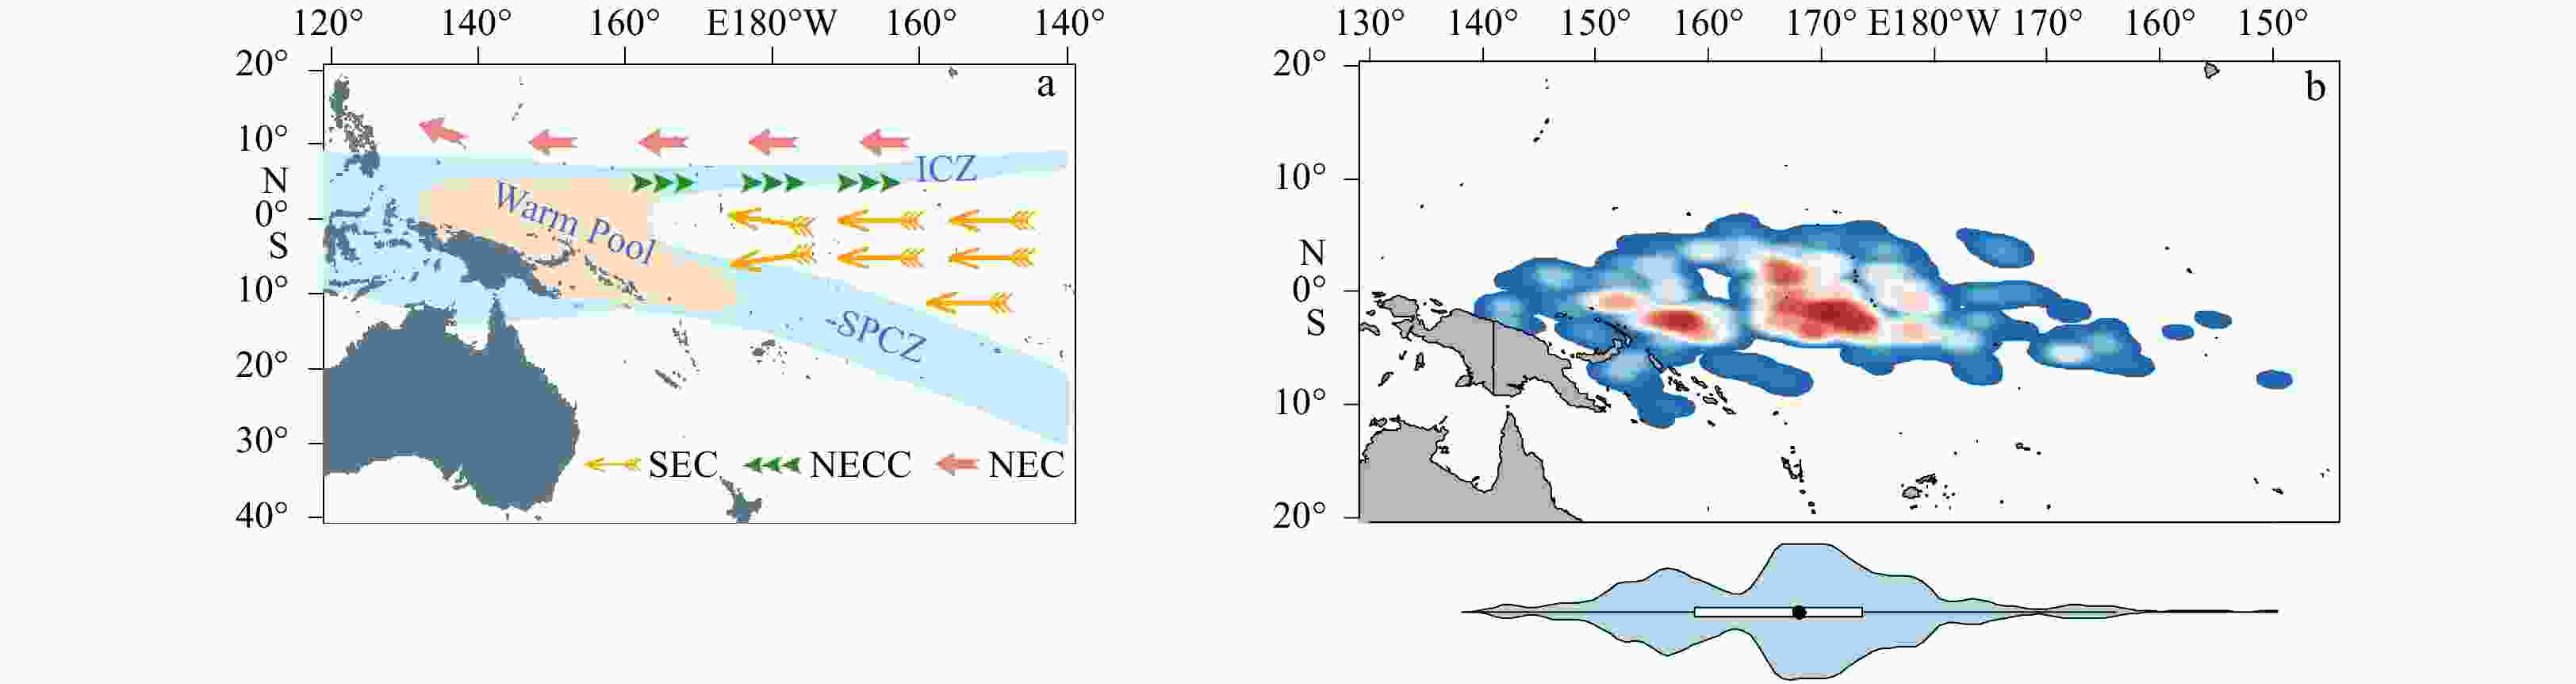
Figure 1. Major oceanographic features in the fishing area of Pacific Ocean. a. SEC represents South Equatorial Current; NECC, North Equatorial Counter Current; NEC, North Counter Current; ICZ, Intertropical Convergence Zone; SPCZ, South Pacific Convergence Zone; b. kernel density contour of fish school presence in the fishing region from 2013 to 2017. High density regions are indicated in red in b. At the bottom of b, the zonal intensity of fish schools is indicated by a violin plot, representing the persistent thermal region around the 160°E and 170°E meridian.
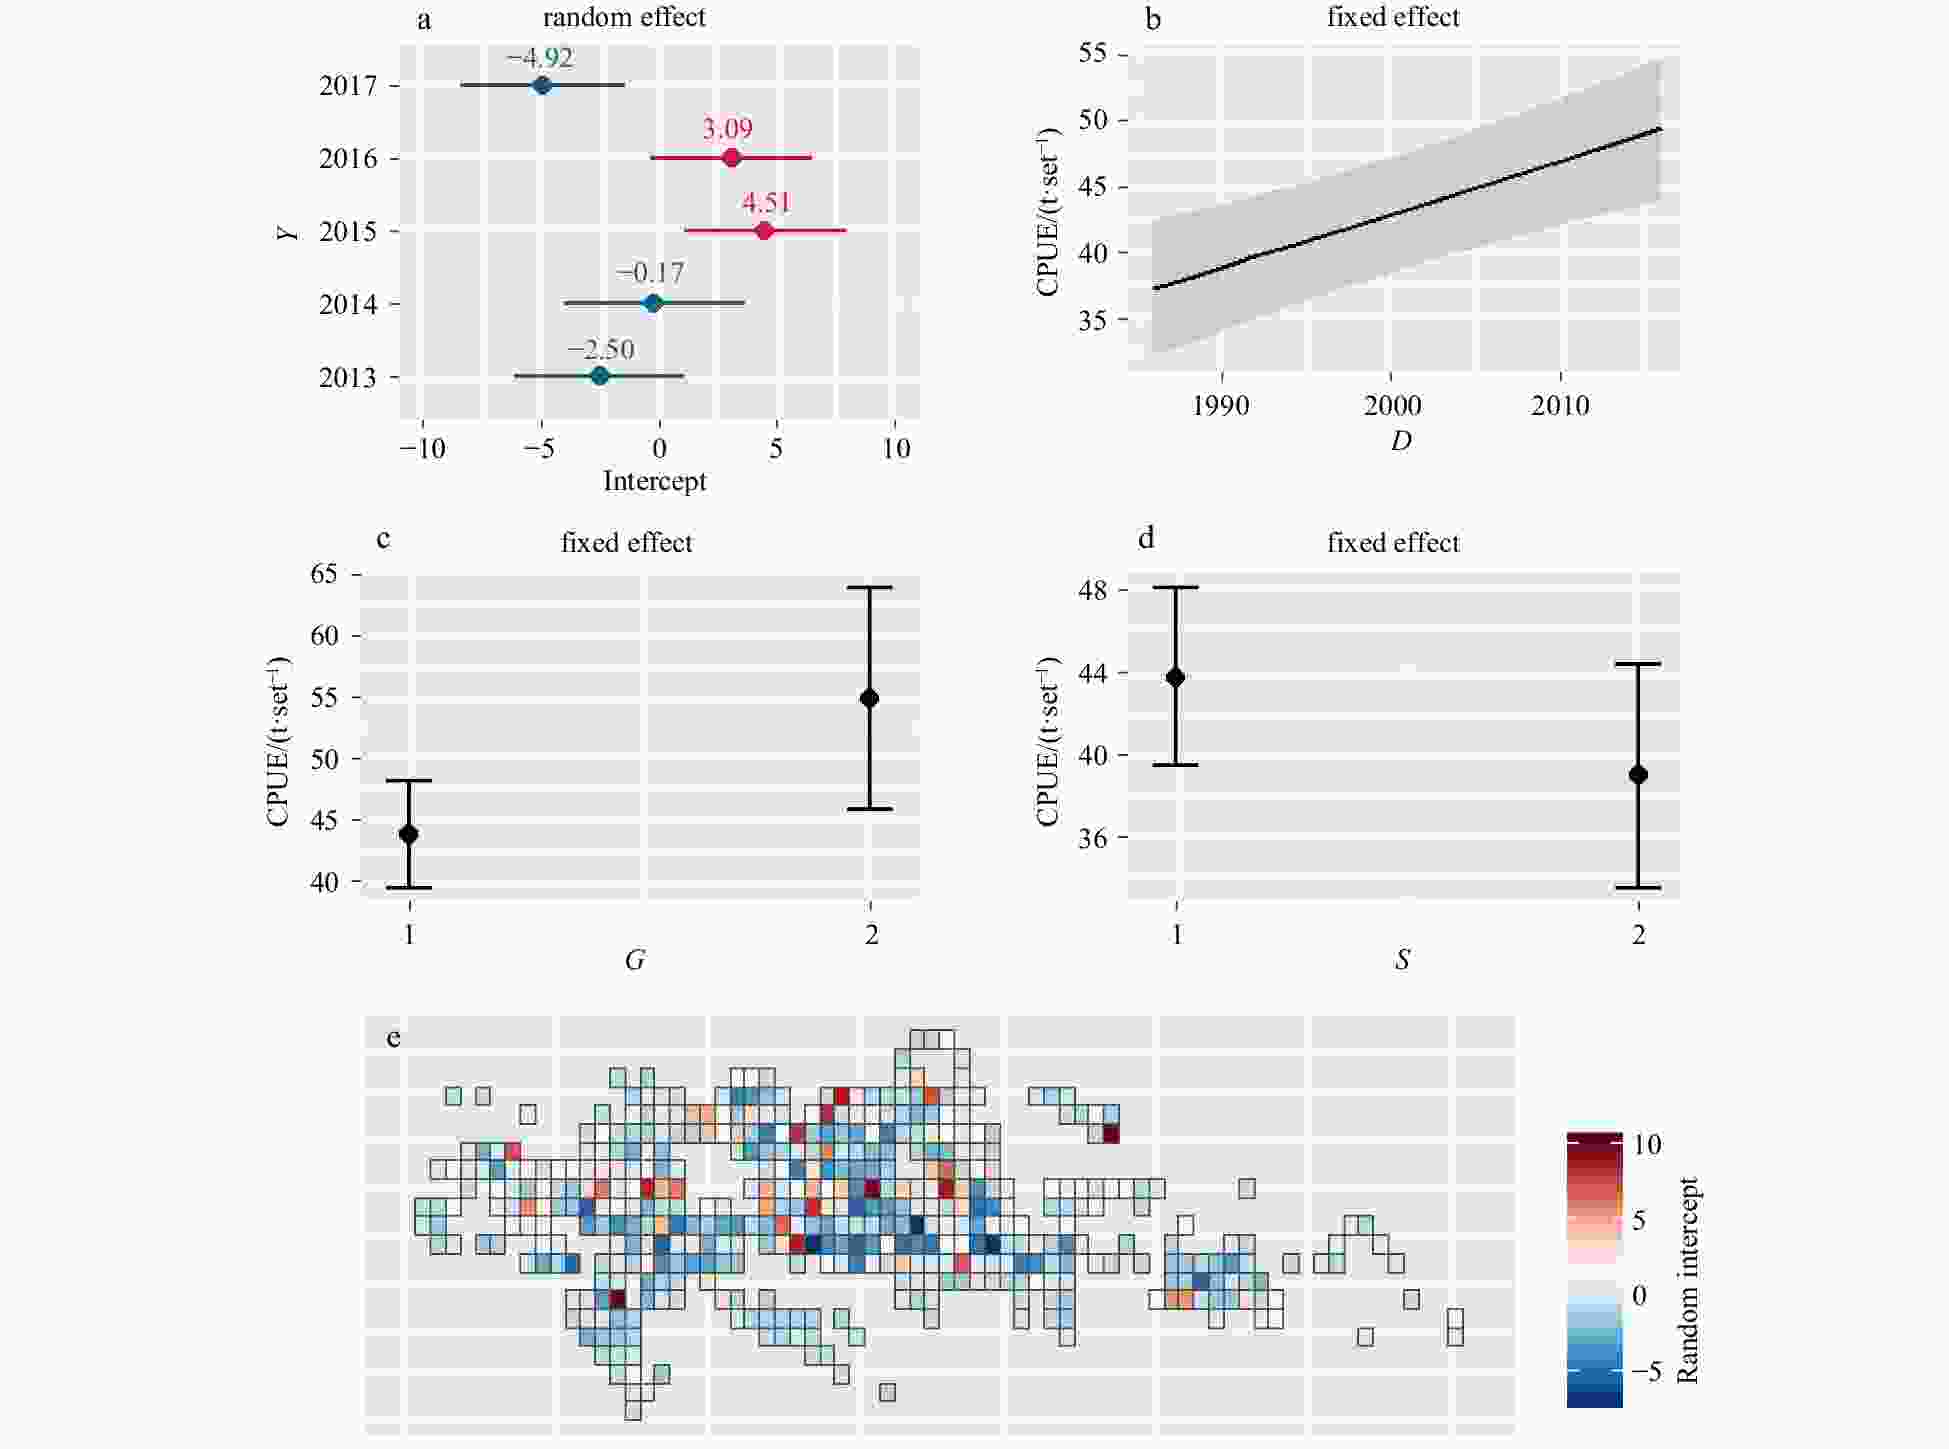
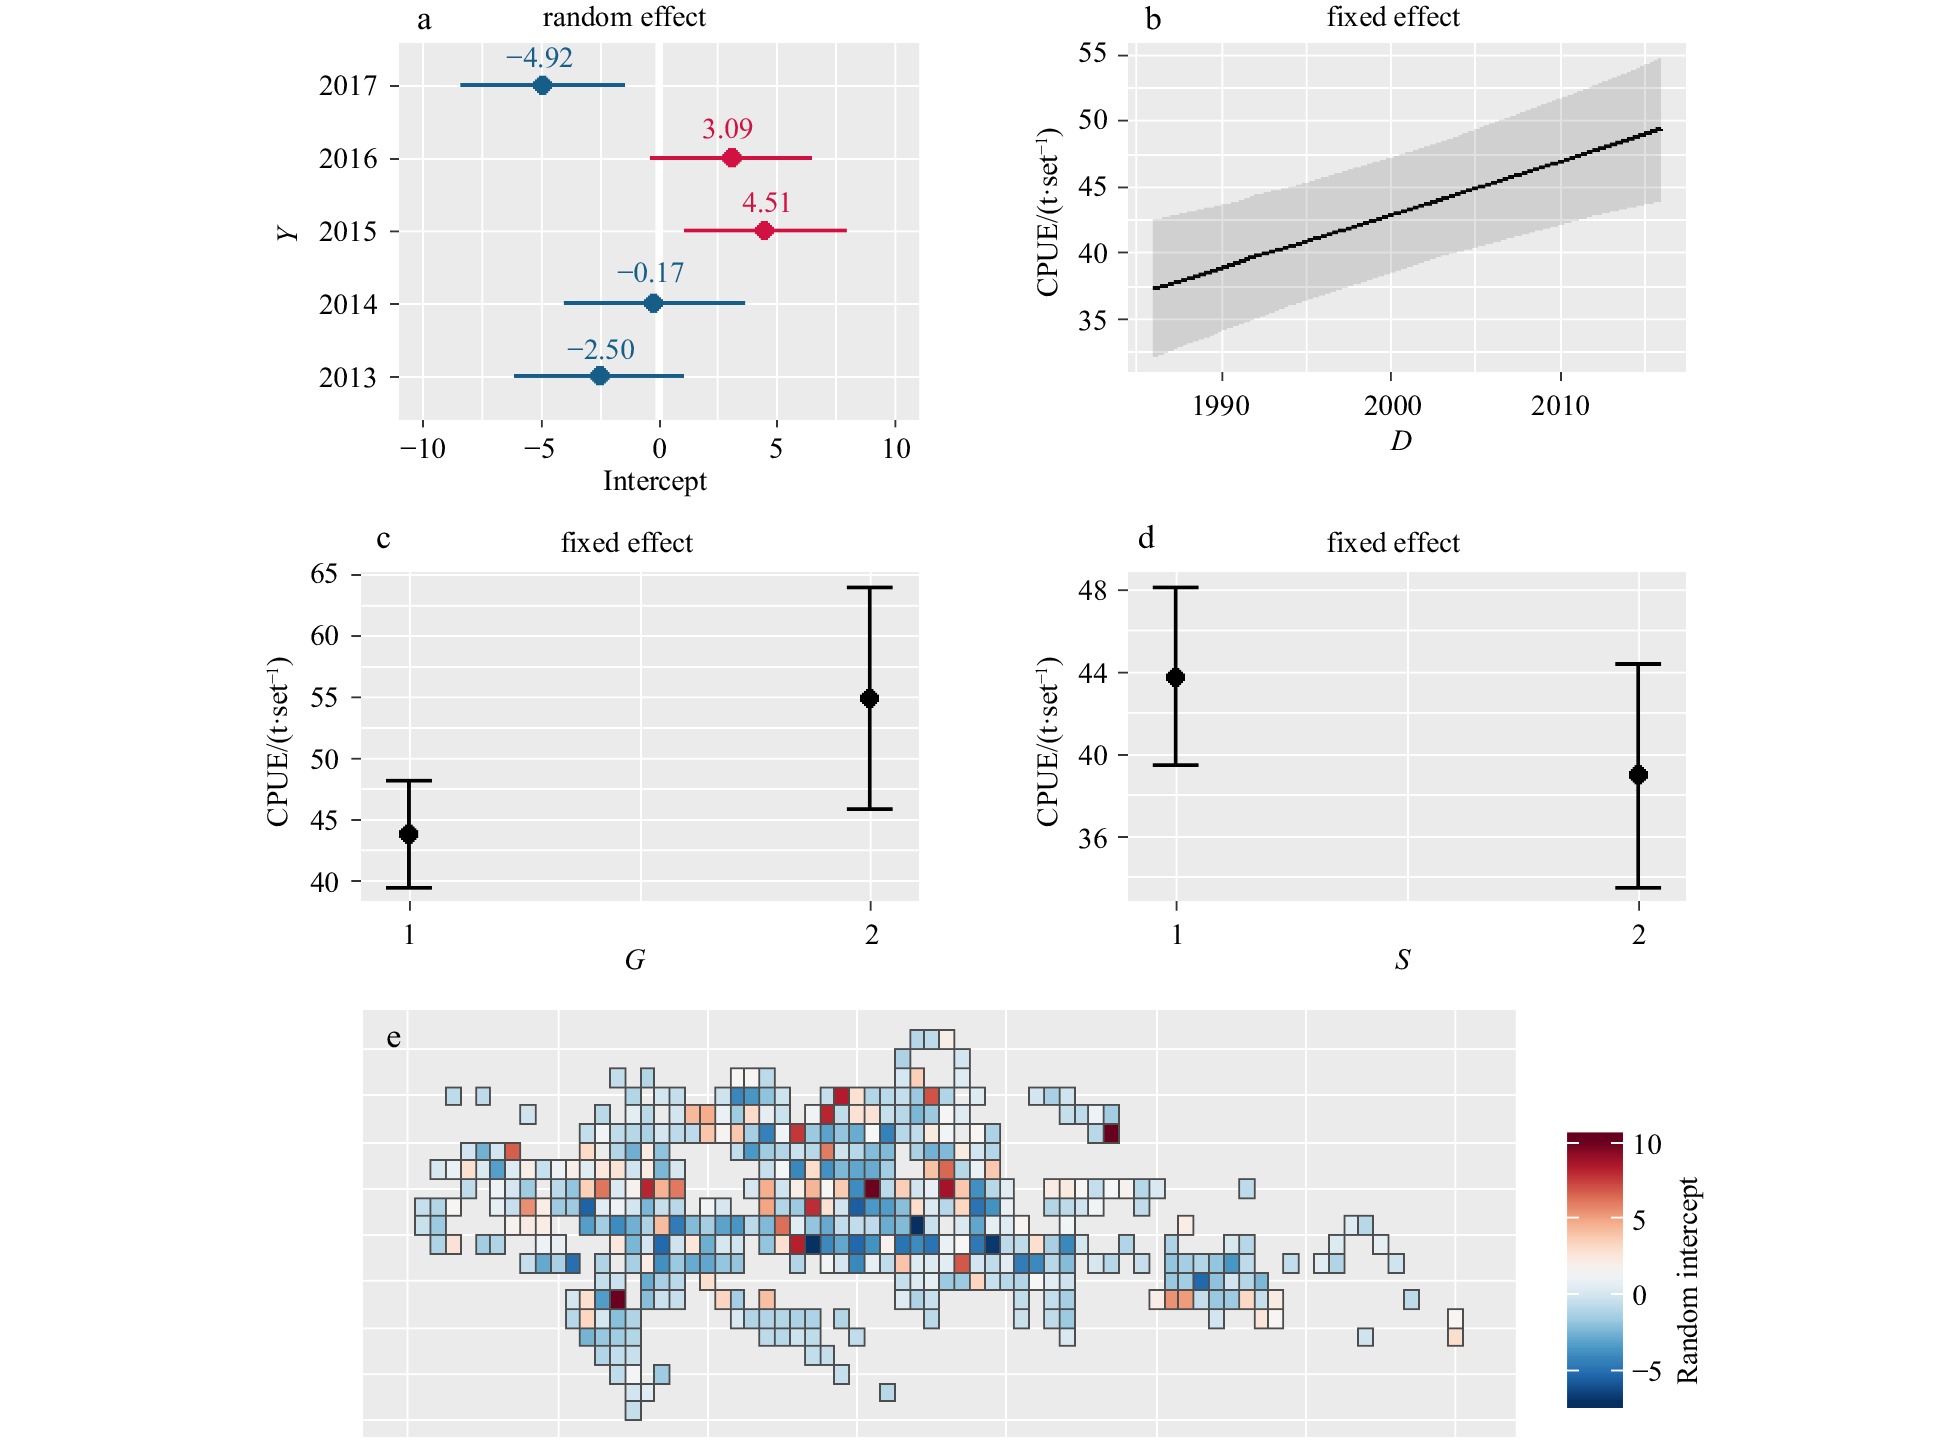
Figure 2. Linear estimates of GLMM for random effect terms year (Y) on intercept (a) and a range of fixed effects (the vessel date of build, D; the type of fishing gear, G; and the type of free swimming schools caught, S) (b, c and d). a. Positive coefficients (in red) indicate positive effects on CPUE, whereas negative effects indicate minus coefficients (in blue). In a−d, bars and shaded region indicate 95% confidence intervals. e. The random intercepts of spatial-grid are mapped onto the corresponding fishing cells (1 degree square). For the purpose of protecting the commercial confidentiality, position information is not labelled aside the axis.
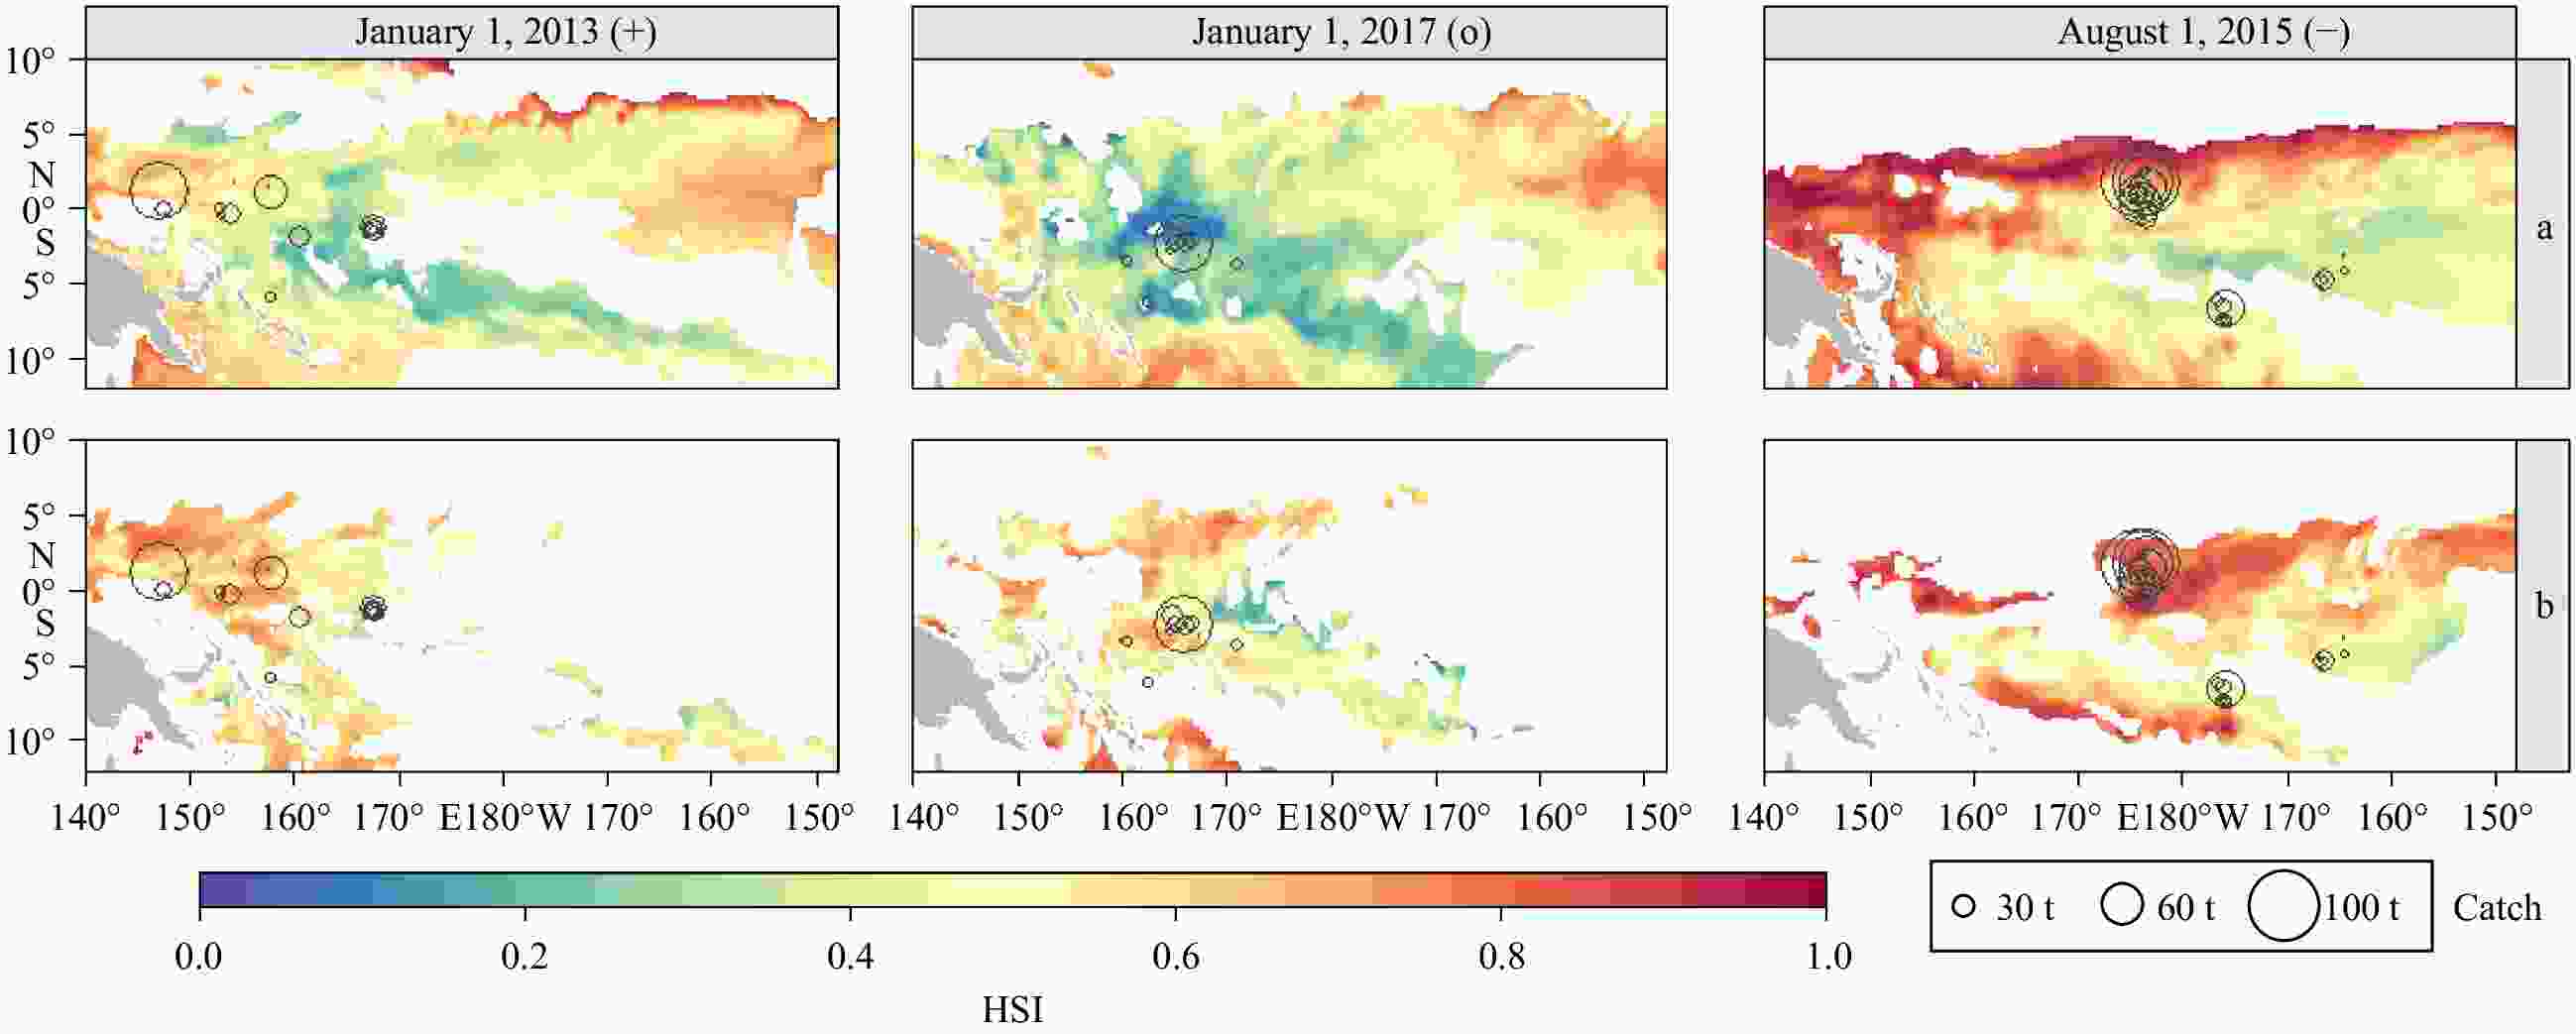
Figure 3. HSI distribution between models using nominal CPUE (a) and calibrated CPUE (b) on January 1, 2013, January 1, 2017 and August 1, 2015. ENSO periods are denoted by “+”: La Niña; “−”: strong El Niño; “o”: neutral condition. White regions indicate the null HSI due to the environmental data beyond the range of model prediction or at incredible interval. Open circles indicate catches in the corresponding month rather than day when fishing efforts are scarce.

Figure 4. Partial effect estimates of GAM for significant variables. Blue-shaded regions are 95% confidence bands for smooths. Density of raw data is displayed as a rug at the foot of each plot.
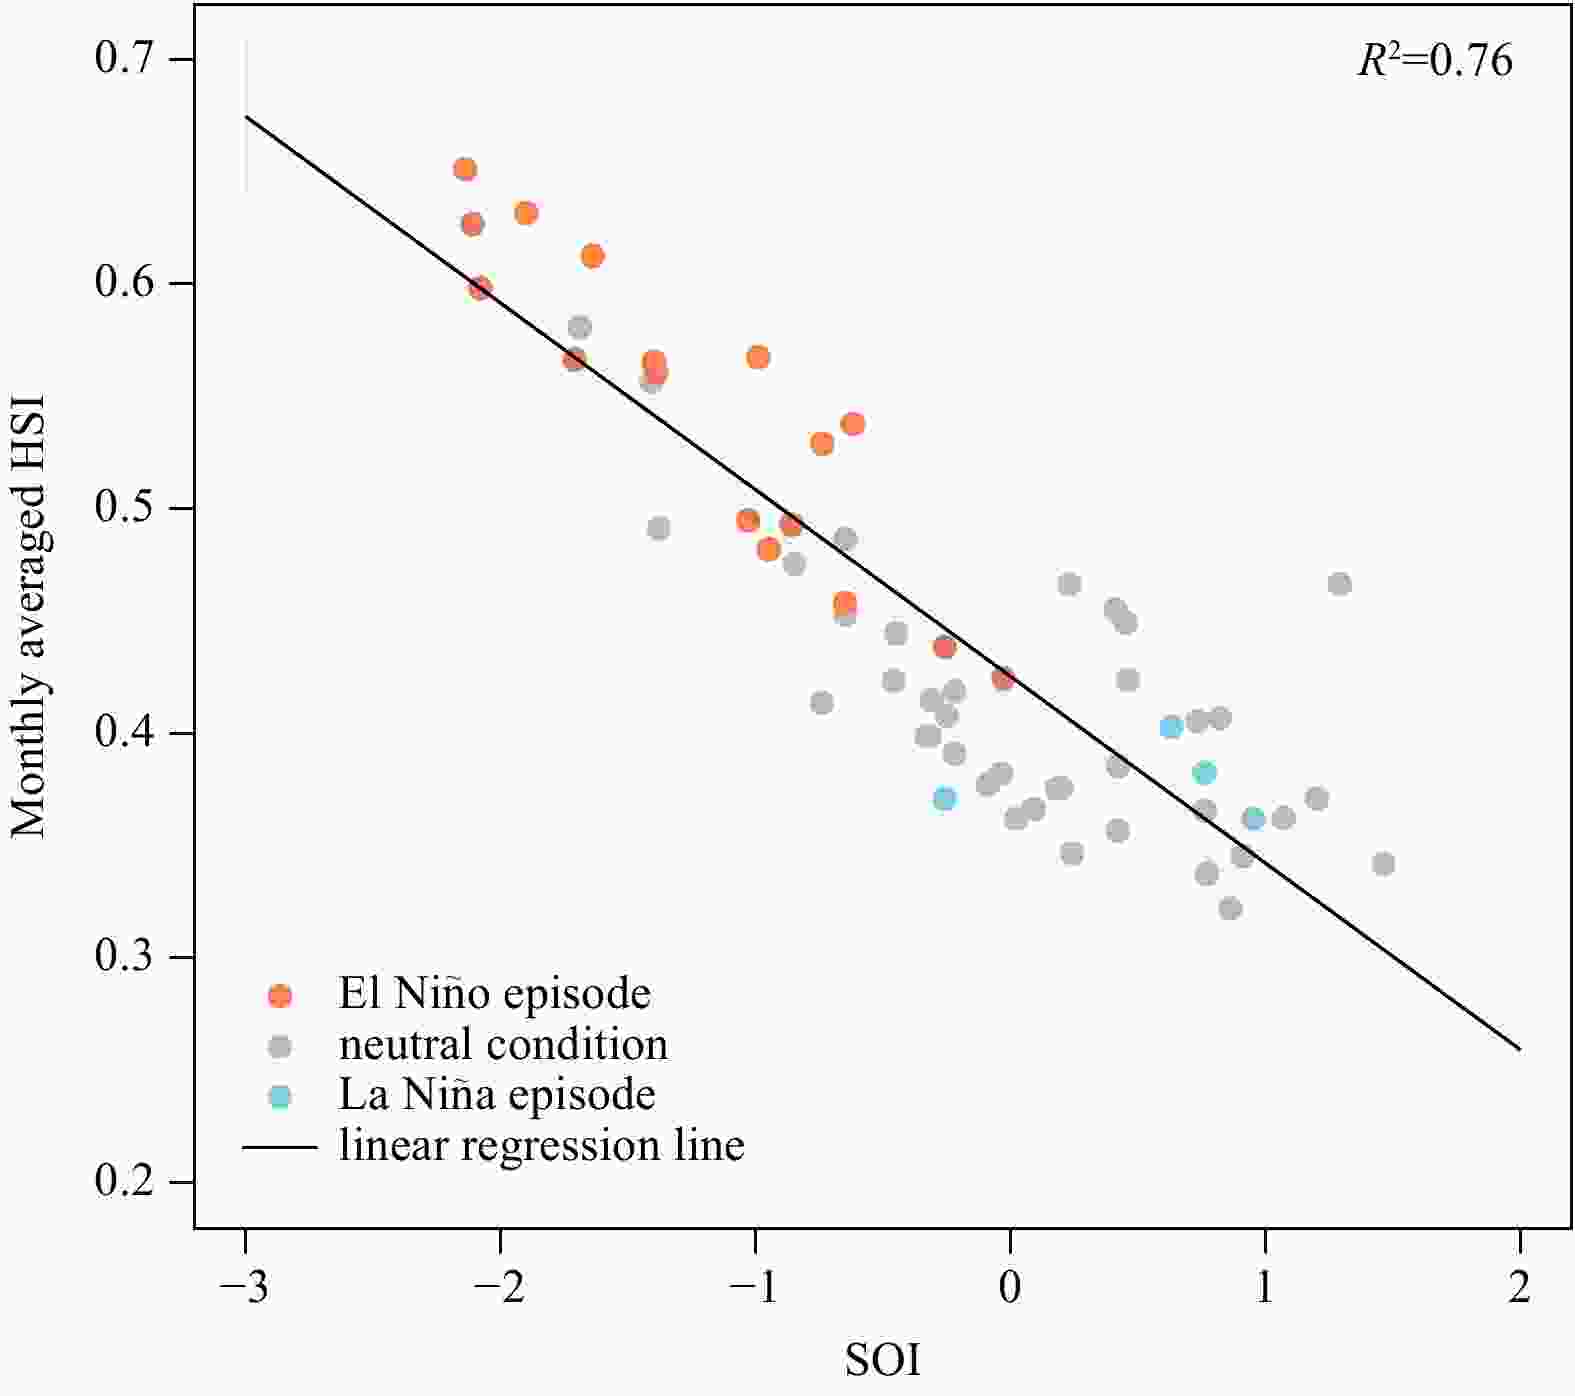
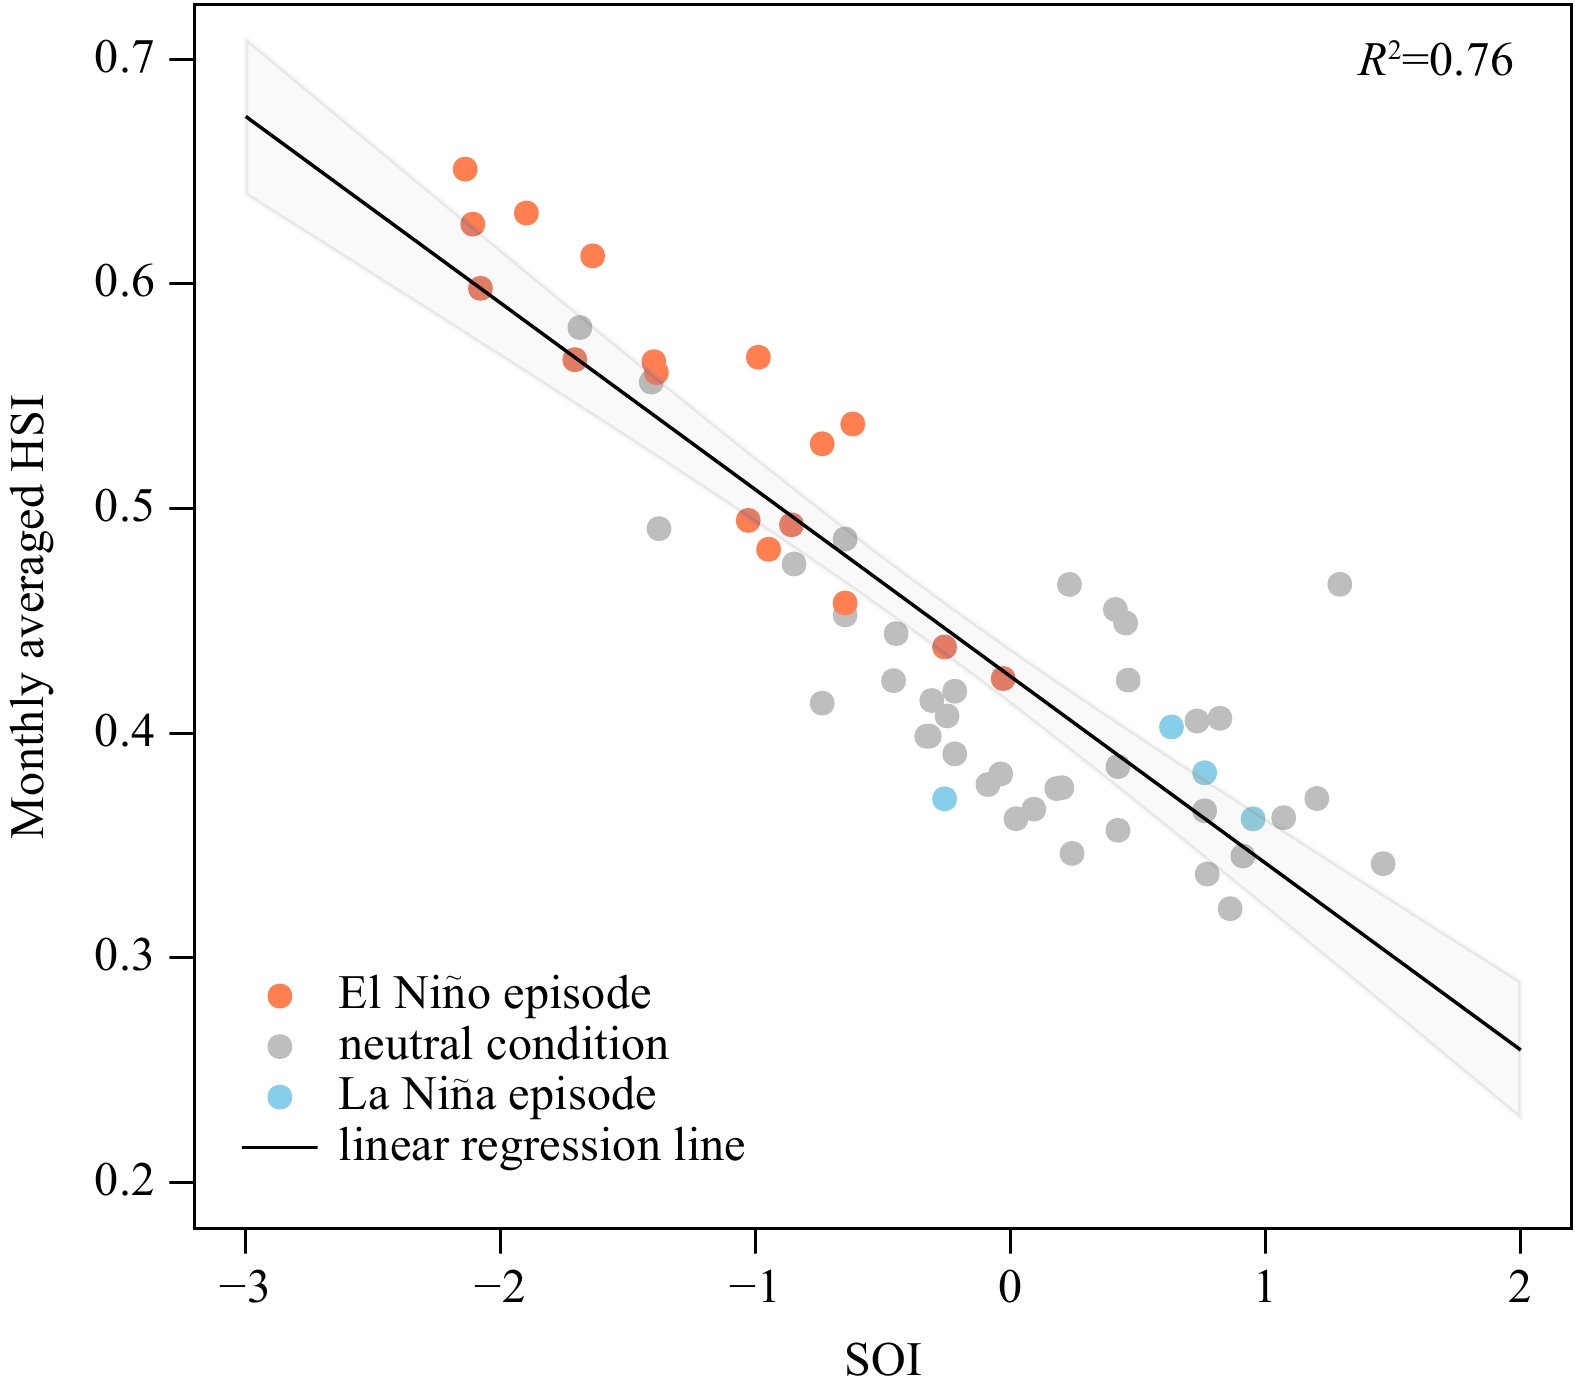
Figure 5. Linear relationship between monthly averaged HSI and SOI. Red, gray, and blue dots indicate El Niño episode (defined as six-consecutive-month average sea surface temperature anomaly exceeding 0.5°C), neutral condition, and La Niña episode (defined as six-consecutive-month average sea surface temperature anomaly less than negative 0.5°C), respectively. Shaded regions indicates 95% confidence band.
Table 1. Summary for the significant covariates as fixed effect in the optimal model of CPUE standardization
Covariates as fixed effect Estimate value SD t statistics p AIC D 0.40 0.10 3.94 <0.05 33756 G (factor 2) 11.07 4.15 2.67 <0.05 S (factor 2) −4.79 2.18 −2.2 <0.05 Note: SD represents standard error; D, the vessel date ofbuild; G, the type of fishing gear; S, the type of free swimming schoolscaught; AIC, the Akaike Information Criterion.  下载: 导出CSV
Table 2. Summary for the significant covariates in the optimal habitat models under scenarios of using nominal CPUE and calibrated CPUE
Habitat models Based on nominal CPUE Based on calibrated CPUE AIC score 33738 18129 Adjusted R2 0.023 0.35 Deviance explained 0.026 0.35 Variable EDF F p Variable EDF F p T100 1.48 7.29 <0.05 SST 2.83 6.49 <0.05 S50 2.78 2.71 <0.05 T50 2.17 6.45 <0.05 S100 2.71 3.61 <0.05 T100 2.90 41.33 <0.05 SOI 1.00 9.67 <0.05 SSS 2.85 29.48 <0.05 S50 2.99 21.08 <0.05 SSH 2.84 29.53 <0.05 SSV 2.86 7.04 <0.05 SSC 2.84 5.38 <0.05 SSO 2.94 23.78 <0.05 SSS-grad 2.10 5.21 <0.05 SSC-grad 1.00 46.09 <0.05 SOI 2.84 96.09 <0.05 Note: EDF represents estimated degree of freedom; F represents F statistics.
下载: 导出CSV
-
[1] Andrade H A. 2003. The relationship between the skipjack tuna (Katsuwonus pelamis) fishery and seasonal temperature variability in the south-western Atlantic. Fisheries Oceanography, 12(1): 10–18. doi: 10.1046/j.1365-2419.2003.00220.x [2] Andrade H A, Garcia C A E. 1999. Skipjack tuna fishery in relation to sea surface temperature off the southern Brazilian coast. Fisheries Oceanography, 8(4): 245–254. doi: 10.1046/j.1365-2419.1999.00107.x [3] Arrizabalaga H, Dufour F, Kell L, et al. 2015. Global habitat preferences of commercially valuable tuna. Deep-Sea Research Part II: Topical Studies in Oceanography, 113: 102–112. doi: 10.1016/j.dsr2.2014.07.001 [4] Barkley R A, Neill W H, Gooding R M. 1978. Skipjack tuna, Katsuwonus pelamis, habitat based on temperature and oxygen requirements. Fishery Bulletin, 76(3): 653–662 [5] Bernal D, Brill R W, Dickson K A, et al. 2017. Sharing the water column: physiological mechanisms underlying species-specific habitat use in tunas. Reviews in Fish Biology and Fisheries, 27(4): 843–880. doi: 10.1007/s11160-017-9497-7 [6] Bertignac M, Lehodey P, Hampton J. 1998. A spatial population dynamics simulation model of tropical tunas using a habitat index based on environmental parameters. Fisheries Oceanography, 7(3–4): 326–334, [7] Brill R W. 1994. A review of temperature and oxygen tolerance studies of tunas pertinent to fisheries oceanography, movement models and stock assessments. Fisheries Oceanography, 3(3): 204–216. doi: 10.1111/j.1365-2419.1994.tb00098.x [8] Dueri S, Bopp L, Maury O. 2014. Projecting the impacts of climate change on skipjack tuna abundance and spatial distribution. Global Change Biology, 20(3): 742–753. doi: 10.1111/gcb.12460 [9] Fonteneau A, Lucas V, Tewkai E, et al. 2008. Mesoscale exploitation of a major tuna concentration in the Indian Ocean. Aquatic Living Resources, 21(2): 109–121. doi: 10.1051/alr:2008028 [10] Hoyle S D, Langley A D, Campbell R A. 2014. Recommended approaches for standardizing CPUE data from pelagic fisheries. Kolonia, Pohnpei State, Federated States of Micronesia: WCPFC Scientific Committee, https://meetings.wcpfc.int/index.php/node/8709[2014-7-1/2019-9-1] [11] Katara I, Gaertner D. 2014. Some news approaches for standardizing tropical purse seiners CPUEs. Victoria Mahé, Seychelles: IOTC Working Party on Tropical Tunas, https://www.iotc.org/sites/default/files/documents/2014/11/IOTC-2014-WPTT16-16_-_PS_CPUE_Standardisations.pdf[2014-11-12/2019-7-10] [12] Katara I, Gaertner D, Billet N, et al. 2017. Standardisation of skipjack tuna CPUE for the EU purse seine fleet operating in the Indian Ocean. Victoria Mahé, Seychelles: IOTC Working Party on Tropical Tunas, https://www.iotc.org/sites/default/files/documents/2017/10/IOTC-2017-WPTT19-38_SKJ_EU_PS_CPUE.pdf[2017-10-6/2019-12-4] [13] Kirby D S, Fiksen Ø, Hart P J B. 2000. A dynamic optimisation model for the behaviour of tunas at ocean fronts. Fisheries Oceanography, 9(4): 328–342. doi: 10.1046/j.1365-2419.2000.00144.x [14] Lan K W, Lee M A, Chou C P, et al. 2018. Association between the interannual variation in the oceanic environment and catch rates of bigeye tuna (Thunnus obesus) in the Atlantic Ocean. Fisheries Oceanography, 27(5): 395–407. doi: 10.1111/fog.12259 [15] Laurs R M, Lynn R J. 1977. Seasonal migration of North Pacific albacore, Thunnus alalunga, into North American coastal waters: distribution, relative abundance, and association with transition zone waters. Fishery Bulletin, 75(4): 795–822 [16] Le Borgne R, Barber R T, Delcroix T, et al. 2002. Pacific warm pool and divergence: temporal and zonal variations on the equator and their effects on the biological pump. Deep-Sea Research Part II: Topical Studies in Oceanography, 49(13–14): 2471–2512, [17] Lehodey P. 2001. The pelagic ecosystem of the tropical Pacific Ocean: dynamic spatial modelling and biological consequences of ENSO. Progress in Oceanography, 49(1–4): 439–468, [18] Lehodey P, Bertignac M, Hampton J, et al. 1997. El Niño Southern Oscillation and tuna in the western Pacific. Nature, 389(6652): 715–718. doi: 10.1038/39575 [19] Lehodey P, Chai Fei, Hampton J. 2003. Modelling climate-related variability of tuna populations from a coupled ocean-biogeochemical-populations dynamics model. Fisheries Oceanography, 12(4–5): 483–494, [20] Lehodey P, Senina I, Calmettes B, et al. 2013. Modelling the impact of climate change on Pacific skipjack tuna population and fisheries. Climatic Change, 119(1): 95–109. doi: 10.1007/s10584-012-0595-1 [21] Lehodey P, Senina I, Murtugudde R. 2008. A spatial ecosystem and populations dynamics model (SEAPODYM)—Modeling of tuna and tuna-like populations. Progress in Oceanography, 78(4): 304–318. doi: 10.1016/j.pocean.2008.06.004 [22] Lima M, Naya D E. 2011. Large-scale climatic variability affects the dynamics of tropical skipjack tuna in the western Pacific Ocean. Ecography, 34(4): 597–605. doi: 10.1111/j.1600-0587.2010.06422.x [23] Lopez J, Moreno G, Lennert-Cody C, et al. 2017. Environmental preferences of tuna and non-tuna species associated with drifting fish aggregating devices (DFADs) in the Atlantic Ocean, ascertained through fishers’ echo-sounder buoys. Deep-Sea Research Part II: Topical Studies in Oceanography, 140: 127–138. doi: 10.1016/j.dsr2.2017.02.007 [24] Loukos H, Monfray P, Bopp L, et al. 2003. Potential changes in skipjack tuna (Katsuwonus pelamis) habitat from a global warming scenario: modelling approach and preliminary results. Fisheries Oceanography, 12(4–5): 474–482, [25] Matear R J, Chamberlain M A, Sun C, et al. 2015. Climate change projection for the western tropical Pacific Ocean using a high-resolution ocean model: Implications for tuna fisheries. Deep-Sea Research Part II: Topical Studies in Oceanography, 113: 22–46. doi: 10.1016/j.dsr2.2014.07.003 [26] Maunder M N, Punt A E. 2004. Standardizing catch and effort data: a review of recent approaches. Fisheries Research, 70(2–3): 141–159, [27] Maunder M N, Sibert J R, Fonteneau A, et al. 2006. Interpreting catch per unit effort data to assess the status of individual stocks and communities. ICES Journal of Marine Science, 63(8): 1373–1385. doi: 10.1016/j.icesjms.2006.05.008 [28] Mugo R, Saitoh S I, Nihira A, et al. 2010. Habitat characteristics of skipjack tuna (Katsuwonus pelamis) in the western North Pacific: a remote sensing perspective. Fisheries Oceanography, 19(5): 382–396. doi: 10.1111/j.1365-2419.2010.00552.x [29] Mugo R M, Saitoh S I, Takahashi F, et al. 2014. Evaluating the role of fronts in habitat overlaps between cold and warm water species in the western North Pacific: a proof of concept. Deep-Sea Research Part II: Topical Studies in Oceanography, 107: 29–39. doi: 10.1016/j.dsr2.2013.11.005 [30] Nihira A. 1996. Studies on the behavioral ecology and physiology of migratory fish schools of skipjack tuna (Katsuwonus pelamis) in the oceanic frontal area. Bulletin of Tohoku National Fisheries Research Institute (in Japanese), 58: 137–233 [31] Phillips A J, Ciannelli L, Brodeur R D, et al. 2014. Spatio-temporal associations of albacore CPUEs in the northeastern Pacific with regional SST and climate environmental variables. ICES Journal of Marine Science, 71(7): 1717–1727. doi: 10.1093/icesjms/fst238 [32] Picaut J, Ioualalen M, Menkes C, et al. 1996. Mechanism of the zonal displacements of the Pacific Warm Pool: implications for ENSO. Science, 274(5292): 1486–1489. doi: 10.1126/science.274.5292.1486 [33] Polovina J J, Howell E, Kobayashi D R, et al. 2001. The transition zone chlorophyll front, a dynamic global feature defining migration and forage habitat for marine resources. Progress in Oceanography, 49(1–4): 469–483, [34] Roger C. 1994. Relationships among yellowfin and skipjack tuna, their prey-fish and plankton in the tropical western Indian Ocean. Fisheries Oceanography, 3(2): 133–141. doi: 10.1111/j.1365-2419.1994.tb00055.x [35] Schaefer K M, Fuller D W. 2007. Vertical movement patterns of skipjack tuna (Katsuwonus pelamis) in the eastern equatorial Pacific Ocean, as revealed with archival tags. Fishery Bulletin, 105(3): 379–389. doi: 10.1016/j.fishres.2007.01.005 [36] Schick R S, Lutcavage M E. 2009. Inclusion of prey data improves prediction of bluefin tuna (Thunnus thynnus) distribution. Fisheries Oceanography, 18(1): 77–81. doi: 10.1111/j.1365-2419.2008.00499.x [37] Setiawati M D, Sambah A B, Miura F, et al. 2015. Characterization of bigeye tuna habitat in the Southern Waters off Java-Bali using remote sensing data. Advances in Space Research, 55(2): 732–746. doi: 10.1016/j.asr.2014.10.007 [38] Tew Kai E, Marsac F. 2010. Influence of mesoscale eddies on spatial structuring of top predators’ communities in the Mozambique Channel. Progress in Oceanography, 86(1–2): 214–223, [39] Tian Siquan, Chen Xinjun, Chen Yong, et al. 2009. Evaluating habitat suitability indices derived from CPUE and fishing effort data for Ommatrephes bratramii in the northwestern Pacific Ocean. Fisheries Research, 95(2–3): 181–188, [40] Tidd A, Brouwer S, Pilling G. 2017. Shooting fish in a barrel? Assessing fisher-driven changes in catchability within tropical tuna purse seine fleets. Fish and Fisheries, 18(5): 808–820. doi: 10.1111/faf.12207 [41] Wang Xuefang, Chen Yong, Truesdell S, et al. 2014. The large-scale deployment of fish aggregation devices alters environmentally-based migratory behavior of skipjack tuna in the western Pacific Ocean. PLoS ONE, 9(5): e98226. doi: 10.1371/journal.pone.0098226 [42] Yen K W, Wang G H, Lu H J. 2017. Evaluating habitat suitability and relative abundance of skipjack (Katsuwonus pelamis) in the western and central Pacific during various El Niño events. Ocean & Coastal Management, 139: 153–160. doi: 10.1016/j.ocecoaman.2017.02.011 [43] Yu Wei, Chen Xinjun. 2021. Habitat suitability response to sea-level height changes: Implications for Ommastrephid squid conservation and management. Aquaculture and Fisheries, 6(3): 309–320. doi: 10.1016/j.aaf.2020.06.001 [44] Zainuddin M, Farhum A, Safruddin S, et al. 2017. Detection of pelagic habitat hotspots for skipjack tuna in the Gulf of Bone-Flores Sea, southwestern Coral Triangle tuna, Indonesia. PLoS ONE, 12(10): e0185601. doi: 10.1371/journal.pone.0185601 [45] Zainuddin M, Kiyofuji H, Saitoh K, et al. 2006. Using multi-sensor satellite remote sensing and catch data to detect ocean hot spots for albacore (Thunnus alalunga) in the northwestern North Pacific. Deep-Sea Research Part II: Topical Studies in Oceanography, 53(3–4): 419–431, [46] Zainuddin M, Saitoh K, Saitoh S I. 2008. Albacore (Thunnus alalunga) fishing ground in relation to oceanographic conditions in the western North Pacific Ocean using remotely sensed satellite data. Fisheries Oceanography, 17(2): 61–73. doi: 10.1111/j.1365-2419.2008.00461.x [47] Zhou Cheng, Xu Liuxiong, Hu Fuxiang, et al. 2015. Hydrodynamic characteristics of knotless nylon netting normal to free stream and effect of inclination. Ocean Engineering, 110: 89–97. doi: 10.1016/j.oceaneng.2015.09.043 -


 点击查看大图

计量
- 文章访问数: 1115
- HTML全文浏览量: 433
- PDF下载量: 81
- 被引次数: 0

