

Phytoplanktonic biogeography in the subtropical coastal waters, East China Sea along intensive anthropogenic stresses: roles of environmental versus spatial factors
-
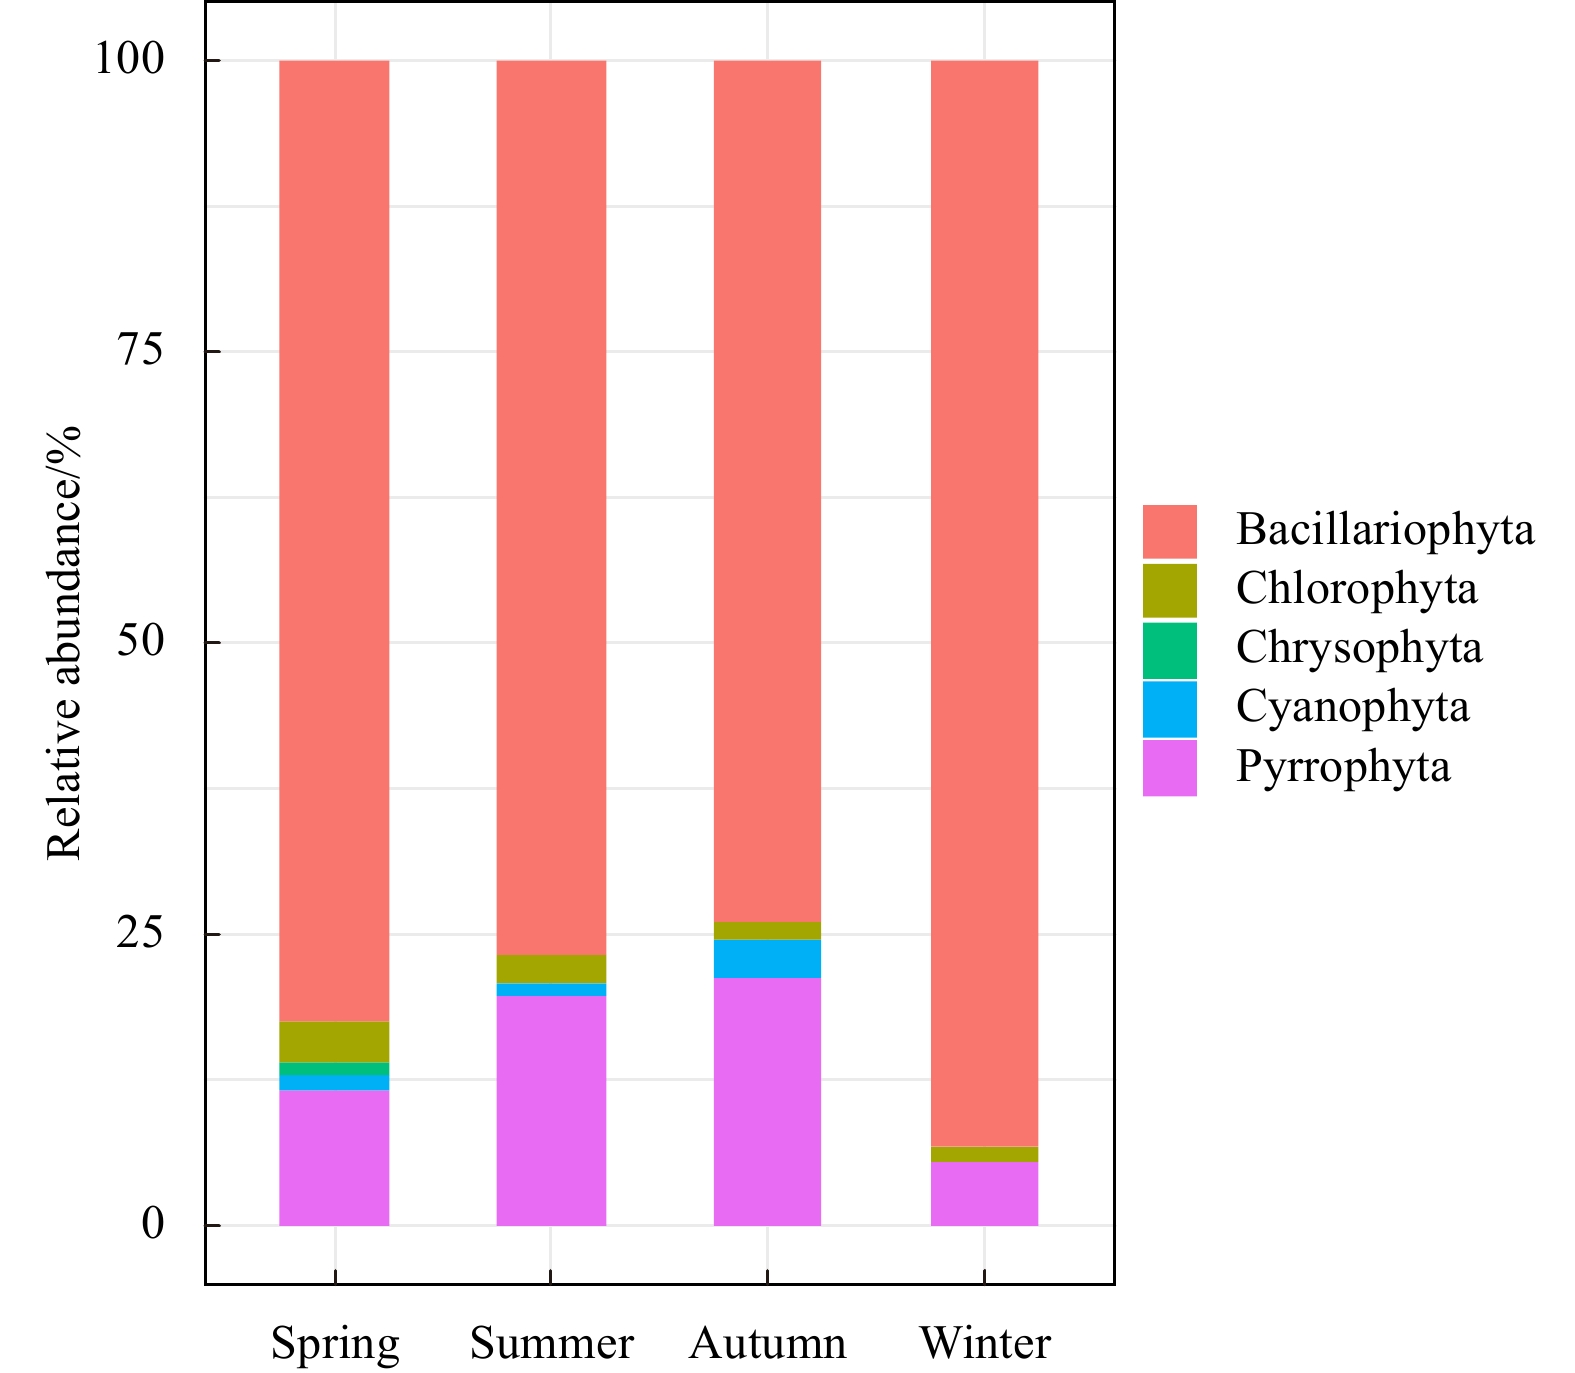
Abstract: Understanding the relative roles of local environmental effects and spatial effects on phytoplankton community is of essential importance to study the biogeography of them at regional scale. However, the determinants that driving the biogeography of phytoplankton communities in the coastal area of northern Zhejiang still remained unclear. We surveyed phytoplankton community compositions in water columns associated with environmental and spatial influences across five subzones that geographically covering this region over four seasons. Diatoms and dinoflagellates were recorded as the main dominant groups and Coscinodiscus oculs-iridis, Coscinodiscus jonesianus, and Skeletonema costatum, were identified as the major abundant species existing in all seasons. Spatially structured environmental conditions, rather than pure spatial or environmental factors, substantially shaped the biogeography of phytoplankton community, with the former mainly comprised of water temperature, dissolved oxygen, phosphate, pH, and salinity, and the latter referring to a non-negligible factor. This study was the first integrated research that combining environmental filtering with spatial factors in structuring phytoplankton communities at a complete tempo-spatial scale. Our results may facilitate to the further study of harmful algal blooms early-warning in this region.
-
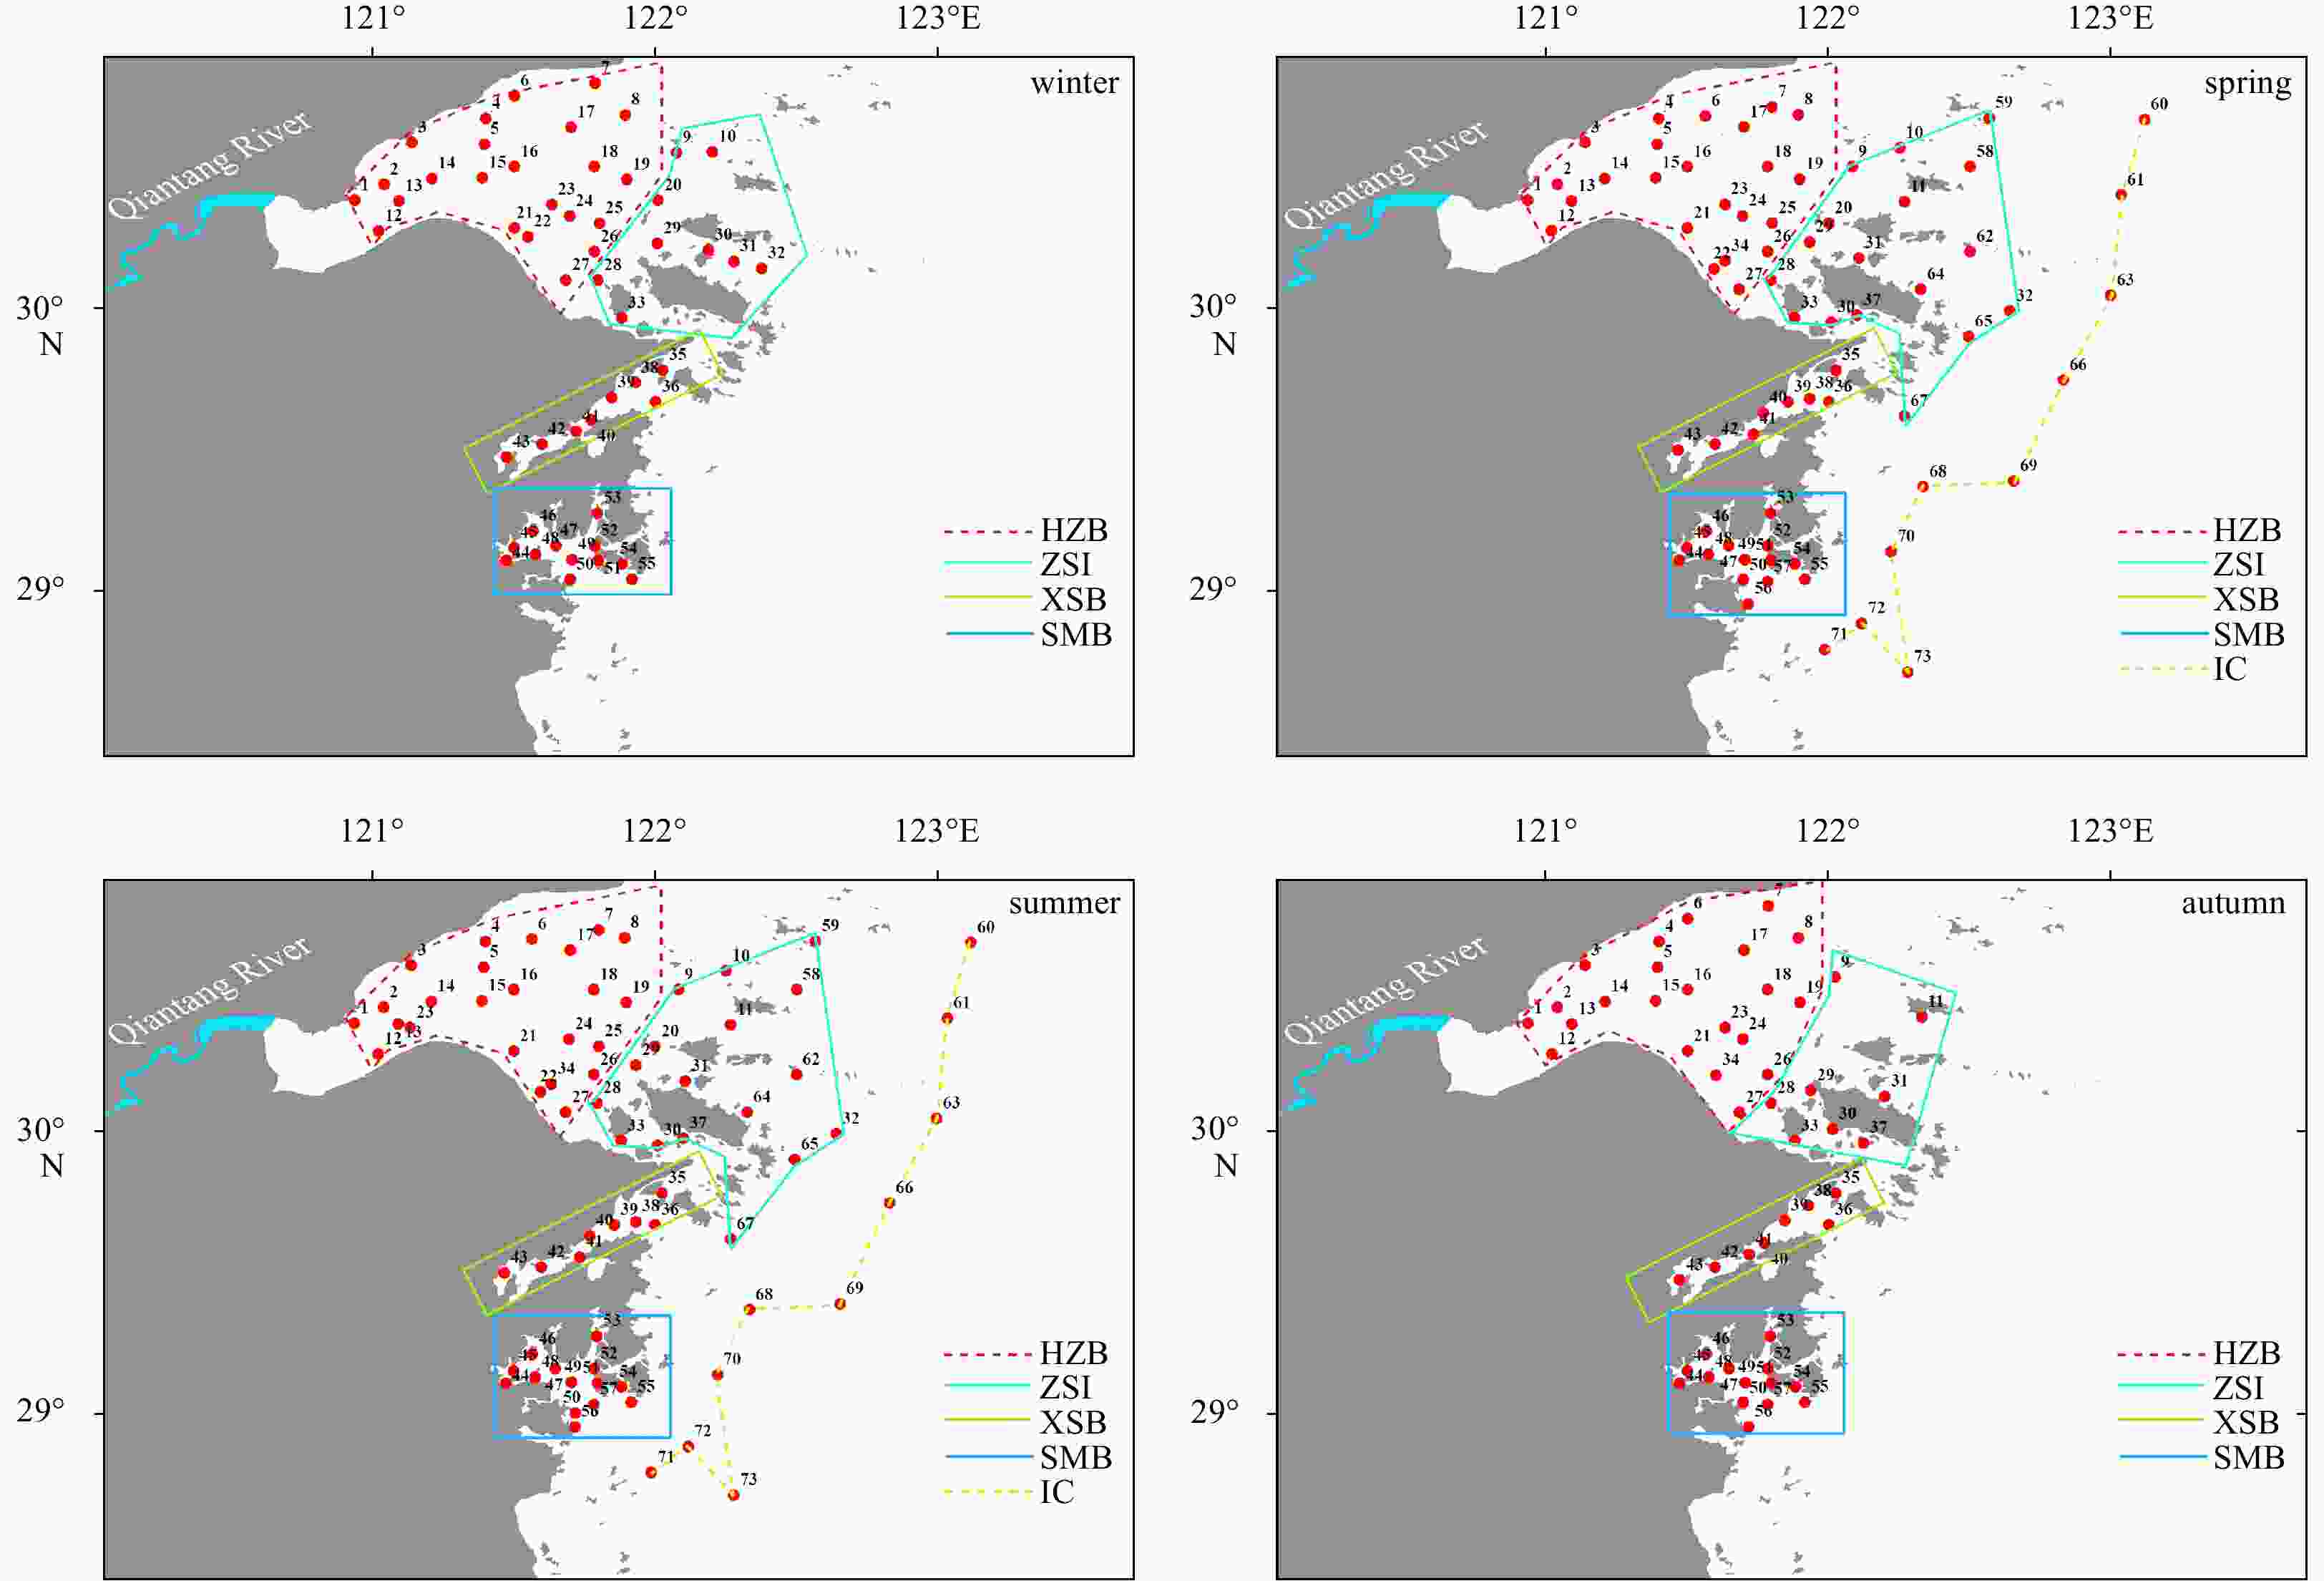
Figure 1. Sampling sites in the coastal waters of northern Zhejiang comprised of Hangzhou Bay (HZB), Zhoushan Islands (ZSI), island chain (IC), Xiangshan Bay (XSB) and Sanmen Bay (SMB) over four seasons.

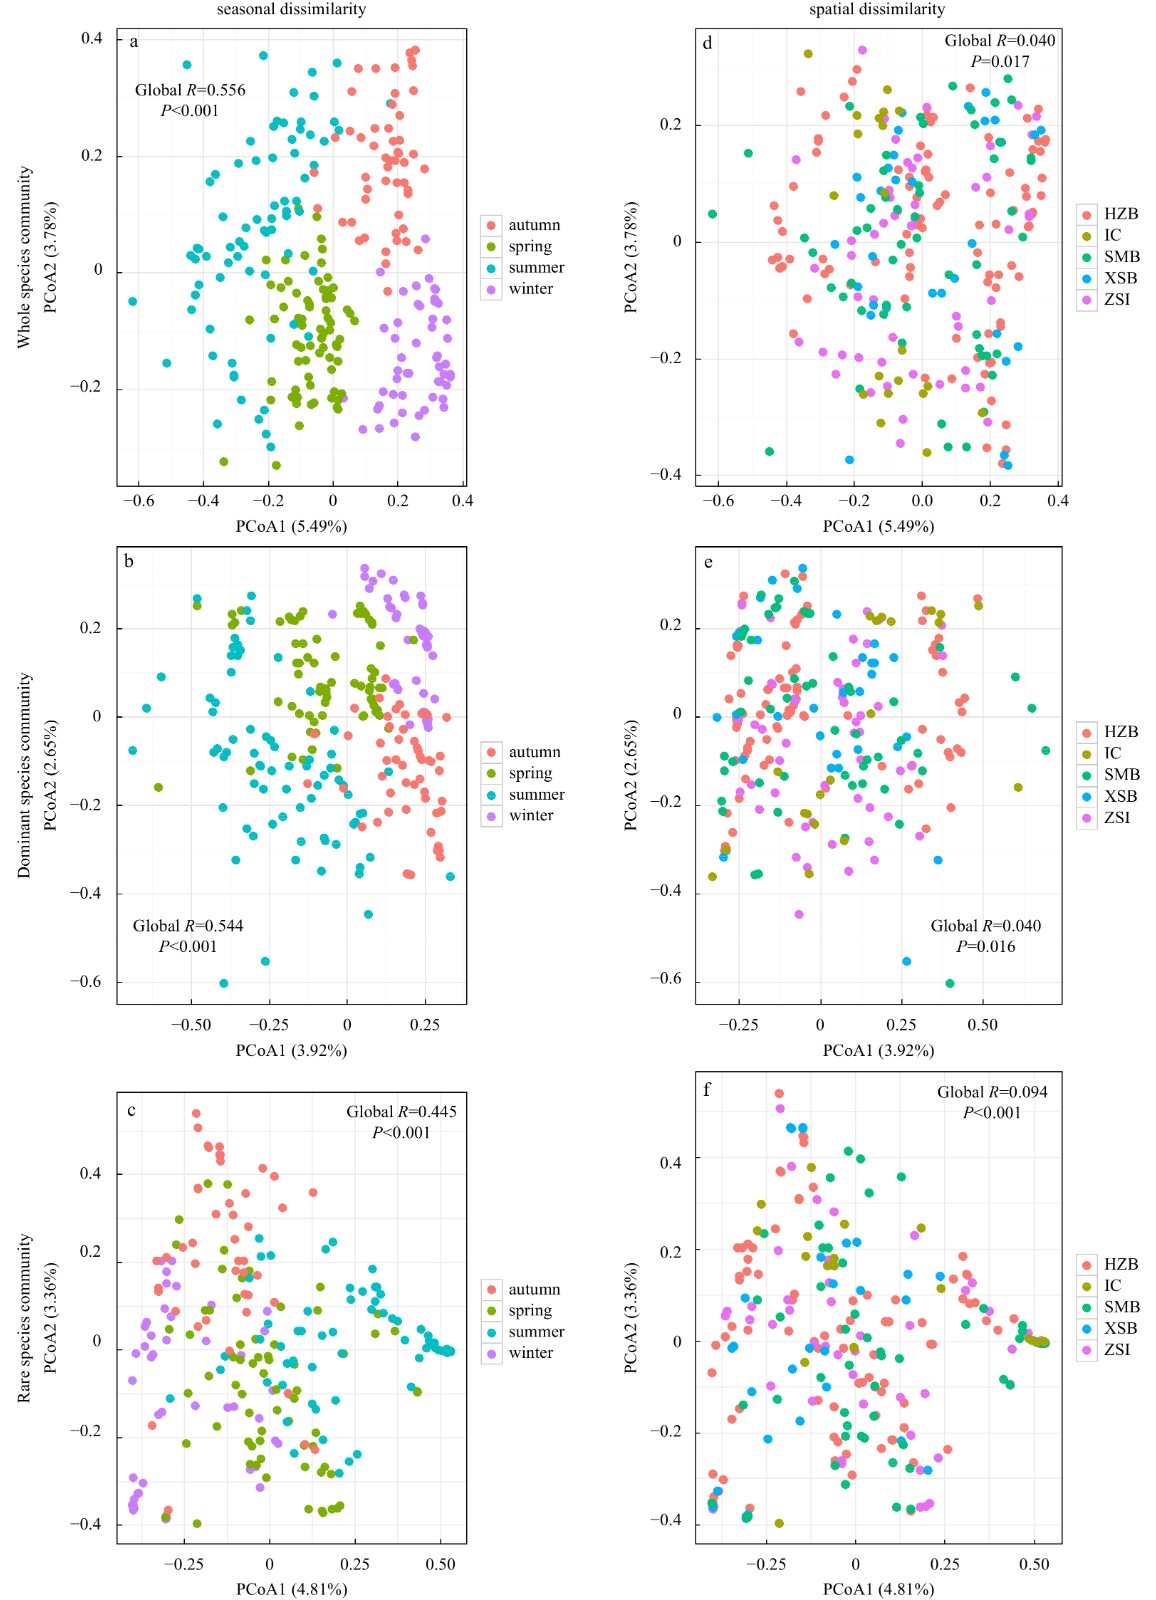
Figure 3. Principal coordinate analysis (PCoA) plots of the whole community (a, d), the dominant community (b, e) and rare community (c, f) with one-way analysis of similarity (ANOSIM) visualize both seasonal (a−c) and spatial (d−f) dissimilarities. HZB: Hangzhou Bay; IC: island chain; SMB: Sanmen Bay; XSB: Xiangshan Bay; ZSI: Zhoushan Islands.
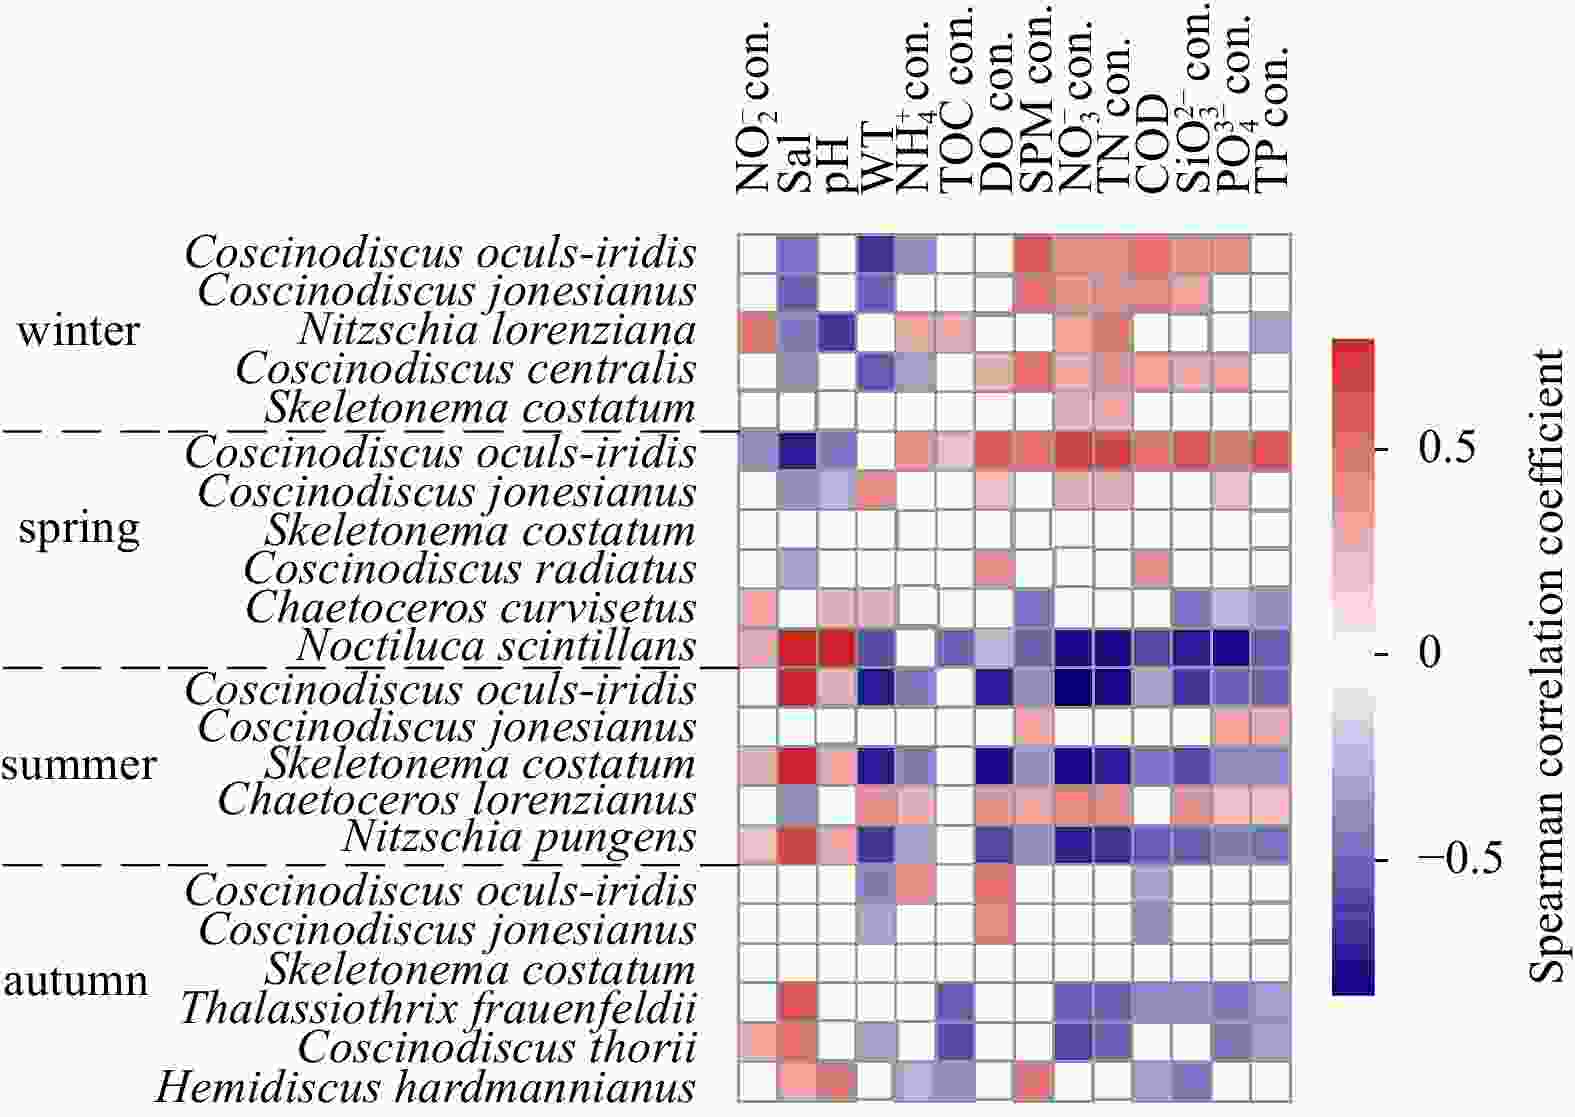
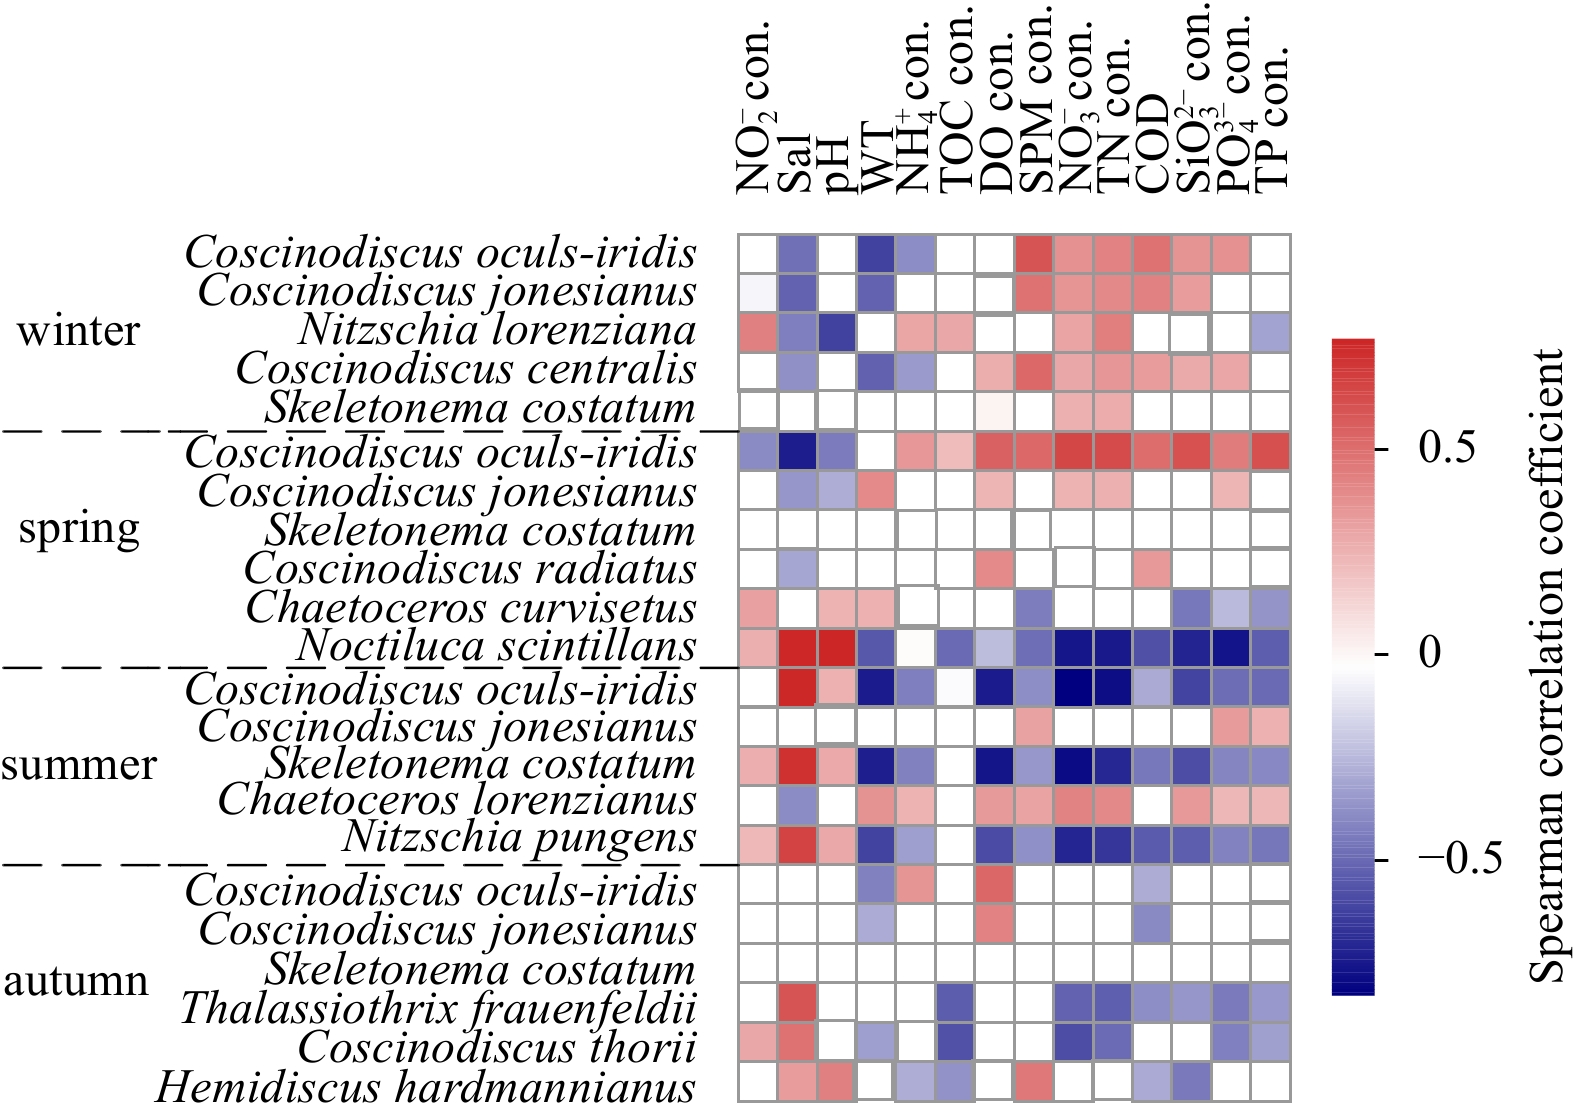
Figure 4. Heat maps illustrated Spearman’s rank correlations between seasonal dominant species and environmental parameters. WT: water temperature; Sal: salinity; TOC: total organic carbon; SPM: suspended particulate matter; TN: total nitrogen; COD: chemical oxygen demand; TP: total phosphorus; con. is the abbrevation of concentration.
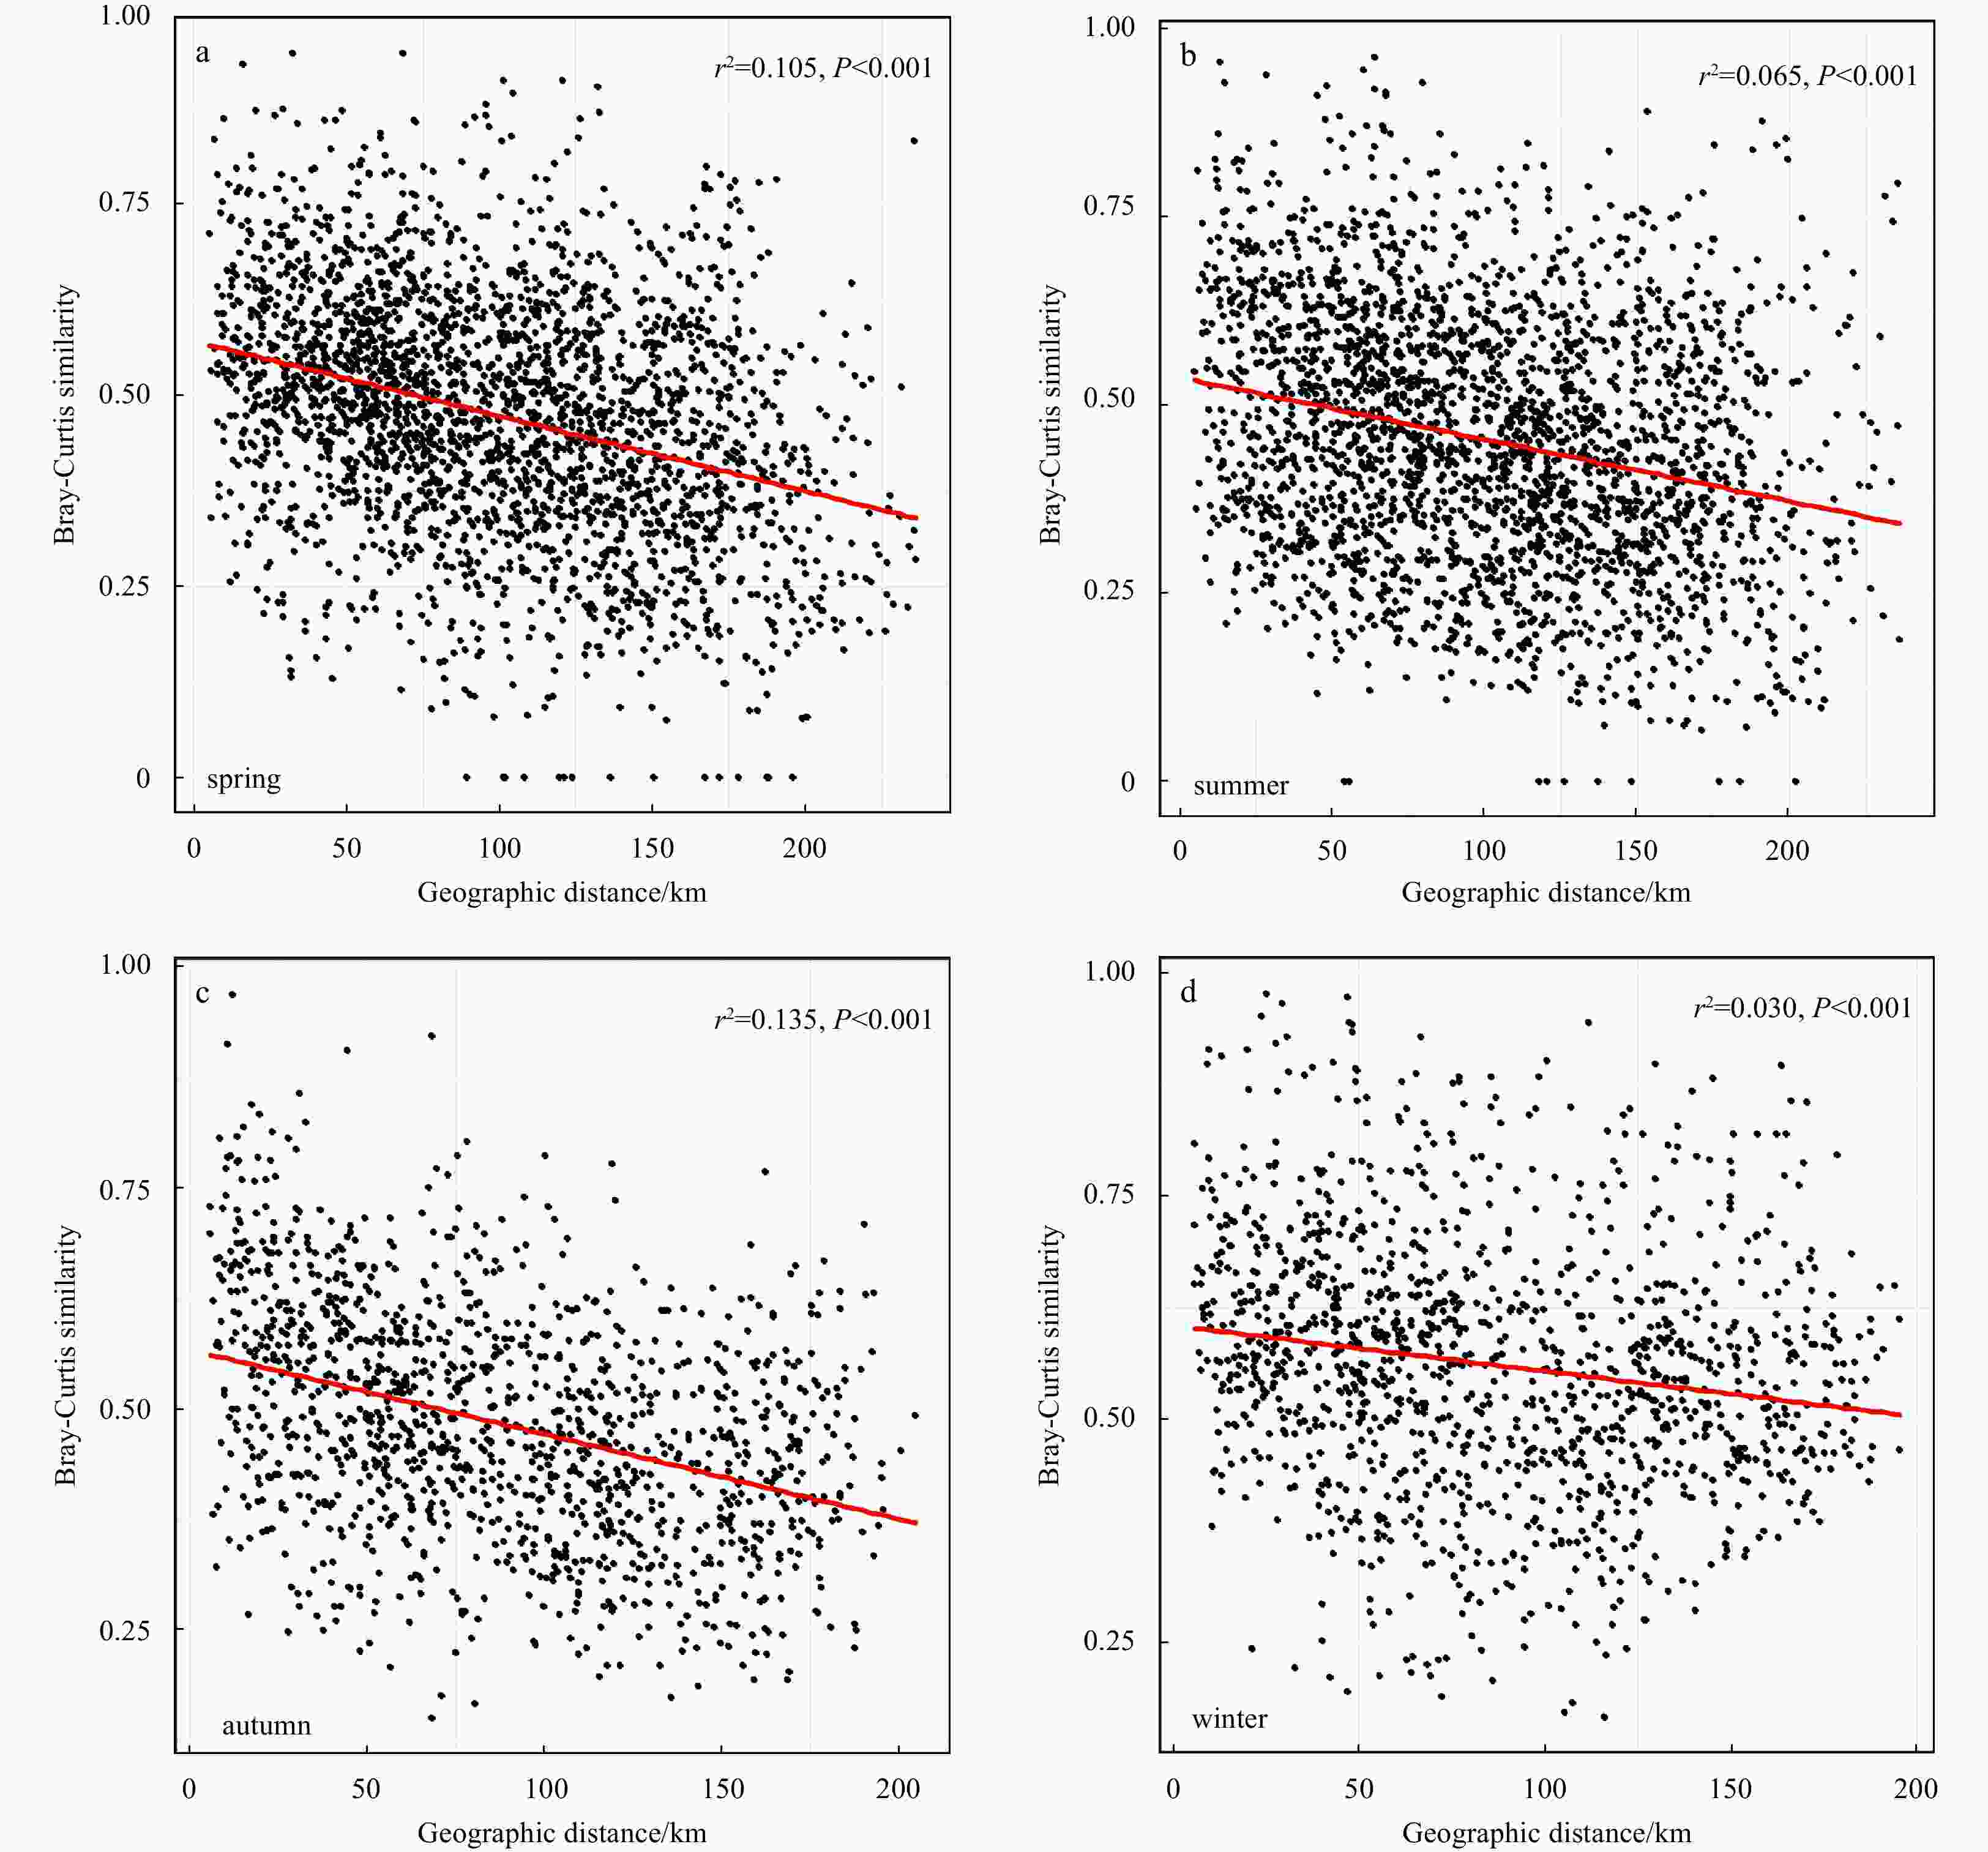
Figure 5. Correlation between the whole community similarity (Bray-Curtis distance) and geographic distance between sampling sites within the four seasons. Red lines represent linear fits.
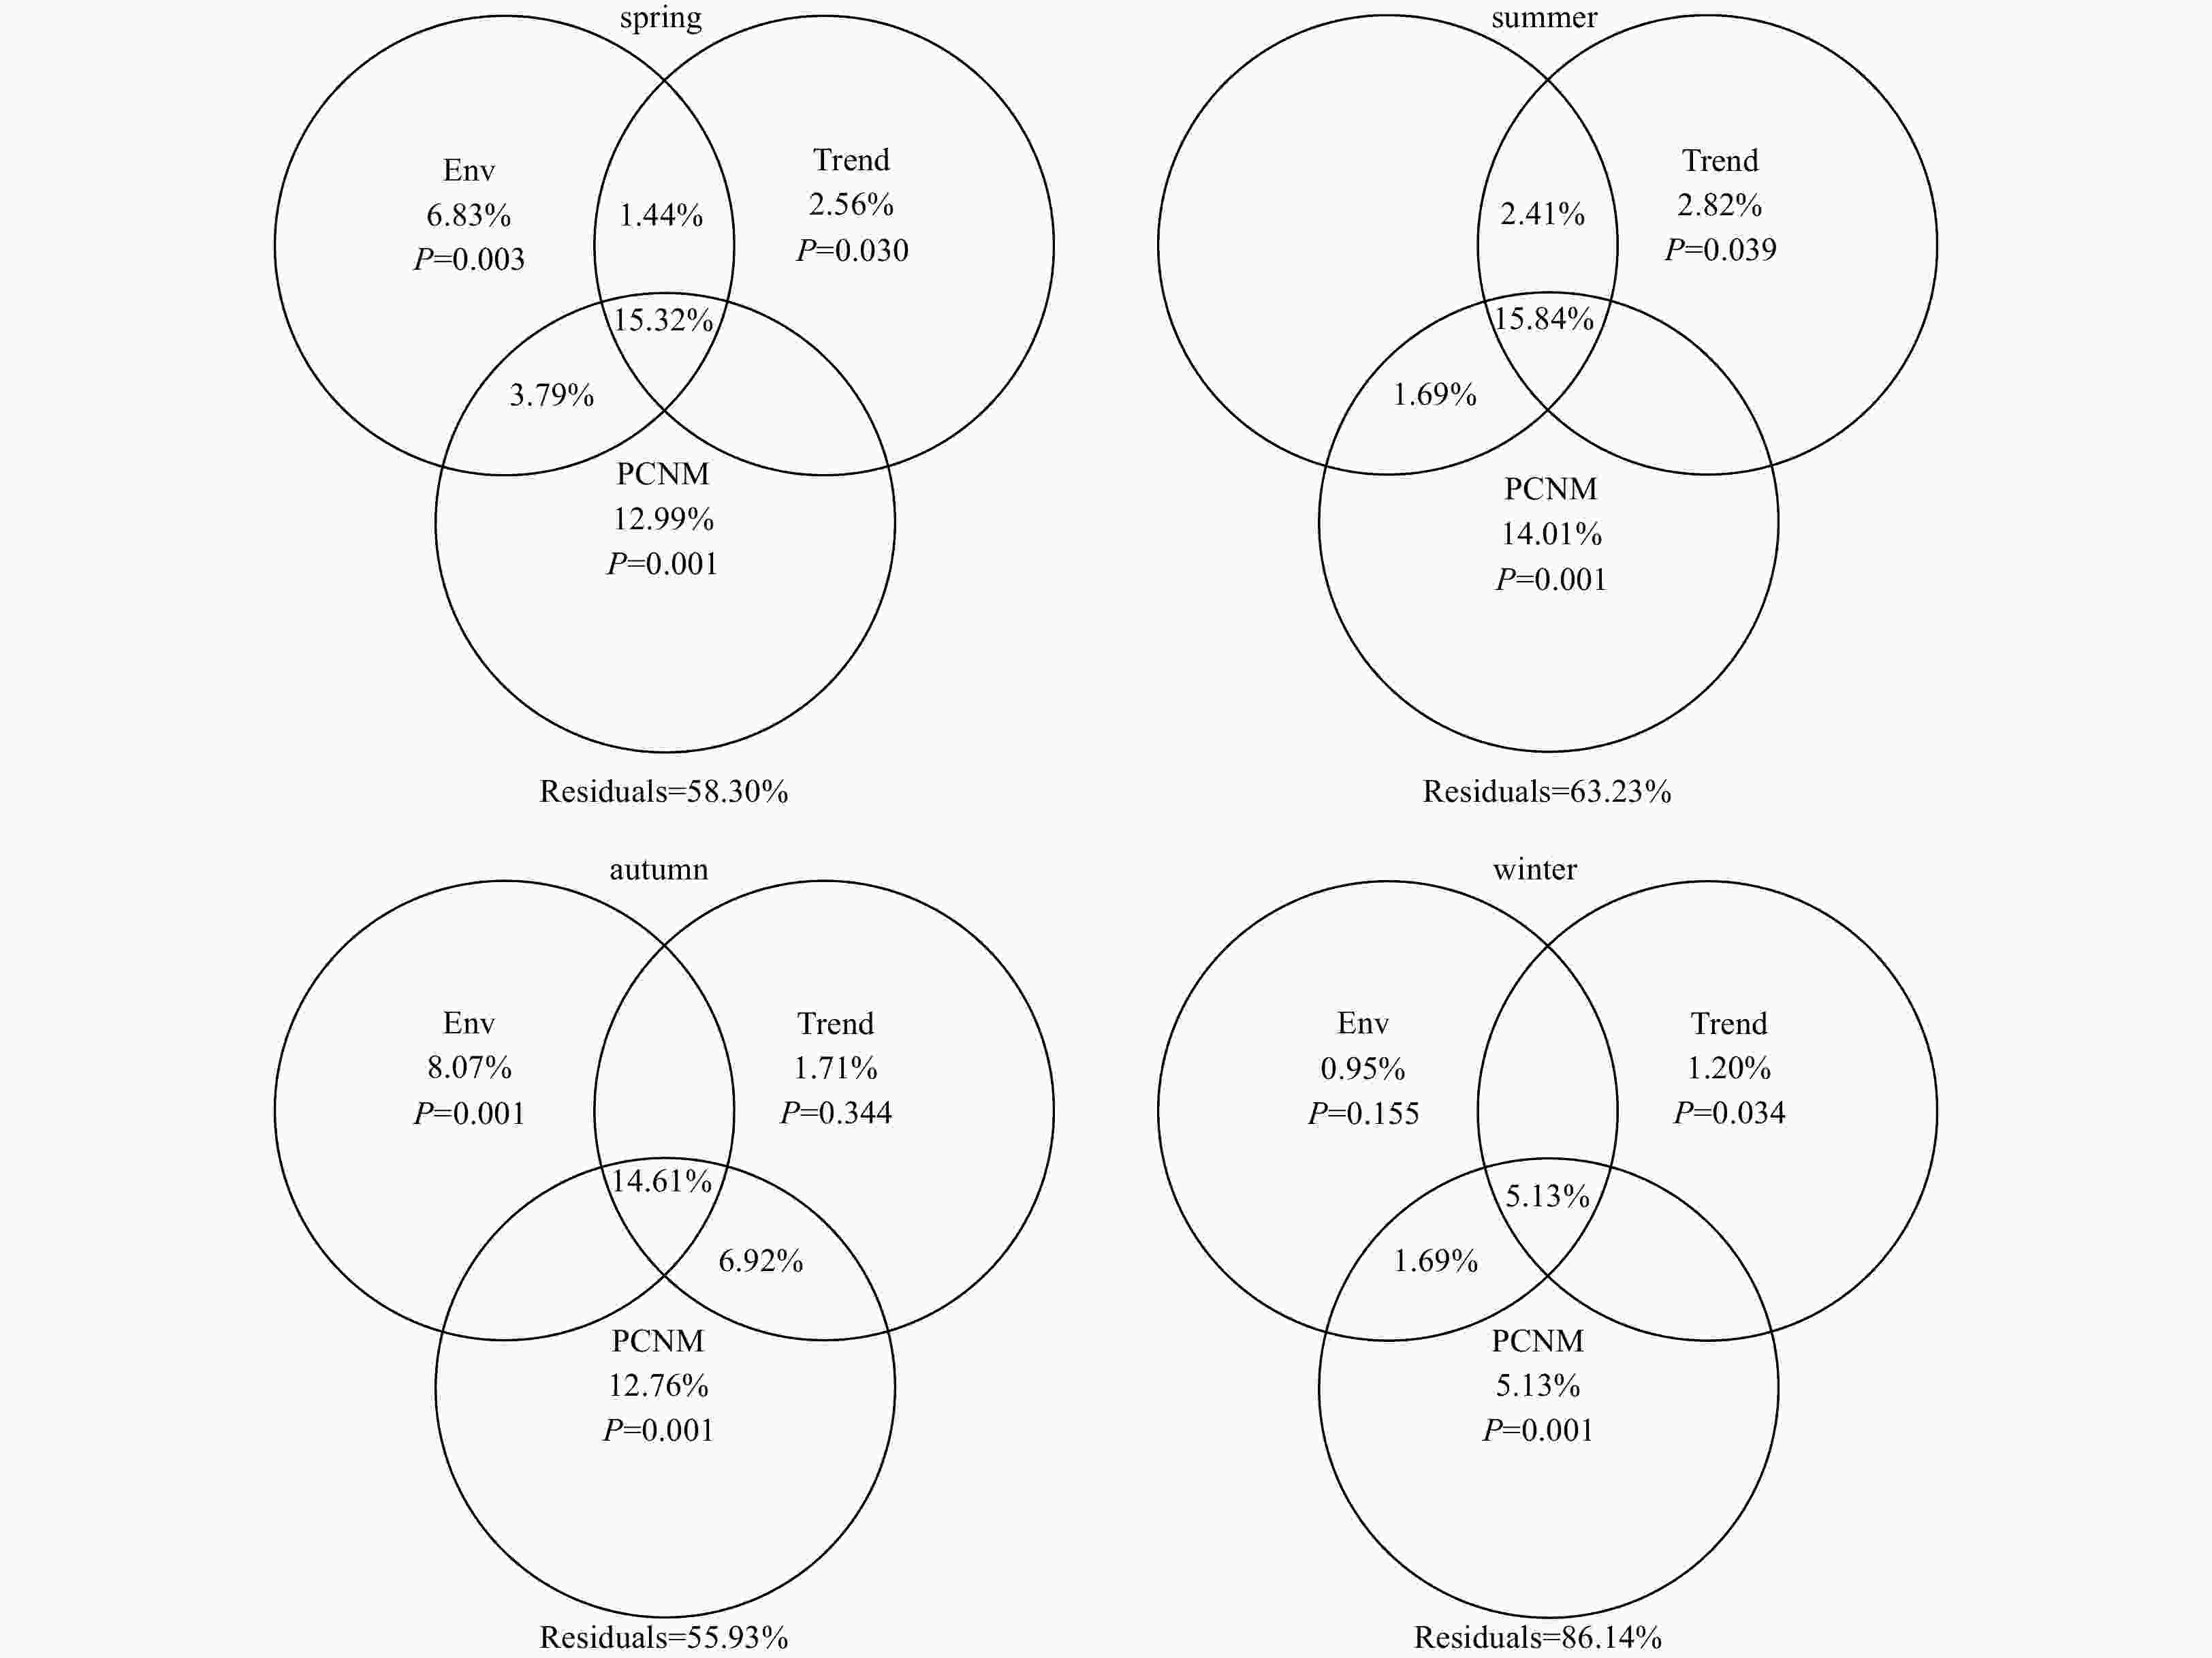
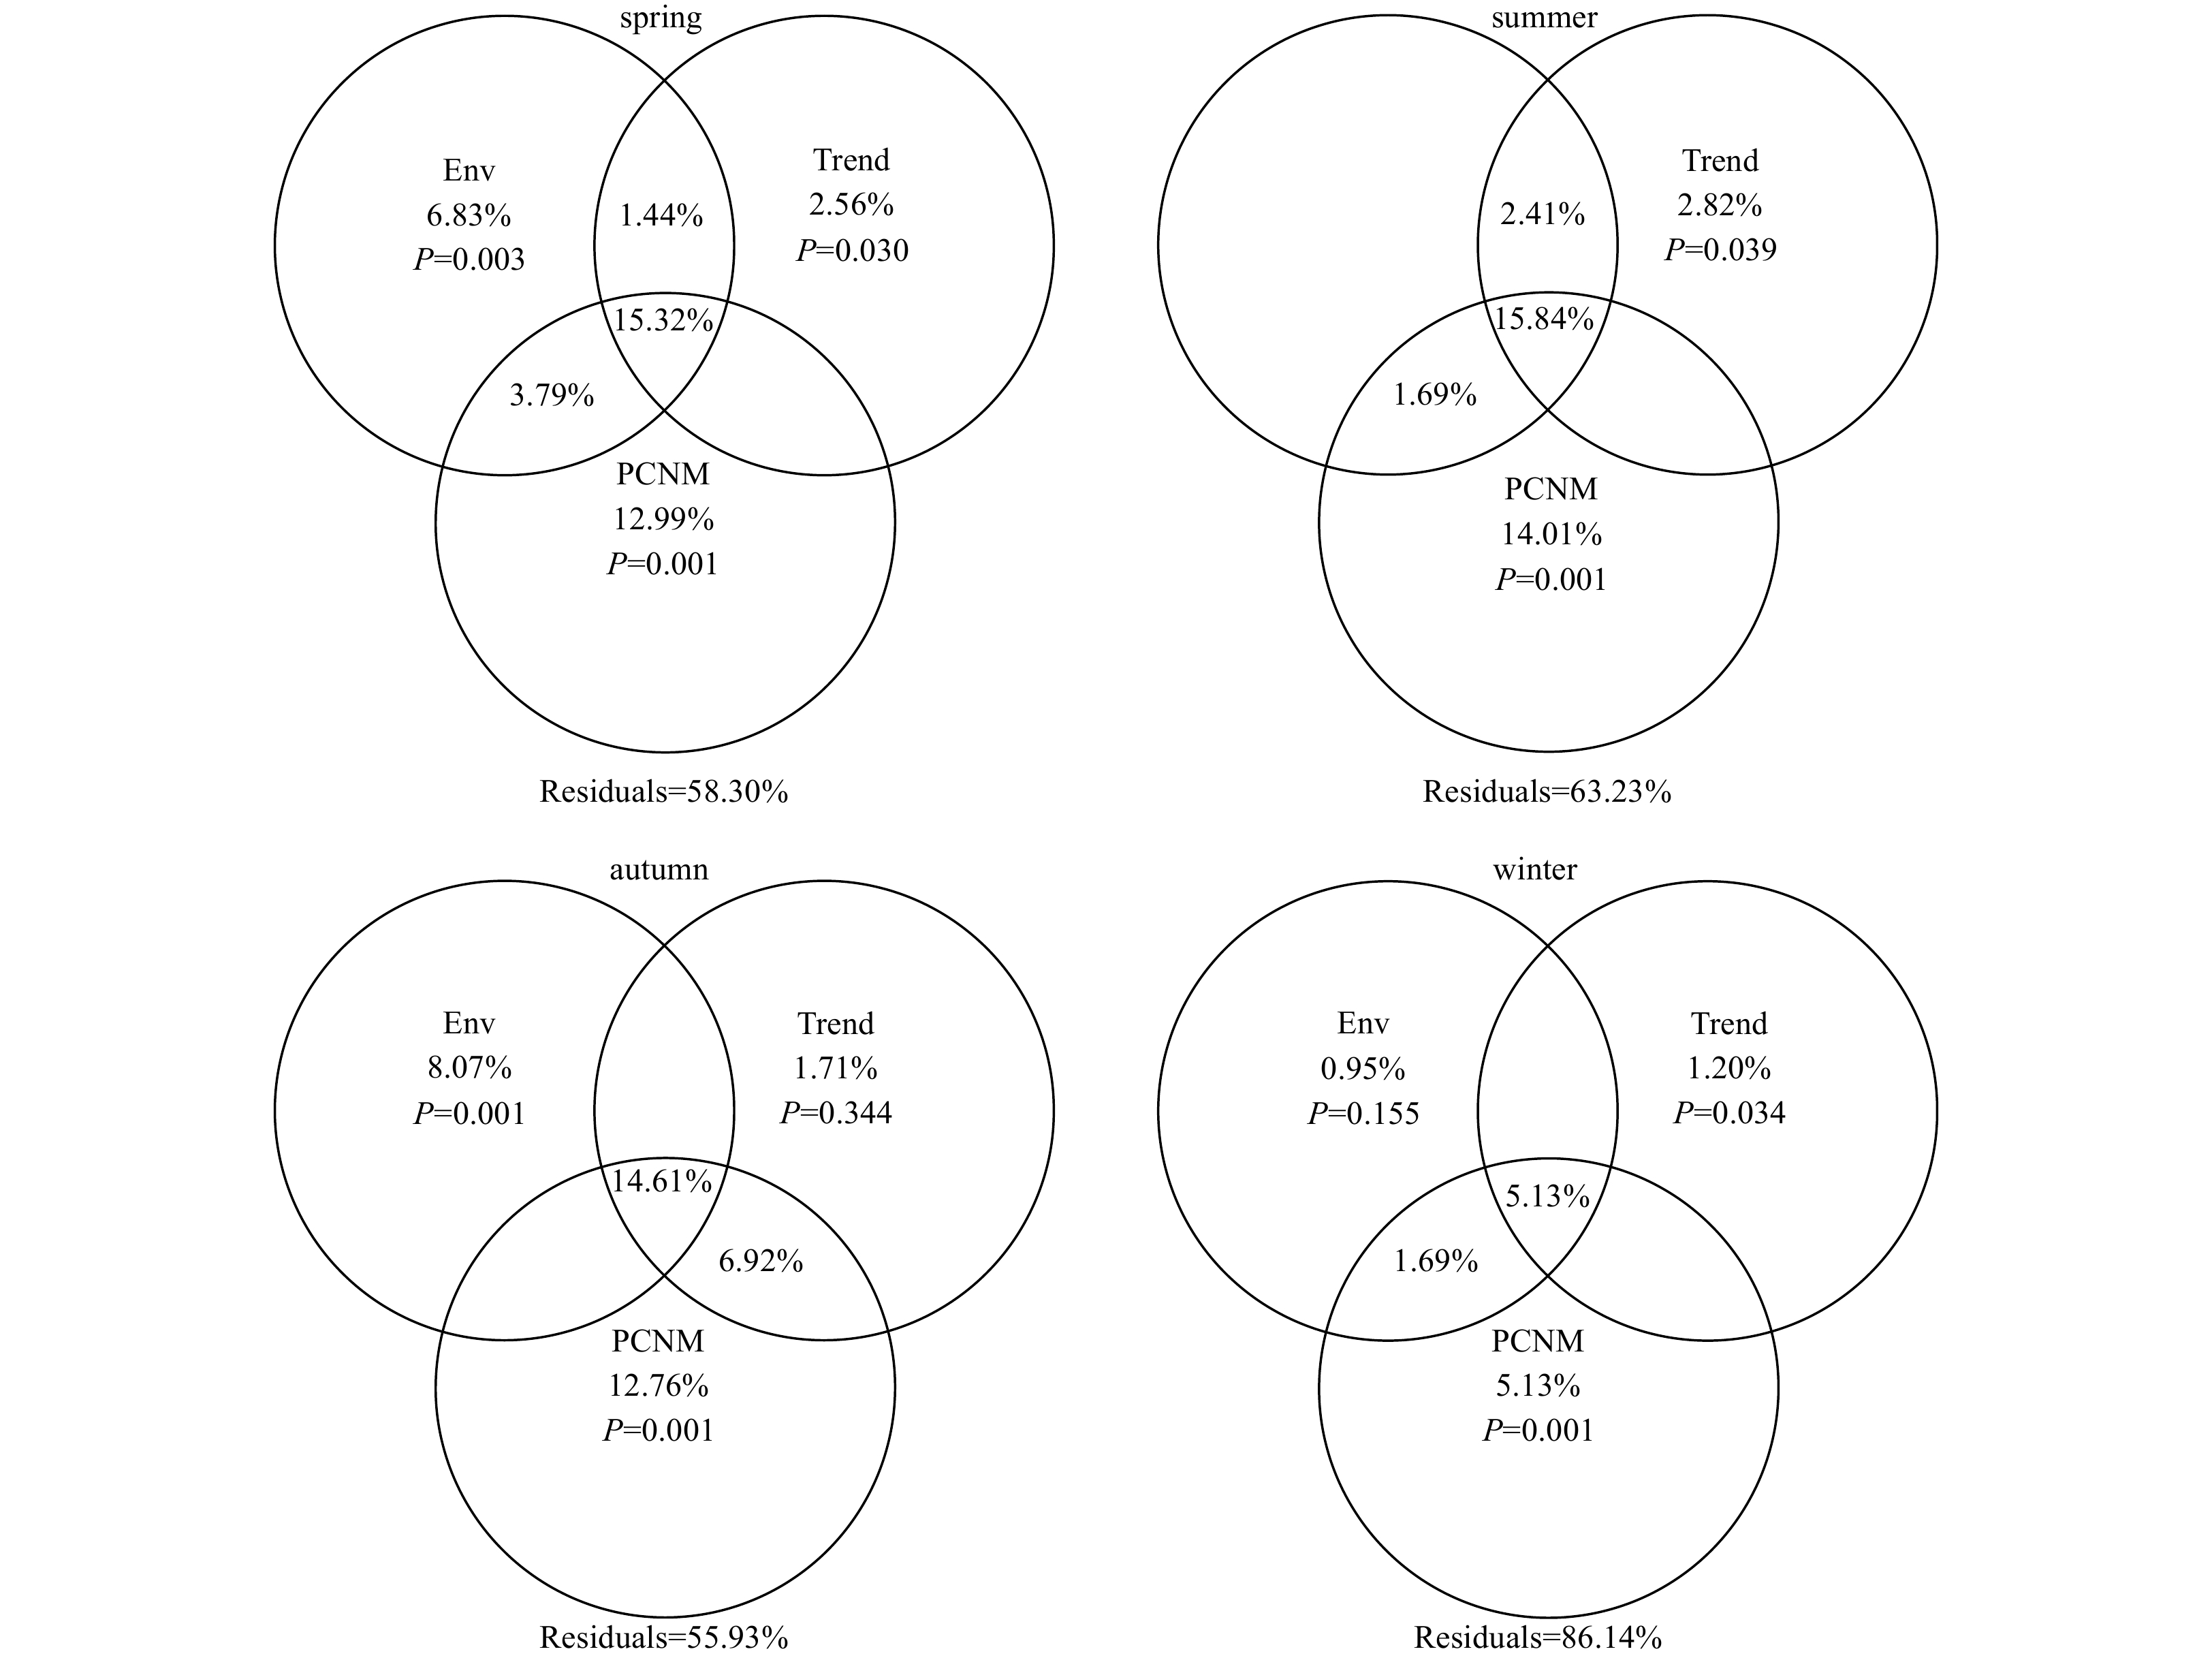
Figure 6. Variation partitioning analysis of the whole species community within each season performed on environmental factors (Env) and spatial factors including linear trend variables (Trend) and principal coordinates of neighbour matrices (PCNM) variables. Values less than 0 were not shown.
Table 1. Distance-based multivariate linear model against seawater chemical variables of the whole community in all the seasons
Marginal tests Variable Pseudo-F P Percent variation explained WT 44.458 0.001 15.24 DO concentration 18.932 0.001 7.09 pH 12.062 0.001 4.64 SPM concentration 11.142 0.001 4.30 $\bf {PO_4^{3-}} $ concentration 6.077 0.001 2.39 COD 5.836 0.001 2.30 TP concentration 3.809 0.001 1.51 Sal 3.728 0.003 1.48 $\bf SiO_3^{2-} $ concentration 3.461 0.003 1.38 TN concentration 3.211 0.002 1.28 $\bf NO^-_3 $ concentration 3.048 0.005 1.21 $\bf NH_4^+ $ concentration 2.930 0.005 1.17 TOC concentration 1.715 0.069 0.69 $\bf NO_2^- $ concentration 1.481 0.136 0.59 Sequential tests Variable Pseudo-F P Cumulative variation explained WT 44.586 0.001 15.24 DO concentration 24.823 0.001 22.98 $\bf {PO_4^{3-}} $ concentration 6.138 0.001 24.85 Sal 3.544 0.001 25.93 $\bf SiO_3^{2-} $ concentration 2.735 0.002 26.75 $\bf NO^-_3 $ concentration 2.565 0.003 27.51 TN concentration 3.077 0.001 28.42 $\bf NH_4^+ $ concentration 2.529 0.007 29.16 pH 2.389 0.009 29.86 TOC concentration 2.258 0.015 30.52 COD 2.075 0.022 31.12 TP concentration 1.805 0.055 31.64 SPM concentration 1.330 0.197 32.02 $\bf NO_2^- $ concentration 0.006 0.762 32.21 Note: Variables in bold referred to statistically significant (P<0.05). WT: water temperature; SPM: suspended particulate matter; COD: chemical oxygen demand; Sal: salinity; TOC: total organic carbon; TN: total nitrogen; TP: total phosphorus; Pseudo-F: Pseudo-F Statistics test value.  下载: 导出CSV
Table 2. Mantel tests showed Spearman’s rank correlations of the whole community in relation to geographic distance within the four seasons
Season Variation source Simple Mantel test Controlled by Partial Mantel test $\rho $ P $\rho $ P Spring Geo 0.326 <0.001 Env 0.331 <0.001 Summer Geo 0.252 <0.001 Env 0.253 <0.001 Autumn Geo 0.370 <0.001 Env 0.373 <0.001 Winter Geo 0.206 <0.001 Env 0.231 <0.001 Note: Geo: geographic distance; Env: environmental factors as a whole; $\rho $: correlation coefficients between pairwise distance of the whole community distance and geographic distance derived from Mantel test with 9 999 permutations.
下载: 导出CSV
-
Anderson M J. 2003. DISTLM forward: a FORTRAN computer program to calculate a distance-based multivariate analysis for a linear model using forward selection [dissertation]. New Zealand: University of Auckland Astorga A, Oksanen J, Luoto M, et al. 2012. Distance decay of similarity in freshwater communities: do macro- and microorganisms follow the same rules?. Global Ecology and Biogeography, 21(3): 365–375 Blanchet F G, Legendre P, Borcard D. 2008. Forward selection of explanatory variables. Ecology, 89(9): 2623–2632. doi: 10.1890/07-0986.1 Borcard D, Legendre P. 2002. All-scale spatial analysis of ecological data by means of principal coordinates of neighbour matrices. Ecological Modelling, 153(1–2): 51–68 Borcard D, Legendre P, Avois-Jacquet C, et al. 2004. Dissecting the spatial structure of ecological data at multiple scales. Ecology, 85(7): 1826–1832. doi: 10.1890/03-3111 Borcard D, Legendre P, Drapeau P. 1992. Partialling out the spatial component of ecological variation. Ecology, 73(3): 1045–1055. doi: 10.2307/1940179 Brewin R J W, Sathyendranath S, Jackson T, et al. 2015. Influence of light in the mixed-layer on the parameters of a three-component model of phytoplankton size class. Remote Sensing of Environment, 168: 437–450. doi: 10.1016/j.rse.2015.07.004 Brunet C, Conversano F, Margiotta F, et al. 2013. Role of light and photophysiological properties on phytoplankton succession during the spring bloom in the north-western Mediterranean Sea. Advances in Oceanography and Limnology, 4(1): 1–19. doi: 10.4081/aiol.2013.5334 Carstensen J, Klais R, Cloern J E. 2015. Phytoplankton blooms in estuarine and coastal waters: seasonal patterns and key species. Estuarine, Coastal and Shelf Science, 162: 98–109 Chase J M, Myers J A. 2011. Disentangling the importance of ecological niches from stochastic processes across scales. Philosophical Transactions of the Royal Society B: Biological Sciences, 366(1576): 2351–2363. doi: 10.1098/rstb.2011.0063 Chust G, Irigoien X, Chave J, et al. 2013. Latitudinal phytoplankton distribution and the neutral theory of biodiversity. Global Ecology and Biogeography, 22(5): 531–543. doi: 10.1111/geb.12016 Cloern J E, Dufford R. 2005. Phytoplankton community ecology: principles applied in San Francisco Bay. Marine Ecology Progress Series, 285: 11–28. doi: 10.3354/meps285011 Conde A, Hurtado M, Prado M. 2018. Phytoplankton response to a weak El Niño event. Ecological Indicators, 95: 394–404. doi: 10.1016/j.ecolind.2018.07.064 Cottenie K. 2005. Integrating environmental and spatial processes in ecological community dynamics. Ecology Letters, 8(11): 1175–1182. doi: 10.1111/j.1461-0248.2005.00820.x Dray S, Legendre P, Peres-Neto P R. 2006. Spatial modelling: a comprehensive framework for principal coordinate analysis of neighbour matrices (PCNM). Ecological Modelling, 196(3–4): 483–493 Dupuis A P, Hann B J. 2009. Warm spring and summer water temperatures in small eutrophic lakes of the Canadian prairies: potential implications for phytoplankton and zooplankton. Journal of Plankton Research, 31(5): 489–502. doi: 10.1093/plankt/fbp001 Field C B, Behrenfeld M J, Randerson J T, et al. 1998. Primary production of the biosphere: integrating terrestrial and oceanic components. Science, 281(5374): 237–240. doi: 10.1126/science.281.5374.237 Fragoso G M, Poulton A J, Yashayaev I M, et al. 2016. Biogeographical patterns and environmental controls of phytoplankton communities from contrasting hydrographical zones of the Labrador Sea. Progress in Oceanography, 141: 212–226. doi: 10.1016/j.pocean.2015.12.007 Gao Shengquan, Yu Guohui, Wang Yuhen. 1993. Distributional features and fluxes of dissolved nitrogen, phosphorus and silicon in the Hangzhou Bay. Marine Chemistry, 43(1–4): 65–81 Gasiūnaitė Z R, Cardoso A C, Heiskanen A S, et al. 2005. Seasonality of coastal phytoplankton in the Baltic Sea: influence of salinity and eutrophication. Estuarine, Coastal and Shelf Science, 65(1–2): 239–252 Harding L W Jr, Mallonee M E, Perry E S, et al. 2016. Variable climatic conditions dominate recent phytoplankton dynamics in Chesapeake Bay. Scientific Reports, 6: 23773. doi: 10.1038/srep23773 Harrison P J, Hu M H, Yang Y P, et al. 1990. Phosphate limitation in estuarine and coastal waters of China. Journal of Experimental Marine Biology and Ecology, 140(1–2): 79–87 Heino J, Melo A S, Siqueira T, et al. 2015. Metacommunity organisation, spatial extent and dispersal in aquatic systems: patterns, processes and prospects. Freshwater Biology, 60(5): 845–869. doi: 10.1111/fwb.12533 Hinga K R. 2002. Effects of pH on coastal marine phytoplankton. Marine Ecology Progress Series, 238: 281–300. doi: 10.3354/meps238281 Horváth Z, Vad C F, Ptacnik R. 2016. Wind dispersal results in a gradient of dispersal limitation and environmental match among discrete aquatic habitats. Ecography, 39(8): 726–732. doi: 10.1111/ecog.01685 Inspection and Quarantine of the People’s Republic of China, Standardization Administration. 2008a. GB 17378.3-2007 The specification for marine monitoring—part 3: sample collection storage and transportation. Beijing: Standards Press of China Inspection and Quarantine of the People’s Republic of China, Standardization Administration. 2008b. GB 17378.4-2007 The specification for marine monitoring—part 4: seawater analysis. Beijing: Standards Press of China Inspection and Quarantine of the People’s Republic of China, Standardization Administration. 2008c. GB 17378.7-2007 The specification for marine monitoring—part 7: ecological survey for offshore pollution and biological monitoring. Beijing: Standards Press of China Jiang Zhibing, Chen Quanzhen, Zeng Jiangning, et al. 2012. Phytoplankton community distribution in relation to environmental parameters in three aquaculture systems in a Chinese subtropical eutrophic bay. Marine Ecology Progress Series, 446: 73–89. doi: 10.3354/meps09499 Jiang Zhibing, Chen Jianfang, Zhou Feng, et al. 2015. Controlling factors of summer phytoplankton community in the Changjiang (Yangtze River) Estuary and adjacent East China Sea shelf. Continental Shelf Research, 101: 71–84. doi: 10.1016/j.csr.2015.04.009 Jiang Zhibing, Liao Yibo, Liu Jingjing, et al. 2013. Effects of fish farming on phytoplankton community under the thermal stress caused by a power plant in a eutrophic, semi-enclosed bay: induce toxic dinoflagellate (Prorocentrum minimum) blooms in cold seasons. Marine Pollution Bulletin, 76(1–2): 315–324 Jiang Zhibing, Liu Jingjing, Chen Jianfang, et al. 2014. Responses of summer phytoplankton community to drastic environmental changes in the Changjiang (Yangtze River) Estuary during the past 50 years. Water Research, 54: 1–11. doi: 10.1016/j.watres.2014.01.032 Keck F, Franc A, Kahlert M. 2018. Disentangling the processes driving the biogeography of freshwater diatoms: a multiscale approach. Journal of Biogeography, 45(7): 1582–1592. doi: 10.1111/jbi.13239 Liebhold M A, Gurevitch J. 2002. Integrating the statistical analysis of spatial data in ecology. Ecography, 25(5): 553–557. doi: 10.1034/j.1600-0587.2002.250505.x Liebhold M A, Holyoak M, Mouquet N, et al. 2004. The metacommunity concept: a framework for multi-scale community ecology. Ecology Letters, 7(7): 601–613. doi: 10.1111/j.1461-0248.2004.00608.x Litchman E, de Tezanos Pinto P, Edwards K F, et al. 2015. Global biogeochemical impacts of phytoplankton: a trait-based perspective. Journal of Ecology, 103(6): 1384–1396. doi: 10.1111/1365-2745.12438 Liu Qiang, Liao Yibo, Shou Lu. 2018. Concentration and potential health risk of heavy metals in seafoods collected from Sanmen Bay and its adjacent areas, China. Marine Pollution Bulletin, 131: 356–364. doi: 10.1016/j.marpolbul.2018.04.041 Macintyre H L, Kana T M, Anning T, et al. 2002. Photoacclimation of photosynthesis irradiance response curves and photosynthetic pigments in microalgae and cyanobacteria. Journal of Phycology, 38(1): 17–38. doi: 10.1046/j.1529-8817.2002.00094.x Maloney K O, Munguia P. 2011. Distance decay of similarity in temperate aquatic communities: effects of environmental transition zones, distance measure, and life histories. Ecography, 34(2): 287–295. doi: 10.1111/j.1600-0587.2010.06518.x Martiny J B H, Bohannan B J M, Brown J H, et al. 2006. Microbial biogeography: putting microorganisms on the map. Nature Reviews Microbiology, 4(2): 102–112. doi: 10.1038/nrmicro1341 McQuoid M R. 2005. Influence of salinity on seasonal germination of resting stages and composition of microplankton on the Swedish west coast. Marine Ecology Progress Series, 289: 151–163. doi: 10.3354/meps289151 Moritz C, Meynard C N, Devictor V, et al. 2013. Disentangling the role of connectivity, environmental filtering, and spatial structure on metacommunity dynamics. Oikos, 122(10): 1401–1410 Mousing E A, Richardson K, Bendtsen J, et al. 2016. Evidence of small-scale spatial structuring of phytoplankton alpha- and beta-diversity in the open ocean. Journal of Ecology, 104(6): 1682–1695. doi: 10.1111/1365-2745.12634 Peres-Neto P R, Legendre P, Dray S, et al. 2006. Variation partitioning of species data matrices: estimation and comparison of fractions. Ecology, 87(10): 2614–2625. doi: 10.1890/0012-9658(2006)87[2614:VPOSDM]2.0.CO;2 Philippart C J M, Cadee G C, van Raaphorst W, et al. 2000. Long-term phytoplankton-nutrient interactions in a shallow coastal sea: algal community structure, nutrient budgets, and denitrification potential. Limnology and Oceanography, 45(1): 131–144. doi: 10.4319/lo.2000.45.1.0131 Polikarpov I, Saburova M, Al-Yamani F. 2016. Diversity and distribution of winter phytoplankton in the Arabian Gulf and the Sea of Oman. Continental Shelf Research, 119: 85–99. doi: 10.1016/j.csr.2016.03.009 Reed M L, Pinckney J L, Keppler C J, et al. 2016. The influence of nitrogen and phosphorus on phytoplankton growth and assemblage composition in four coastal, southeastern USA systems. Estuarine, Coastal and Shelf Science, 177: 71–82 Ribeiro K F, da Rocha C M, de Castro D, et al. 2018. Distribution and coexistence patterns of phytoplankton in subtropical shallow lakes and the role of niche-based and spatial processes. Hydrobiologia, 814(1): 233–246. doi: 10.1007/s10750-018-3539-6 Roelke D L, Gable G M, Valenti T W, et al. 2010. Hydraulic flushing as a Prymnesium parvum bloom-terminating mechanism in a subtropical lake. Harmful Algae, 9(3): 323–332. doi: 10.1016/j.hal.2009.12.003 Rothenberger M B, Burkholder J M, Wentworth T R. 2009. Use of long-term data and multivariate ordination techniques to identify environmental factors governing estuarine phytoplankton species dynamics. Limnology and Oceanography, 54(6): 2107–2127. doi: 10.4319/lo.2009.54.6.2107 Shannon C E, Weaver V. 1949. The Mathematical Theory of Communication. Urbana: University of Illinois Press, 1–25 Shi Tuo, Kong Jie, Liu Ping, et al. 2000. Nutrient limitation of phytoplankton in the Changjiang Estuary—1. Condition of nutrient limitation in autumn. Haiyang Xuebao (in Chinese), 22(4): 60–66 Soininen J. 2012. Macroecology of unicellular organisms-patterns and processes. Environmental Microbiology Reports, 4(1): 10–22. doi: 10.1111/j.1758-2229.2011.00308.x Soininen J, Jamoneau A, Rosebery J, et al. 2016. Global patterns and drivers of species and trait composition in diatoms. Global Ecology and biogeography, 25(8): 940–950. doi: 10.1111/geb.12452 Vilmi A, Karjalainen S M, Hellsten S, et al. 2016. Bioassessment in a metacommunity context: are diatom communities structured solely by species sorting?. Ecological Indicators, 62: 86–94 Wang Kai, Ye Xiansen, Chen Heping, et al. 2015. Bacterial biogeography in the coastal waters of northern Zhejiang, East China Sea is highly controlled by spatially structured environmental gradients. Environmental Microbiology, 17(10): 3898–3913. doi: 10.1111/1462-2920.12884 Yang Yang, Niu Haiyu, Xiao Lijuan, et al. 2018a. Spatial heterogeneity of spring phytoplankton in a large tropical reservoir: could mass effect homogenize the heterogeneity by species sorting?. Hydrobiologia, 819(1): 109–122 Yang Wen, Zheng Zhongming, Zheng Cheng, et al. 2018b. Temporal variations in a phytoplankton community in a subtropical reservoir: an interplay of extrinsic and intrinsic community effects. Science of the Total Environment, 612: 720–727. doi: 10.1016/j.scitotenv.2017.08.044 Ye Ran, Liu Lian, Wang Qiong, et al. 2017. Identification of coastal water quality by multivariate statistical techniques in two typical bays of northern Zhejiang Province, East China Sea. Acta Oceanologica Sinica, 36(2): 1–10. doi: 10.1007/s13131-017-0981-7 Zhang Min, Chen Feizhou, Shi Xiaoli, et al. 2018a. Association between temporal and spatial beta diversity in phytoplankton. Ecography, 41(8): 1345–1356. doi: 10.1111/ecog.03340 Zhang Huajun, Hang Xiaolin, Huang Lei, et al. 2018b. Microeukaryotic biogeography in the typical subtropical coastal waters with multiple environmental gradients. Science of the Total Environment, 635: 618–628. doi: 10.1016/j.scitotenv.2018.04.142 Zhou Mingjiang, Shen Zhiliang, Yu Rencheng. 2008. Responses of a coastal phytoplankton community to increased nutrient input from the Changjiang (Yangtze) River. Continental Shelf Research, 28(12): 1483–1489. doi: 10.1016/j.csr.2007.02.009 -


 点击查看大图

计量
- 文章访问数: 279
- HTML全文浏览量: 96
- PDF下载量: 12
- 被引次数: 0

