Detection and characteristics analysis of the western subarctic front using the high-resolution SST product
-
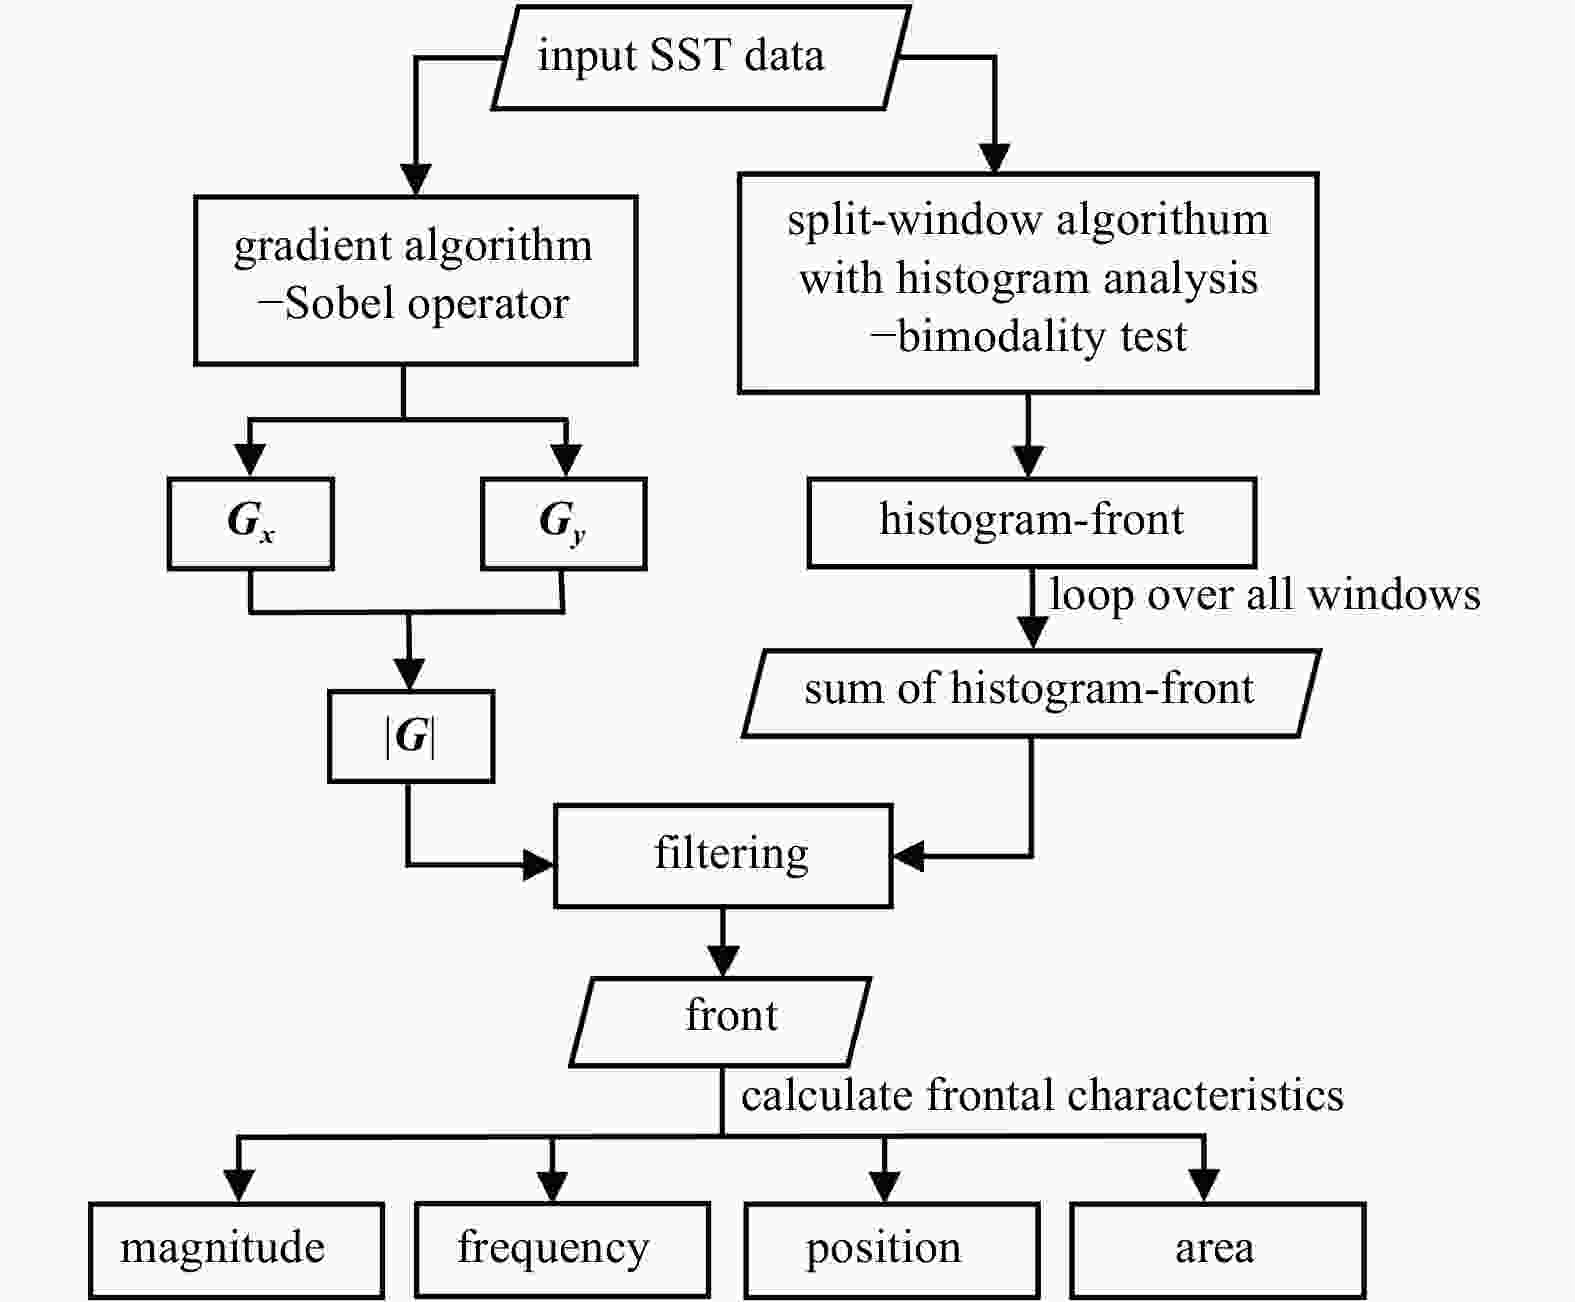
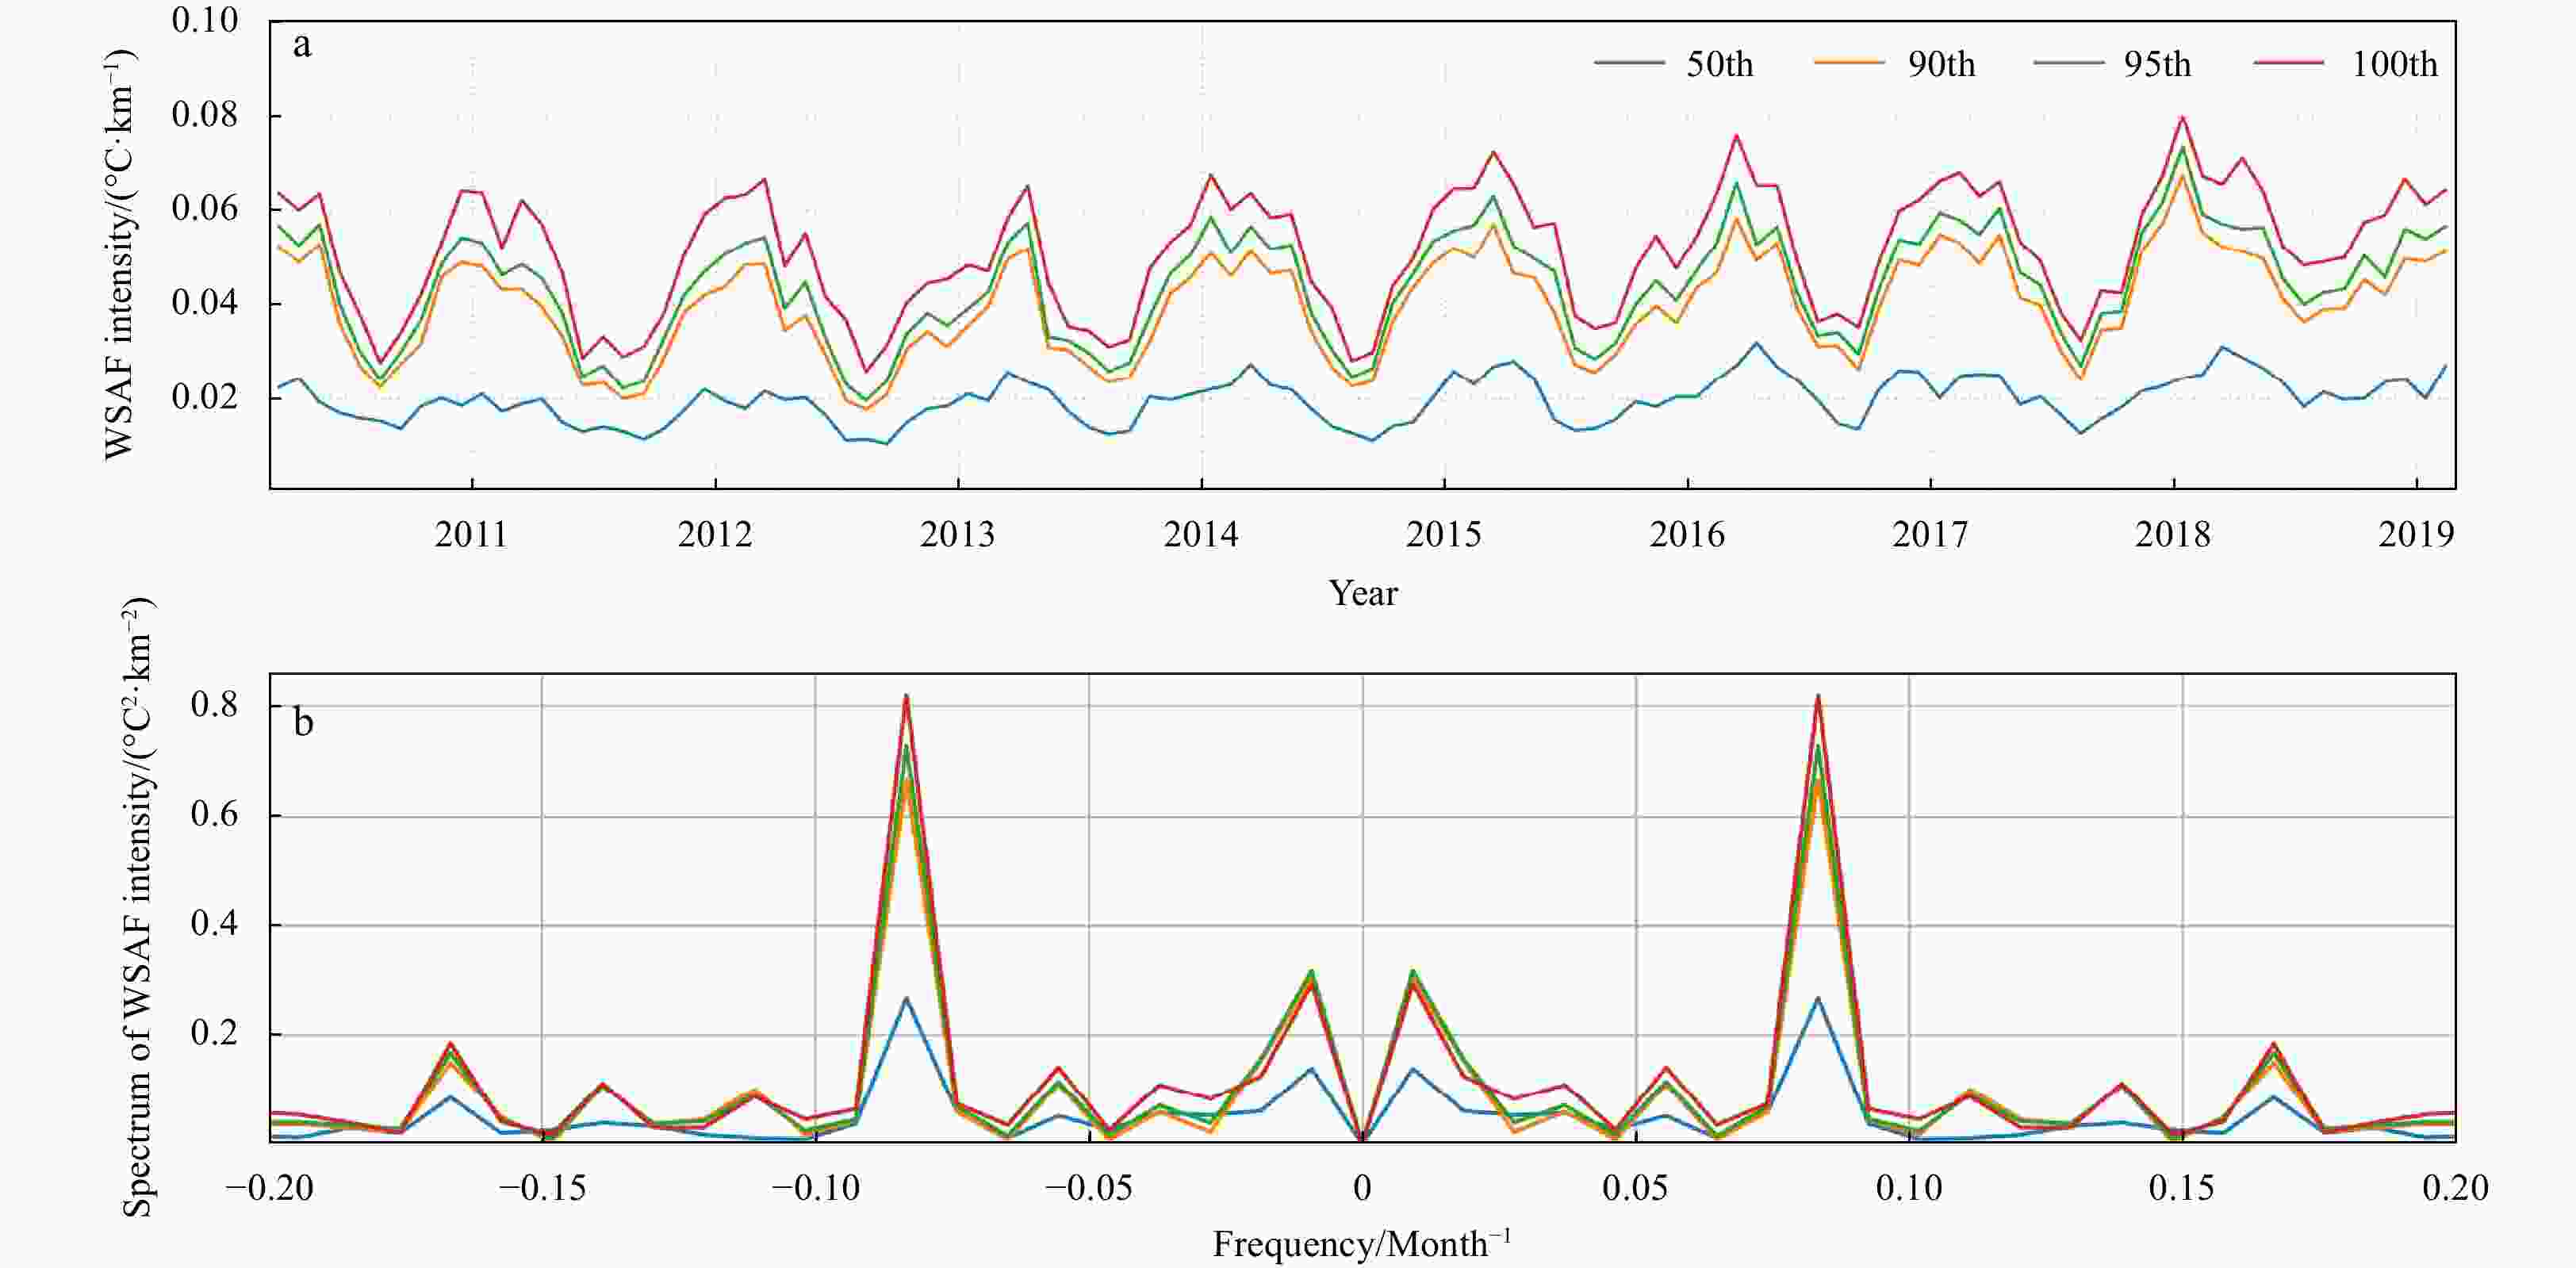
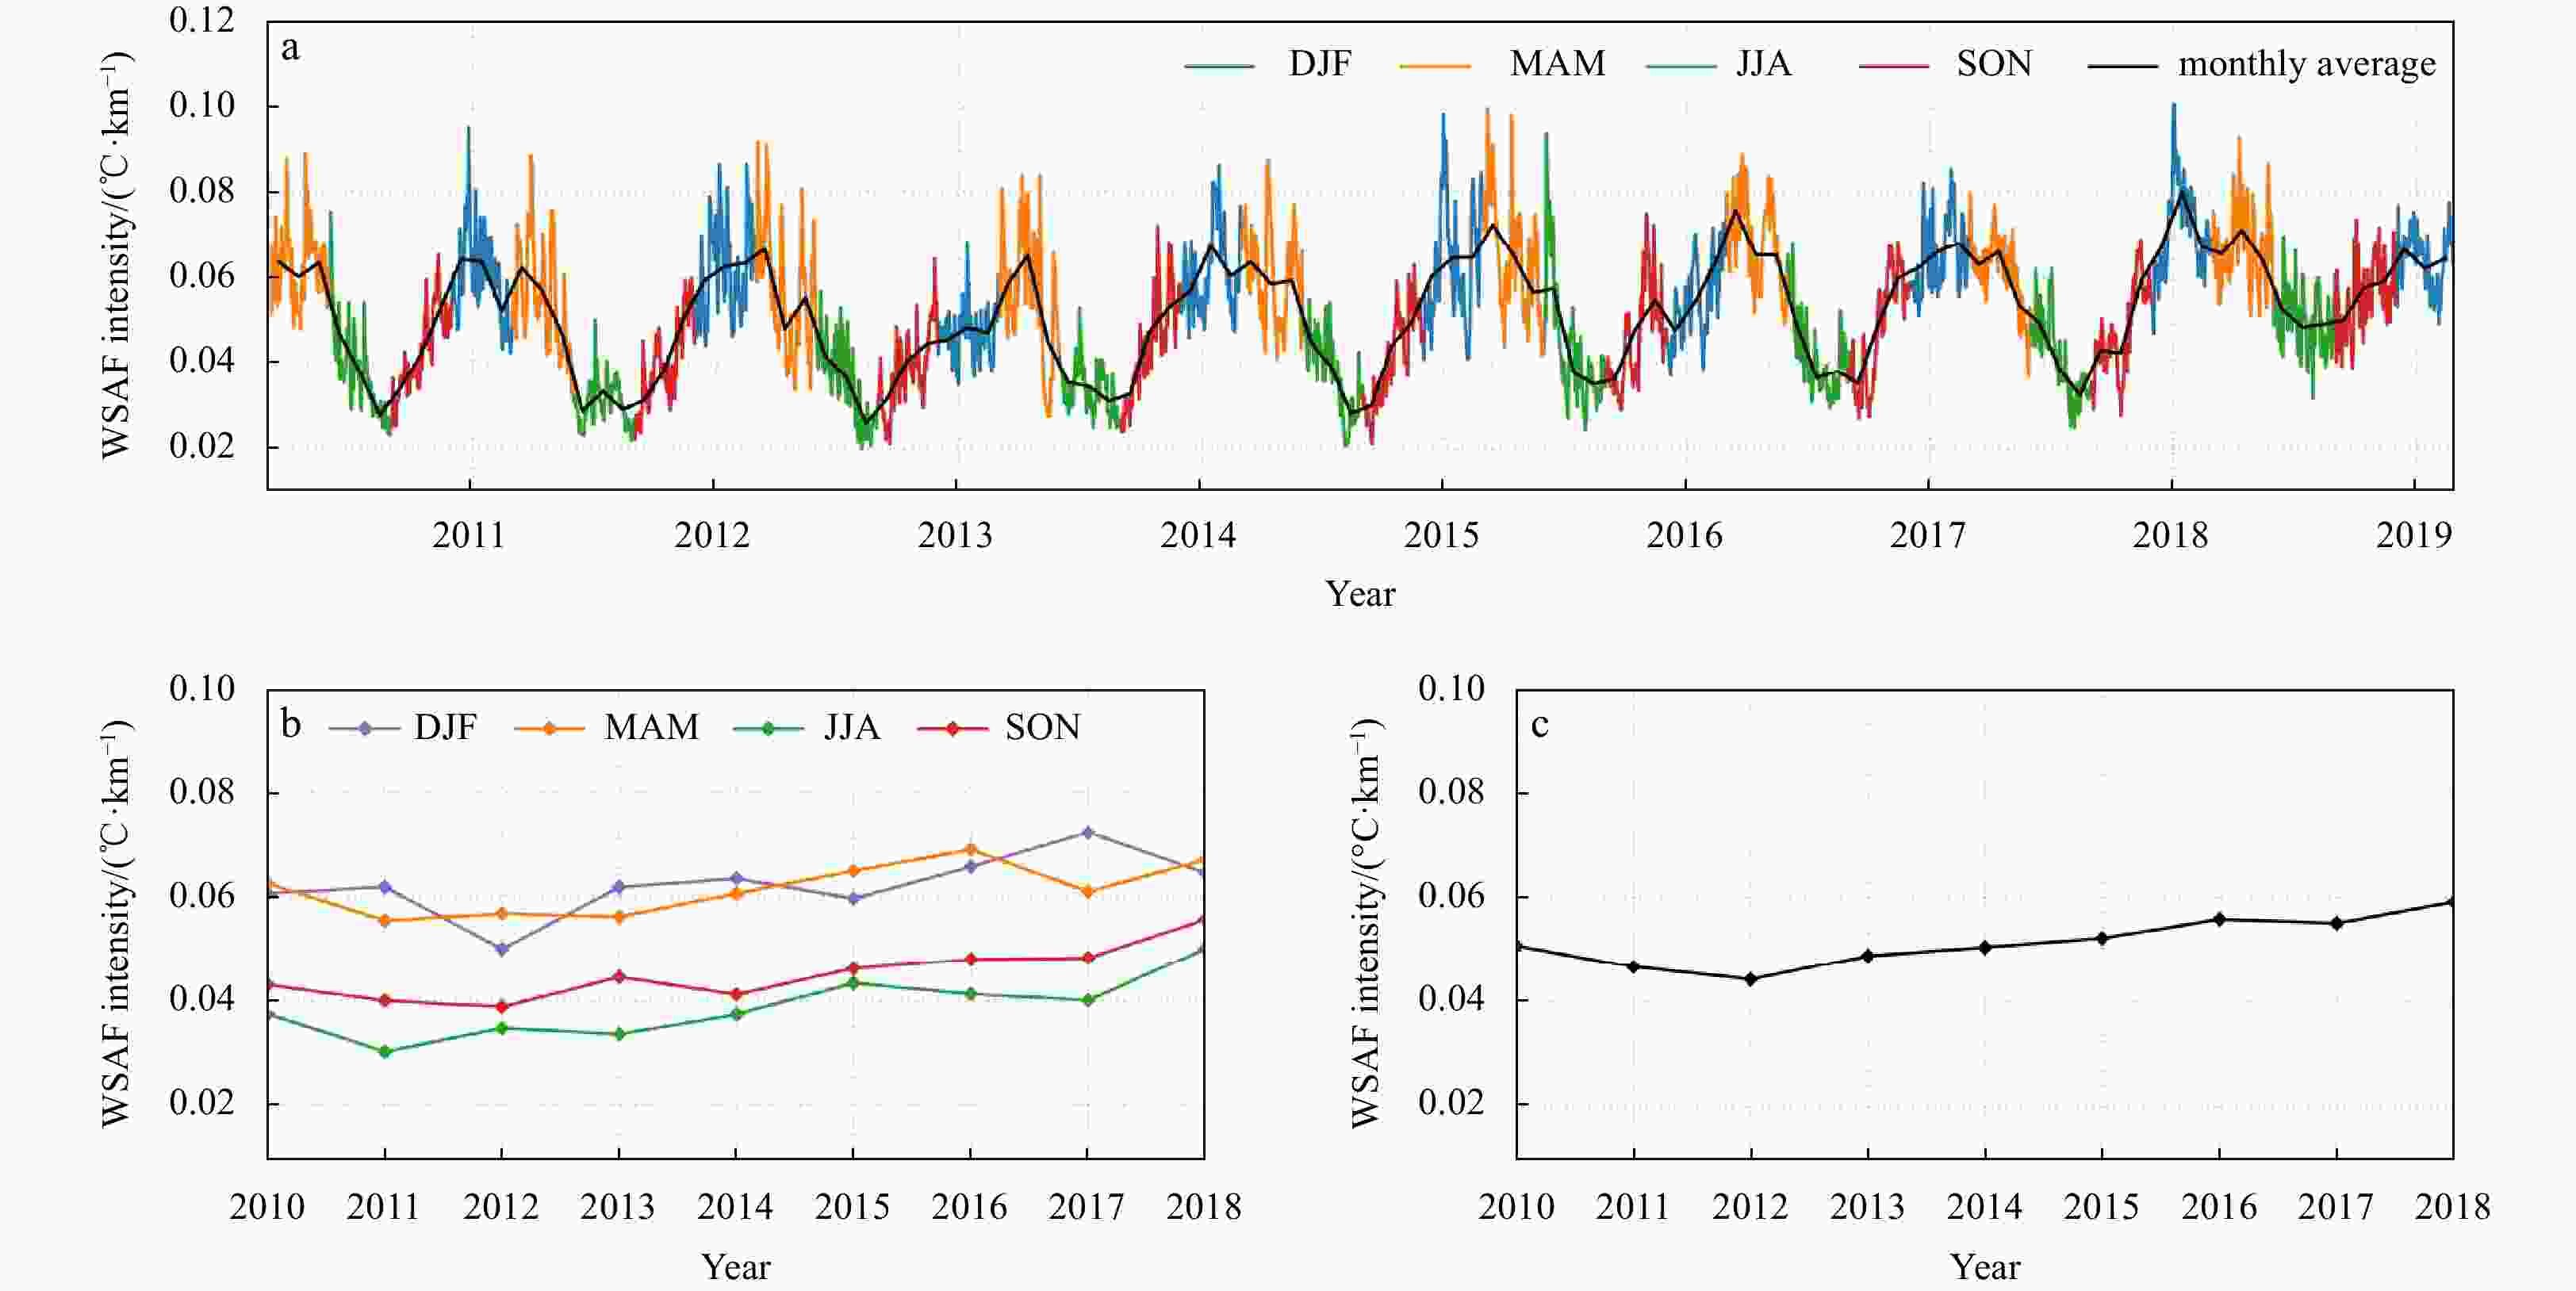
Abstract: Oceanic front plays a significant role in the ocean vertical mixing and the regulation of air-sea interaction, among others. The western branch of the subarctic front (WSAF) located in the Northwest Pacific has attained lots of attention given its strong intensity and widespread influence on this region. In this study, we take advantage of the merged sea surface temperature (SST) at a high spatial resolution of 0.05° to investigate the characteristics of WSAF. The front detection algorithm that combines the Sobel operator and histogram analysis is adopted. It is advantageous in both preserving the front intensity represented by the SST gradient as well as reducing the detection noise level. We systematically applied this algorithm to the daily SST products for front detection, based on which the WSAF characteristics including its intensity, occurrence of frequency, latitudinal position and coverage area are then extracted. WSAF is mostly located within a small latitude range between 40°N and 41°N with a clear seasonal trend in its intensity that peaks in the winter and troughs in the summer. The seasonal variation of WSAF intensity is almost consistent throughout the temporal period of interest from 2010 to 2018. Similar seasonality is observed for its occurrence of frequency with the winter-summer contrast reaching up to 5%. The findings presented here shall help better interpret the WSAF characteristics in the long-term run as well as their impact on the regional weather and climate patterns at high spatial resolution.
-
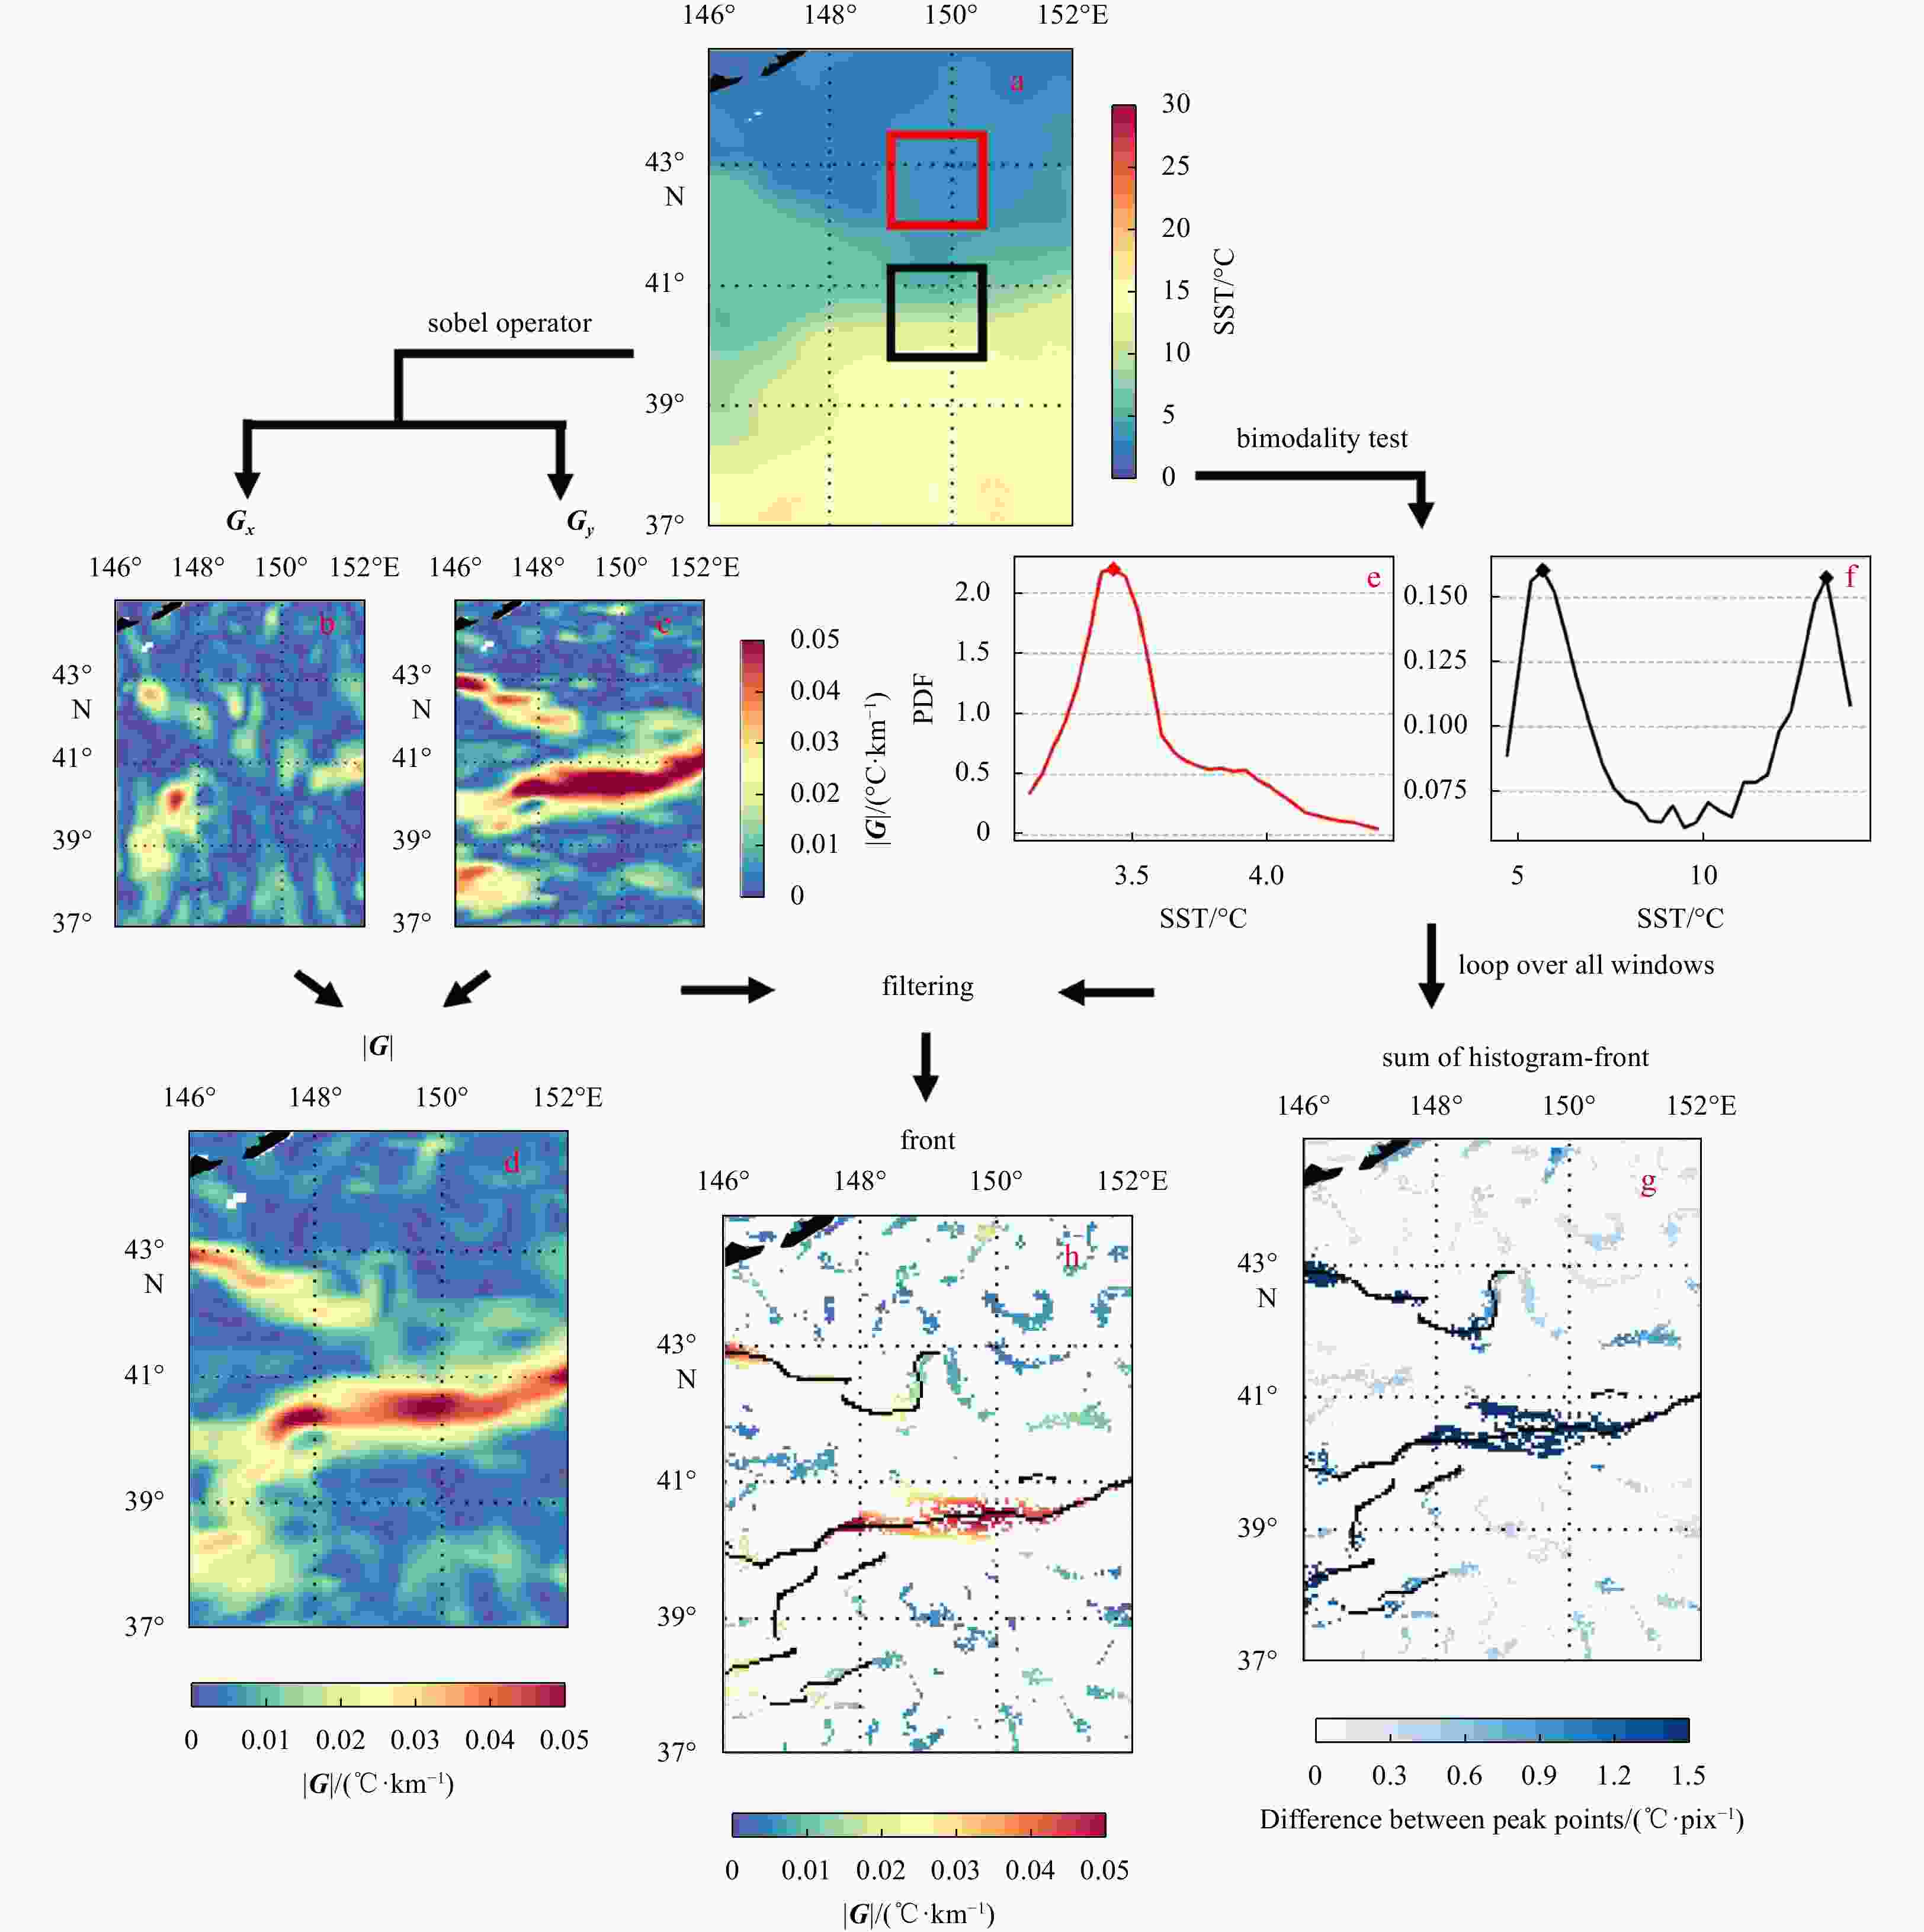
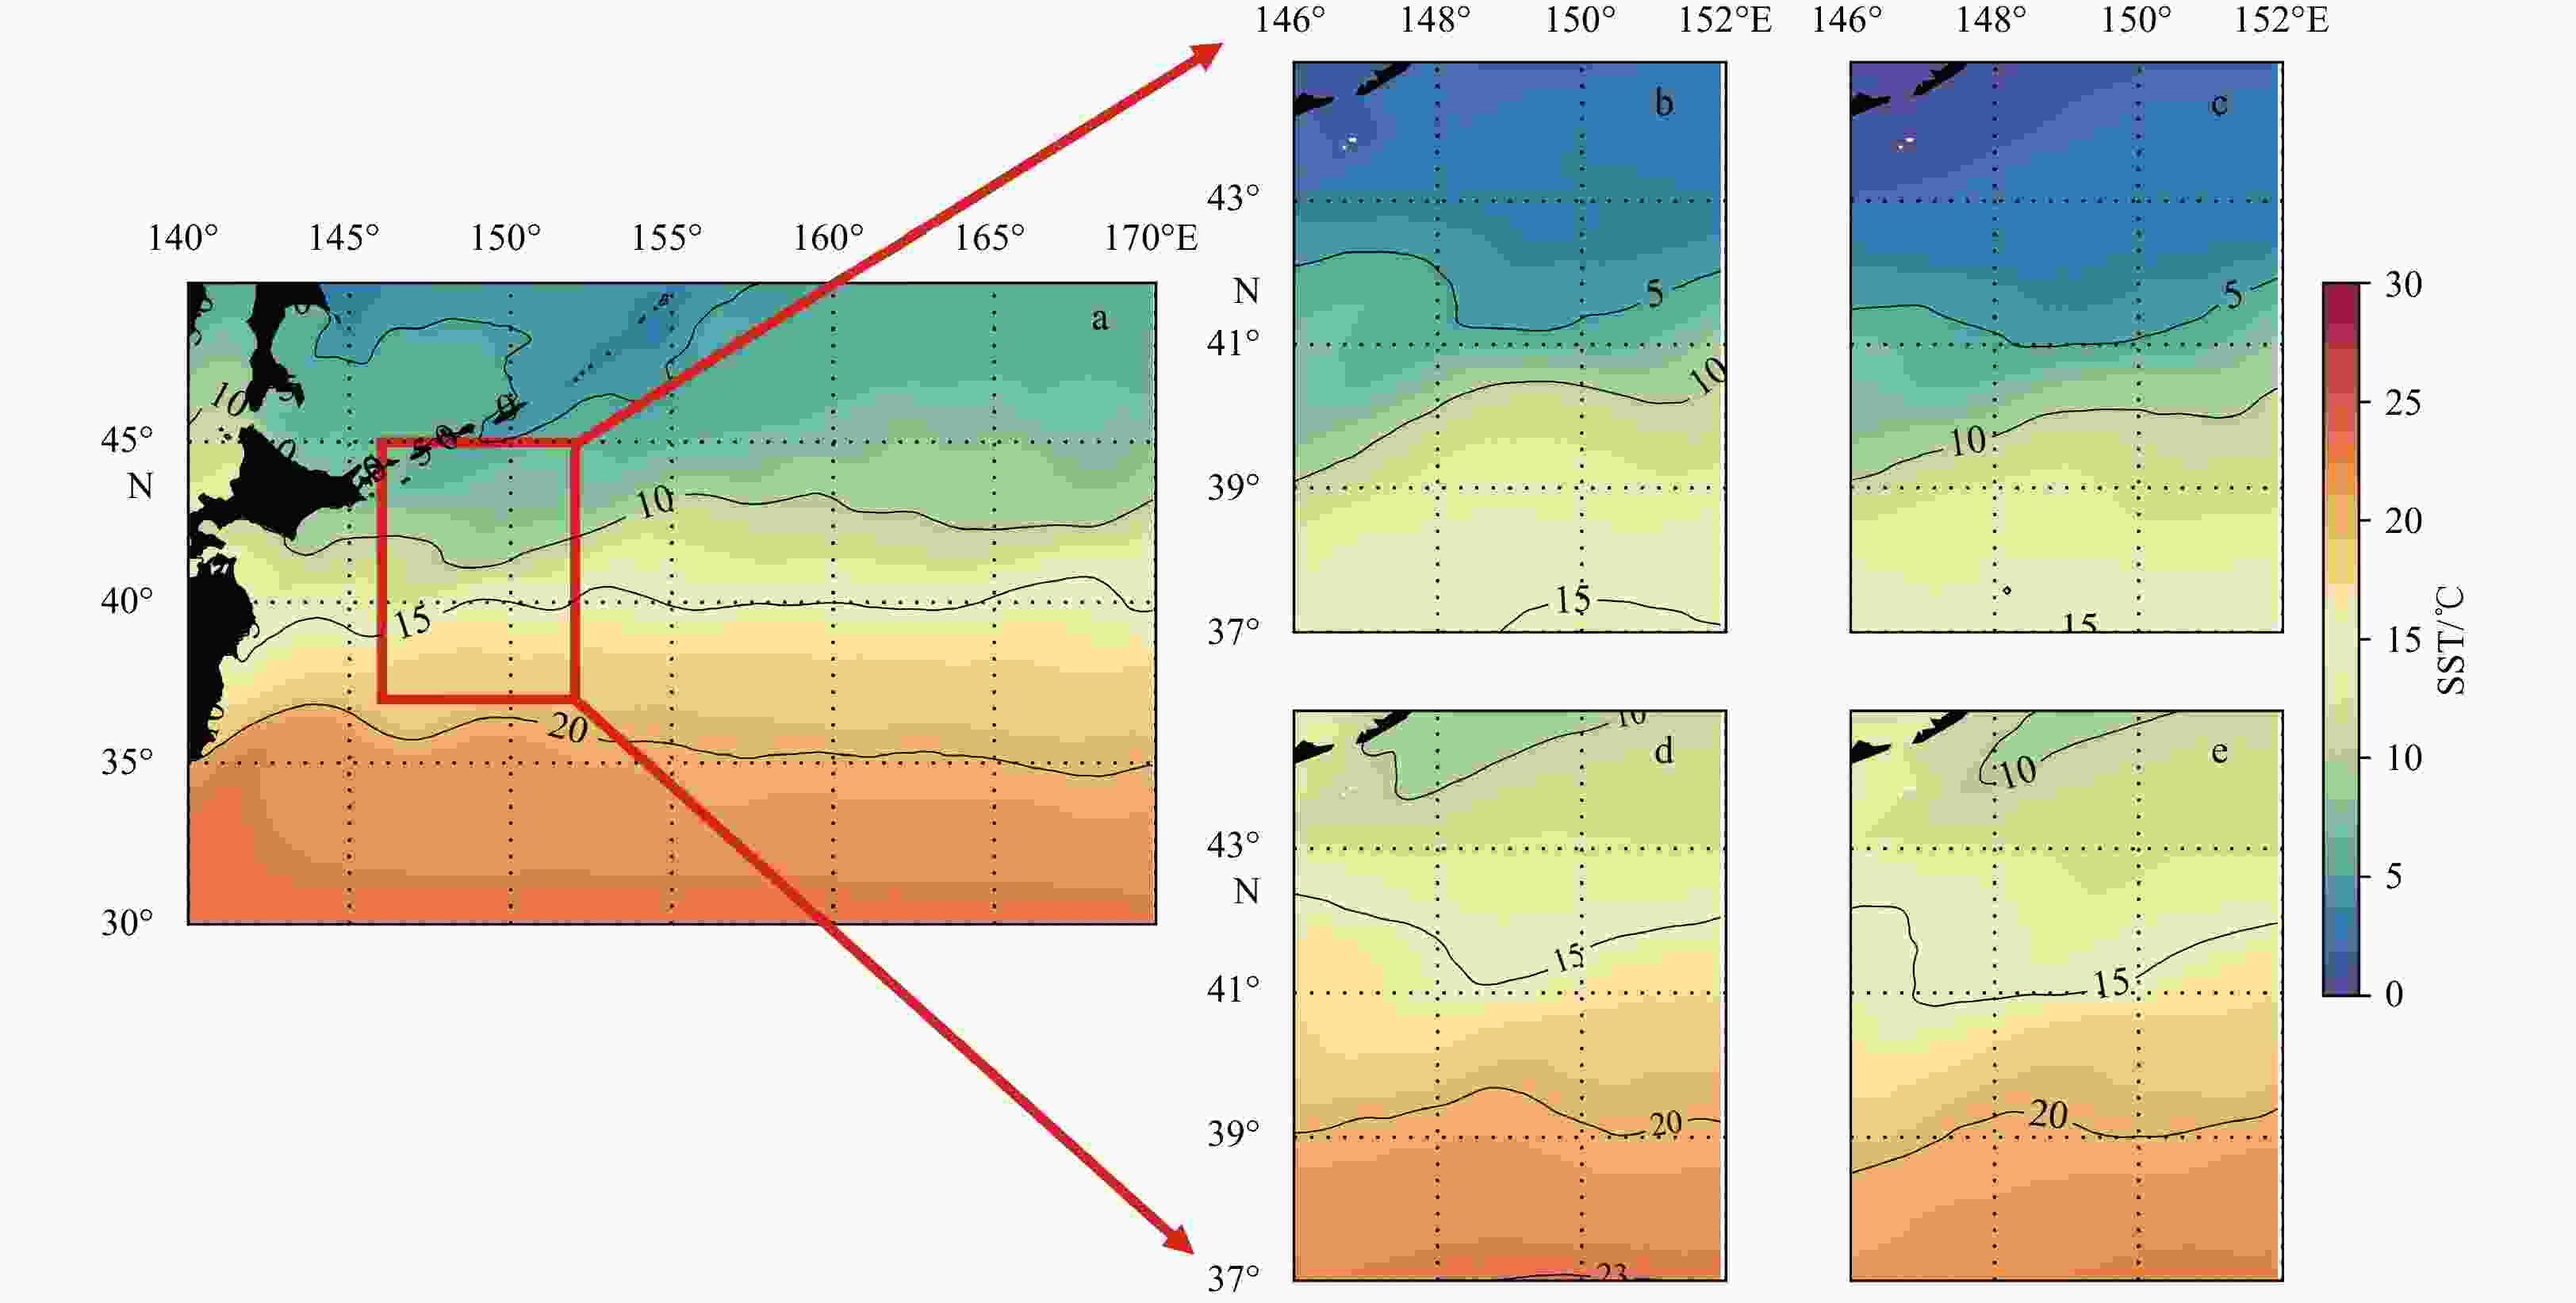
Figure 3. An example of the combined detection algorithm used in this study. The input SST data (a), the longitudinal and latitudinal SST gradient (b, c), magnitude of the SST gradient (d). The probability density function (PDF) of SST data over the red (black) rectangle (e, f) in a, SST front detected by the histogram analysis (g) and the combined algorithm (h). The black curves in g and h denote the central front lines obtained by the Canny algorithm.
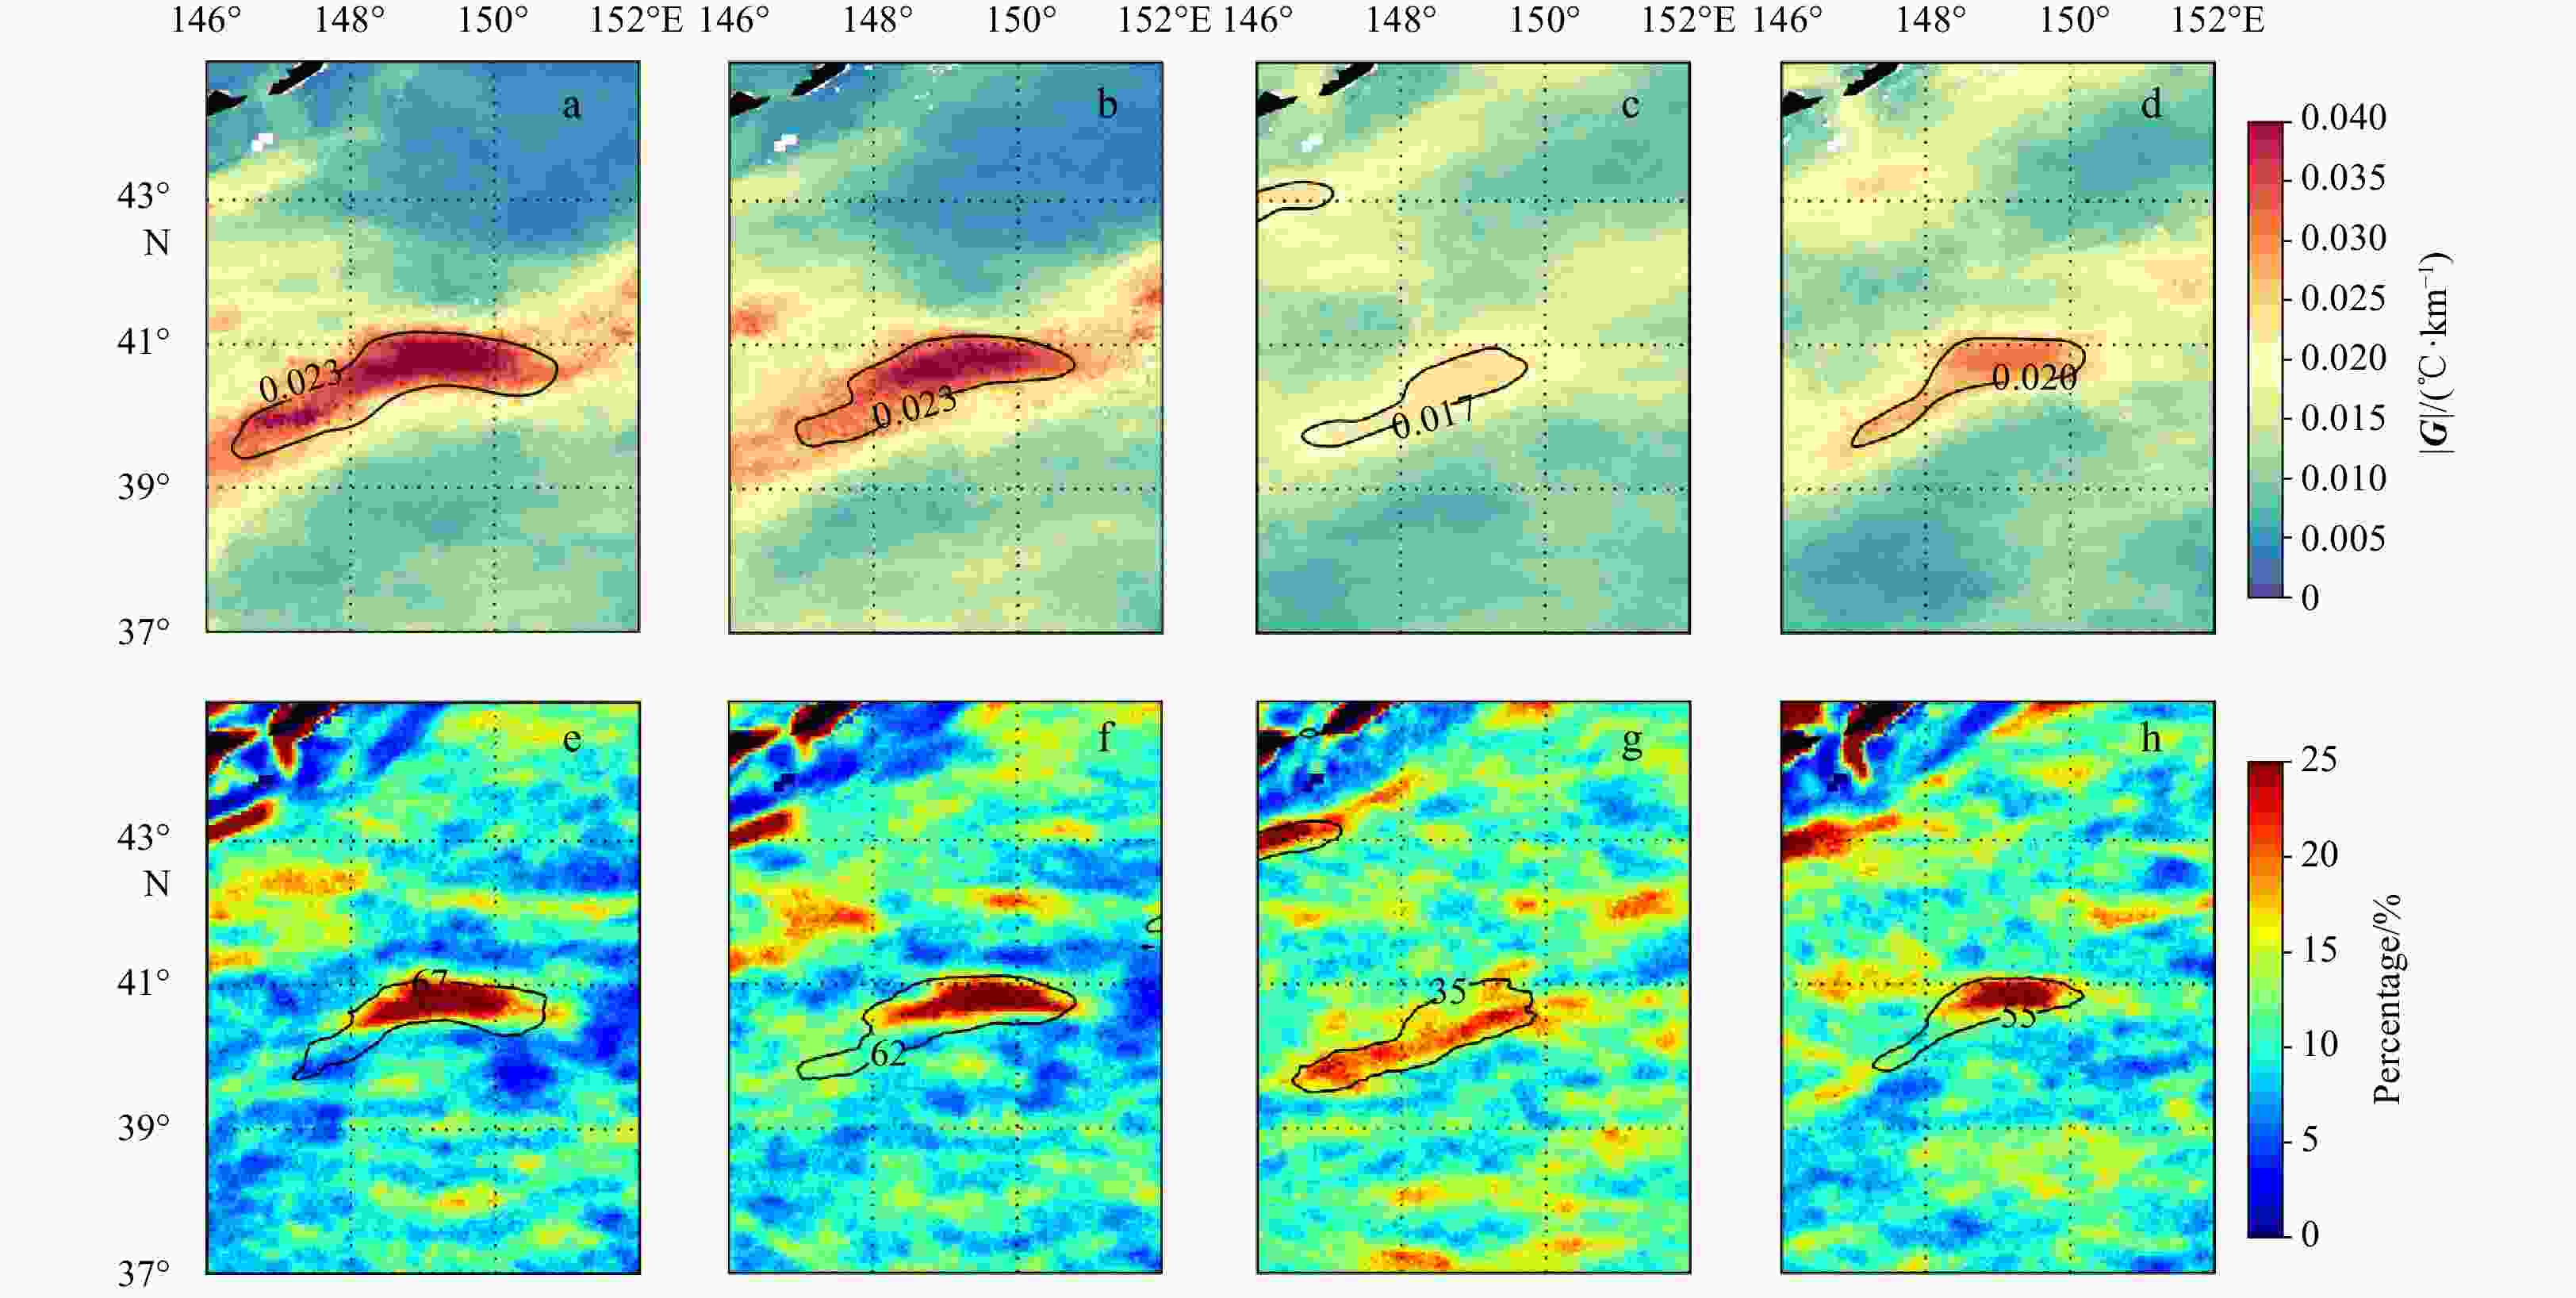
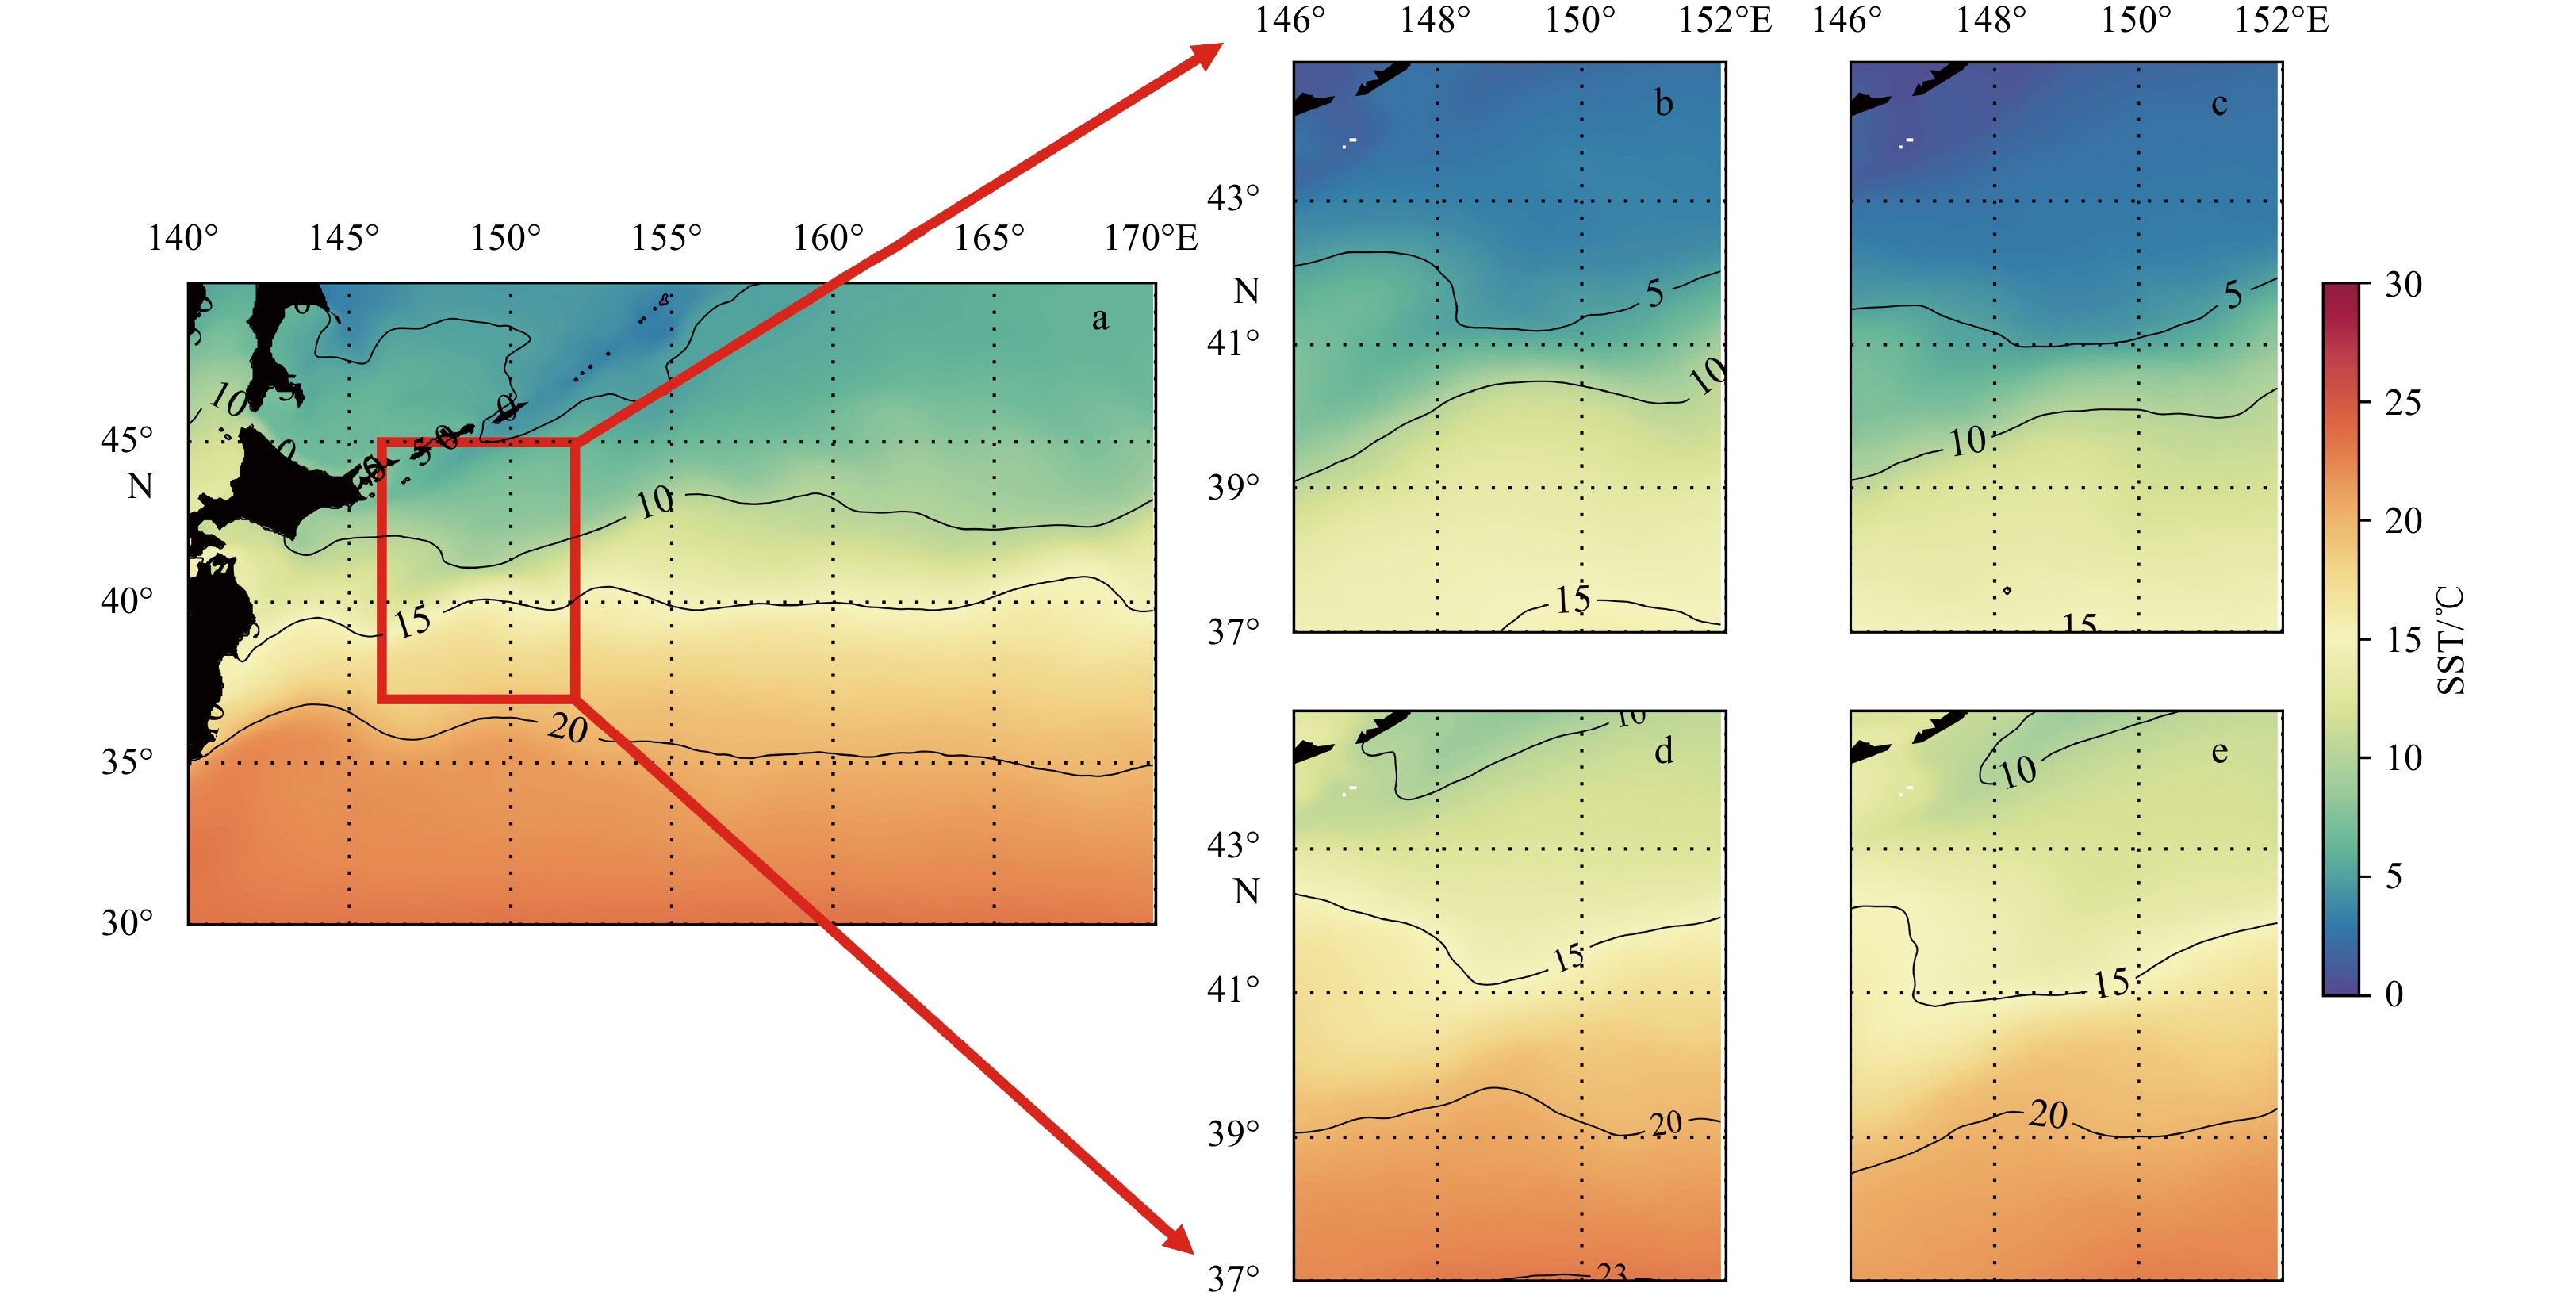
Figure 4. Seasonal average of SST gradient and the occurrence of frequency over the detected ocean front by the combined algorithm in winter (DJF) (a, e), spring (MAM) (b, f), summer (JJA) (c, g) and autumn (SON) (d, h), respectively. The black contour in the bottom panel is the frequency of SST gradient larger than 0.01℃/km.
-
Belkin I M, Cornillon P C, Sherman K. 2009. Fronts in large marine ecosystems. Progress in Oceanography, 81(1–4): 223–236 Cayula J F, Cornillon P. 1992. Edge detection algorithm for SST images. Journal of Atmospheric and Oceanic Technology, 9(1): 67–80. doi: 10.1175/1520-0426(1992)009<0067:EDAFSI>2.0.CO;2 Cayula J F, Cornillon P. 1995. Multi-image edge detection for SST images. Journal of Atmospheric and Oceanic Technology, 12(4): 821–829. doi: 10.1175/1520-0426(1995)012<0821:MIEDFS>2.0.CO;2 Cayula J F, Cornillon P. 1996. Cloud detection from a sequence of SST images. Remote Sensing of Environment, 55(1): 80–88. doi: 10.1016/0034-4257(95)00199-9 Chen Shuiming. 2008. The Kuroshio Extension Front from satellite sea surface temperature measurements. Journal of Oceanography, 64(6): 891–897. doi: 10.1007/s10872-008-0073-6 Davis L S. 1975. A survey of edge detection techniques. Computer Graphics and Image Processing, 4(3): 248–270. doi: 10.1016/0146-664X(75)90012-X Donlon C J, Martin M, Stark J, et al. 2012. The operational sea surface temperature and sea ice analysis (OSTIA) system. Remote Sensing of Environment, 116: 140–158. doi: 10.1016/j.rse.2010.10.017 Good S, Fiedler E, Mao C Y, et al. 2020. The current configuration of the OSTIA system for operational production of foundation sea surface temperature and ice concentration analyses. Remote Sensing, 12(4): 720. doi: 10.3390/rs12040720 Gordon A L. 1975. An Antarctic oceanographic section along 170°E. Deep-Sea Research and Oceanographic Abstracts, 22(6): 357–377. doi: 10.1016/0011-7471(75)90060-1 Guan Lei, Kawamura H. 2004. Merging satellite infrared and microwave SSTs: methodology and evaluation of the new SST. Journal of Oceanography, 60(5): 905–912. doi: 10.1007/s10872-005-5782-5 Han Yansong, Zhang Lu, Qiao Lulu, et al. 2021. Multi-time scale variation of suspended sediment concentration over the eastern Shandong Peninsula under ocean front. Acta Sedimentologica Sinica (in Chinese), 41(3): 778–790 Kirches G, Paperin M, Klein H, et al. 2016. GRADHIST—A method for detection and analysis of oceanic fronts from remote sensing data. Remote Sensing of Environment, 181: 264–280. doi: 10.1016/j.rse.2016.04.009 Kobashi F, Mitsudera H, Xie Shangping. 2006. Three subtropical fronts in the North Pacific: observational evidence for mode water-induced subsurface frontogenesis. Journal of Geophysical Research: Oceans, 111(C9): C09033 Kuang Hailan, Perrie W, Chen Wei, et al. 2012. Thermal front retreivals from SAR imagery. In: Proceedings of 2012 IEEE International Geoscience and Remote Sensing Symposium. Munich: IEEE, 2637–2640 Masujima M, Yasuda I. 2009. Distribution and modification of North Pacific intermediate water around the subarctic frontal zone east of 150°E. Journal of Physical Oceanography, 39(6): 1462–1474. doi: 10.1175/2008JPO3919.1 Nagata Y, Michida Y, Umimura Y. 1988. Variation of positions and structures of the oceanic fronts in the Indian Ocean sector of the Southern Ocean in the period from 1965 to 1987. In: Sahrhage D, ed. Antarctic Ocean and Resources Variability. Berlin, Heidelberg: Springer, 92–98 Nakamura H, Kazmin A S. 2003. Decadal changes in the North Pacific oceanic frontal zones as revealed in ship and satellite observations. Journal of Geophysical Research: Oceans, 108(C3): 3078. doi: 10.1029/1999JC000085 Nakano H, Tsujino H, Sakamoto K, et al. 2018. Identification of the fronts from the Kuroshio extension to the subarctic current using absolute dynamic topographies in satellite altimetry products. Journal of Oceanography, 74(4): 393–420. doi: 10.1007/s10872-018-0470-4 Ping Bo, Su Fenzhen, Meng Yunshan, et al. 2014. A model of sea surface temperature front detection based on a threshold interval. Acta Oceanologica Sinica, 33(7): 65–71. doi: 10.1007/s13131-014-0502-x Rintoul S R, England M H. 2002. Ekman transport dominates local air-sea fluxes in driving variability of subantarctic mode water. Journal of Physical Oceanography, 32(5): 1308–1321. doi: 10.1175/1520-0485(2002)032<1308:ETDLAS>2.0.CO;2 Sampe T, Nakamura H, Goto A, et al. 2010. Significance of a midlatitude SST frontal zone in the formation of a storm track and an eddy-driven westerly jet. Journal of Climate, 23(7): 1793–1814. doi: 10.1175/2009JCLI3163.1 Shao Lianjun, Zhang Honglei, Zhang Chunhua, et al. 2015. A method for detecting the oceanic front using remotely sensed sea-surface temperature. Hydrographic Surveying and Charting (in Chinese), 35(2): 42–44, 51 Shaw A G P, Vennell R. 2000. A front-following algorithm for AVHRR SST imagery. Remote Sensing of Environment, 72(3): 317–327. doi: 10.1016/S0034-4257(99)00108-X Shimada T, Sakaida F, Kawamura H, et al. 2005. Application of an edge detection method to satellite images for distinguishing sea surface temperature fronts near the Japanese coast. Remote Sensing of Environment, 98(1): 21–34. doi: 10.1016/j.rse.2005.05.018 Simhadri K K, Iyengar S S, Holyer R J, et al. 1998. Wavelet-based feature extraction from oceanographic images. IEEE Transactions on Geoscience and Remote Sensing, 36(3): 767–778. doi: 10.1109/36.673670 Sugimoto S, Kobayashi N, Hanawa K. 2014. Quasi-decadal variation in intensity of the western part of the winter subarctic SST front in the western North Pacific: the influence of Kuroshio extension path state. Journal of Physical Oceanography, 44(10): 2753–2762. doi: 10.1175/JPO-D-13-0265.1 Tomita H, Kouketsu S, Oka E, et al. 2011. Locally enhanced wintertime air-sea interaction and deep oceanic mixed layer formation associated with the subarctic front in the North Pacific. Geophysical Research Letters, 38(24): L24607 Ullman D S, Cornillon P C. 2000. Evaluation of front detection methods for satellite-derived SST data using in situ observations. Journal of Atmospheric and Oceanic Technology, 17(12): 1667–1675. doi: 10.1175/1520-0426(2000)017<1667:EOFDMF>2.0.CO;2 Wang Yu, Yu Yi, Zhang Yang, et al. 2020. Distribution and variability of sea surface temperature fronts in the South China Sea. Estuarine, Coastal and Shelf Science, 240: 106793 Xu Suqin, Chen Biao, Tao Ronghua, et al. 2015. The temporal and spatial distribution characteristics of thermal front in the China seas. Journal of Telemetry, Tracking and Command (in Chinese), 36(3): 62–69, 74 Xu Bin, Yu Jingjing, Zhang Lei, et al. 2018. Research progress of global sea surface temperature fusion. Advances in Meteorological Science and Technology (in Chinese), 8(1): 164–170 Yang Yanlong, Liu Na, Fang Yue, et al. 2021. Spatial distribution and seasonal variation of ocean fronts in the sea of Japan. Advances in Marine Science (in Chinese), 39(3): 379–392 Yao Yao, Zhong Zhong, Yang Xiuqun. 2018. Impacts of the subarctic frontal zone on the North Pacific storm track in the cold season: an observational study. International Journal of Climatology, 38(5): 2554–2564. doi: 10.1002/joc.5429 Yu Peilong, Zhang Lifeng, Liu Mingyang, et al. 2020. A comparison of the strength and position variability of the Kuroshio Extension SST front. Acta Oceanologica Sinica, 39(5): 26–34. doi: 10.1007/s13131-020-1567-3 Yuan Xiaojun, Talley L D. 1996. The subarctic frontal zone in the North Pacific: characteristics of frontal structure from climatological data and synoptic surveys. Journal of Geophysical Research: Oceans, 101(C7): 16491–16508. doi: 10.1029/96JC01249 Zheng Huanhuan, Bai Yuxiu, Zhang Yaqiong. 2020. An edge detection algorithm based on Sobel operator. Microcomputer Applications (in Chinese), 36(10): 4–6 Zhu Kelan, Chen Xi, Mao Kefeng, et al. 2019. Mixing characteristics of the subarctic front in the Kuroshio-Oyashio confluence region. Oceanologia, 61(1): 103–113. doi: 10.1016/j.oceano.2018.07.004 Zhu Kelan, Chen Xi, Mao Kefeng, et al. 2020. Analysis on seasonal and interannual variations of the western Subarctic Front. Marine Science Bulletin (in Chinese), 39(1): 86–93 -


 下载:
下载:
