

Gravity anomalies determined from mean sea surface model data over the Gulf of Mexico
-
Abstract: With the improvements in the density and quality of satellite altimetry data, a high-precision and high-resolution mean sea surface model containing abundant information regarding a marine gravity field can be calculated from long-time series multi-satellite altimeter data. Therefore, in this study, a method was proposed for determining marine gravity anomalies from a mean sea surface model. Taking the Gulf of Mexico (15°–32°N, 80°–100°W) as the study area and using a removal-recovery method, the residual gridded deflections of the vertical (DOVs) are calculated by combining the mean sea surface, mean dynamic topography, and XGM2019e_2159 geoid, and then using the inverse Vening-Meinesz method to determine the residual marine gravity anomalies from the residual gridded DOVs. Finally, residual gravity anomalies are added to the XGM2019e_2159 gravity anomalies to derive marine gravity anomaly models. In this study, the marine gravity anomalies were estimated with mean sea surface models CNES_CLS15MSS, DTU21MSS, and SDUST2020MSS and the mean dynamic topography models CNES_CLS18MDT and DTU22MDT. The accuracy of the marine gravity anomalies derived by the mean sea surface model was assessed based on ship-borne gravity data. The results show that the difference between the gravity anomalies derived by DTU21MSS and CNES_CLS18MDT and those of the ship-borne gravity data is optimal. With an increase in the distance from the coast, the difference between the gravity anomalies derived by mean sea surface models and ship-borne gravity data gradually decreases. The accuracy of the difference between the gravity anomalies derived by mean sea surface models and those from ship-borne gravity data are optimal at a depth of 3–4 km. The accuracy of the gravity anomalies derived by the mean sea surface model is high.
-
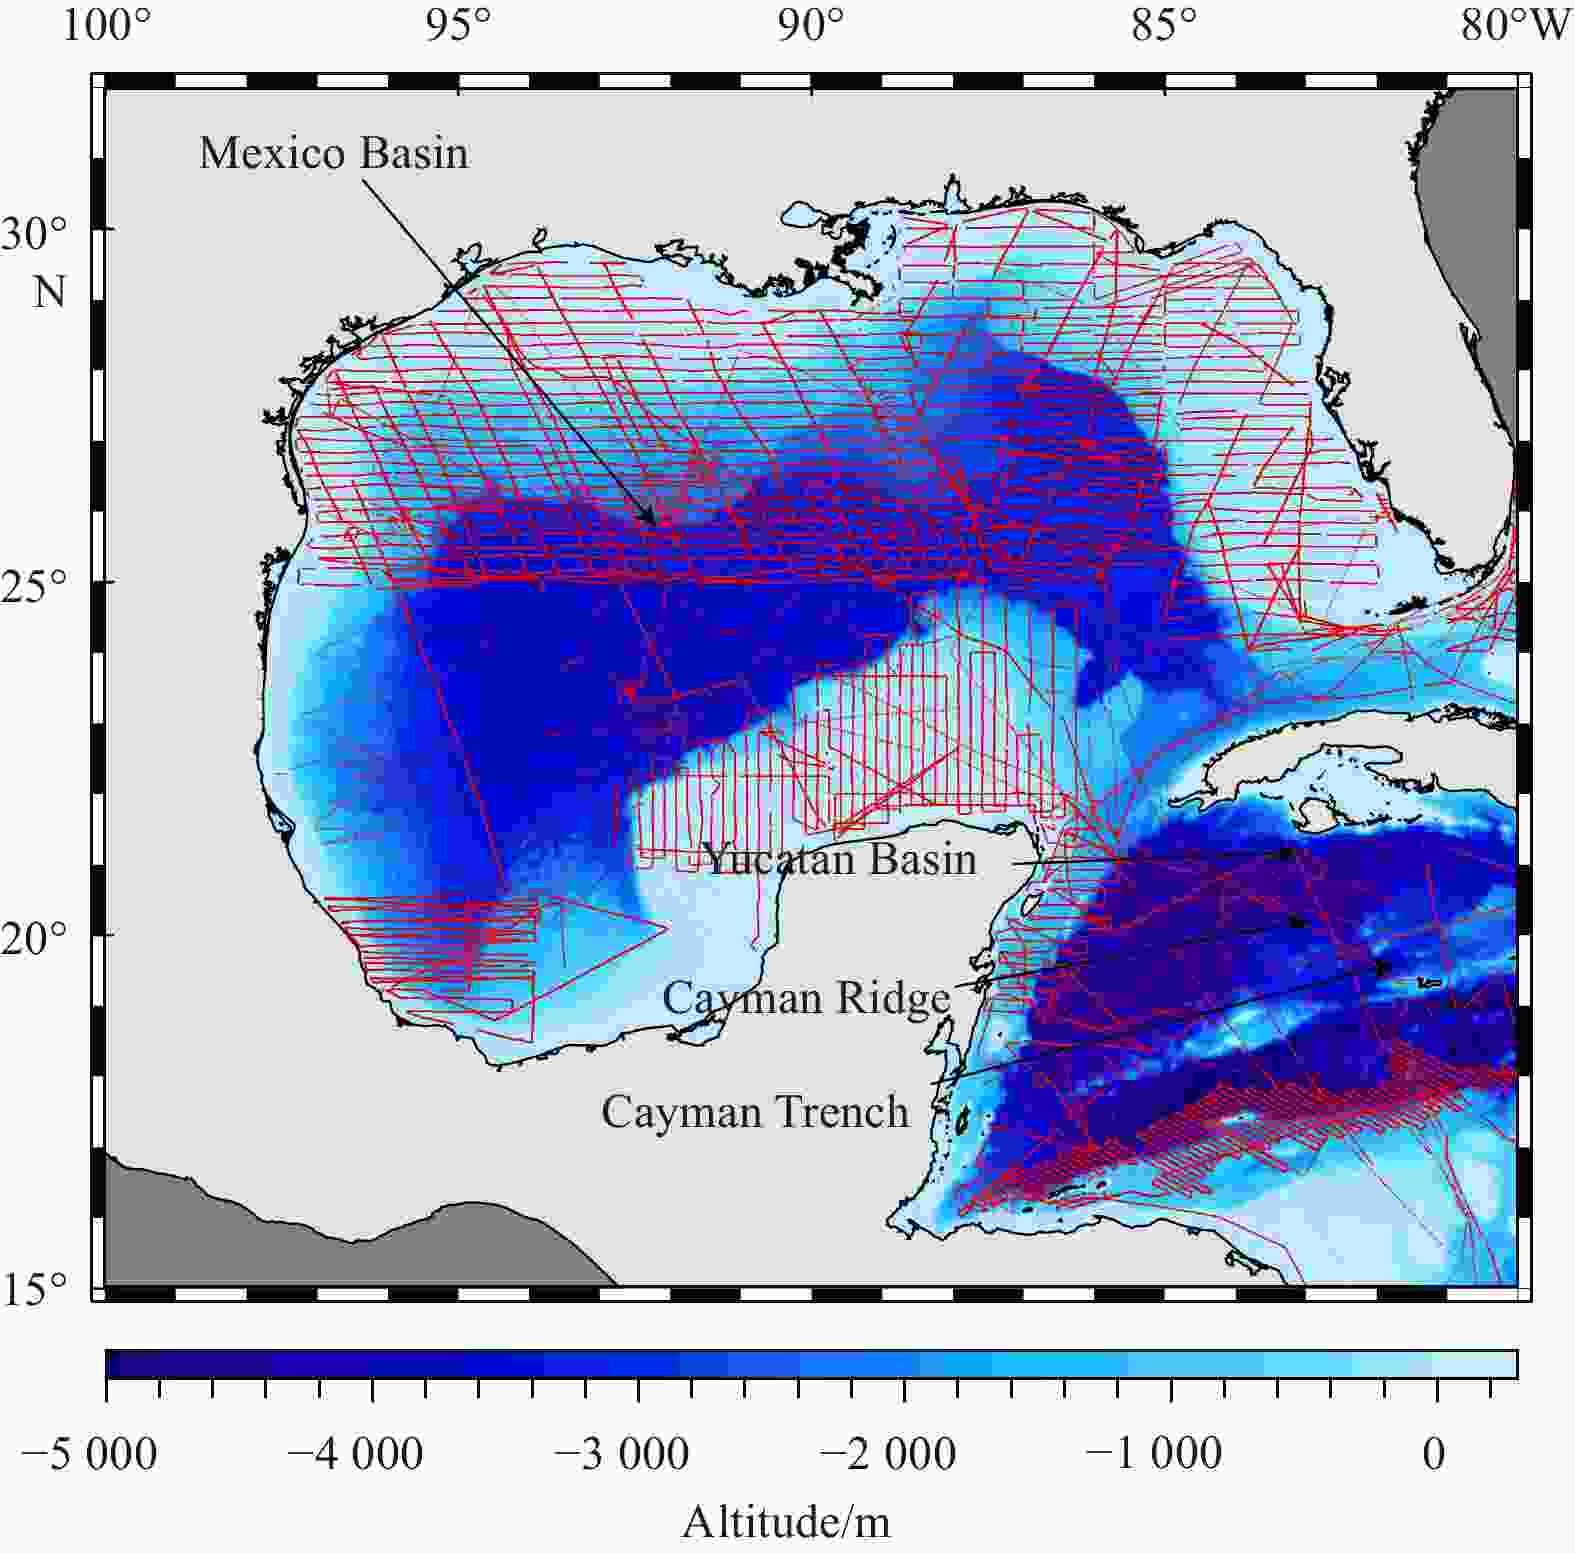
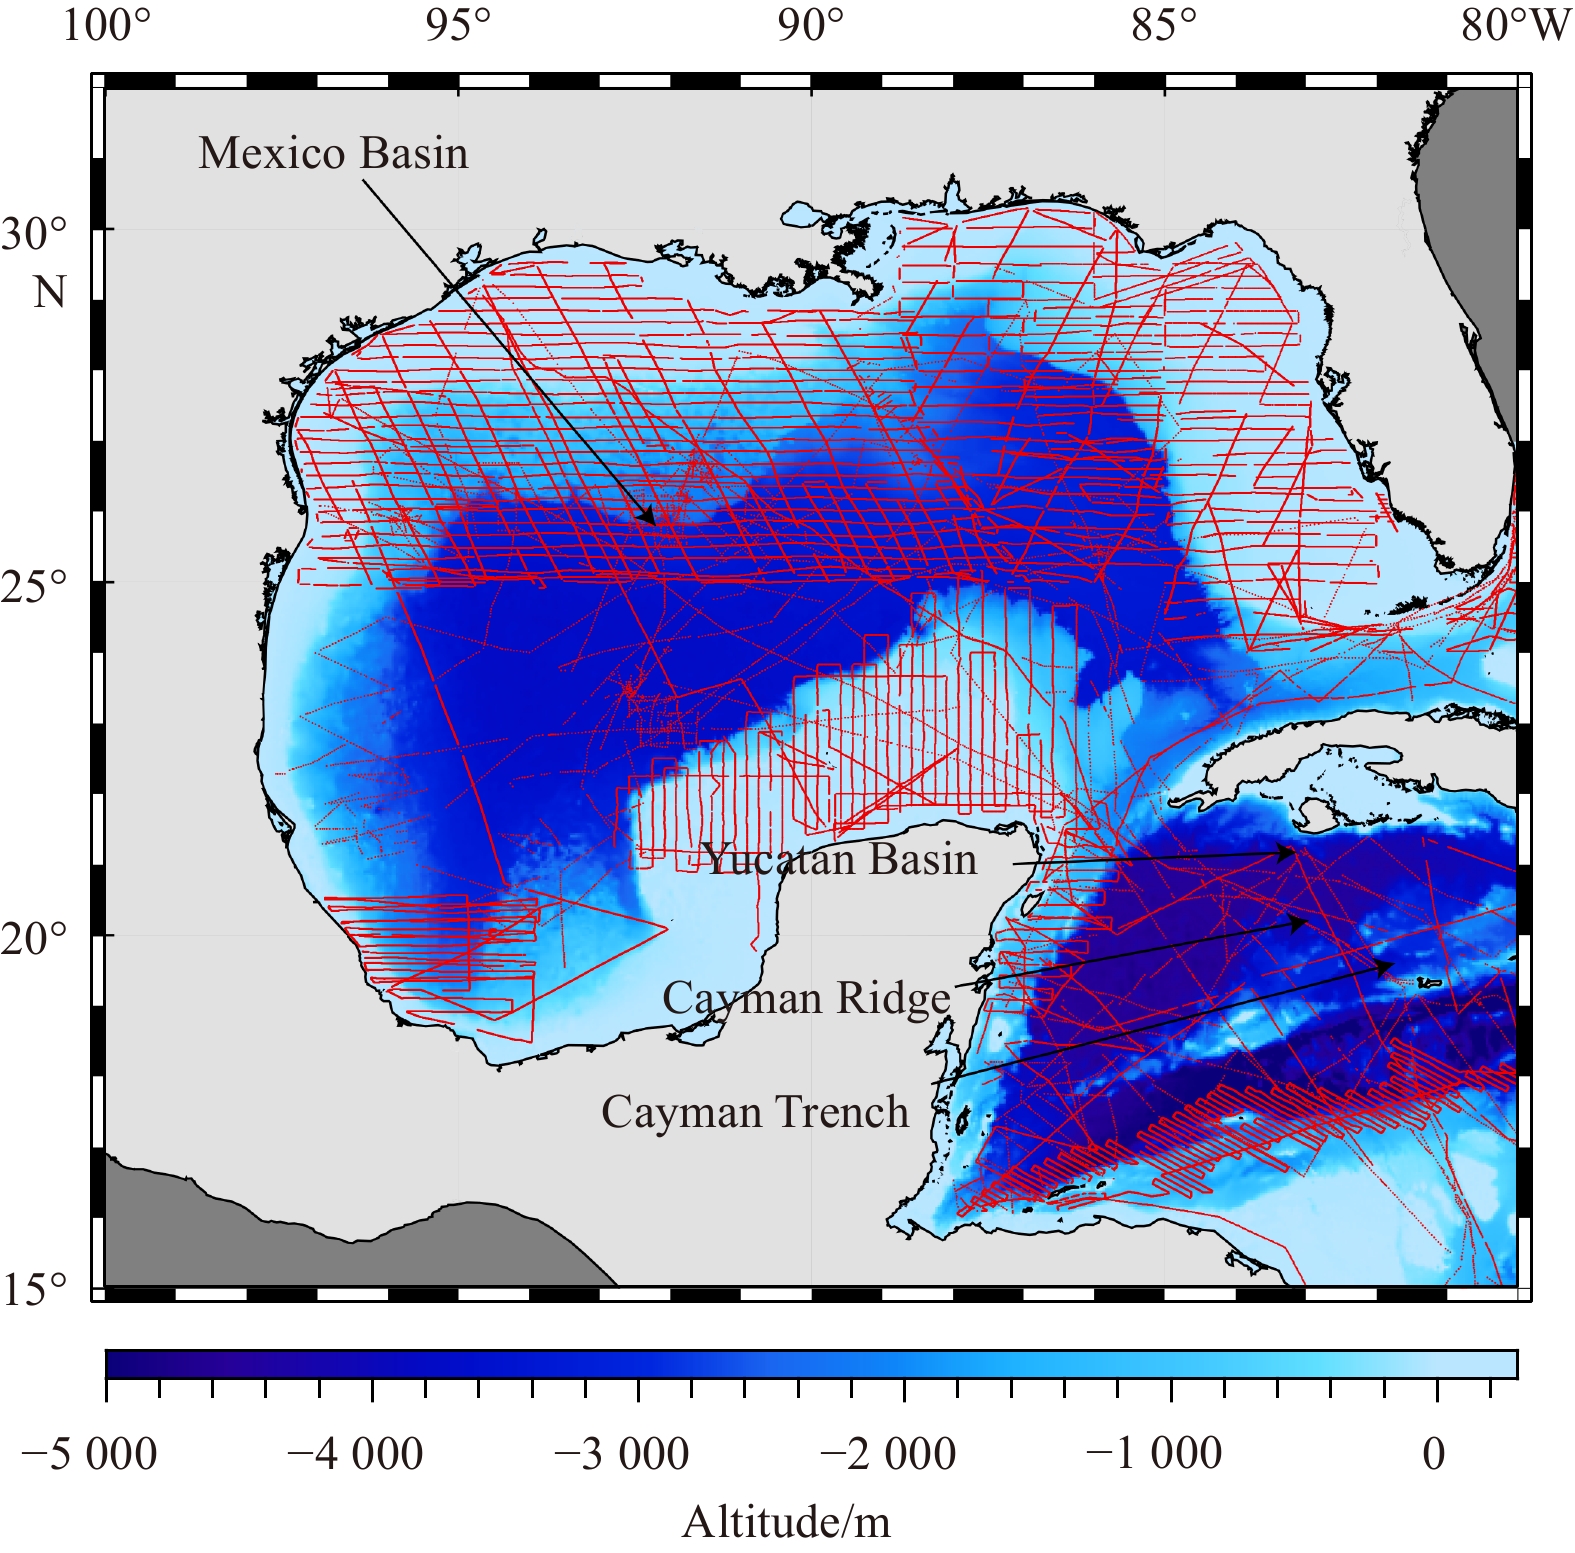
Figure 1. Study area and ship-borne gravity trace distribution. The thick solid red line is ship-borne gravity trace; the light gray area is land; the dark gray area corresponds to the marine regions that have been excluded from consideration or inclusion in this study.
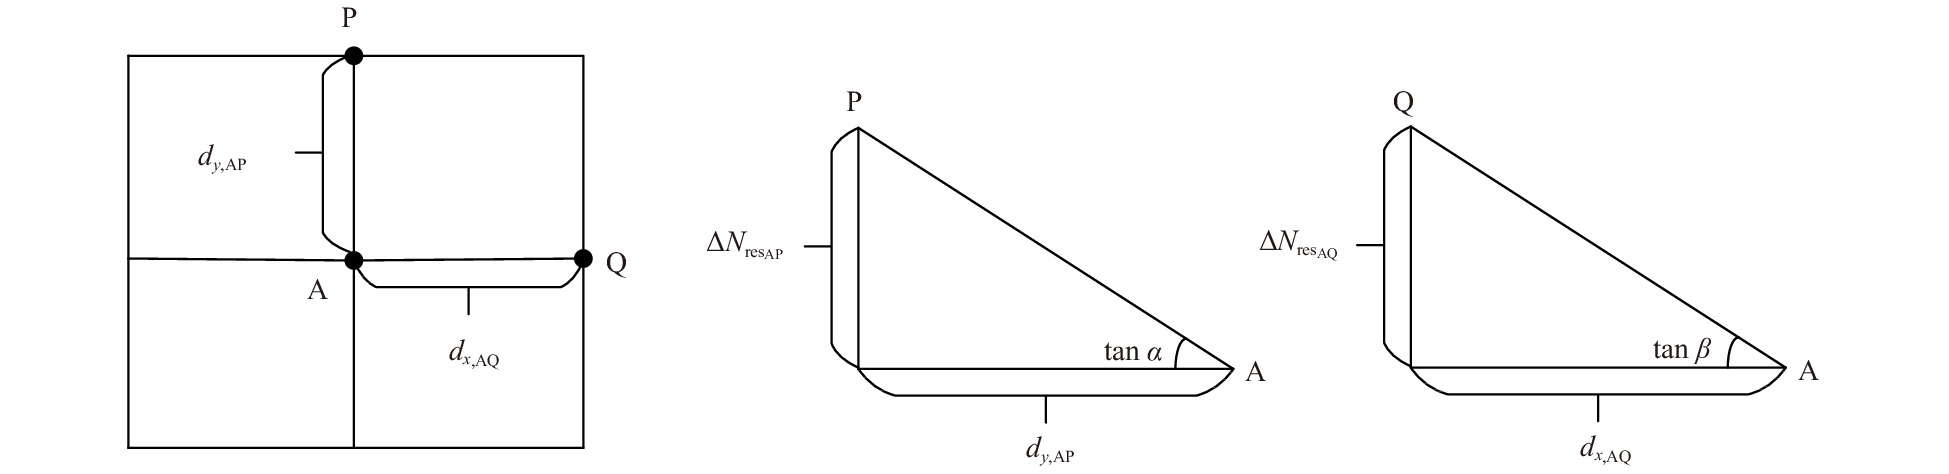
Figure 2. Calculation diagram of the residual gridded deflections of the vertical (DOVs).
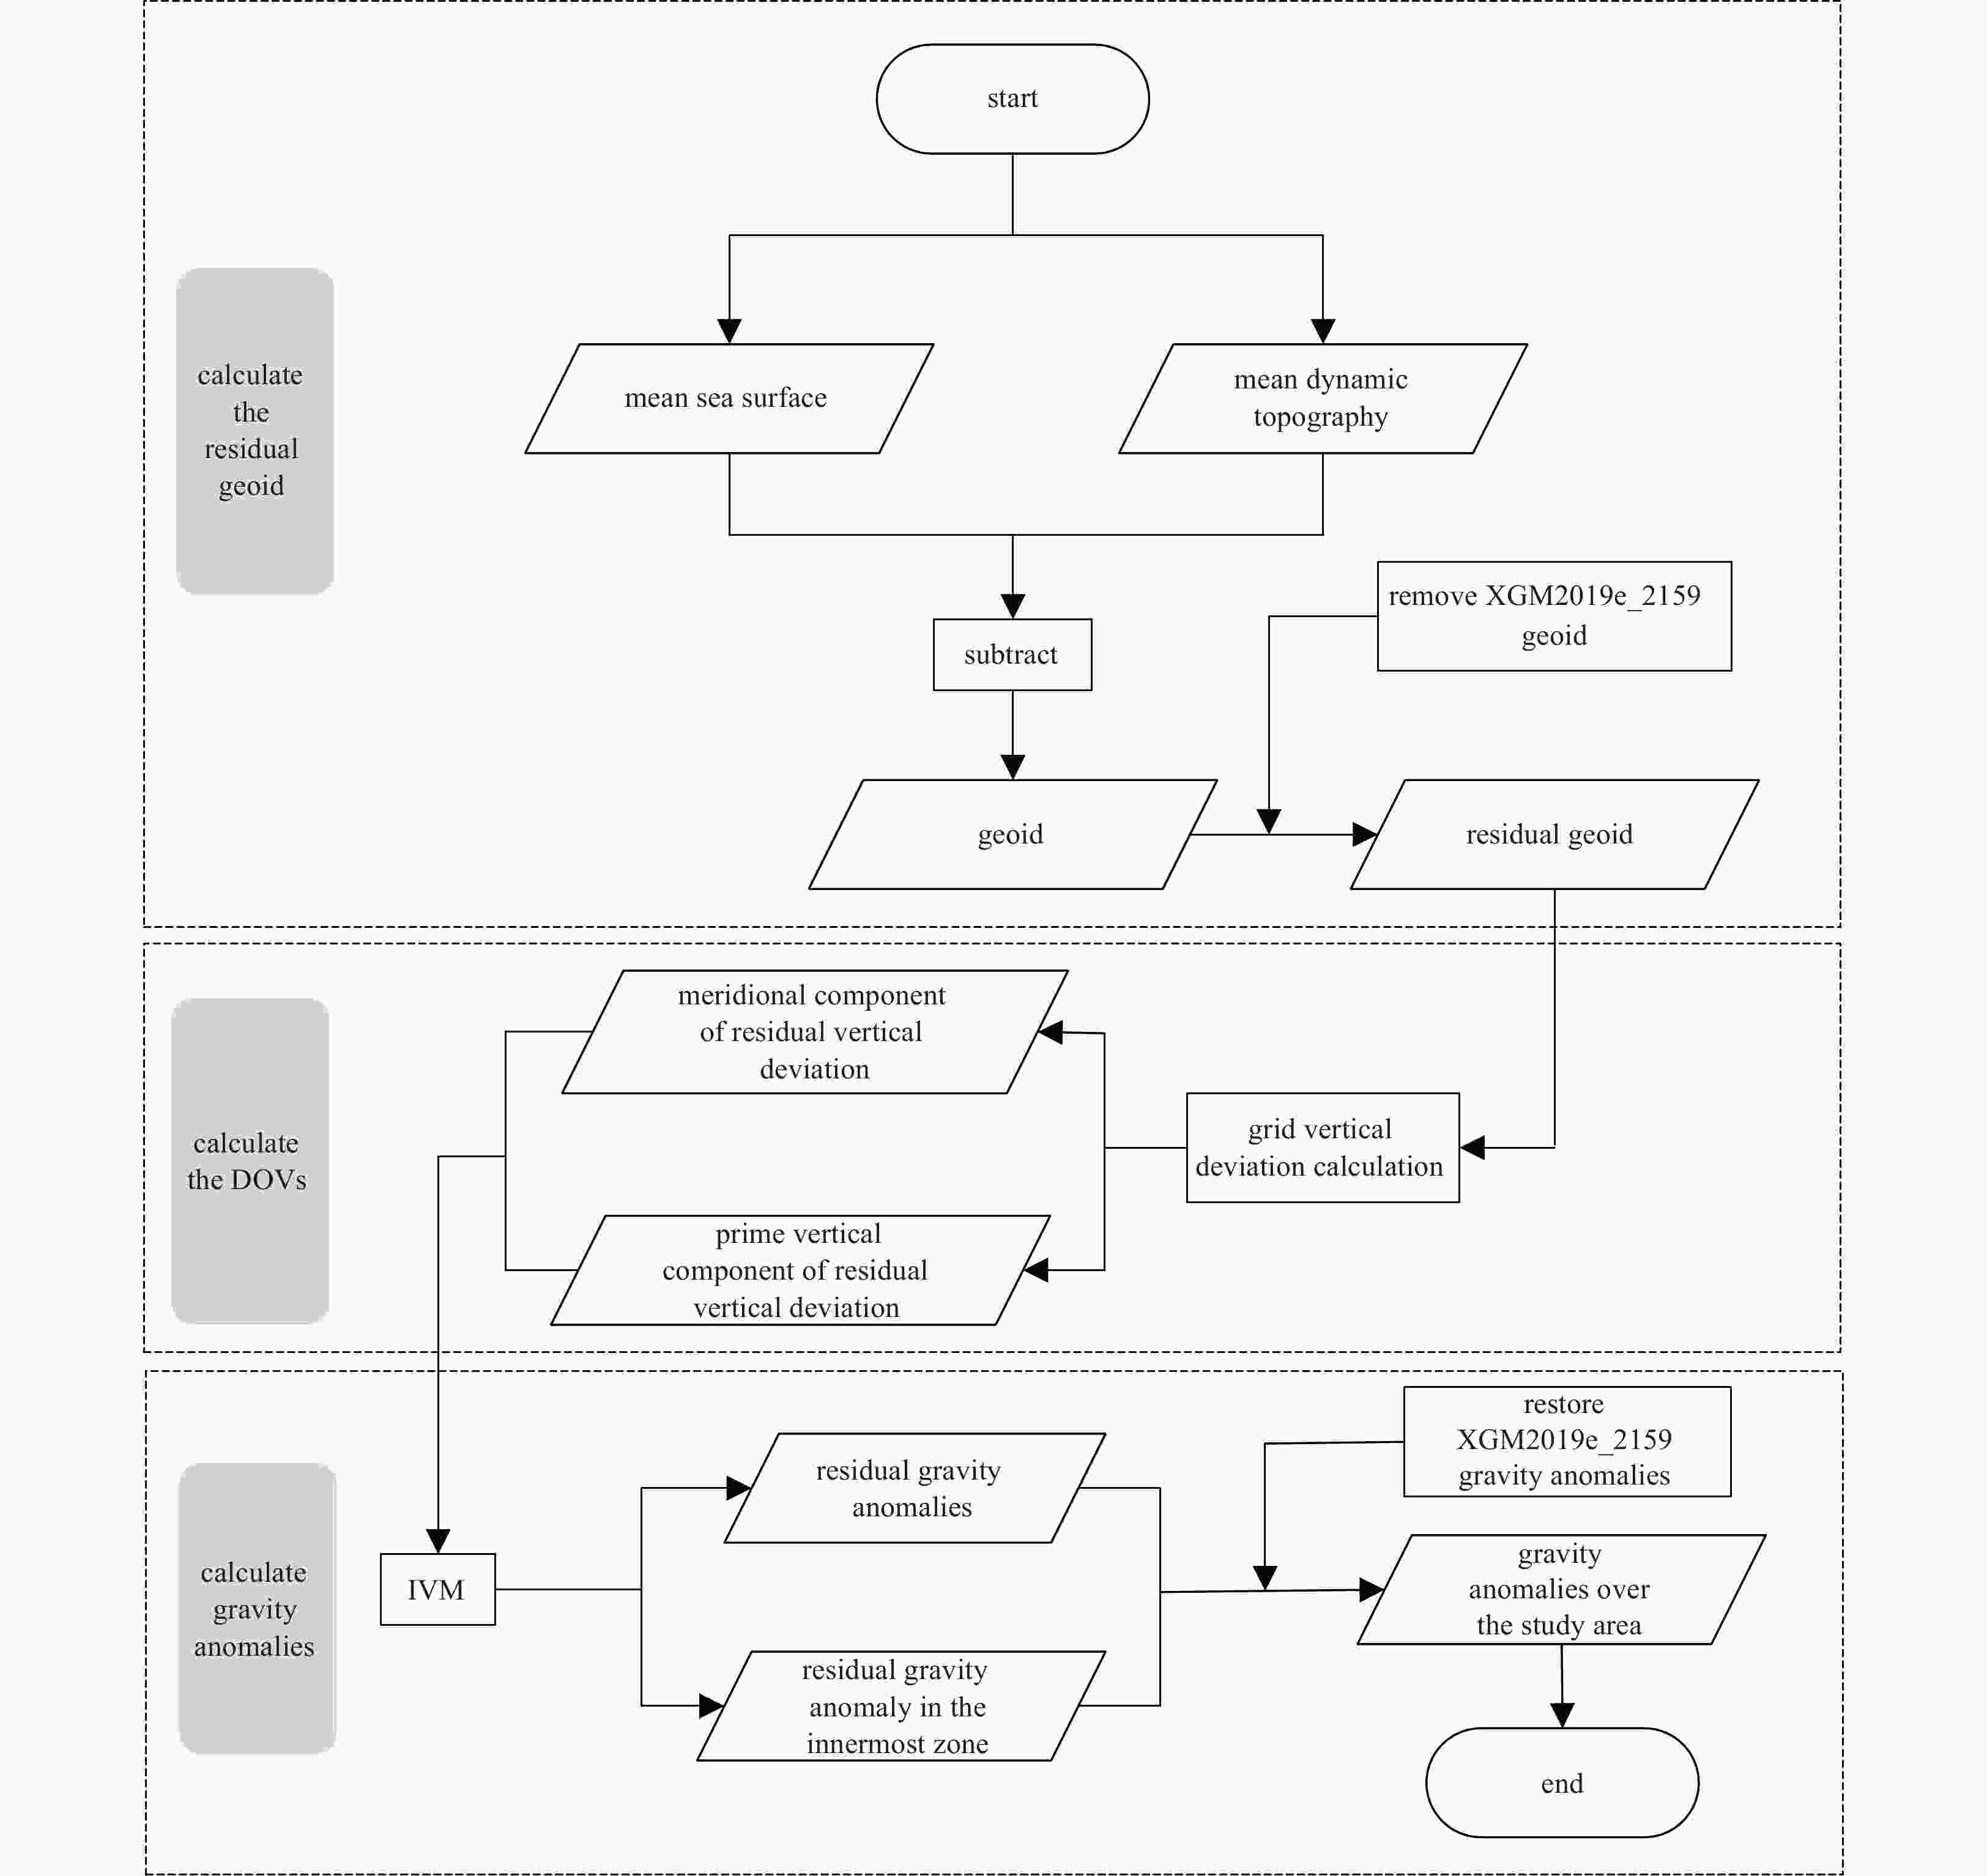
Figure 3. Flowchart of data processing of deriving gravity anomalies using the mean sea surface model.
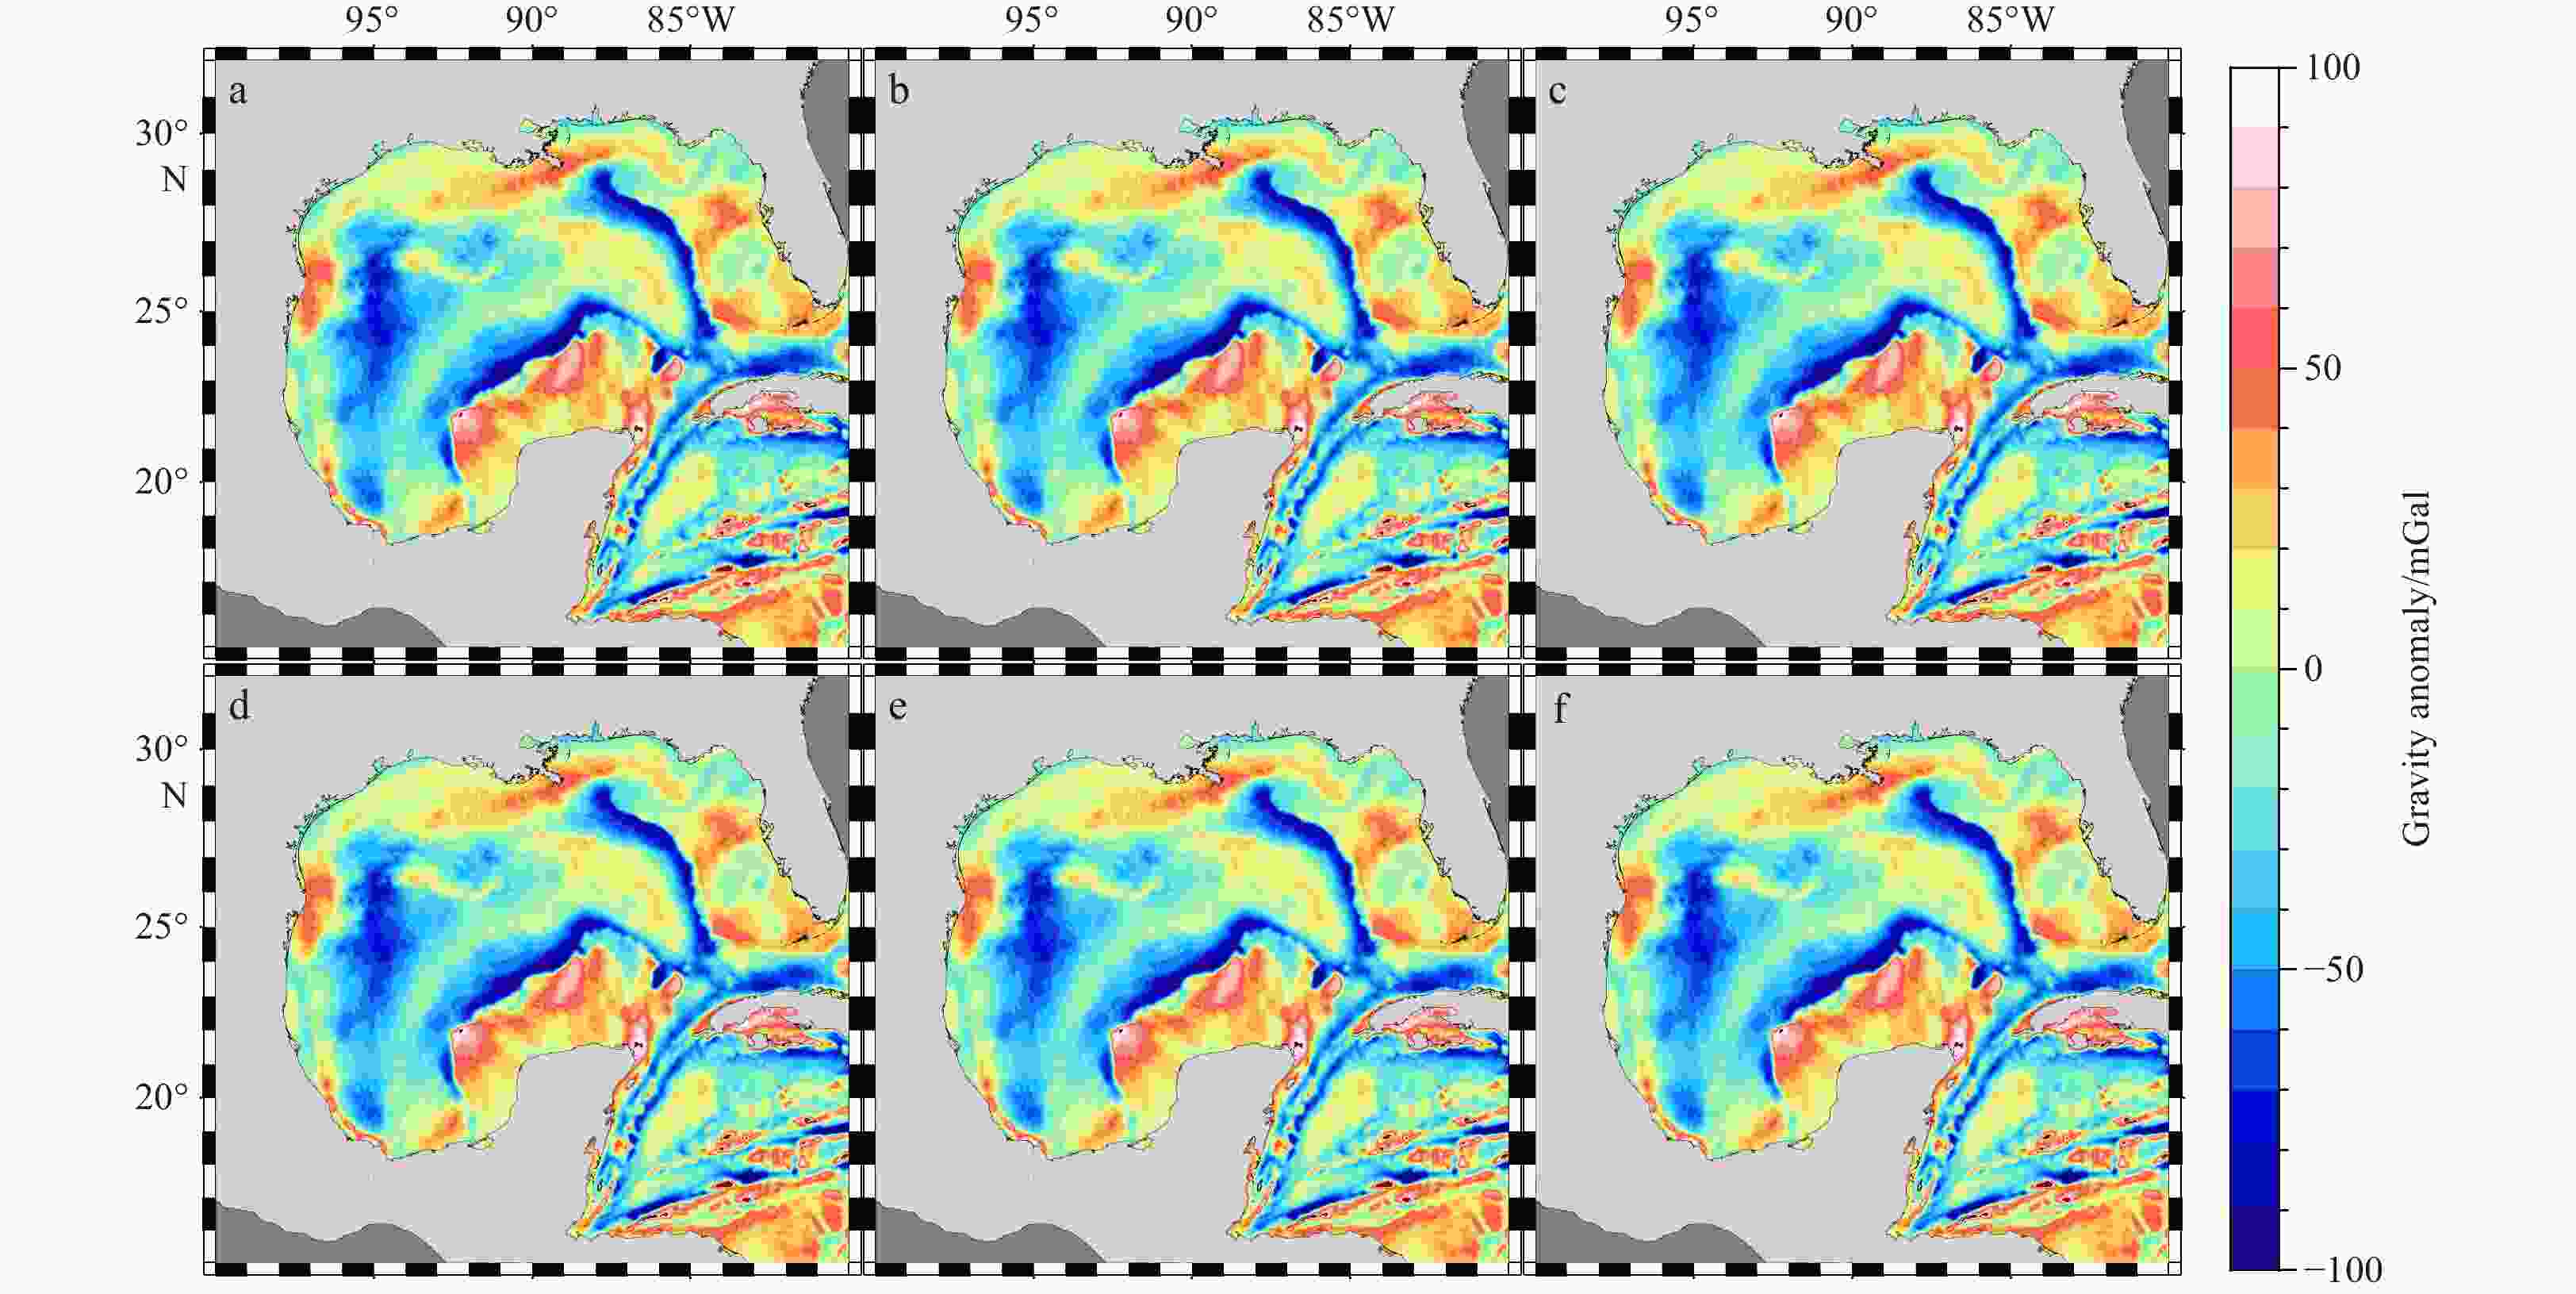
Figure 4. Gravity anomalies derived from mean sea surface models: Grav-1 (a); Grav-2 (b); Grav-3 (c); Grav-4 (d); Grav-5 (e); Grav-6 (f).
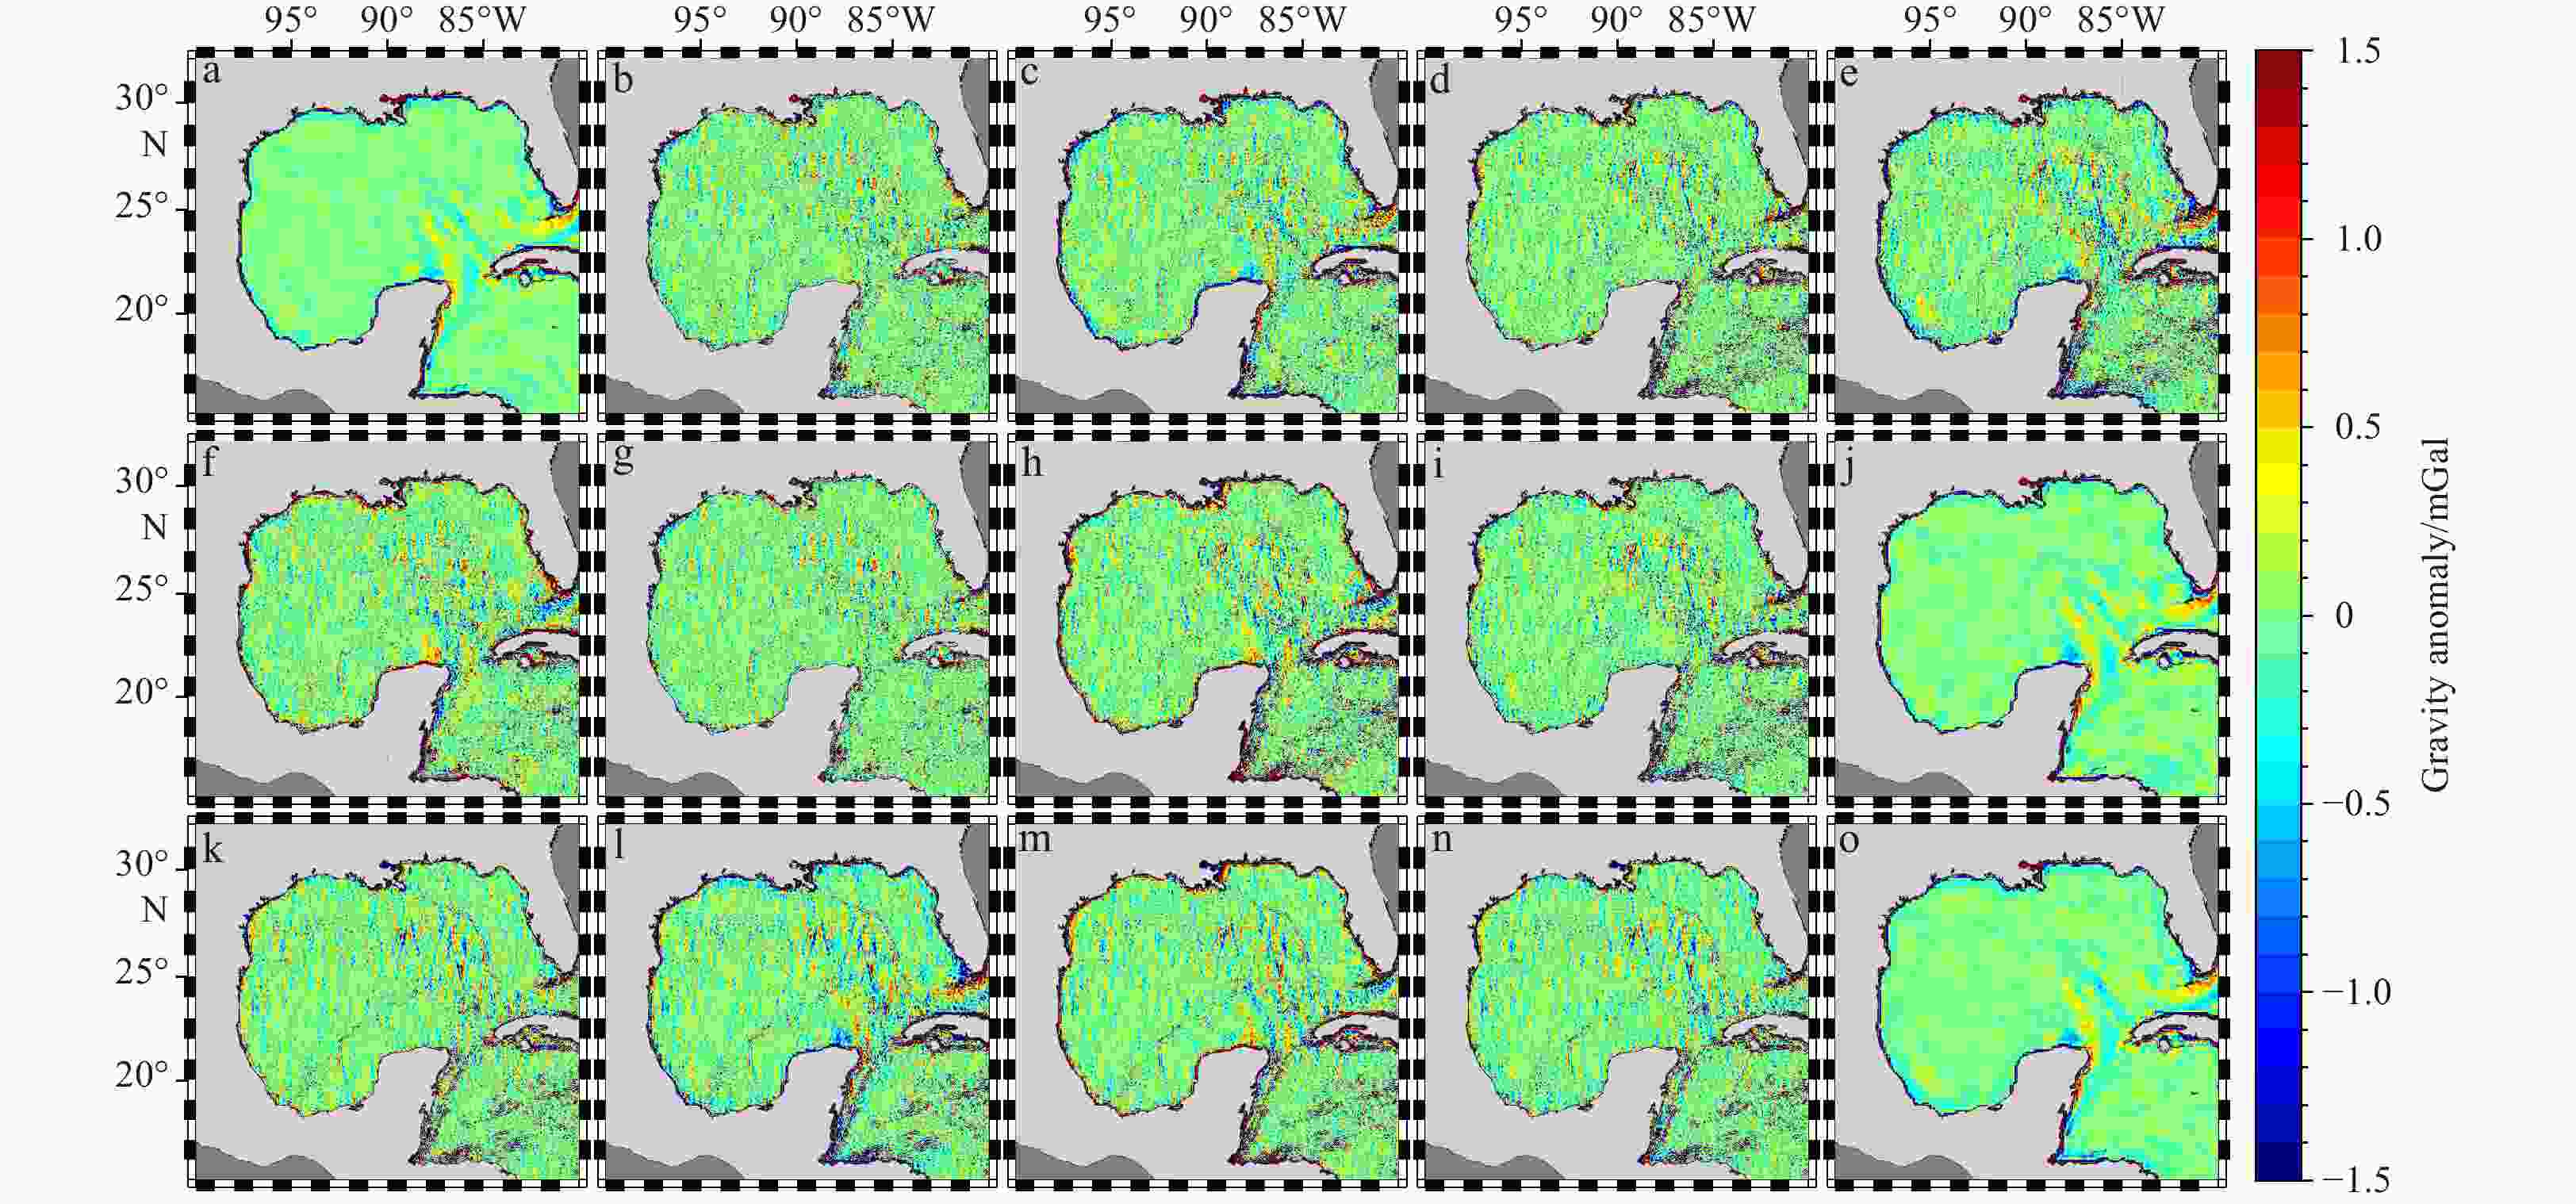
Figure 5. Differences among six marine gravity anomaly models. a. Grav-1 − Grav-2; b. Grav-1 − Grav-3; c. Grav-1 − Grav-4; d. Grav-1 − Grav-5; e. Grav-1 − Grav-6; f. Grav-2 − Grav-3; g. Grav-2 − Grav-4; h. Grav-2 − Grav-5; i. Grav-2 − Grav-6; j. Grav-3 − Grav-4; k. Grav-3 − Grav-5; l. Grav-3 − Grav-6; m. Grav-4 − Grav-5; n. Grav-4 − Grav-6; o. Grav-5 − Grav-6.
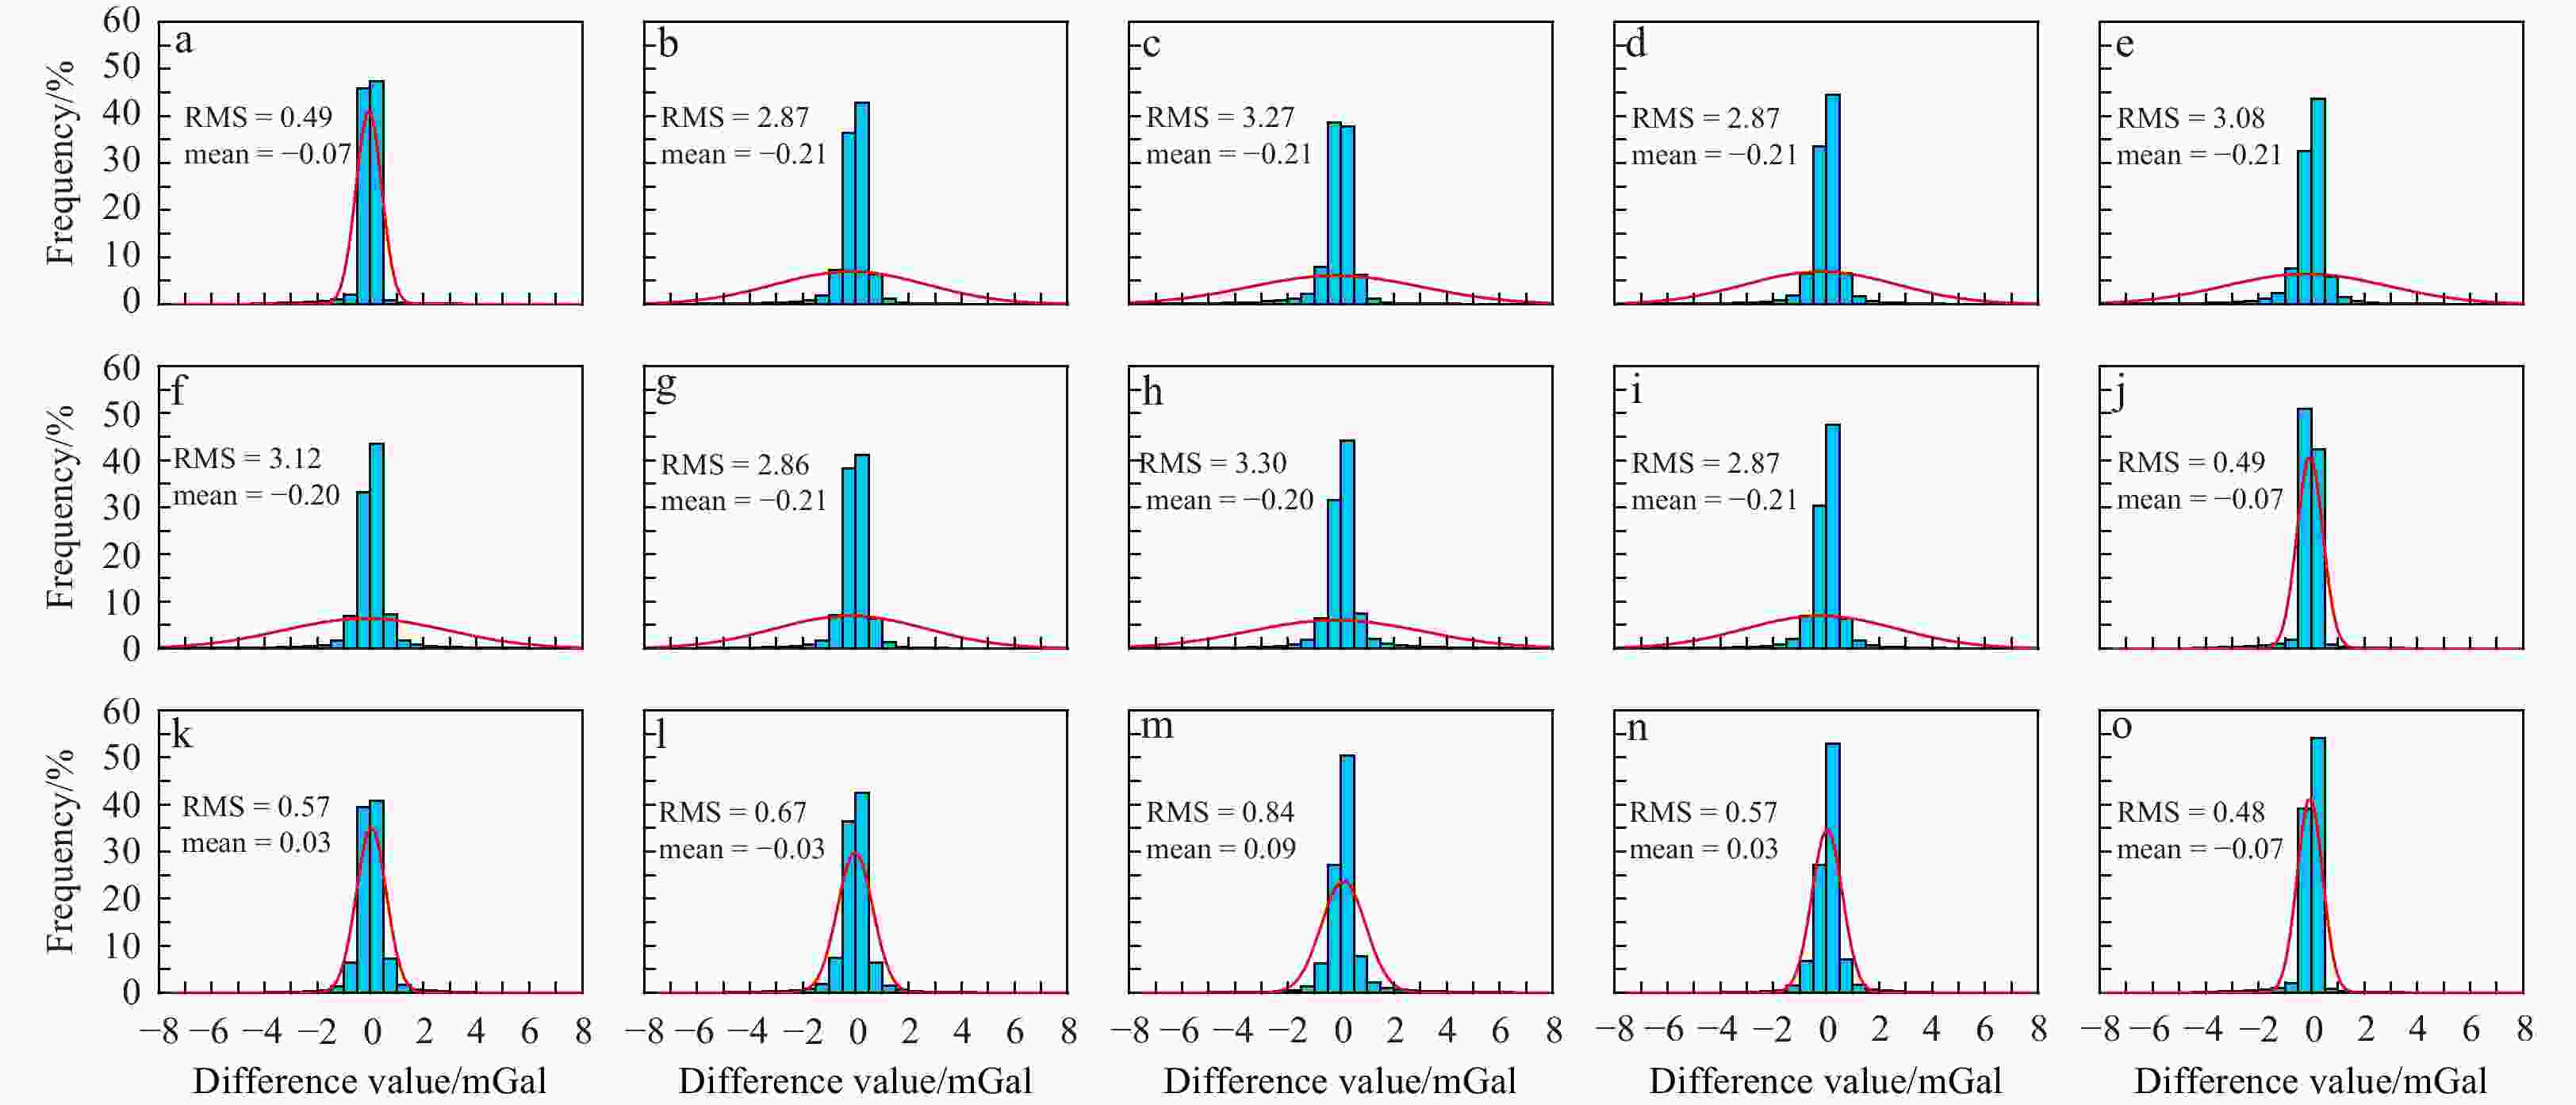
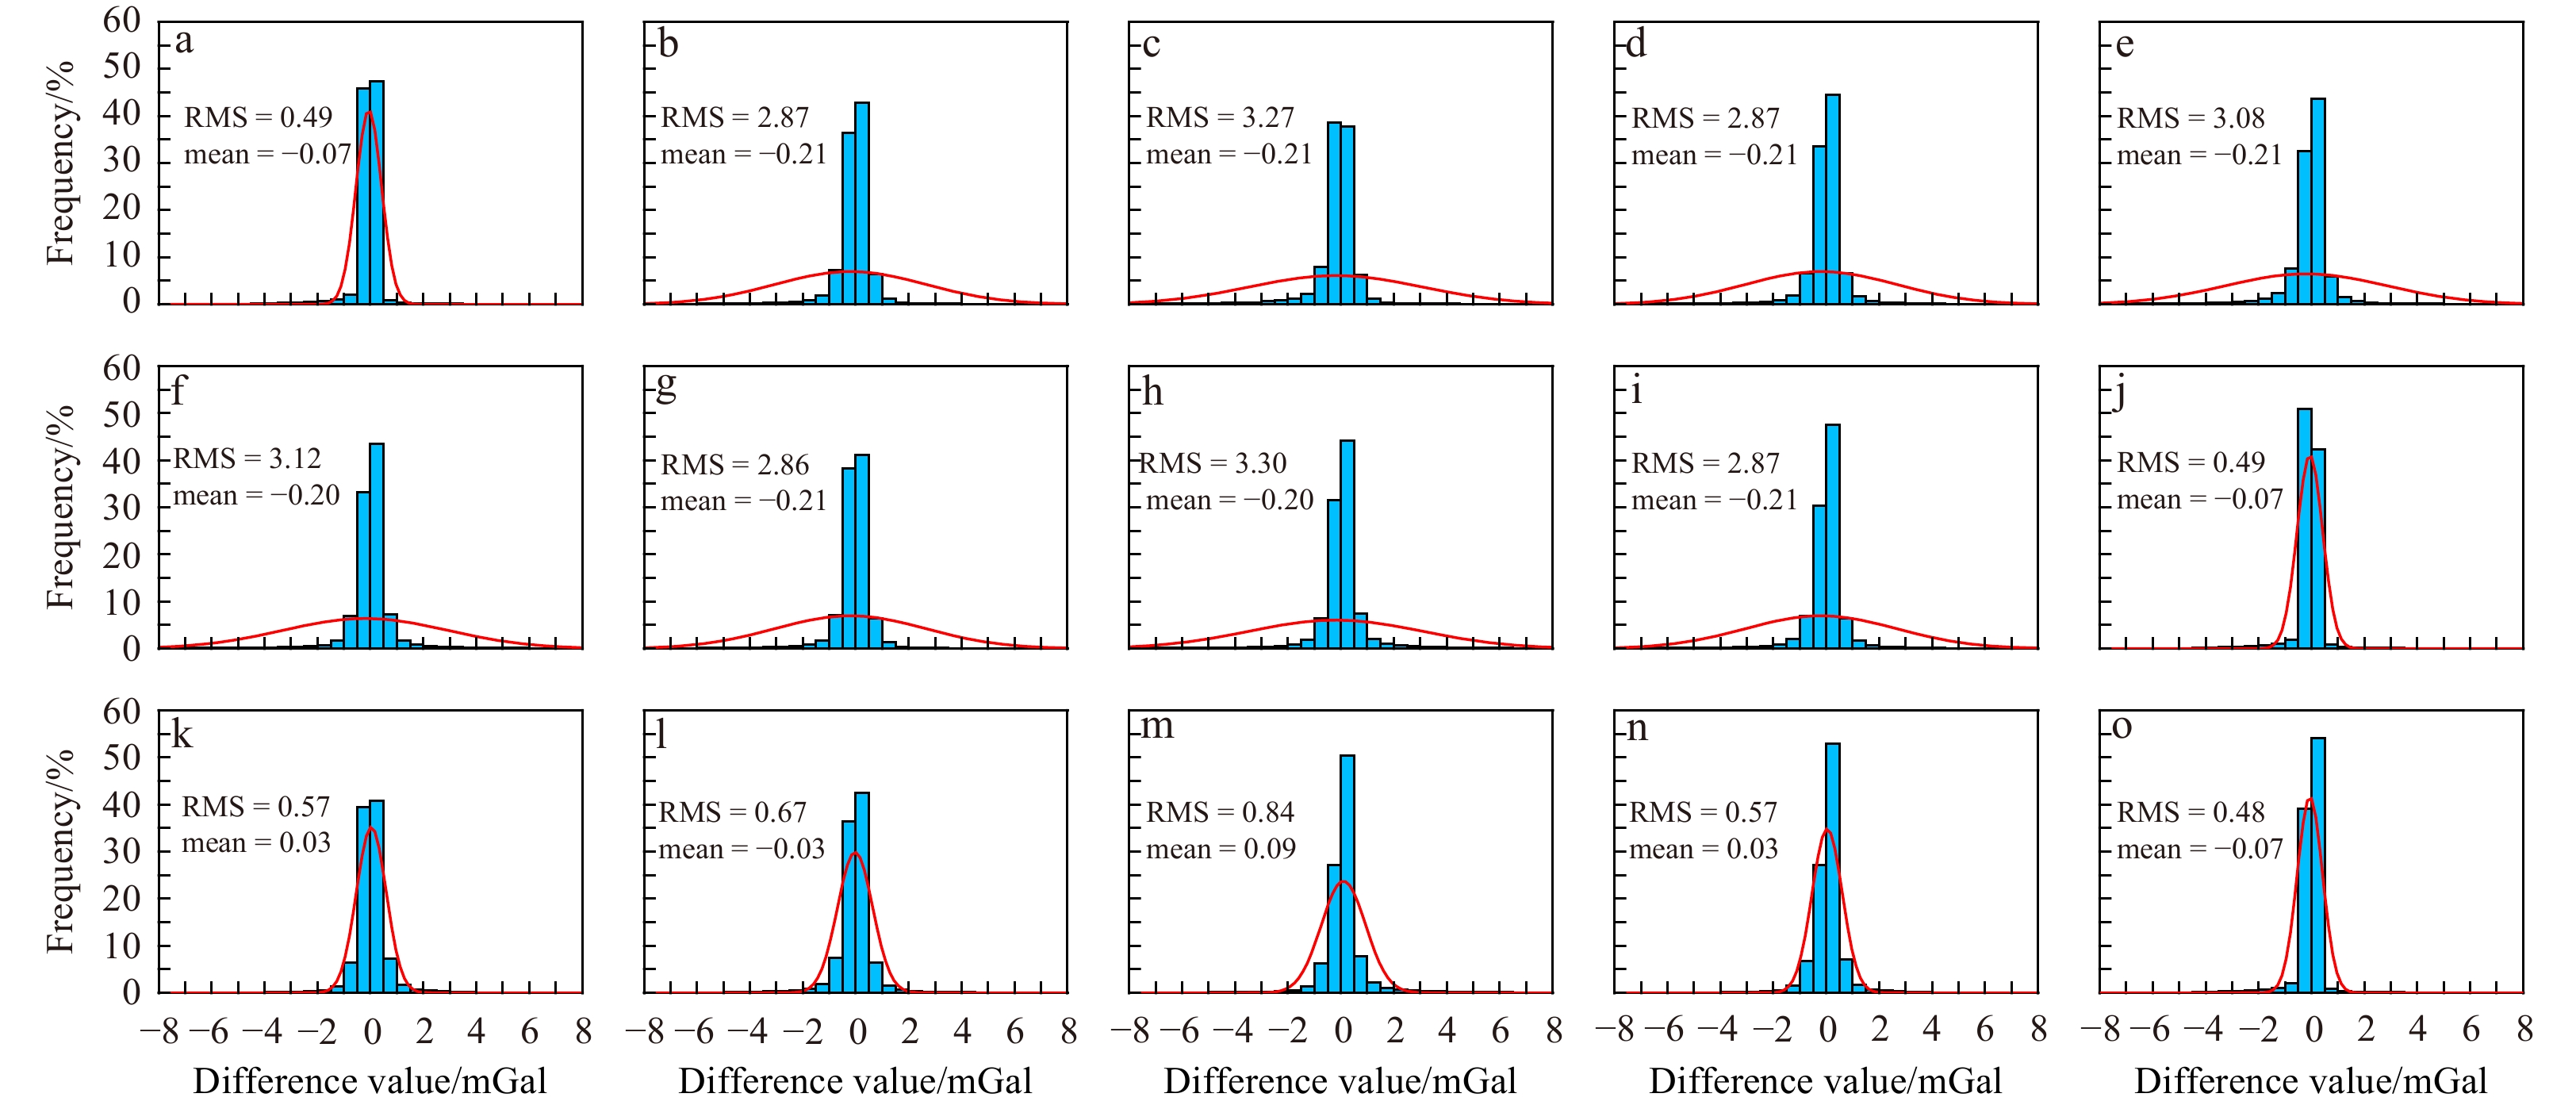
Figure 6. Histogram distribution of differences among the six marine gravity anomaly models. The red line is the normal distribution curve. a. Grav-1 − Grav-2; b. Grav-1 − Grav-3; c. Grav-1 − Grav-4; d. Grav-1 − Grav-5; e. Grav-1 − Grav-6; f. Grav-2 − Grav-3; g. Grav-2 − Grav-4; h. Grav-2 − Grav-5; i. Grav-2 − Grav-6; j. Grav-3 − Grav-4; k. Grav-3 − Grav-5; l. Grav-3 − Grav-6; m. Grav-4 − Grav-5; n. Grav-4 − Grav-6; o. Grav-5 − Grav-6.
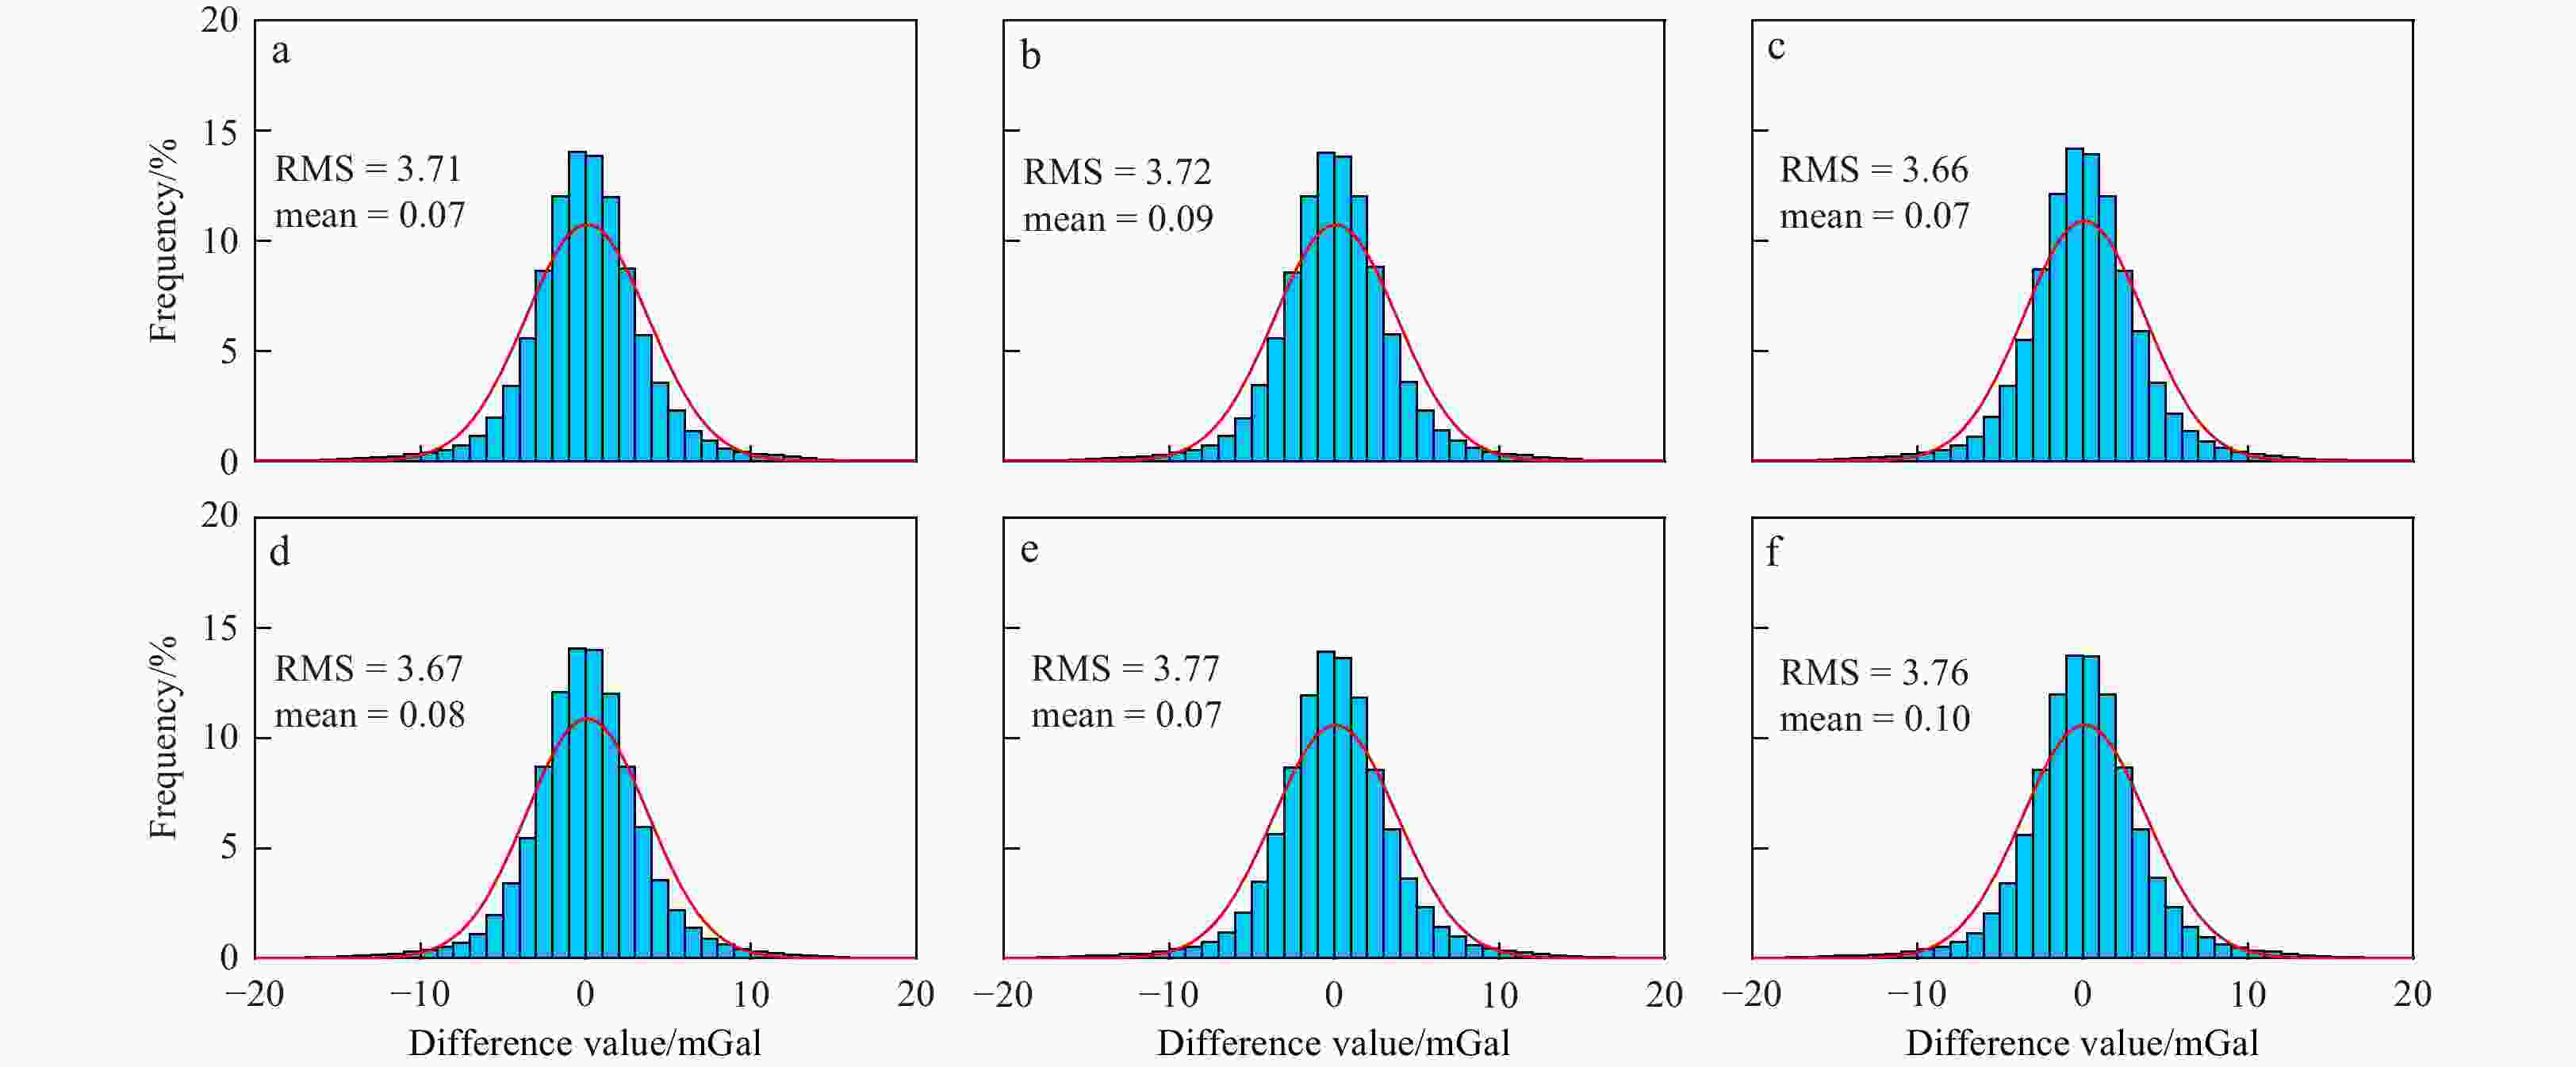
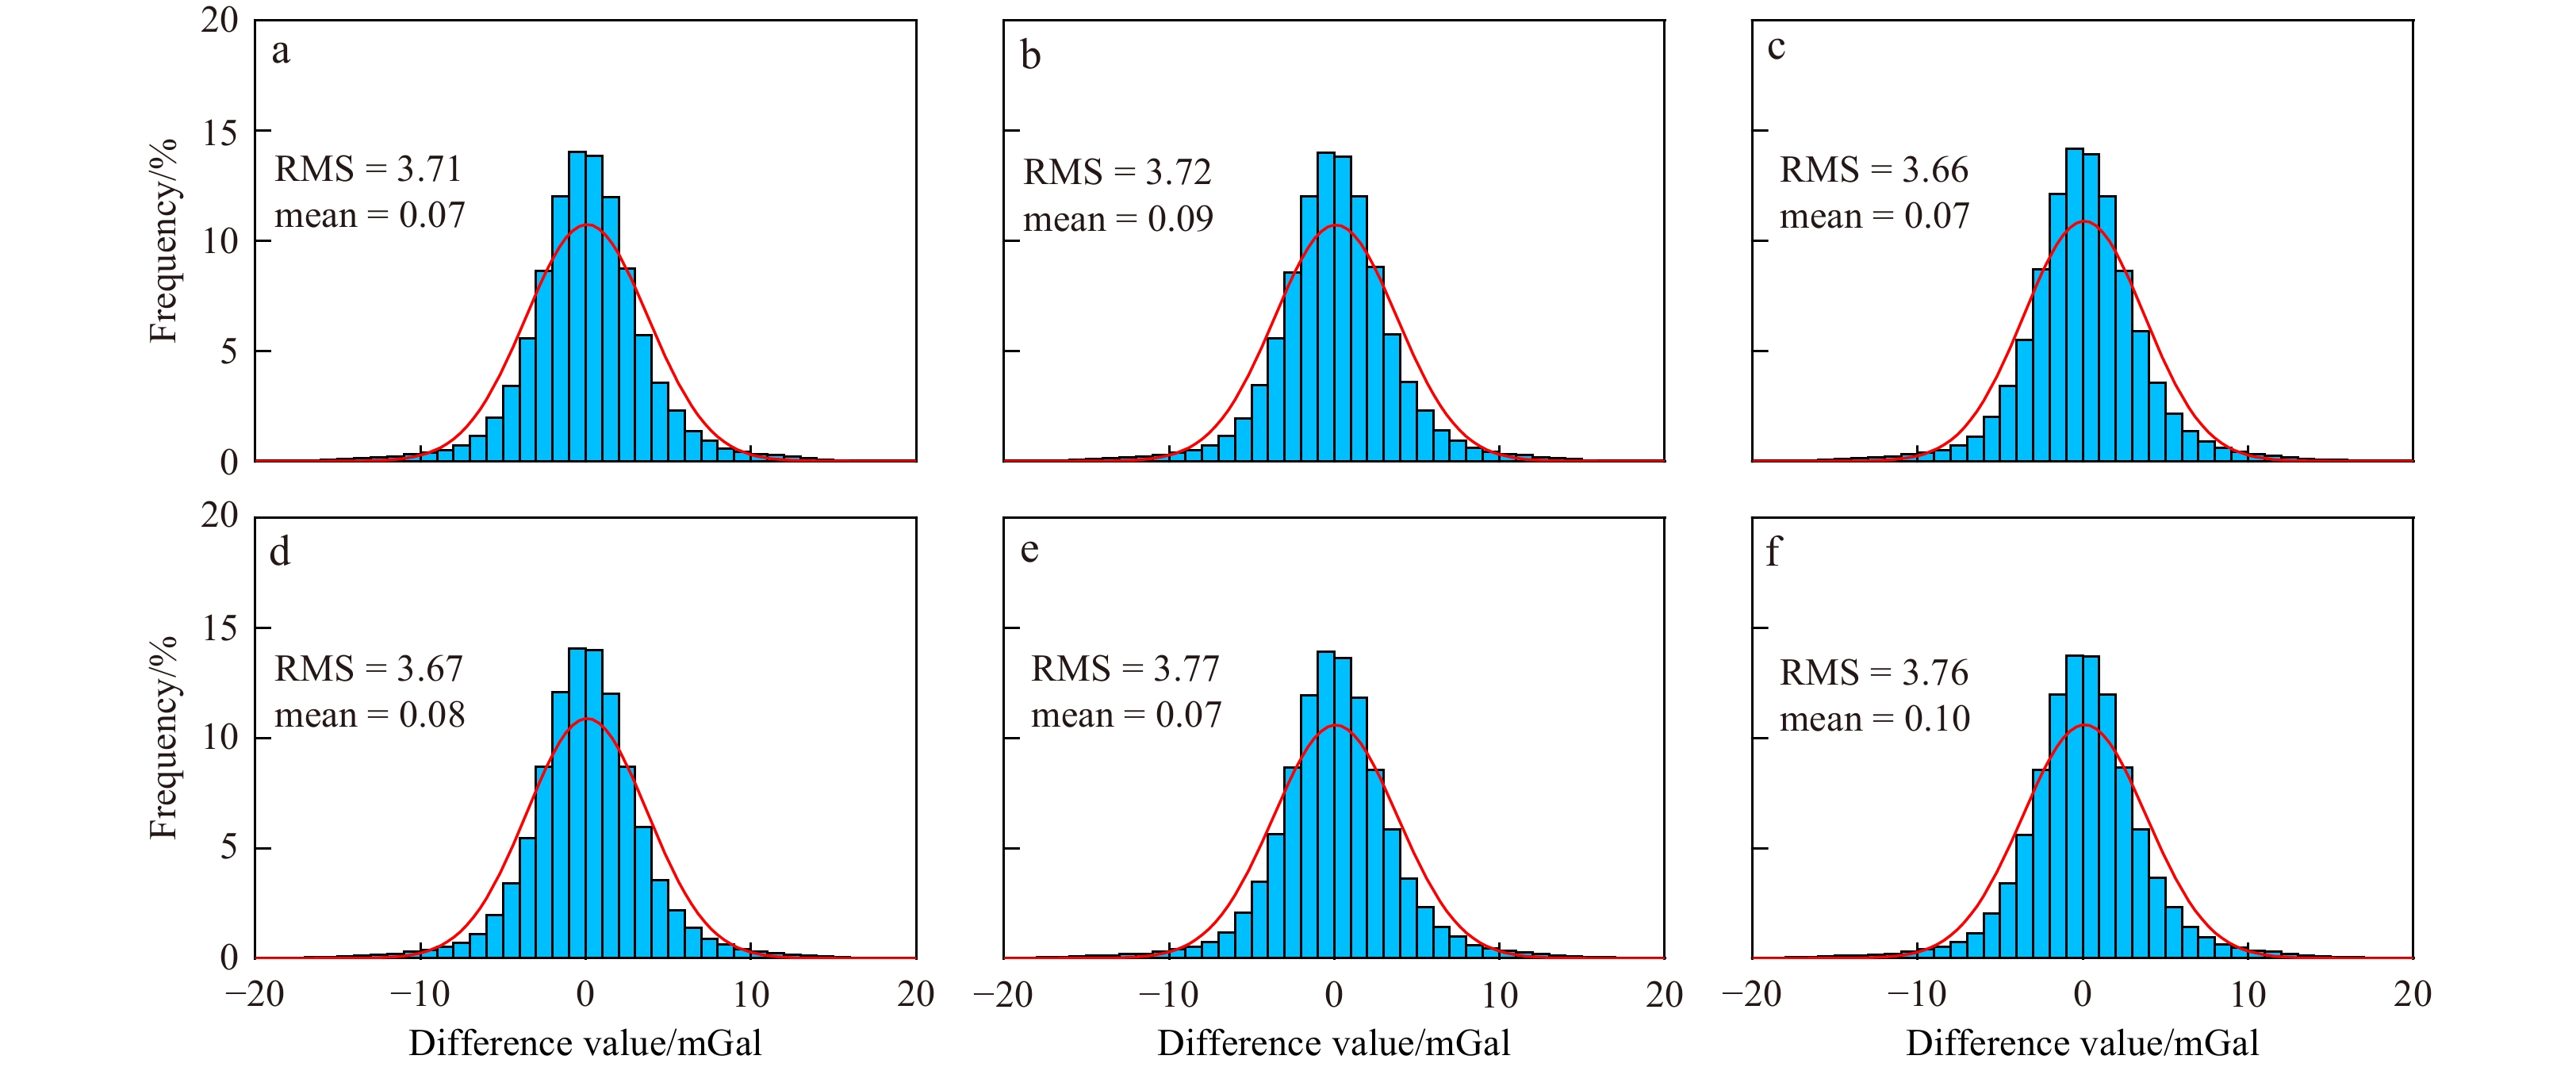
Figure 7. Histogram distribution of difference between marine gravity anomaly models and the ship-borne gravity data. a. Grav-1 − NCEI; b. Grav-2 − NCEI; c. Grav-3 − NCEI; d. Grav-4 − NCEI; e. Grav-5 − NCEI; f. Grav-6 − NCEI. The red line is the normal distribution curve.
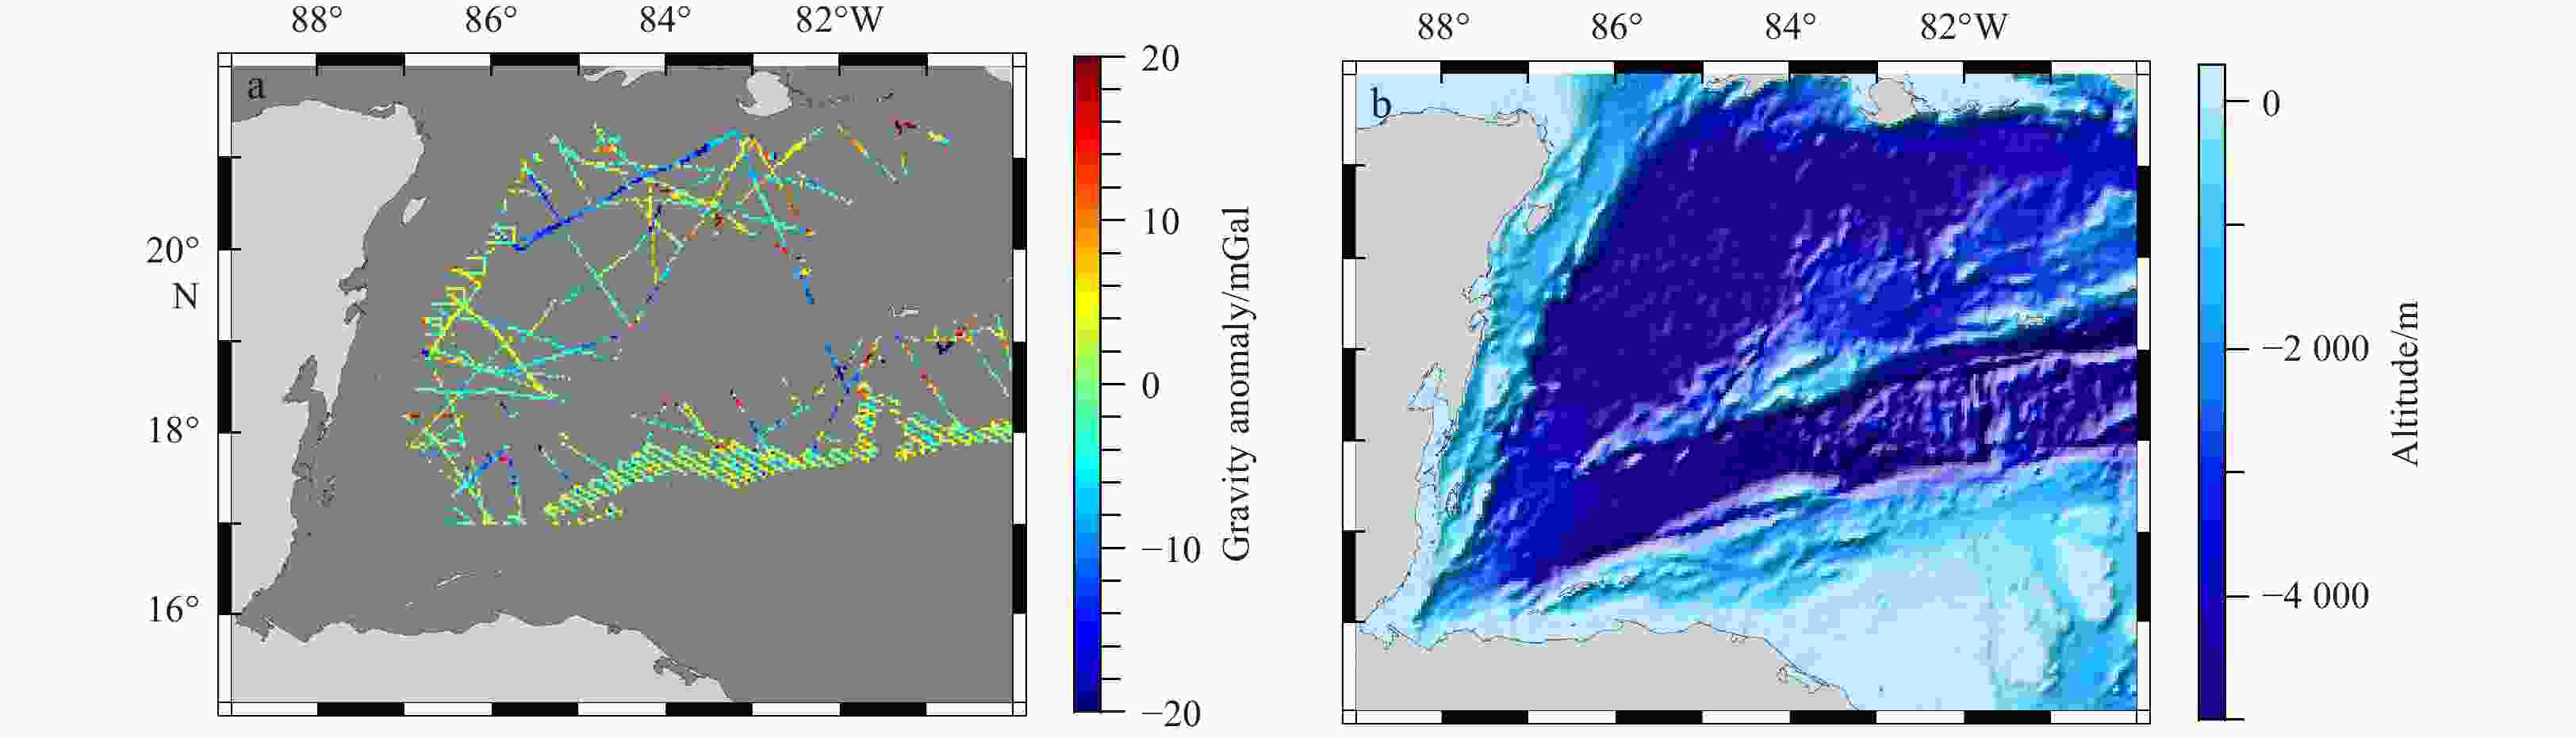
Figure 8. Distribution of differences between Grav-3 and the ship-borne gravity data at depth >4 km, and seafloor topography in this area. The light gray area is land; the dark gray area represents the marine region.
Table 1. Basic information of global mean sea surface models
Mean sea surface model Grid size Coverage area Altimeter data CNES_CLS15MSS 1' × 1' 80°S–84°N T/P + J1 + J2 + E2 + En + GFO + C2 DTU21MSS 1' × 1' 90°S–90°N T/P + J1 + J2 + E1 + E2 + En + Ic + Ge + GFO + C2 + S3A SDUST2020MSS 1' × 1' 80°S–84°N T/P + J1 + J2 + J3 + E1 + E2 + GFO + En + H2 + C2 + Al + S3A Note: T/P, Topex/Poseidon; J1, Jason-1; J2, Jason-2; J3, Jason-3; E1, ERS-1; E2, ERS-2; En, Envisat; GFO, GeoSat follow-on; Ic, Icesat; Ge, Geosat; H2, HY-2A; C2, Cryosat-2; Al, Saral/Altika; S3A, Sentinel-3A.  下载: 导出CSV
Table 2. Statistics of the difference between the ship-borne gravity data and XGM2019e_2159 gravity anomaly model
State Data number Difference value Max/mGal Min/mGal Mean/mGal STD/mGal RMS/mGal Before correction 266 361 181.11 −90.51 0.53 7.10 7.12 After correction 251 023 43.63 −40.73 0.04 3.98 3.98 After excluding routes1) 249 908 38.34 −36.31 0.04 3.91 3.91 Note: 1) Excluded routes are routes v2103 and u271gm.
下载: 导出CSV
Table 3. Statistical information of abnormal ship-borne routes
Route Data number Time STD before correction/mGal STD after correction/mGal v2103 680 1965/03/01–1965/03/10 15.76 15.03 u271gm 443 1971/06/27–1971/07/08 21.95 21.95
下载: 导出CSV
Table 4. Statistics of the difference between marine gravity field model and the ship-borne gravity data
Model Max/mGal Min/mGal Mean/mGal STD/mGal RMS/mGal Grav-1 38.53 –36.17 0.07 3.71 3.71 Grav-2 38.49 –37.64 0.09 3.72 3.72 Grav-3 39.31 –35.81 0.07 3.66 3.66 Grav-4 39.30 –35.79 0.08 3.67 3.67 Grav-5 38.19 –35.97 0.07 3.77 3.77 Grav-6 38.20 –35.94 0.10 3.76 3.76 XGM2019e_2159 38.34 –36.31 0.04 3.91 3.91
下载: 导出CSV
Table 5. Statistics of the difference between marine gravity anomaly models and the ship-borne gravity data at different distances from coastline
Model Distance from coastline/km Data number Max/mGal Min/mGal Mean/mGal STD/mGal RMS/mGal Grav-1 >0 249908 38.53 −36.17 0.07 3.71 3.71 >10 247401 38.53 −36.17 0.07 3.67 3.67 >20 241044 38.53 −36.17 0.07 3.59 3.59 >30 232606 38.53 −36.17 0.08 3.53 3.54 >40 223320 38.53 −36.17 0.09 3.50 3.50 >50 214231 37.81 −36.17 0.11 3.48 3.48 Grav-2 >0 249908 38.49 −37.64 0.09 3.72 3.72 >10 247401 38.49 −36.16 0.08 3.67 3.67 >20 241044 38.49 −36.16 0.07 3.59 3.59 >30 232606 38.49 −36.16 0.08 3.54 3.54 >40 223320 38.49 −36.16 0.09 3.50 3.51 >50 214231 37.88 −36.16 0.11 3.48 3.49 Grav−3 >0 249908 39.31 −35.81 0.07 3.66 3.66 >10 247401 39.31 −35.81 0.07 3.63 3.63 >20 241044 39.31 −35.81 0.07 3.56 3.56 >30 232606 39.31 −35.81 0.07 3.50 3.50 >40 223320 39.31 −35.81 0.09 3.47 3.47 >50 214231 37.91 −35.81 0.10 3.45 3.45 Grav-4 >0 249908 39.30 −35.79 0.08 3.67 3.67 >10 247401 39.30 −35.79 0.07 3.63 3.63 >20 241044 39.30 −35.79 0.07 3.56 3.56 >30 232606 39.30 −35.79 0.07 3.51 3.51 >40 223320 39.30 −35.79 0.09 3.48 3.48 >50 214231 37.99 −35.79 0.10 3.46 3.46 Grav-5 >0 249908 38.19 −35.97 0.07 3.77 3.77 >10 247401 38.19 −35.97 0.06 3.74 3.74 >20 241044 38.19 −35.97 0.07 3.66 3.66 >30 232606 38.19 −35.97 0.08 3.60 3.60 >40 223320 38.19 −35.97 0.09 3.57 3.57 >50 214231 38.19 −35.97 0.10 3.55 3.55 Grav-6 >0 249908 38.20 −35.94 0.10 3.76 3.76 >10 247401 38.20 −35.94 0.09 3.74 3.74 >20 241044 38.20 −35.94 0.08 3.66 3.66 >30 232606 38.20 −35.94 0.09 3.60 3.61 >40 223320 38.20 −35.94 0.10 3.57 3.57 >50 214231 38.20 −35.94 0.11 3.55 3.55
下载: 导出CSV
Table 6. Statistics of differences between marine gravity anomaly models and the ship-borne gravity data measured values at different depths
Model Depth/km Data number Max/mGal Min/mGal Mean/mGal STD/mGal RMS/mGal Grav–1 <1 93723 24.69 –34.73 –0.29 3.33 3.34 1–2 48005 37.81 –36.17 0.07 4.31 4.31 2–3 37387 38.53 –33.80 –0.44 3.87 3.89 3–4 56472 34.80 –35.78 –0.35 3.22 3.23 >4 14321 37.72 –33.56 0.43 4.92 4.94 Grav–2 <1 93723 24.71 –37.64 –0.26 3.35 3.36 1–2 48005 37.88 –36.16 0.09 4.31 4.31 2–3 37387 38.49 –33.86 0.43 3.87 3.90 3–4 56472 34.74 –35.77 0.35 3.22 3.24 >4 14321 37.73 –33.59 0.42 4.92 4.94 Grav–3 <1 93723 25.76 –33.05 –0.29 3.25 3.26 1–2 48005 37.91 –35.81 0.08 4.24 4.24 2–3 37387 39.31 –33.36 0.43 3.83 3.86 3–4 56472 35.85 –35.62 0.35 3.20 3.22 >4 14321 37.33 –33.82 0.42 4.91 4.93 Grav–4 <1 93723 25.80 –33.07 –0.26 3.25 3.26 1–2 48005 37.99 –35.79 0.09 4.25 4.25 2–3 37387 39.30 –33.46 0.41 3.84 3.86 3–4 56472 35.80 –35.61 0.35 3.21 3.23 >4 14321 37.37 –33.86 0.41 4.91 4.92 Grav–5 <1 93723 23.99 –35.74 –0.30 3.30 3.32 1–2 48005 38.12 –35.97 0.06 4.47 4.47 2–3 37387 38.19 –34.07 0.44 3.95 3.97 3–4 56472 36.29 –35.31 0.35 3.25 3.27 >4 14321 37.69 –34.41 0.48 5.02 5.04 Grav–6 <1 93723 24.04 –35.51 –0.25 3.29 3.30 1–2 48005 38.17 –35.94 0.11 4.47 4.47 2–3 37387 38.20 –34.09 0.43 3.95 3.97 3–4 56472 36.22 –35.31 0.35 3.25 3.27 >4 14321 37.70 –34.44 0.48 5.02 5.04
下载: 导出CSV
Table 7. Statistics of differences between marine gravity anomaly models and the ship-borne gravity data at different submarine topography gradients
Model Seafloor topographic gradient/(m·arcmin−1) Data number Max/mGal Min/mGal Mean/mGal STD/mGal RMS/mGal Grav-1 <50 182668 37.81 –35.78 0.07 3.25 3.25 50–100 28246 37.29 –31.79 –0.03 4.14 4.14 100–150 14099 34.07 –33.25 0.07 4.57 4.57 150–200 7893 37.72 –33.56 0.18 4.74 4.74 200–250 5060 35.58 –30.24 0.06 4.93 4.93 >250 11925 38.53 –36.17 0.30 6.01 6.01 Grav-2 <50 182668 37.88 –35.77 0.09 3.25 3.25 50–100 28246 37.29 –37.60 –0.03 4.15 4.15 100–150 14099 34.01 –37.64 0.04 4.66 4.66 150–200 7893 37.73 –33.59 0.19 4.75 4.75 200–250 5060 35.54 –30.61 0.04 4.99 4.99 >250 11925 38.49 –36.16 0.32 6.01 6.02 Grav-3 <50 182668 37.91 –35.62 0.06 3.22 3.22 50–100 28246 36.85 –31.76 –0.02 4.06 4.06 100–150 14099 34.82 –34.04 0.11 4.40 4.40 150–200 7893 37.33 –33.82 0.18 4.67 4.67 200–250 5060 35.55 –30.20 0.05 4.93 4.93 >250 11925 39.31 –35.81 0.32 5.93 5.93 Grav-4 <50 182668 37.99 –35.61 0.08 3.22 3.22 50–100 28246 36.88 –31.98 –0.03 4.07 4.07 100–150 14099 34.79 –34.06 0.07 4.45 4.45 150–200 7893 37.37 –33.86 0.18 4.68 4.68 200–250 5060 35.58 –30.24 0.06 4.93 4.93 >250 11925 39.30 –35.79 0.33 5.93 5.94 Grav-5 <50 182668 38.12 –35.74 0.06 3.27 3.28 50–100 28246 36.99 –31.05 –0.02 4.24 4.24 100–150 14099 33.17 –33.38 0.14 4.58 4.59 150–200 7893 37.69 –34.41 0.18 4.89 4.89 200–250 5060 35.95 –30.33 0.04 5.14 5.14 >250 11925 38.19 –35.97 0.30 6.20 6.21 Grav-6 <50 182668 38.17 –35.51 0.09 3.27 3.27 50–100 28246 36.98 –31.32 –0.01 4.24 4.24 100–150 14099 33.17 –33.48 0.13 4.59 4.59 150–200 7893 37.70 –34.44 0.21 4.90 4.90 200–250 5060 36.04 –30.34 0.07 5.14 5.14 >250 11925 38.20 –35.94 0.33 6.20 6.21
下载: 导出CSV
-
Andersen O B, Abulaitijiang A, Zhang Shengjun, et al. 2021. A new high resolution mean sea surface (DTU21MSS) for improved sea level monitoring. In: Proceedings of EGU General Assembly 2021. Vienna: EGU, Andersen O B, Knudsen P, Berry P A M. 2010. The DNSC08GRA global marine gravity field from double retracked satellite altimetry. Journal of Geodesy, 84(3): 191–199. doi: 10.1007/s00190-009-0355-9 Andersen O B, Vest A L, Knudsen P. 2005. The KMS04 multi-mission mean sea surface. In: Proceedings of Workshop: GOCINA: Improving Modelling of Ocean Transport and Climate Prediction in the North Atlantic Region Using GOCE Gravimetry. Novotel, Luxembourg: Centre European de Geodynamique et de Seimologie Chelton D B, Walsh E J, MacArthur J L. 1989. Pulse compression and sea level tracking in satellite altimetry. Journal of Atmospheric and Oceanic Technology, 6(3): 407–438. doi: 10.1175/1520-0426(1989)006<0407:PCASLT>2.0.CO;2 Fairhead J D, Green C M, Odegard M E. 2001. Satellite-derived gravity having an impact on marine exploration. The Leading Edge, 20(8): 873–876. doi: 10.1190/1.1487298 Fu L L, Cazenave A. 2001. Satellite Altimetry and Earth Sciences: A Handbook of Techniques and Applications. San Diego: Academic Press Gopalapillai S. 1974. Non-global recovery of gravity anomalies from a combination of terrestrial and satellite altimetry data. Columbus: Ohio State University Gozzard S, Kusznir N, Franke D, et al. 2019. South China Sea crustal thickness and oceanic lithosphere distribution from satellite gravity inversion. Petroleum Geoscience, 25(1): 112–128. doi: 10.1144/petgeo2016-162 Guo Jinyun, Chang Xiaotao, Hwang C, et al. 2010. Oceanic surface geostrophic velocities determined with satellite altimetric crossover method. Chinese Journal of Geophysics, 53(6): 926–934. doi: 10.1002/cjg2.1563 Guo Jinyun, Luo Hongxin, Zhu Chengcheng, et al. 2022. Accuracy comparison of marine gravity derived from HY-2A/GM and CryoSat-2 altimetry data: a case study in the Gulf of Mexico. Geophysical Journal International, 230(2): 1267–1279. doi: 10.1093/gji/ggac114 Hwang C. 1998. Inverse Vening Meinesz formula and deflection-geoid formula: applications to the predictions of gravity and geoid over the South China Sea. Journal of Geodesy, 72(5): 304–312. doi: 10.1007/s001900050169 Hwang C, Chang E T Y. 2014. Seafloor secrets revealed. Science, 346: 32–33. doi: 10.1126/science.1260459 Hwang C, Parsons B. 1995. Gravity anomalies derived from Seasat, Geosat, ERS-1 and TOPEX/POSEIDON altimetry and ship gravity: a case study over the Reykjanes Ridge. Geophysical Journal International, 122(2): 551–568. doi: 10.1111/j.1365-246X.1995.tb07013.x Ismael M. 2014. Tectonostratigraphic stages in the Mesozoic opening and subsidence of the Gulf of Mexico based on deep-penetration seismic reflection data in the salt-free eastern part of the basin [dissertation]. Houston: University of Houston Jin Taoyong, Li Jiancheng. 2012. Calibration of the linear drift of mean sea level change from satellite altimetry using tide gauge observations. Geomatics and Information Science of Wuhan University (in Chinese), 37(10): 1194–1197. doi: 10.13203/j.whugis2012.10.020 Li Zhen, Guo Jinyun, Ji Bing, et al. 2022a. A review of marine gravity field recovery from satellite altimetry. Remote Sensing, 14(19): 4790. doi: 10.3390/rs14194790 Li Yang, Guo Jinyun, Sun Yu, et al. 2022b. Inversion of global sea level change and its component contributions by combining time-varying gravity data and altimetry data. Acta Geodaetica et Cartographica Sinica, 51(8): 1768–1778. doi: 10.11947/j.AGCS.2022.20210169 Liu Liang, Jiang Xiaoguang, Liu Shanwei, et al. 2016. Calculating the marine gravity anomaly of the South China Sea based on the inverse stokes formula. IOP Conference Series: Earth and Environmental Science, 46: 012062. doi: 10.1088/1755-1315/46/1/012062 Mulet S, Rio M H, Etienne H, et al. 2021. The new CNES-CLS18 global mean dynamic topography. Ocean Science, 17(3): 789–808. doi: 10.5194/os-17-789-2021 Pujol M I, Schaeffer P, Faugère Y, et al. 2018. Gauging the improvement of recent mean sea surface models: a new approach for identifying and quantifying their errors. Journal of Geophysical Research: Oceans, 123(8): 5889–5911. doi: 10.1029/2017JC013503 Rapp R H. 1979. Geos 3 data processing for the recovery of geoid undulations and gravity anomalies. Journal of Geophysical Research: Solid Earth, 84(B8): 3784–3792. doi: 10.1029/JB084iB08p03784 Sandwell D, Garcia E, Soofi K, et al. 2013. Toward 1-mGal accuracy in global marine gravity from CryoSat-2, Envisat, and Jason-1. The Leading Edge, 32(8): 892–899. doi: 10.1190/tle32080892.1 Sandwell D T, Müller R D, Smith W H F, et al. 2014. New global marine gravity model from CryoSat-2 and Jason-1 reveals buried tectonic structure. Science, 346(6205): 65–67. doi: 10.1126/science.1258213 Sandwell D T, Smith W H F. 1997. Marine gravity anomaly from Geosat and ERS 1 satellite altimetry. Journal of Geophysical Research: Solid Earth, 102(B5): 10039–10054. doi: 10.1029/96jb03223 Smith G N. 1974. Mean gravity anomaly prediction from terrestrial gravity data and satellite altimetry data [dissertation]. Columbus: The Ohio State University Columbus Stanev E V, Peneva E L. 2001. Regional sea level response to global climatic change: Black Sea examples. Global and Planetary Change, 32(1): 33–47. doi: 10.1016/S0921-8181(01)00148-5 Wan Xiaoyun, Yu Jinhai. 2013. Mean dynamic topography calculated by GOCE gravity field model and CNES-CLS2010 mean sea surface height. Chinese Journal of Geophysics (in Chinese), 56(6): 1850–1856. doi: 10.6038/cjg20130607 Yang Junjun, Jekeli C, Liu Lintao. 2018. Seafloor topography estimation from gravity gradients using simulated annealing. Journal of Geophysical Research: Solid Earth, 123(8): 6958–6975. doi: 10.1029/2018jb015883 Yuan Jiajia, Guo Jinyun, Zhu Chengcheng, et al. 2021. High-resolution sea level change around China seas revealed through multi-satellite altimeter data. International Journal of Applied Earth Observation and Geoinformation, 102: 102433. doi: 10.1016/j.jag.2021.102433 Yuan Jiajia, Guo Jinyun, Zhu Chengcheng, et al. 2023. SDUST2020 MSS: A global 1′ × 1′ mean sea surface model determined from multi-satellite altimetry data. Earth System Science Data, 15(1): 155–169. doi: 10.5194/essd-15-155-2023 Zaron E D. 2019. Simultaneous estimation of ocean tides and underwater topography in the Weddell Sea. Journal of Geophysical Research: Oceans, 124(5): 3125–3148. doi: 10.1029/2019JC015037 Zhu Chengcheng, Guo Jinyun, Hwang C, et al. 2019. How HY-2A/GM altimeter performs in marine gravity derivation: assessment in the South China Sea. Geophysical Journal International, 219(2): 1056–1064. doi: 10.1093/gji/ggz330 Zhu Chengcheng, Guo Jinyun, Yuan Jiajia, et al. 2021. Refining altimeter-derived gravity anomaly model from shipborne gravity by multi-layer perceptron neural network: a case in the South China Sea. Remote Sensing, 13(4): 607. doi: 10.3390/rs13040607 Zhu Chengcheng, Guo Jinyun, Yuan Jiajia, et al. 2022. SDUST2021GRA: Global marine gravity anomaly model recovered from Ka-band and Ku-band satellite altimeter data. Earth System Science Data, 14(10): 4589–4606. doi: 10.5194/essd-14-4589-2022 Zingerle P, Pail R, Gruber T, et al. 2020. The combined global gravity field model XGM2019e. Journal of Geodesy, 94(7): 66. doi: 10.1007/s00190-020-01398-0 -


 点击查看大图
计量
- 文章访问数: 403
- HTML全文浏览量: 157
- PDF下载量: 26
- 被引次数: 0

