Effects of nutrient limitations on the sinking velocity of Thalassiosira weissflogii
-
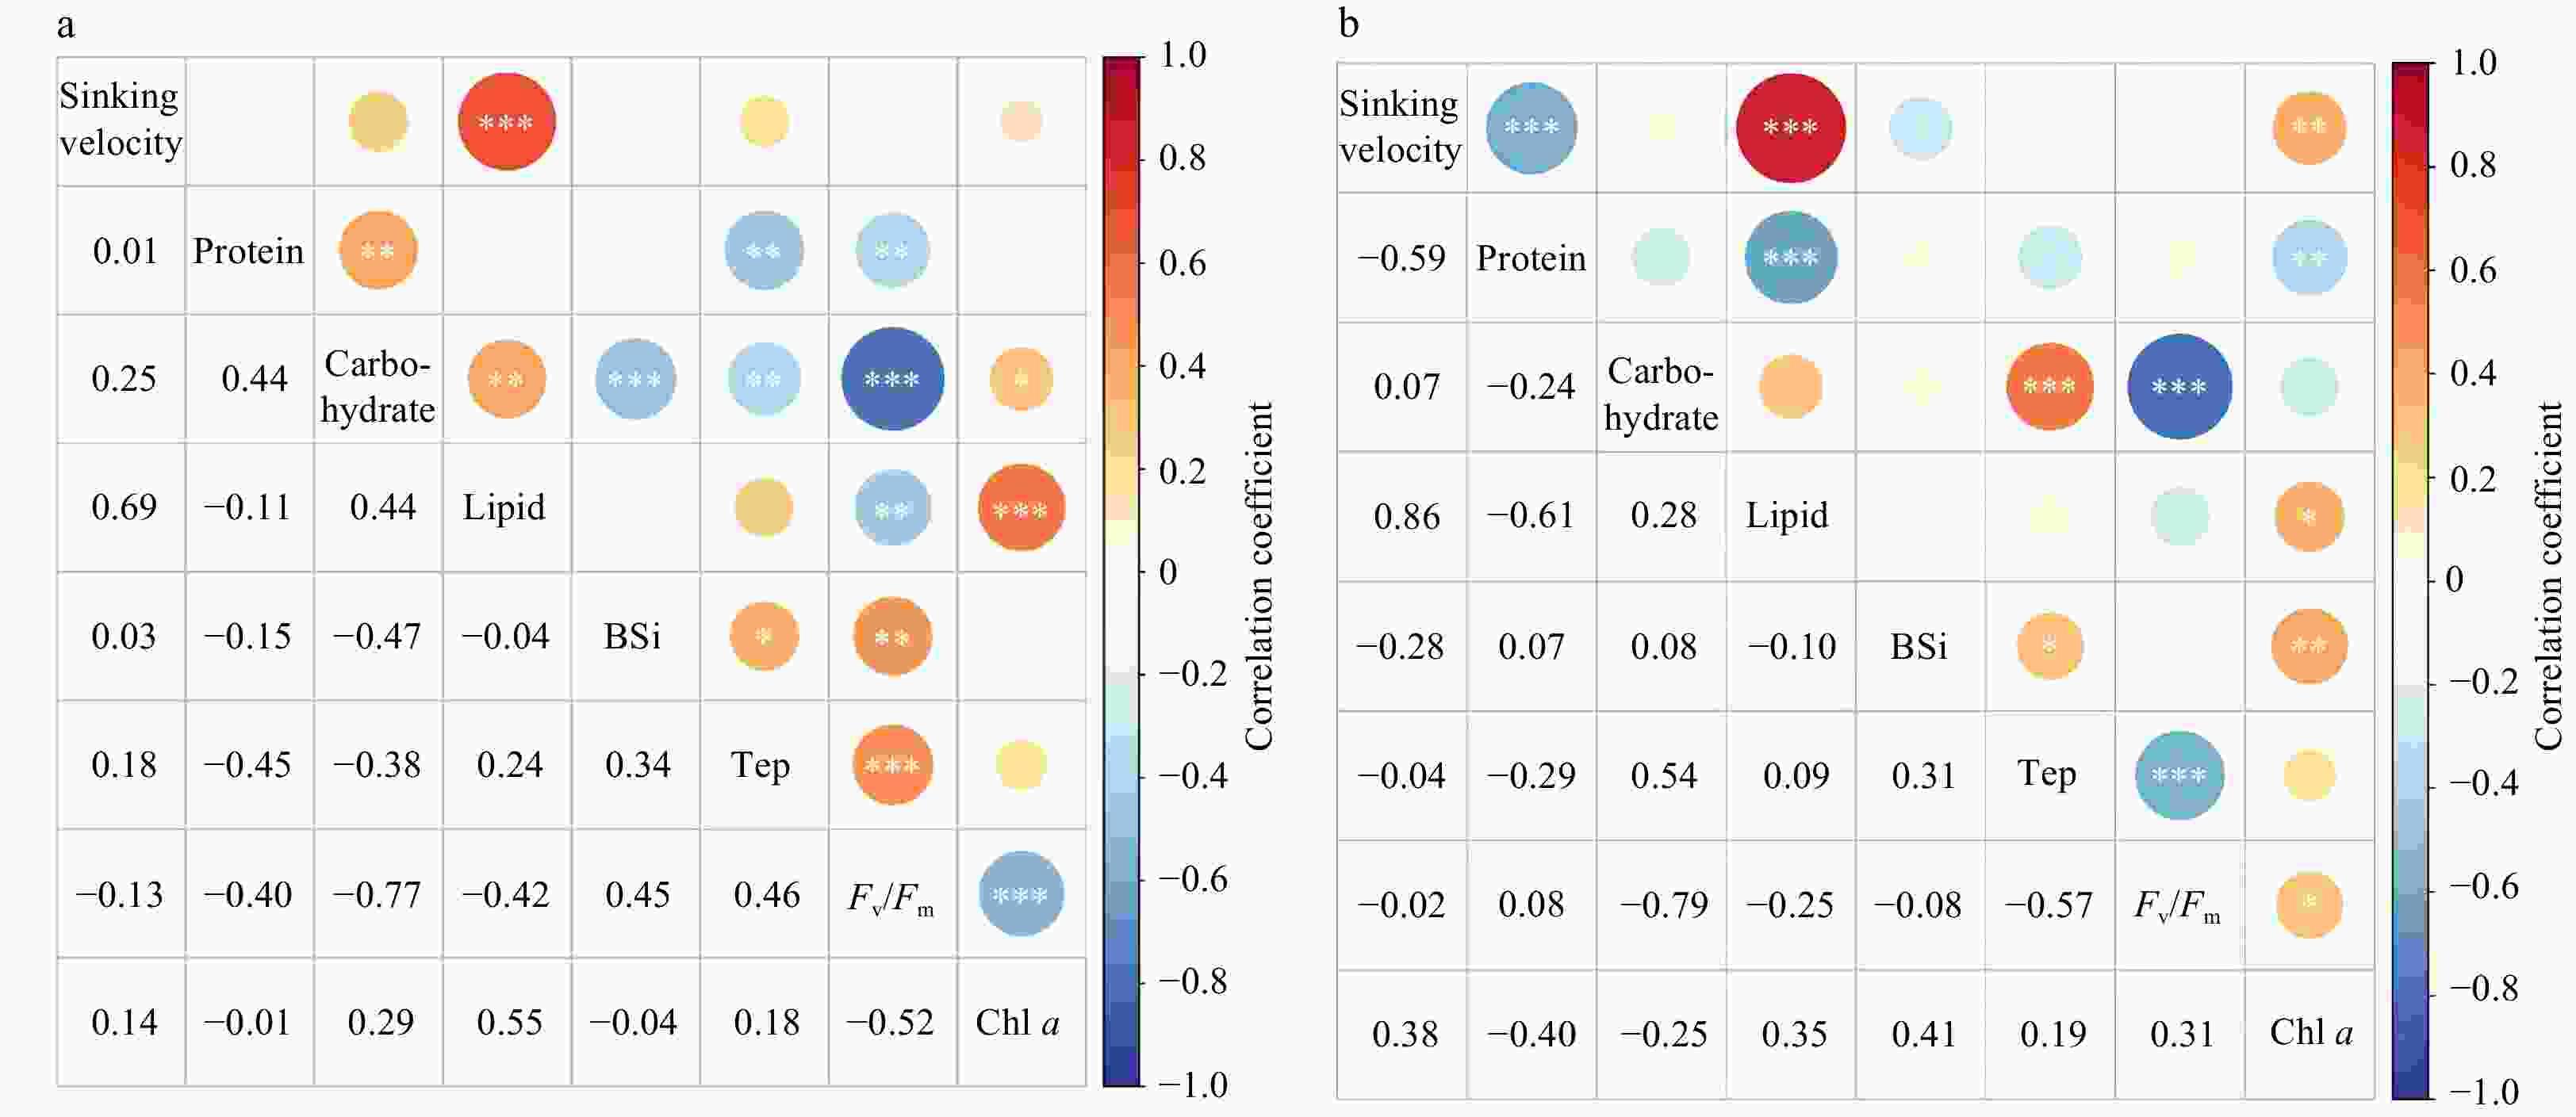
Abstract: The sinking of diatoms is critical to the formation of oceanic biological pumps and coastal hypoxic zones. However, little is known about the effects of different nutrient restrictions on diatom sinking. In this study, we measured the sinking velocity (SV) of Thalassiosira weissflogii using a new phytoplankton video observation instrument and analyzed major biochemical components under varying nutrient conditions. Our results showed that the SV of T. weissflogii under different nutrient limitation conditions varied substantially. The highest SV of (1.77 ± 0.02) m/d was obtained under nitrate limitation, significantly surpassing that under phosphate limitation at (0.98 ± 0.13) m/d. As the nutrient limitation was released, the SV steadily decreased to (0.32 ± 0.03) m/d and (0.15 ± 0.05) m/d, respectively. Notably, under conditions with limited nitrate and phosphate concentrations, the SV values of T. weissflogii significantly positively correlated with the lipid content (P < 0.001), with R2 values of 0.86 and 0.69, respectively. The change of the phytoplankton SV was primarily related to the intracellular composition, which is controlled by nutrient conditions but did not significantly correlate with transparent extracellular polymer and biosilica contents. The results of this study help to understand the regulation of the vertical sinking process of diatoms by nutrient restriction and provide new insights into phytoplankton dynamics and their relationship with the marine nutrient structure.
-
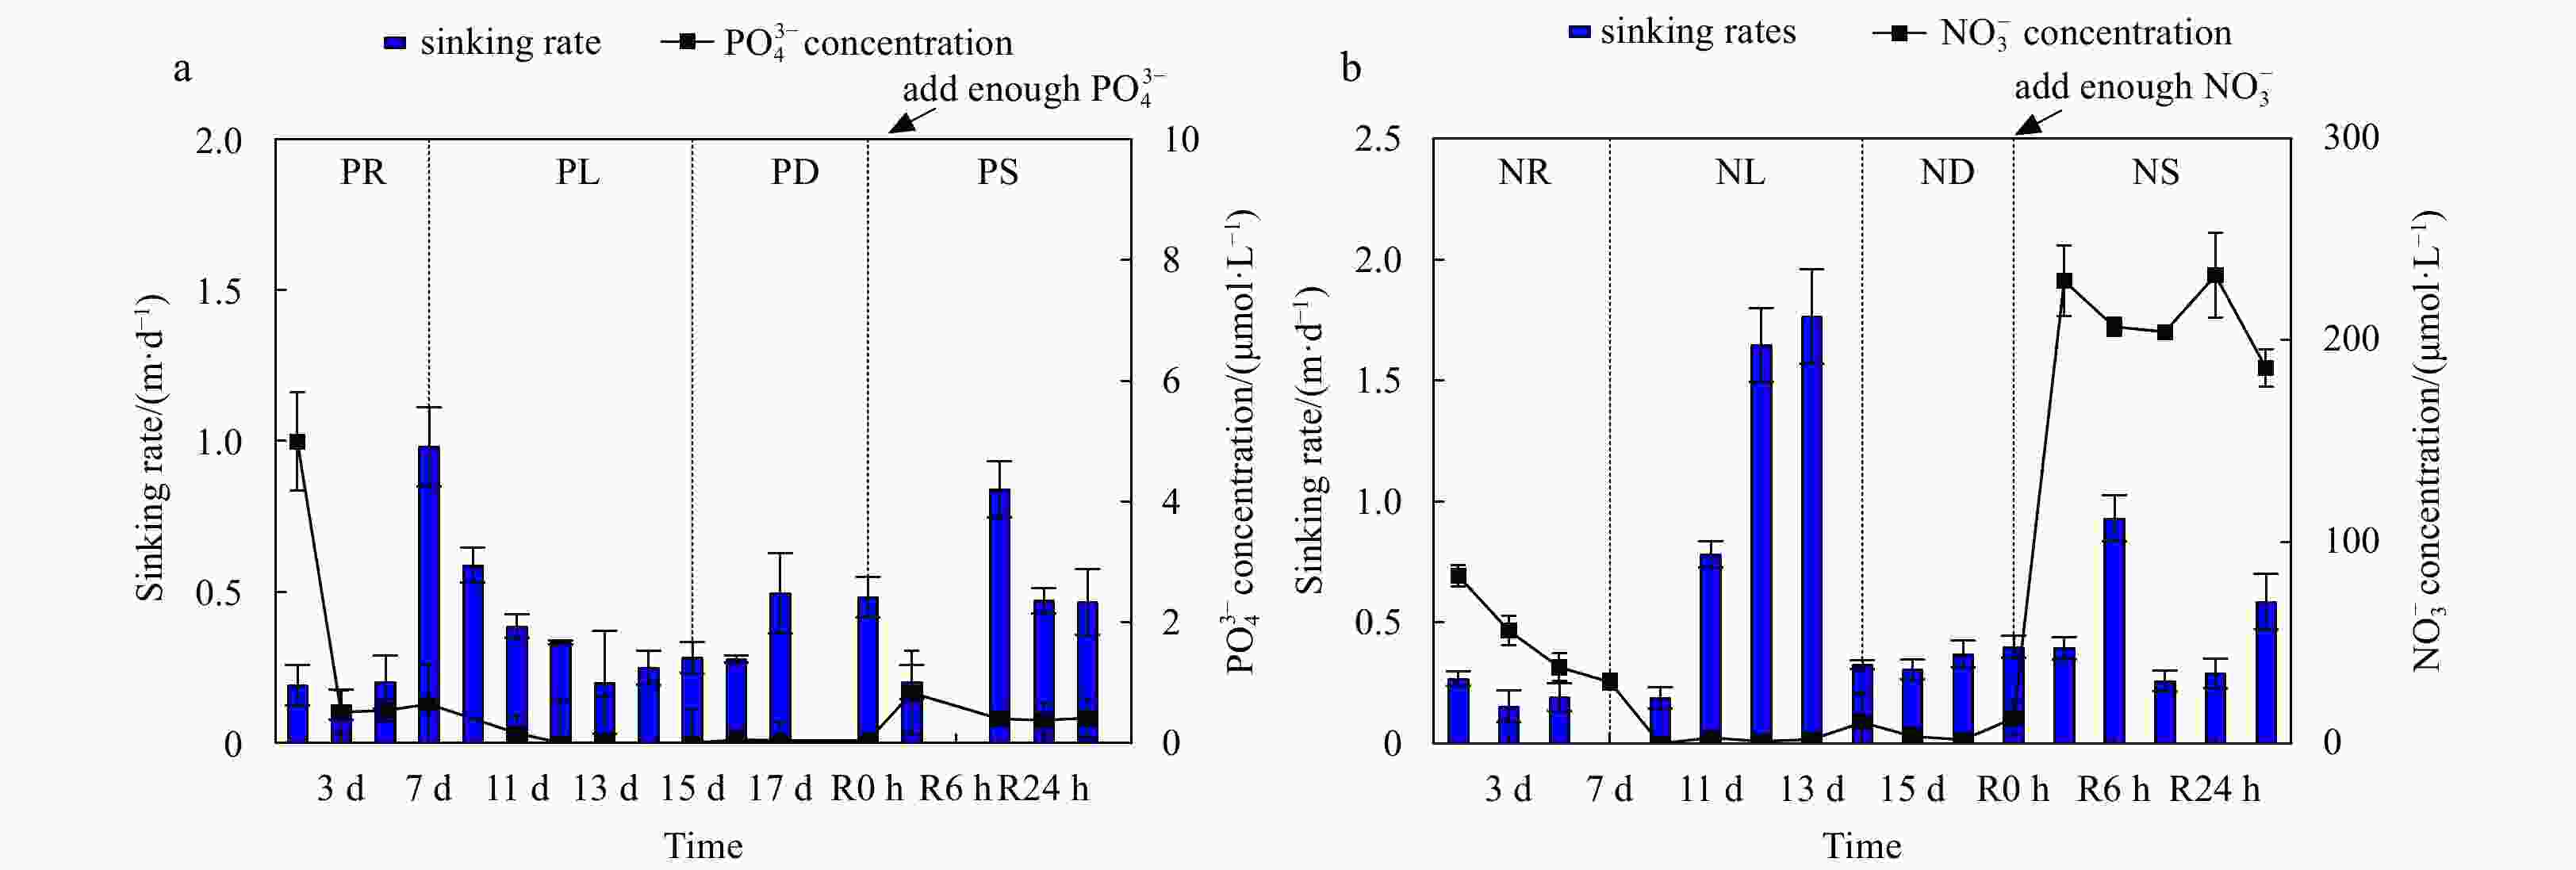
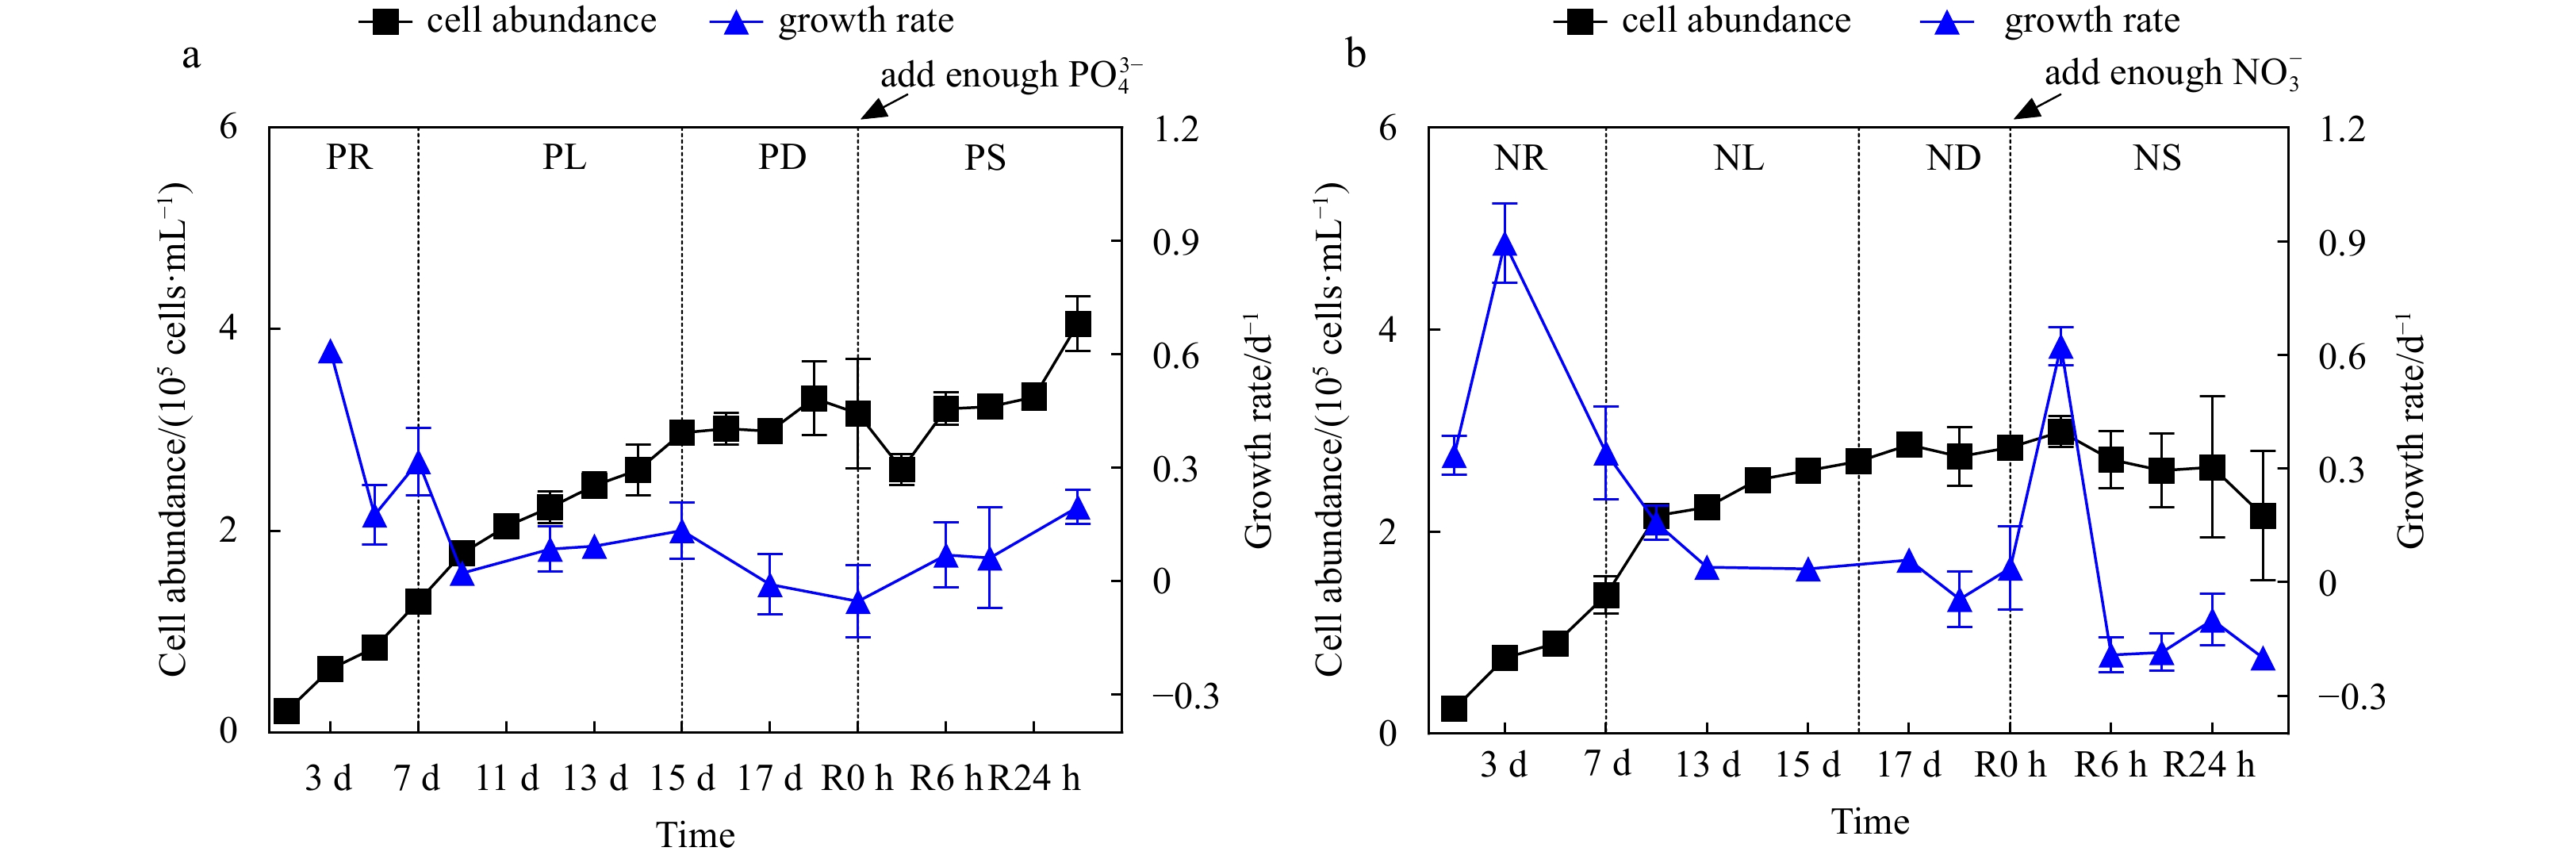
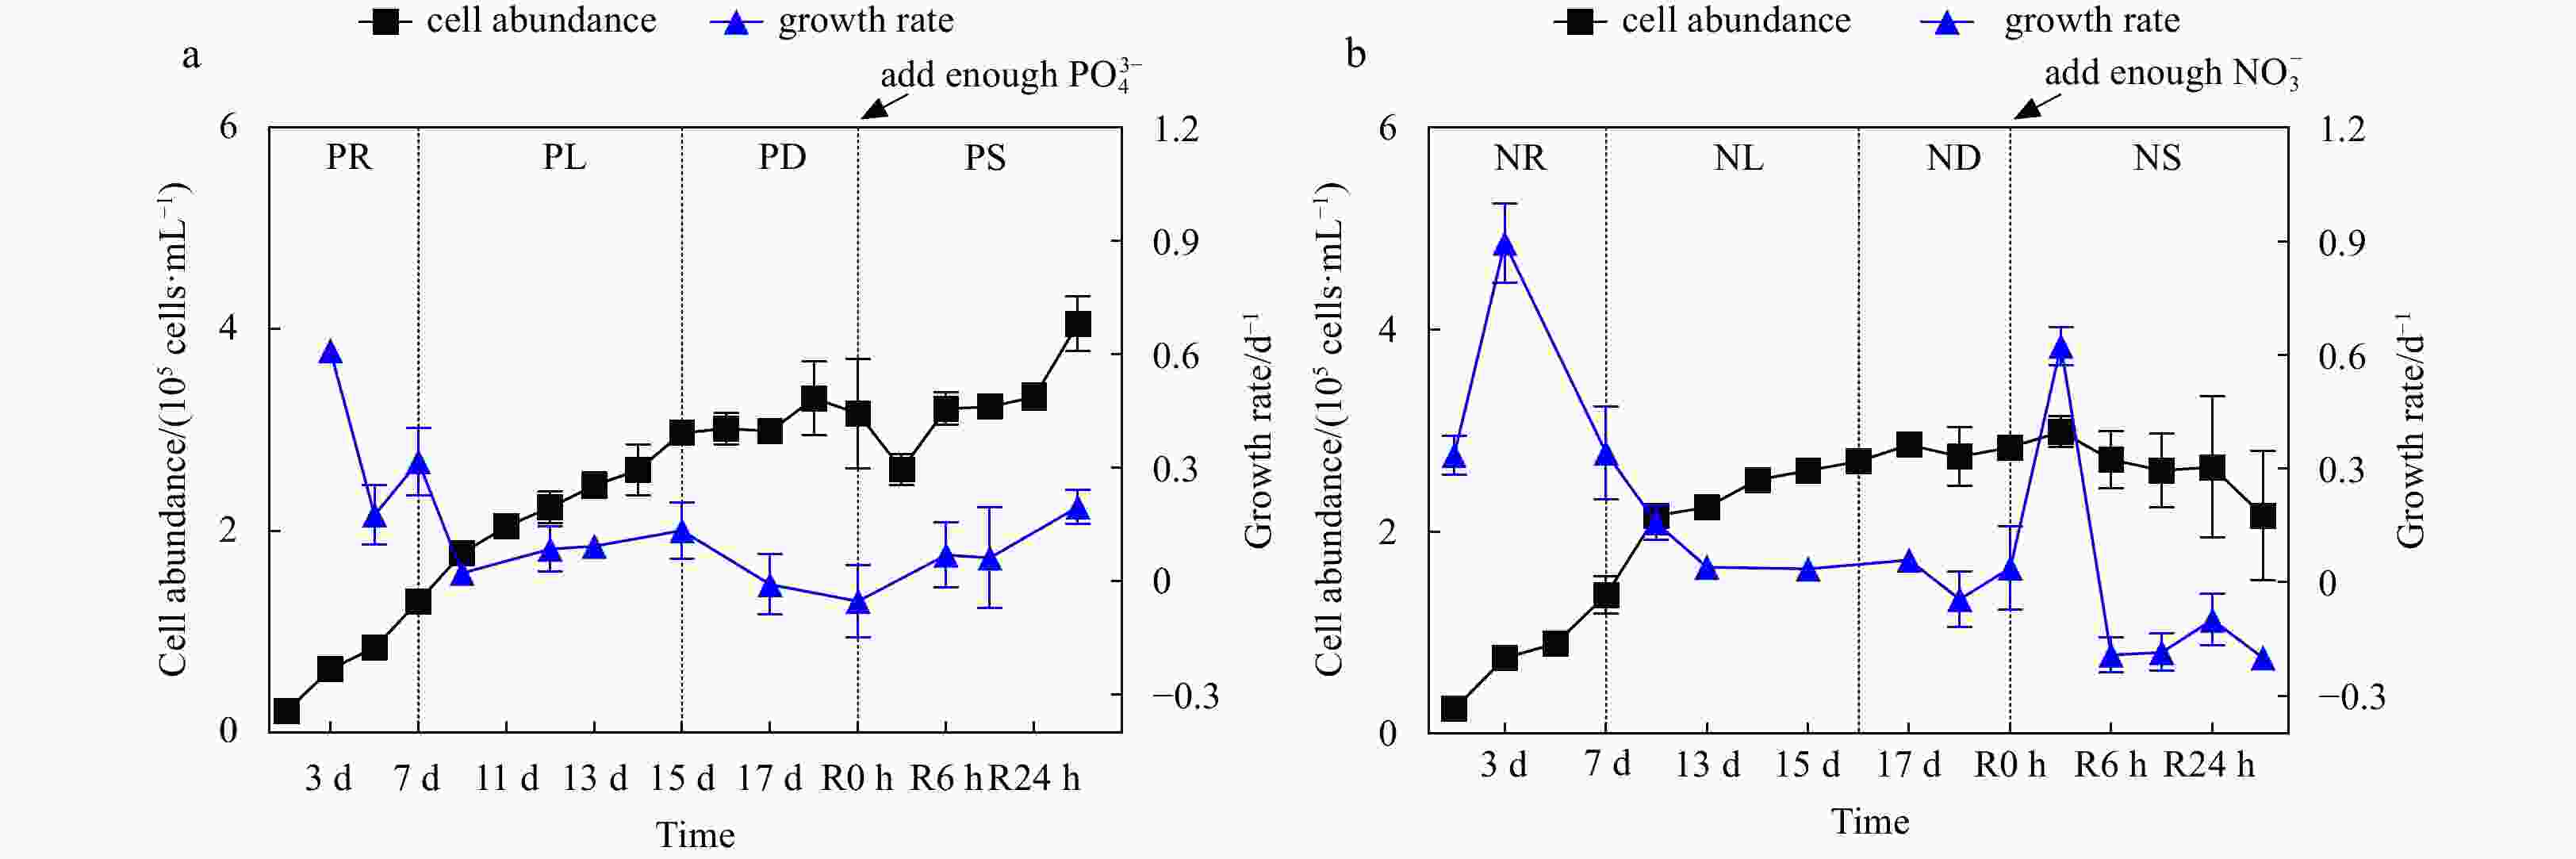
Figure 1. Cell abundance and growth rate data for the phosphate depletion-spike experiment (a) and nitrate depletion-spike experiment (b). PR, PL, PD, and PS represent phosphate repletion, phosphate limitation, phosphate depletion, and phosphate spike, respectively. NR, NL, ND, and NS represent nitrate repletion, nitrate limitation, nitrate depletion, and nitrate spike, respectively. R represents the post-recovery time, and five-time points 2 h, 6 h, 12 h, 24 h, and 48 h were recorded after the addition of limiting nutrients. These abbreviations apply to all figures.
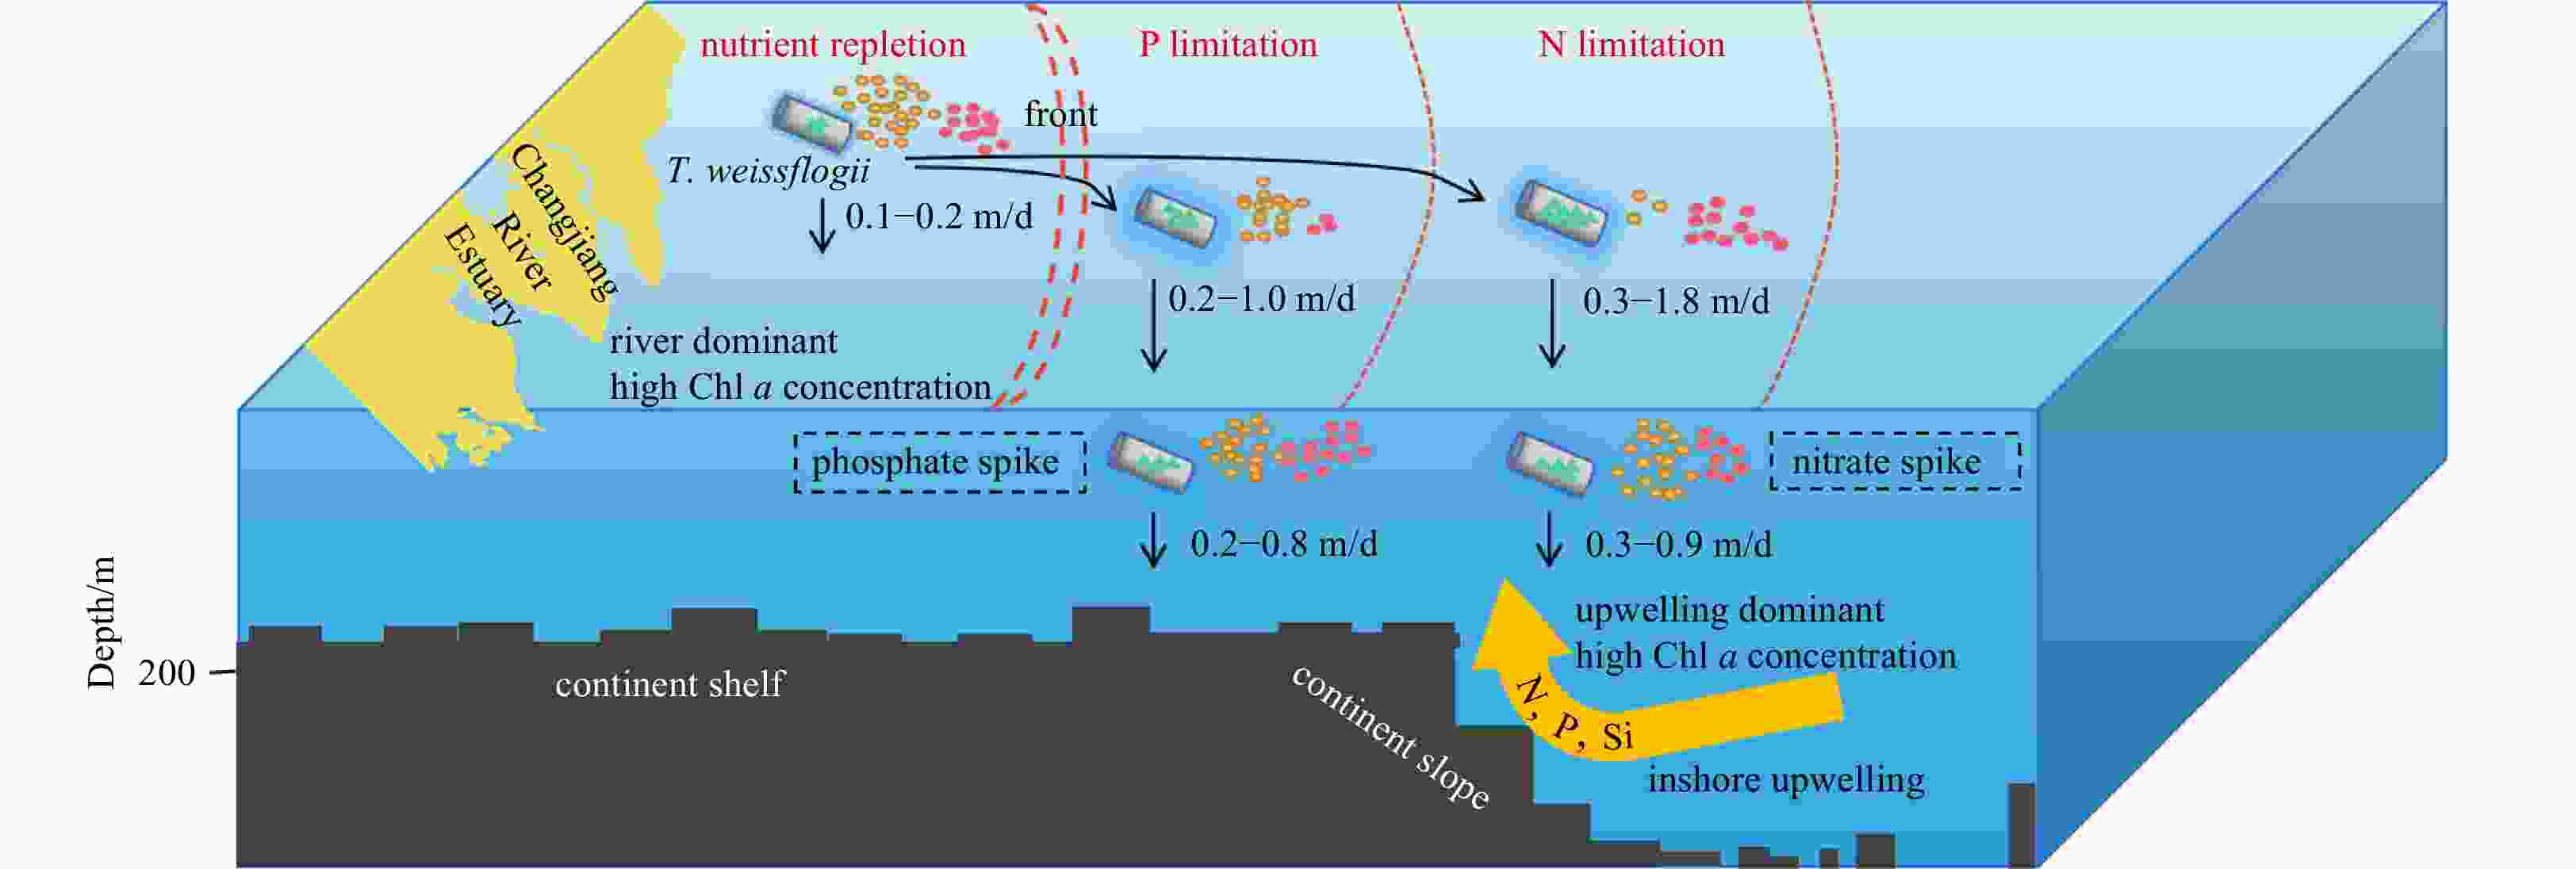
Figure 9. Conceptual model to simulate the effect of nutrient limitation on the sinking velocity of Thalassiosira weissflogii in the Changjiang River Estuary. Owing to the input of diluted water from the Changjiang River, there is an excess of nitrogen and phosphorus nutrient salts. The nearshore waters of the Changjiang River Estuary are in the stage of nutrient repletion without nutrient limitation; however, with the increase in the spreading distance of the freshwater from the Changjiang River, nutrient concentration gradually decreases, and the phenomena of phosphate limitation and nitrate limitation occur successively. Small yellow circles represent nitrate concentrations, red circles represent phosphate concentrations, green triangles represent lipid content and blue shades represent extracellular products.
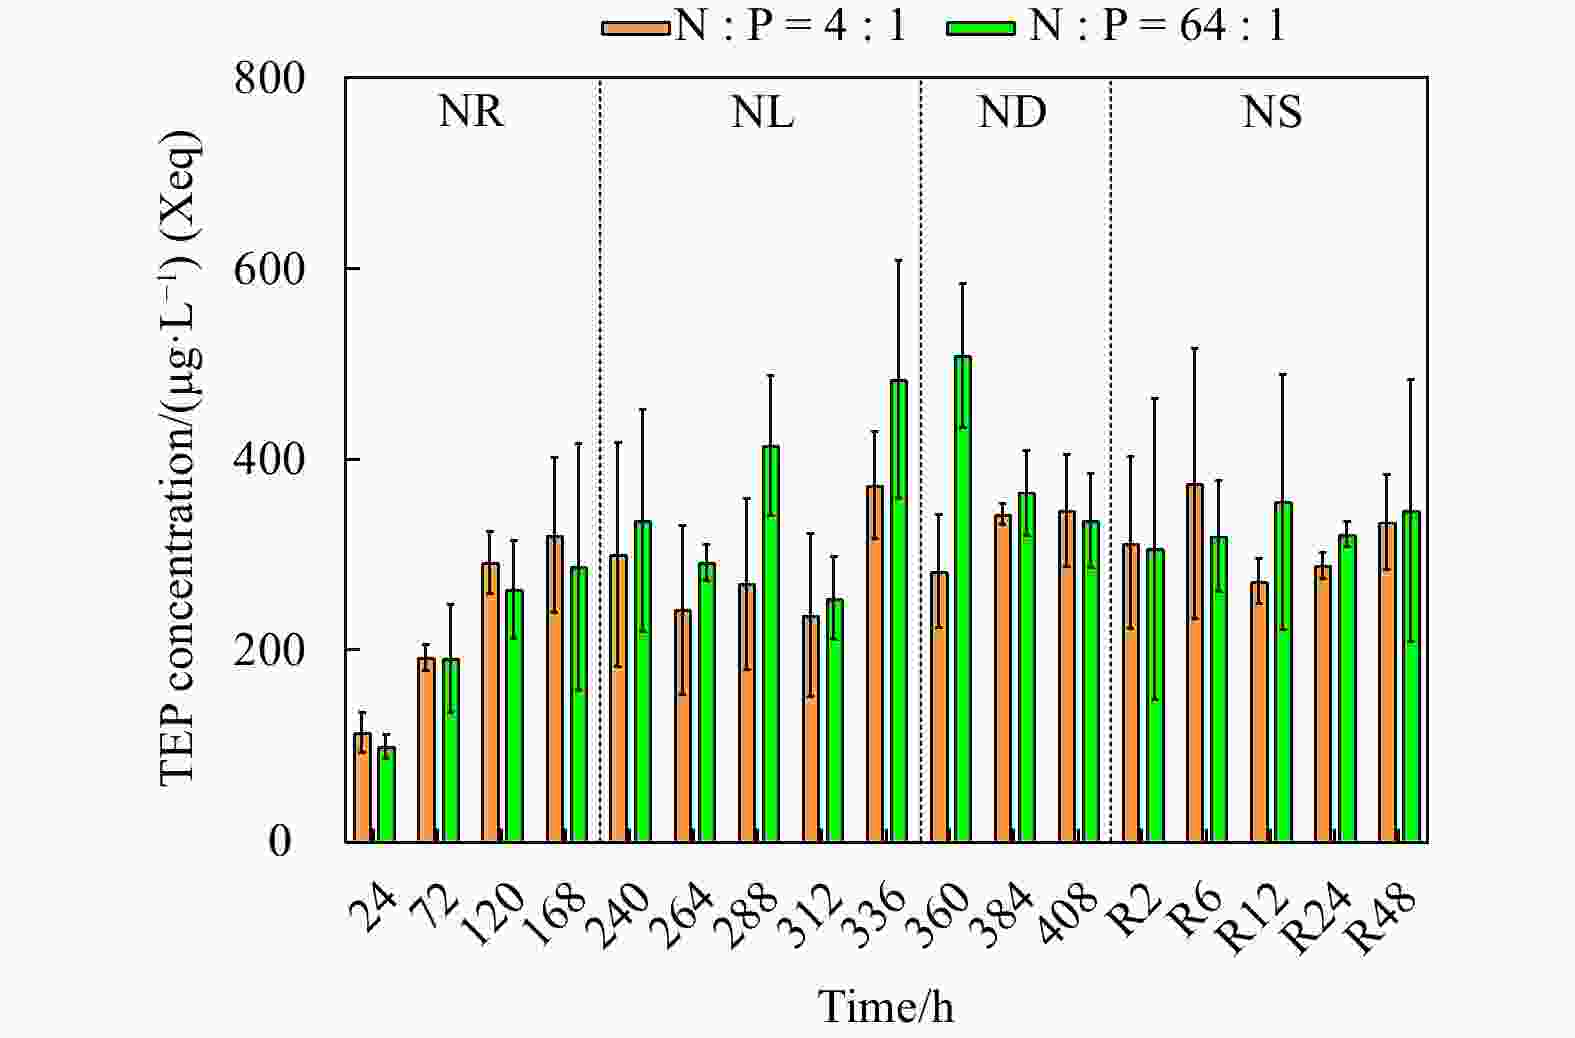
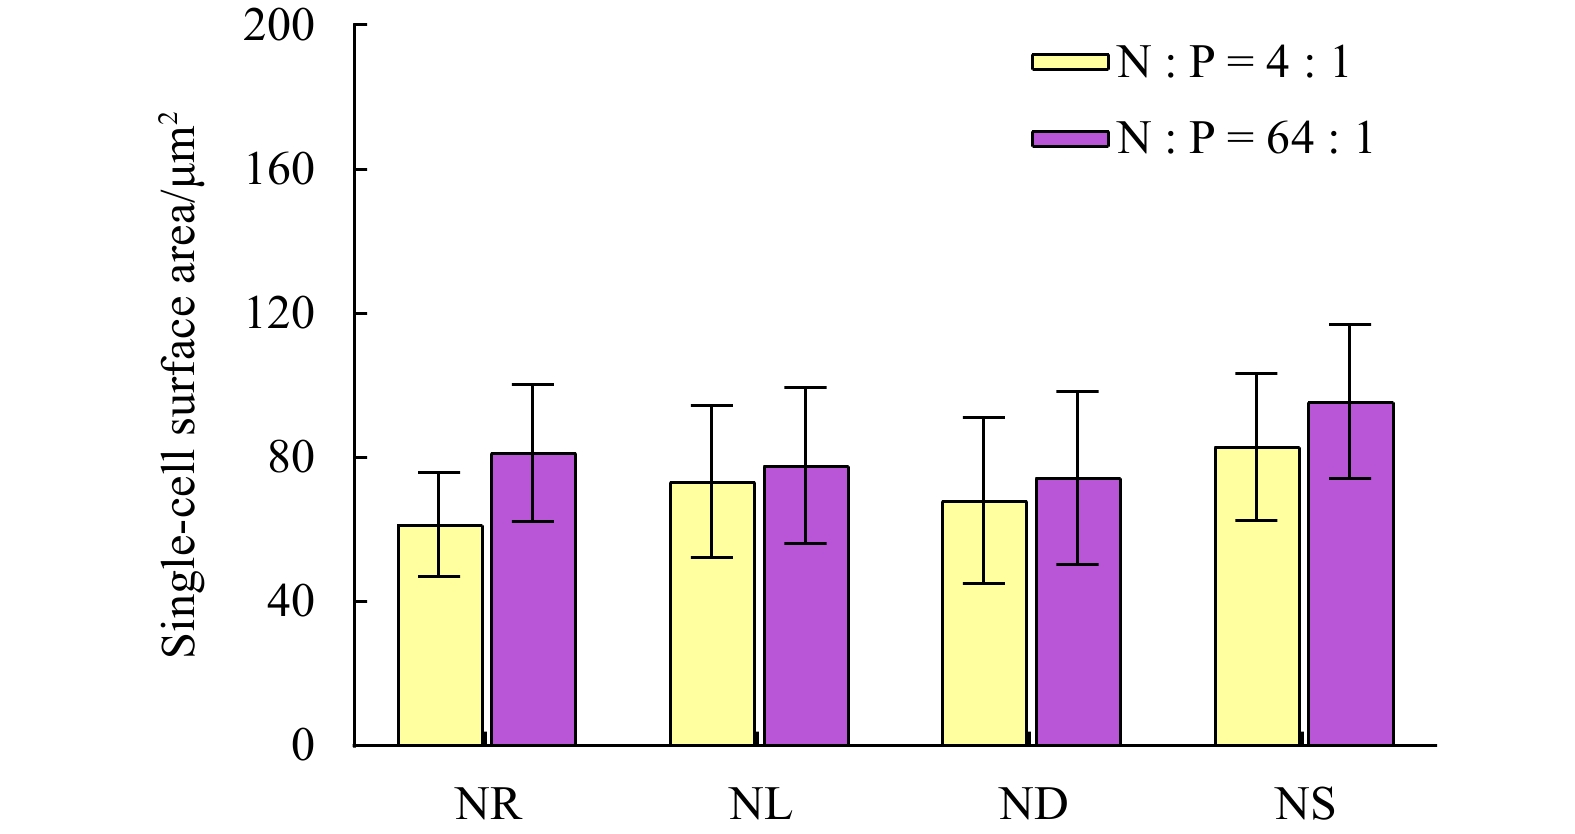
Table 1. Changes in Fv/Fm, surface area of a single cell, sinking velocity (SV), and the macromolecular composition, transparent extracellular polymeric particle (TEP) concentrations in Thalassiosira weissflogii for the nitrate depletion-spike and phosphate depletion-spike experiments
Nutrient
stageSV/
(m·d−1)Growth
rate/d−1Fv/Fm Surface area/
μm2Protein/
(mg·mg−1)Glucose-based carbohydrate/
(μg·mg−1)Lipid/
(mg·mg−1)TEP/
(μg·L−1) (Xeq)NR 0.21 ± 0.05 0.55 ± 0.03 0.69 ± 0.01 61.45 ± 14.46 0.34 ± 0.06 2.03 ± 0.52 0.12 ± 0.04 229.38 ± 53.11 NL 1.09 ± 0.13 0.10 ± 0.02 0.59 ± 0.03 73.43 ± 21.17 0.15 ± 0.03 3.58 ± 0.31 0.53 ± 0.07 261.96 ± 87.91 ND 0.35 ± 0.04 0.02 ± 0.05 0.34 ± 0.03 68.17 ± 23.01 0.37 ± 0.10 5.15 ± 0.61 0.28 ± 0.07 336.00 ± 46.30 NS 0.49 ± 0.07 0.04 ± 0.05 0.39 ± 0.02 83.01 ± 20.37 0.20 ± 0.05 6.07 ± 1.33 0.37 ± 0.05 316.50 ± 63.68 PR 0.17 ± 0.08 0.48 ± 0.06 0.69 ± 0.01 81.34 ± 19.04 0.32 ± 0.06 2.41 ± 0.65 0.10 ± 0.02 184.44 ± 62.55 PL 0.45 ± 0.06 0.12 ± 0.04 0.63 ± 0.01 77.77 ± 21.65 0.19 ± 0.05 2.52 ± 0.50 0.31 ± 0.03 344.78 ± 75.24 PD 0.35 ± 0.07 0.06 ± 0.08 0.42 ± 0.02 74.34 ± 24.13 0.38 ± 0.07 4.44 ± 1.25 0.33 ± 0.05 349.88 ± 48.56 PS 0.41 ± 0.07 0.10 ± 0.07 0.40 ± 0.02 95.59 ± 21.54 0.43 ± 0.09 5.55 ± 0.67 0.31 ± 0.03 313.59 ± 110.49 -
Alipanah L, Winge P, Rohloff J, et al. 2018. Molecular adaptations to phosphorus deprivation and comparison with nitrogen deprivation responses in the diatom Phaeodactylum tricornutum. PLoS ONE, 13(2): e0193335, doi: 10.1371/journal.pone.0193335 Alldredge A L, Gotschalk C. 1988. In situ settling behavior of marine snow. Limnology and Oceanography, 33(3): 339–351, doi: 10.4319/lo.1988.33.3.0339 Alldredge A L, Passow U, Logan B E. 1993. The abundance and significance of a class of large, transparent organic particles in the ocean. Deep-Sea Research Part I: Oceanographic Research Papers, 40(6): 1131–1140, doi: 10.1016/0967-0637(93)90129-Q Anderson L W J, Sweeney B M. 1977. Diel changes in sedimentation characteristics of Ditylum brightwelli: Changes in cellular lipid and effects of respiratory inhibitors and ion-transport modifiers. Limnology and Oceanography, 22(3): 539–552, doi: 10.4319/lo.1977.22.3.0539 Anderson L W J, Sweeney B M. 1978. Role of inorganic ions in controlling sedimentation rate of a marine centric diatom ditylum brightwelli. Journal of Phycology, 14(2): 204–214, doi: 10.1111/j.1529-8817.1978.tb02450.x Bach L T, Boxhammer T, Larsen A, et al. 2016. Influence of plankton community structure on the sinking velocity of marine aggregates. Global Biogeochemical Cycles, 30(8): 1145–1165, doi: 10.1002/2016GB005372 Bar-Zeev E, Berman T, Rahav E, et al. 2011. Transparent exopolymer particle (TEP) dynamics in the eastern Mediterranean Sea. Marine Ecology Progress Series, 431: 107–118, doi: 10.3354/meps09110 Beardall J, Young E, Roberts S. 2001. Approaches for determining phytoplankton nutrient limitation. Aquatic Sciences, 63(1): 44–69, doi: 10.1007/PL00001344 Bienfang P K, Harrison P J, Quarmby L M. 1982. Sinking rate response to depletion of nitrate, phosphate and silicate in four marine diatoms. Marine Biology, 67(3): 295–302, doi: 10.1007/BF00397670 Bienfang P K, Szyper J P. 1982. Effects of temperature and salinity on sinking rates of the centric diatom Ditylum brightwelli. Biological Oceanography, 1(3): 211–223 Botte P, d’Ippolito G, Gallo C, et al. 2018. Combined exploitation of CO2 and nutrient replenishment for increasing biomass and lipid productivity of the marine diatoms Thalassiosira weissflogii and Cyclotella cryptica. Journal of Applied Phycology, 30(1): 243–251, doi: 10.1007/s10811-017-1221-4 Boyd C, Gradmann D. 2002. Impact of osmolytes on buoyancy of marine phytoplankton. Marine Biology, 141(4): 605–618, doi: 10.1007/s00227-002-0872-z Bradford M M. 1976. A rapid and sensitive method for the quantitation of microgram quantities of protein utilizing the principle of protein-dye binding. Analytical Biochemistry, 72(1–2): 248–254, doi: 10.1016/0003-2697(76)90527-3 Caspers H. 1970. J. D. H. Strickland and T. R. Parsons: A Practical Handbook of Seawater Analysis. Ottawa: Fisheries Research Board of Canada, Bulletin 167, 1968. 293 pp. $ 7.50. Internationale Revue der gesamten Hydrobiologie und Hydrographie, 55(1): 167 Chen Yaxin, Liu Ruimin, Sun Chengchun, et al. 2012. Spatial and temporal variations in nitrogen and phosphorous nutrients in the Yangtze River Estuary. Marine Pollution Bulletin, 64(10): 2083–2089, doi: 10.1016/j.marpolbul.2012.07.020 Cloern J E. 2001. Our evolving conceptual model of the coastal eutrophication problem. Marine Ecology Progress Series, 210: 223–253, doi: 10.3354/meps210223 Conley D J, Björck S, Bonsdorff E, et al. 2009. Hypoxia-related processes in the Baltic Sea. Environmental Science & Technology, 43(10): 3412–3420 d’Ippolito G, Sardo A, Paris D, et al. 2015. Potential of lipid metabolism in marine diatoms for biofuel production. Biotechnology for Biofuels, 8(1): 28, doi: 10.1186/s13068-015-0212-4 Du Clos K T, Karp-Boss L, Gemmell B J. 2021. Diatoms rapidly alter sinking behavior in response to changing nutrient concentrations. Limnology and Oceanography, 66(3): 892–900, doi: 10.1002/lno.11649 Durante G, Basset A, Stanca E, et al. 2019. Allometric scaling and morphological variation in sinking rate of phytoplankton. Journal of Phycology, 55(6): 1386–1393, doi: 10.1111/jpy.12916 Eppley R W, Holmes R W, Strickland J D H. 1967. Sinking rates of marine phytoplankton measured with a fluorometer. Journal of Experimental Marine Biology and Ecology, 1(2): 191–208, doi: 10.1016/0022-0981(67)90014-7 Granata T C. 1991. Diel periodicity in growth and sinking rates of the centric diatom Coscinodiscus concinnus. Limnology and Oceanography, 36(1): 132–139, doi: 10.4319/lo.1991.36.1.0132 Guillard R R, Ryther J H. 1962. Studies of marine planktonic diatoms. I. Cyclotella nana Hustedt, and Detonula confervacea (cleve) Gran. Canadian Journal of Microbiology, 8: 229–239, doi: 10.1139/m62-029 Guo Shujin, Sun Jun. 2020. Concentrations and sinking rates of transparent exopolymer particles (TEPs) in a coastal sea: The Changjiang River (Yangtze River) Estuary. Acta Oceanologica Sinica, 39(10): 58–69, doi: 10.1007/s13131-020-1660-7 Holman W I M. 1943. A new technique for the determination of phosphorus by the molybdenum blue method. Biochemical Journal, 37(2): 256–259, doi: 10.1042/bj0370256 Huisman J, Sommeijer B. 2002. Maximal sustainable sinking velocity of phytoplankton. Marine Ecology Progress Series, 244: 39–48, doi: 10.3354/meps244039 Jin X, Gruber N, Dunne J P, et al. 2006. Diagnosing the contribution of phytoplankton functional groups to the production and export of particulate organic carbon, CaCO3, and opal from global nutrient and alkalinity distributions. Global Biogeochemical Cycles, 20(2): GB2015 Johnson M B, Wen Zhiyou. 2009. Production of biodiesel fuel from the microalga Schizochytrium limacinum by direct transesterification of algal biomass. Energy & Fuels, 23(10): 5179–5183 Kolber Z, Zehr J, Falkowski P. 1988. Effects of growth irradiance and nitrogen limitation on photosynthetic energy conversion in photosystem II. Plant Physiology, 88(3): 923–929, doi: 10.1104/pp.88.3.923 Laurentin A, Edwards C A. 2003. A microtiter modification of the anthrone-sulfuric acid colorimetric assay for glucose-based carbohydrates. Analytical Biochemistry, 315(1): 143–145, doi: 10.1016/S0003-2697(02)00704-2 Lavoie M, Raven J A. 2020. How can large-celled diatoms rapidly modulate sinking rates episodically?. Journal of Experimental Botany, 71(12): 3386–3389, doi: 10.1093/jxb/eraa129 Lavoie M, Raven J A, Levasseur M. 2016. Energy cost and putative benefits of cellular mechanisms modulating buoyancy in aflagellate marine phytoplankton. Journal of Phycology, 52(2): 239–251, doi: 10.1111/jpy.12390 Li Daoji, Zhang Jing, Huang Daji, et al. 2002. Oxygen depletion off the Changjiang (Yangtze River) Estuary. Science in China Series D: Earth Sciences, 45(12): 1137–1146, doi: 10.1360/02yd9110 Liu Sumei, Qi Xiaohong, Li Xiaona, et al. 2016. Nutrient dynamics from the Changjiang (Yangtze River) Estuary to the East China Sea. Journal of Marine Systems, 154: 15–27, doi: 10.1016/j.jmarsys.2015.05.010 Luke C L. 1953. Photometric determination of silicon in ferrous, ferromagnetic, nickel, and copper alloys: A molybdenum blue method. Analytical Chemistry, 25(1): 148–151, doi: 10.1021/ac60073a028 Margalef R. 1978. Life-forms of phytoplankton as survival alternatives in an unstable environment. Oceanologica Acta, 1(4): 493–509 Mari X, Passow U, Migon C, et al. 2017. Transparent exopolymer particles: Effects on carbon cycling in the ocean. Progress in Oceanography, 151: 13–37, doi: 10.1016/j.pocean.2016.11.002 Myklestad S, Haug A. 1972. Production of carbohydrates by the marine diatom Chaetoceros affinis var. willei (Gran) Hustedt. I. Effect of the concentration of nutrients in the culture medium. Journal of Experimental Marine Biology and Ecology, 9(2): 125–136, doi: 10.1016/0022-0981(72)90041-X O’Brien K R, Waite A M, Alexander B L, et al. 2006. Particle tracking in a salinity gradient: a method for measuring sinking rate of individual phytoplankton in the laboratory. Limnology and Oceanography: Methods, 4(9): 329–335, doi: 10.4319/lom.2006.4.329 Osibanjo O, Ajayi S O. 1980. Rapid and sensitive spectrophotobetric method for the determination of nitrate in rain water using 3, 4-xylenol. Analyst, 105(1254): 908–912, doi: 10.1039/an98005 00908 Pantorno A, Holland D P, Stojkovic S, et al. 2013. Impacts of nitrogen limitation on the sinking rate of the coccolithophorid Emiliania huxleyi (Prymnesiophyceae). Phycologia, 52(3): 288–294, doi: 10.2216/12-064.1 Passow U. 2002. Transparent exopolymer particles (TEP) in aquatic environments. Progress in Oceanography, 55(3–4): 287–333, doi: 10.1016/S0079-6611(02)00138-6 Passow U, Alldredge A L. 1995. A dye-binding assay for the spectrophotometric measurement of transparent exopolymer particles (TEP). Limnology and Oceanography, 40(7): 1326–1335, doi: 10.4319/lo.1995.40.7.1326 Ptacnik R, Diehl S, Berger S. 2003. Performance of sinking and nonsinking phytoplankton taxa in a gradient of mixing depths. Limnology and Oceanography, 48(5): 1903–1912, doi: 10.4319/lo.2003.48.5.1903 Raven J A, Doblin M A. 2014. Active water transport in unicellular algae: where, why, and how. Journal of Experimental Botany, 65(22): 6279–6292, doi: 10.1093/jxb/eru360 Reitan K I, Rainuzzo J R, Olsen Y. 1994. Effect of nutrient limitation on fatty acid and lipid content of marine microalgae. Journal of Phycology, 30(6): 972–979, doi: 10.1111/j.0022-3646.1994.00972.x Reynolds C S, Walsby A E. 1975. Water-blooms. Biological Reviews, 50(4): 437–481, doi: 10.1111/j.1469-185X.1975.tb01060.x Rhee G Y. 1978. Effects of N: P atomic ratios and nitrate limitation on algal growth, cell composition, and nitrate uptake. Limnology and Oceanography, 23(1): 10–25, doi: 10.4319/lo.1978.23.1.0010 Simon M, Grossart H P, Schweitzer B, et al. 2002. Microbial ecology of organic aggregates in aquatic ecosystems. Aquatic Microbial Ecology, 28(2): 175–211 Smayda T J. 1970. The suspension and sinking of phytoplankton in the sea. Oceanography & Marine Biology, 8: 353–414 Smayda T J, Boleyn B J. 1965. Experimental observations on the flotation of marine diatoms. I. Thalassiosira cf. nana, Thalassiosira rotula and Nitzschia seriata. Limnology and Oceanography, 10(4): 499–509, doi: 10.4319/lo.1965.10.4.0499 Staats N, Stal L J, Mur L R. 2000. Exopolysaccharide production by the epipelic diatom Cylindrotheca closterium: effects of nutrient conditions. Journal of Experimental Marine Biology and Ecology, 249(1): 13–27, doi: 10.1016/S0022-0981(00)00166-0 Tang Danling, Di Baoping, Wei Guifeng, et al. 2006. Spatial, seasonal and species variations of harmful algal blooms in the South Yellow Sea and East China Sea. Hydrobiologia, 568(1): 245–253, doi: 10.1007/s10750-006-0108-1 Tinevez J Y, Perry N, Schindelin J, et al. 2017. TrackMate: An open and extensible platform for single-particle tracking. Methods, 115: 80–90, doi: 10.1016/j.ymeth.2016.09.016 Titman D, Kilham P. 1976. Sinking in freshwater phytoplankton: Some ecological implications of cell nutrient status and physical mixing processes. Limnology and Oceanography, 21(3): 409–417, doi: 10.4319/lo.1976.21.3.0409 Tréguer P, Bowler C, Moriceau B, et al. 2018. Influence of diatom diversity on the ocean biological carbon pump. Nature Geoscience, 11(1): 27–37, doi: 10.1038/s41561-017-0028-x Turner R E, Rabalais N N, Justic D. 2006. Predicting summer hypoxia in the northern Gulf of Mexico: Riverine N, P, and Si loading. Marine Pollution Bulletin, 52(2): 139–148, doi: 10.1016/j.marpolbul.2005.08.012 Van Mooy B A S, Fredricks H F, Pedler B E, et al. 2009. Phytoplankton in the ocean use non-phosphorus lipids in response to phosphorus scarcity. Nature, 458(7234): 69–72, doi: 10.1038/nature07659 Waite A, Harrison P J. 1992. Role of sinking and ascent during sexual reproduction in the marine diatom Ditylum brightwellii. Marine Ecology Progress Series, 87(1): 113–122 Wang Bin, Chen Jianfang, Jin Haiyan, et al. 2017. Diatom bloom-derived bottom water hypoxia off the Changjiang Estuary, with and without typhoon influence. Limnology and Oceanography, 62(4): 1552–1569, doi: 10.1002/lno.10517 Wang Yan, Liu Yongjian, Guo Hao, et al. 2022. Long-term nutrient variation trends and their potential impact on phytoplankton in the southern Yellow Sea, China. Acta Oceanologica Sinica, 41(6): 54–67, doi: 10.1007/s13131-022-2031-3 Wang Baodong, Wang Xiulin, Zhan Run. 2003. Nutrient conditions in the Yellow Sea and the East China Sea. Estuarine, Coastal and Shelf Science, 58(1): 127–136 Yu Rencheng, Lü Songhui, Liang Yubo. 2018. Harmful algal blooms in the coastal waters of China. In: Glibert P M, Berdalet E, Burford M A, et al., eds. Global Ecology and Oceanography of Harmful Algal Blooms. Cham: Springer, 309–316 Zhang Wei, Hao Qiang, Zhu Jie, et al. 2023. Nanoplanktonic diatom rapidly alters sinking velocity via regulating lipid content and composition in response to changing nutrient concentrations. Frontiers in Marine Science, 10: 1255915, doi: 10.3389/fmars.2023.1255915 Zhao Yanfang, Yu Zhiming, Song Xiuxian, et al. 2009. Biochemical compositions of two dominant bloom-forming species isolated from the Yangtze River Estuary in response to different nutrient conditions. Journal of Experimental Marine Biology and Ecology, 368(1): 30–36, doi: 10.1016/j.jembe.2008.09.023 Zhou Feng, Chai Fei, Huang Daji, et al. 2020. Coupling and decoupling of high biomass phytoplankton production and hypoxia in a highly dynamic coastal system: the Changjiang (Yangtze River) Estuary. Frontiers in Marine Science, 7: 259, doi: 10.3389/fmars.2020.00259 Zhou Mingjiang, Shen Zhiliang, Yu Rencheng. 2008. Responses of a coastal phytoplankton community to increased nutrient input from the Changjiang (Yangtze) River. Continental Shelf Research, 28(12): 1483–1489, doi: 10.1016/j.csr.2007.02.009 -


 下载:
下载:

