

An improved wind quality control for the China-France Oceanography Satellite (CFOSAT) scatterometer
-
Abstract: Quality control (QC) is an essential procedure in scatterometer wind retrieval, which is used to distinguish good-quality data from poor-quality wind vector cells (WVCs) for the sake of wind applications. The current wind processor of the China-France Oceanography Satellite (CFOSAT) scatterometer (CSCAT) adopts a maximum likelihood estimator (MLE)-based QC method to filter WVCs affected by geophysical noise, such as rainfall and wind variability. As the first Ku-band rotating fan-beam scatterometer, CSCAT can acquire up to 16 observations over a single WVC, giving abundant information with diverse incidence/azimuth angles, as such its MLE statistical characteristics may be different from the previous scatterometers. In this study, several QC indicators, including MLE, its spatially averaged value (MLEm), and the singularity exponents (SE), are analyzed using the collocated Global Precipitation Mission rainfall data as well as buoy data, to compare their sensitivity to rainfall and wind quality. The results show that wind error characteristics of CSCAT under different QC methods are similar to those of other Ku-band scatterometers, i.e., SE is more suitable than other parameters for the wind QC at outer-swath and nadir regions, while MLEm is the best QC indicator for the sweet region WVCs. Specifically, SE is much more favorable than others at high wind speeds. By combining different indicators, an improved QC method is developed for CSCAT. The validation with the collocated buoy data shows that it accepts more WVCs, and in turn, improves the quality control of CSCAT wind data.
-

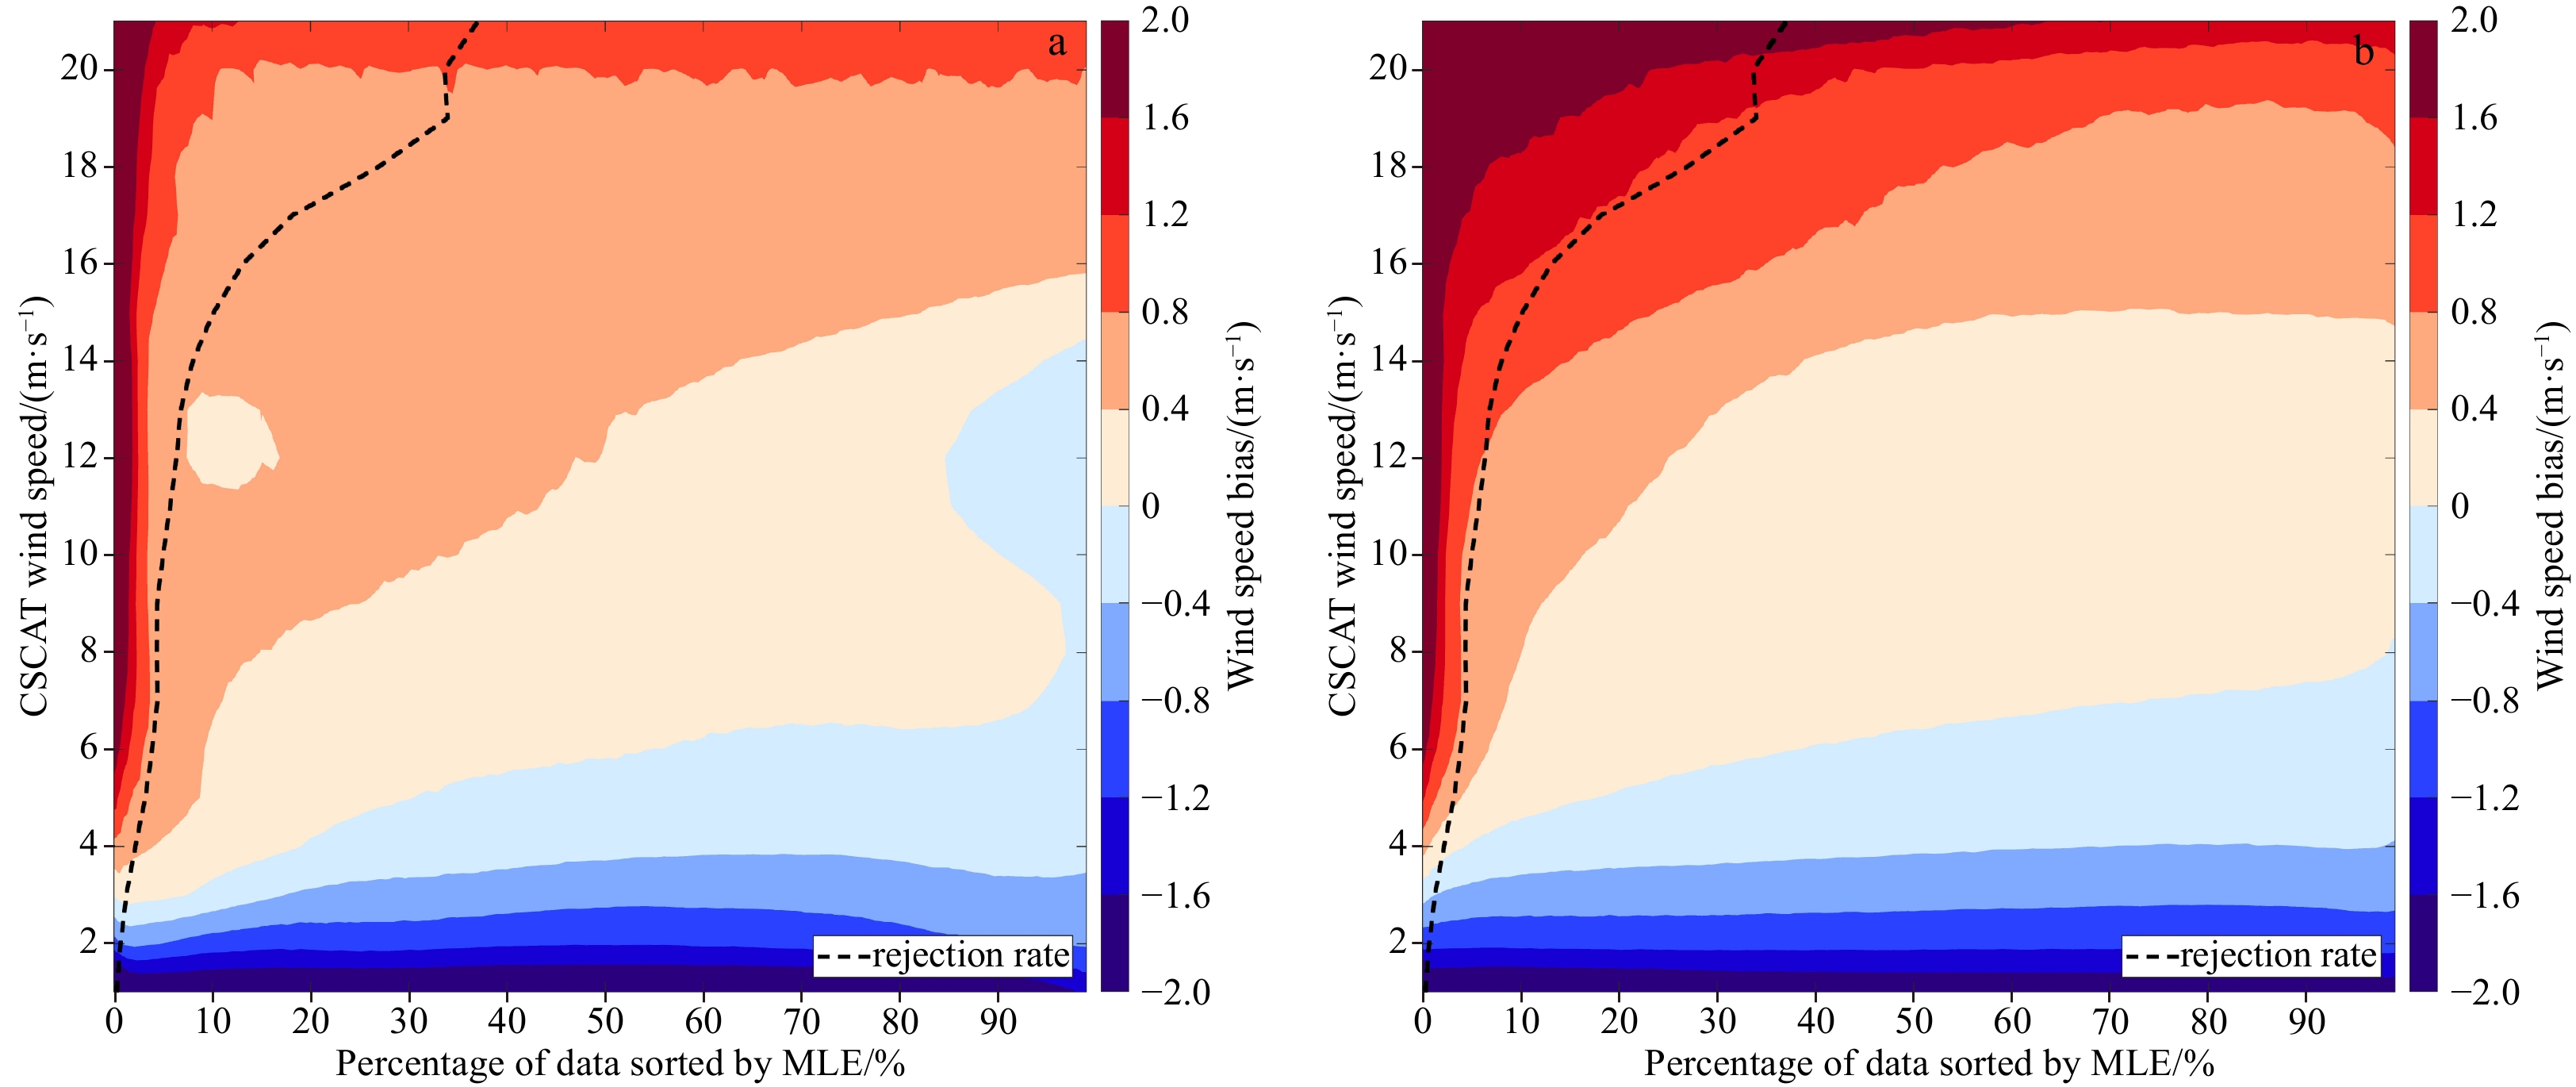
Figure 1. Wind speed bias as a function China-France Oceanography Satellite scatterometer (CSCAT) wind speed and the sorted percentiles by maximum likelihood estimator (MLE) for the near-real-time wind product (a) and the reprocessed wind data (b). The black dashed curve indicates the rejection ratio of the operational MLE-based quality control.
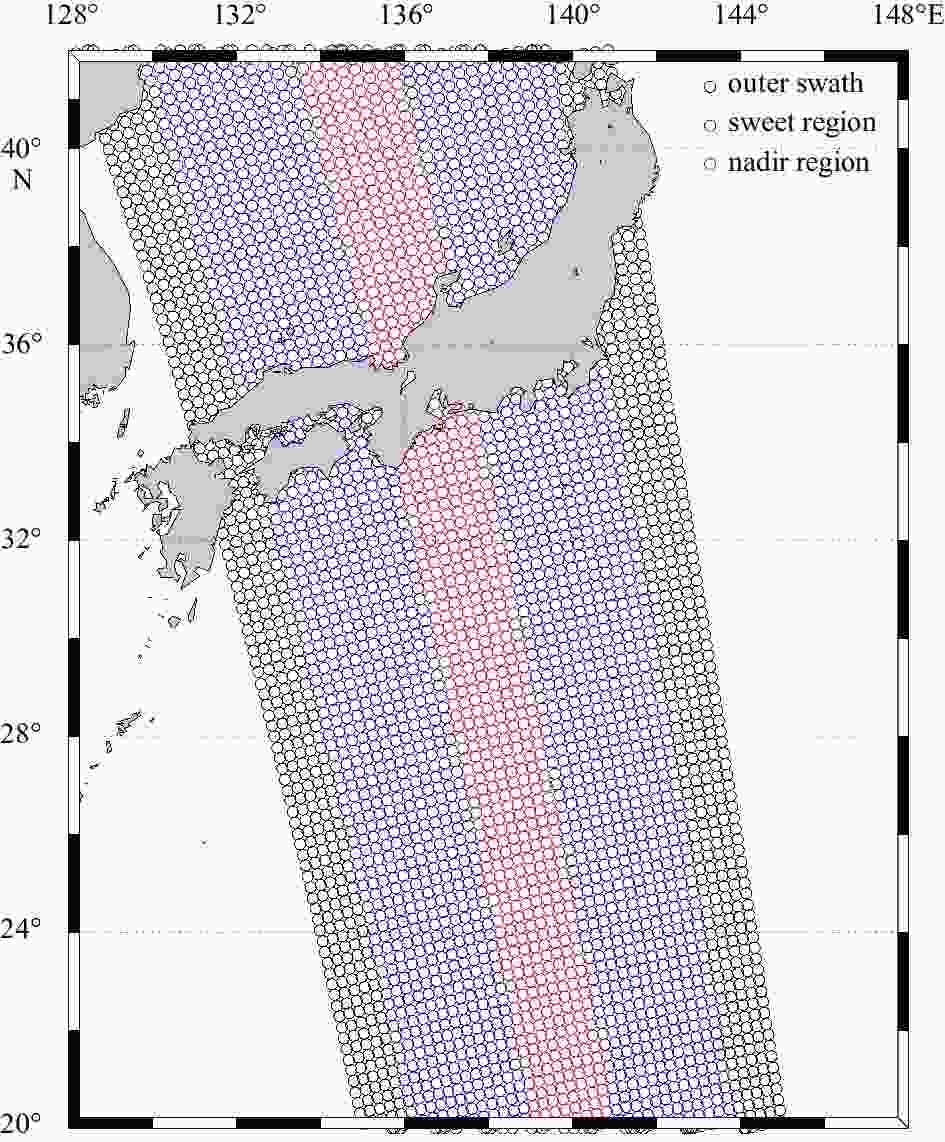
Figure 2. Illustration of the wind vector cells at different swaths. Black, blue, and red circles represent the outer swath, the sweet region, and the nadir region, respectively.
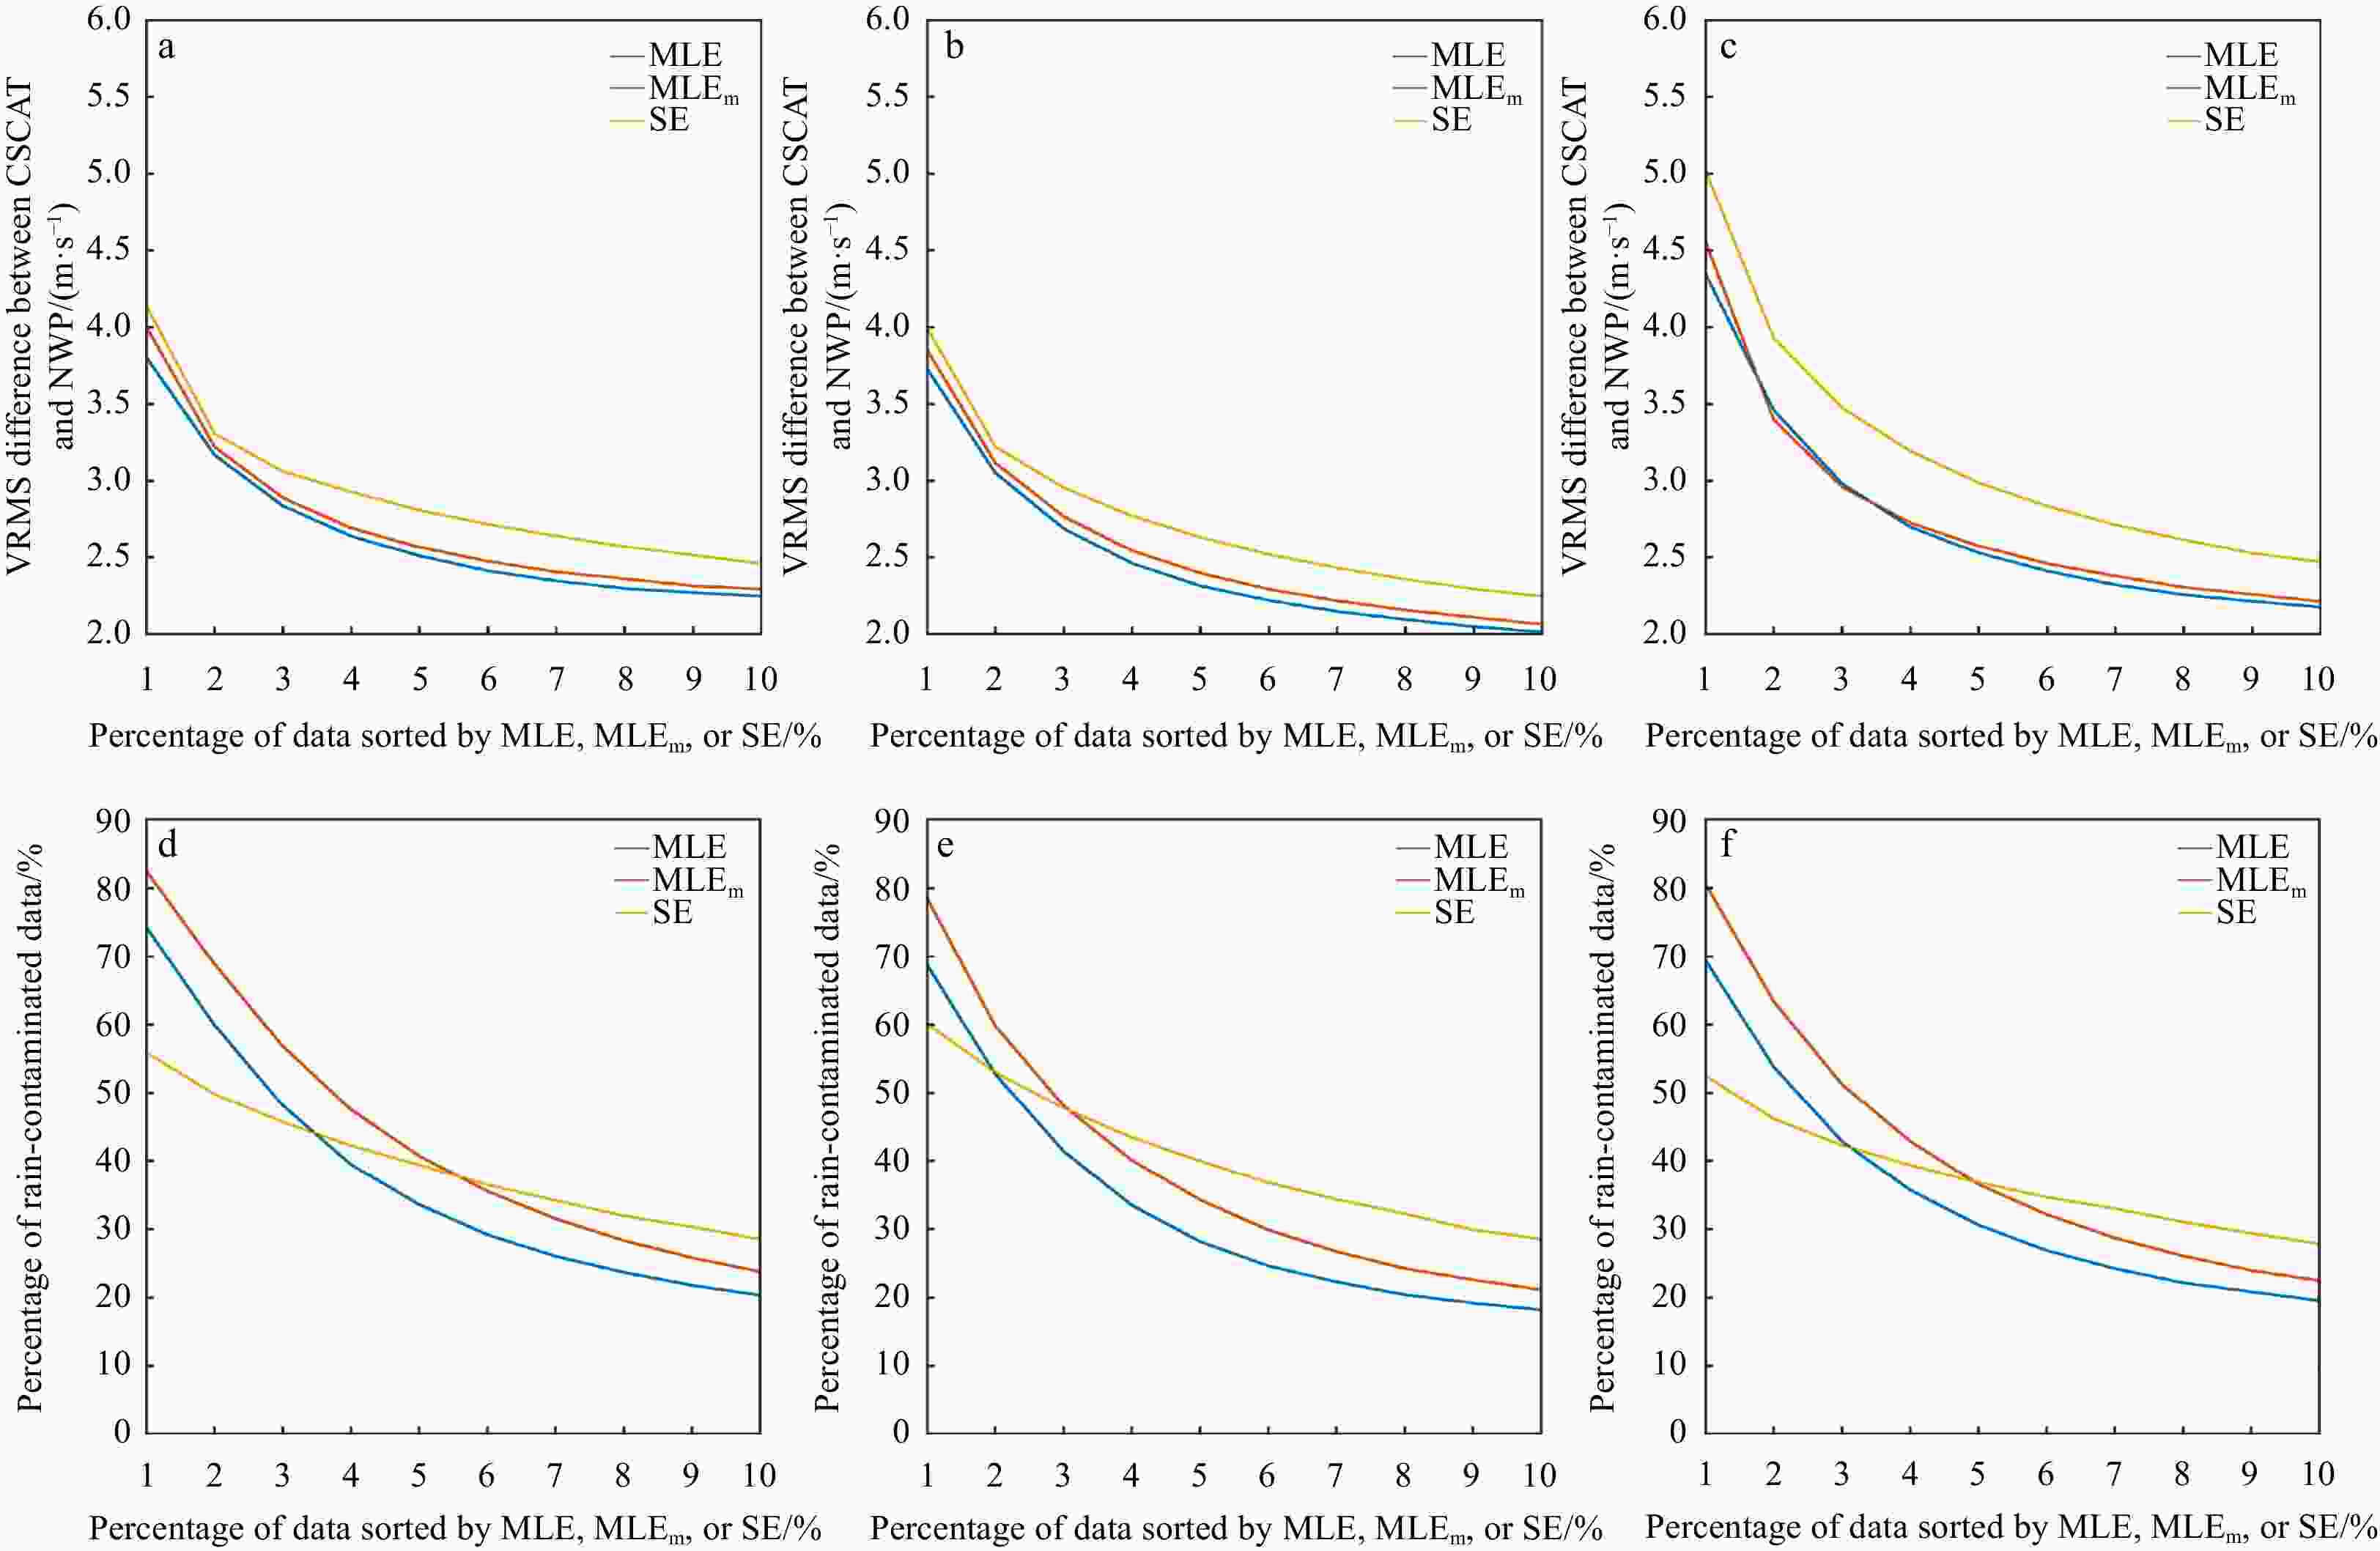
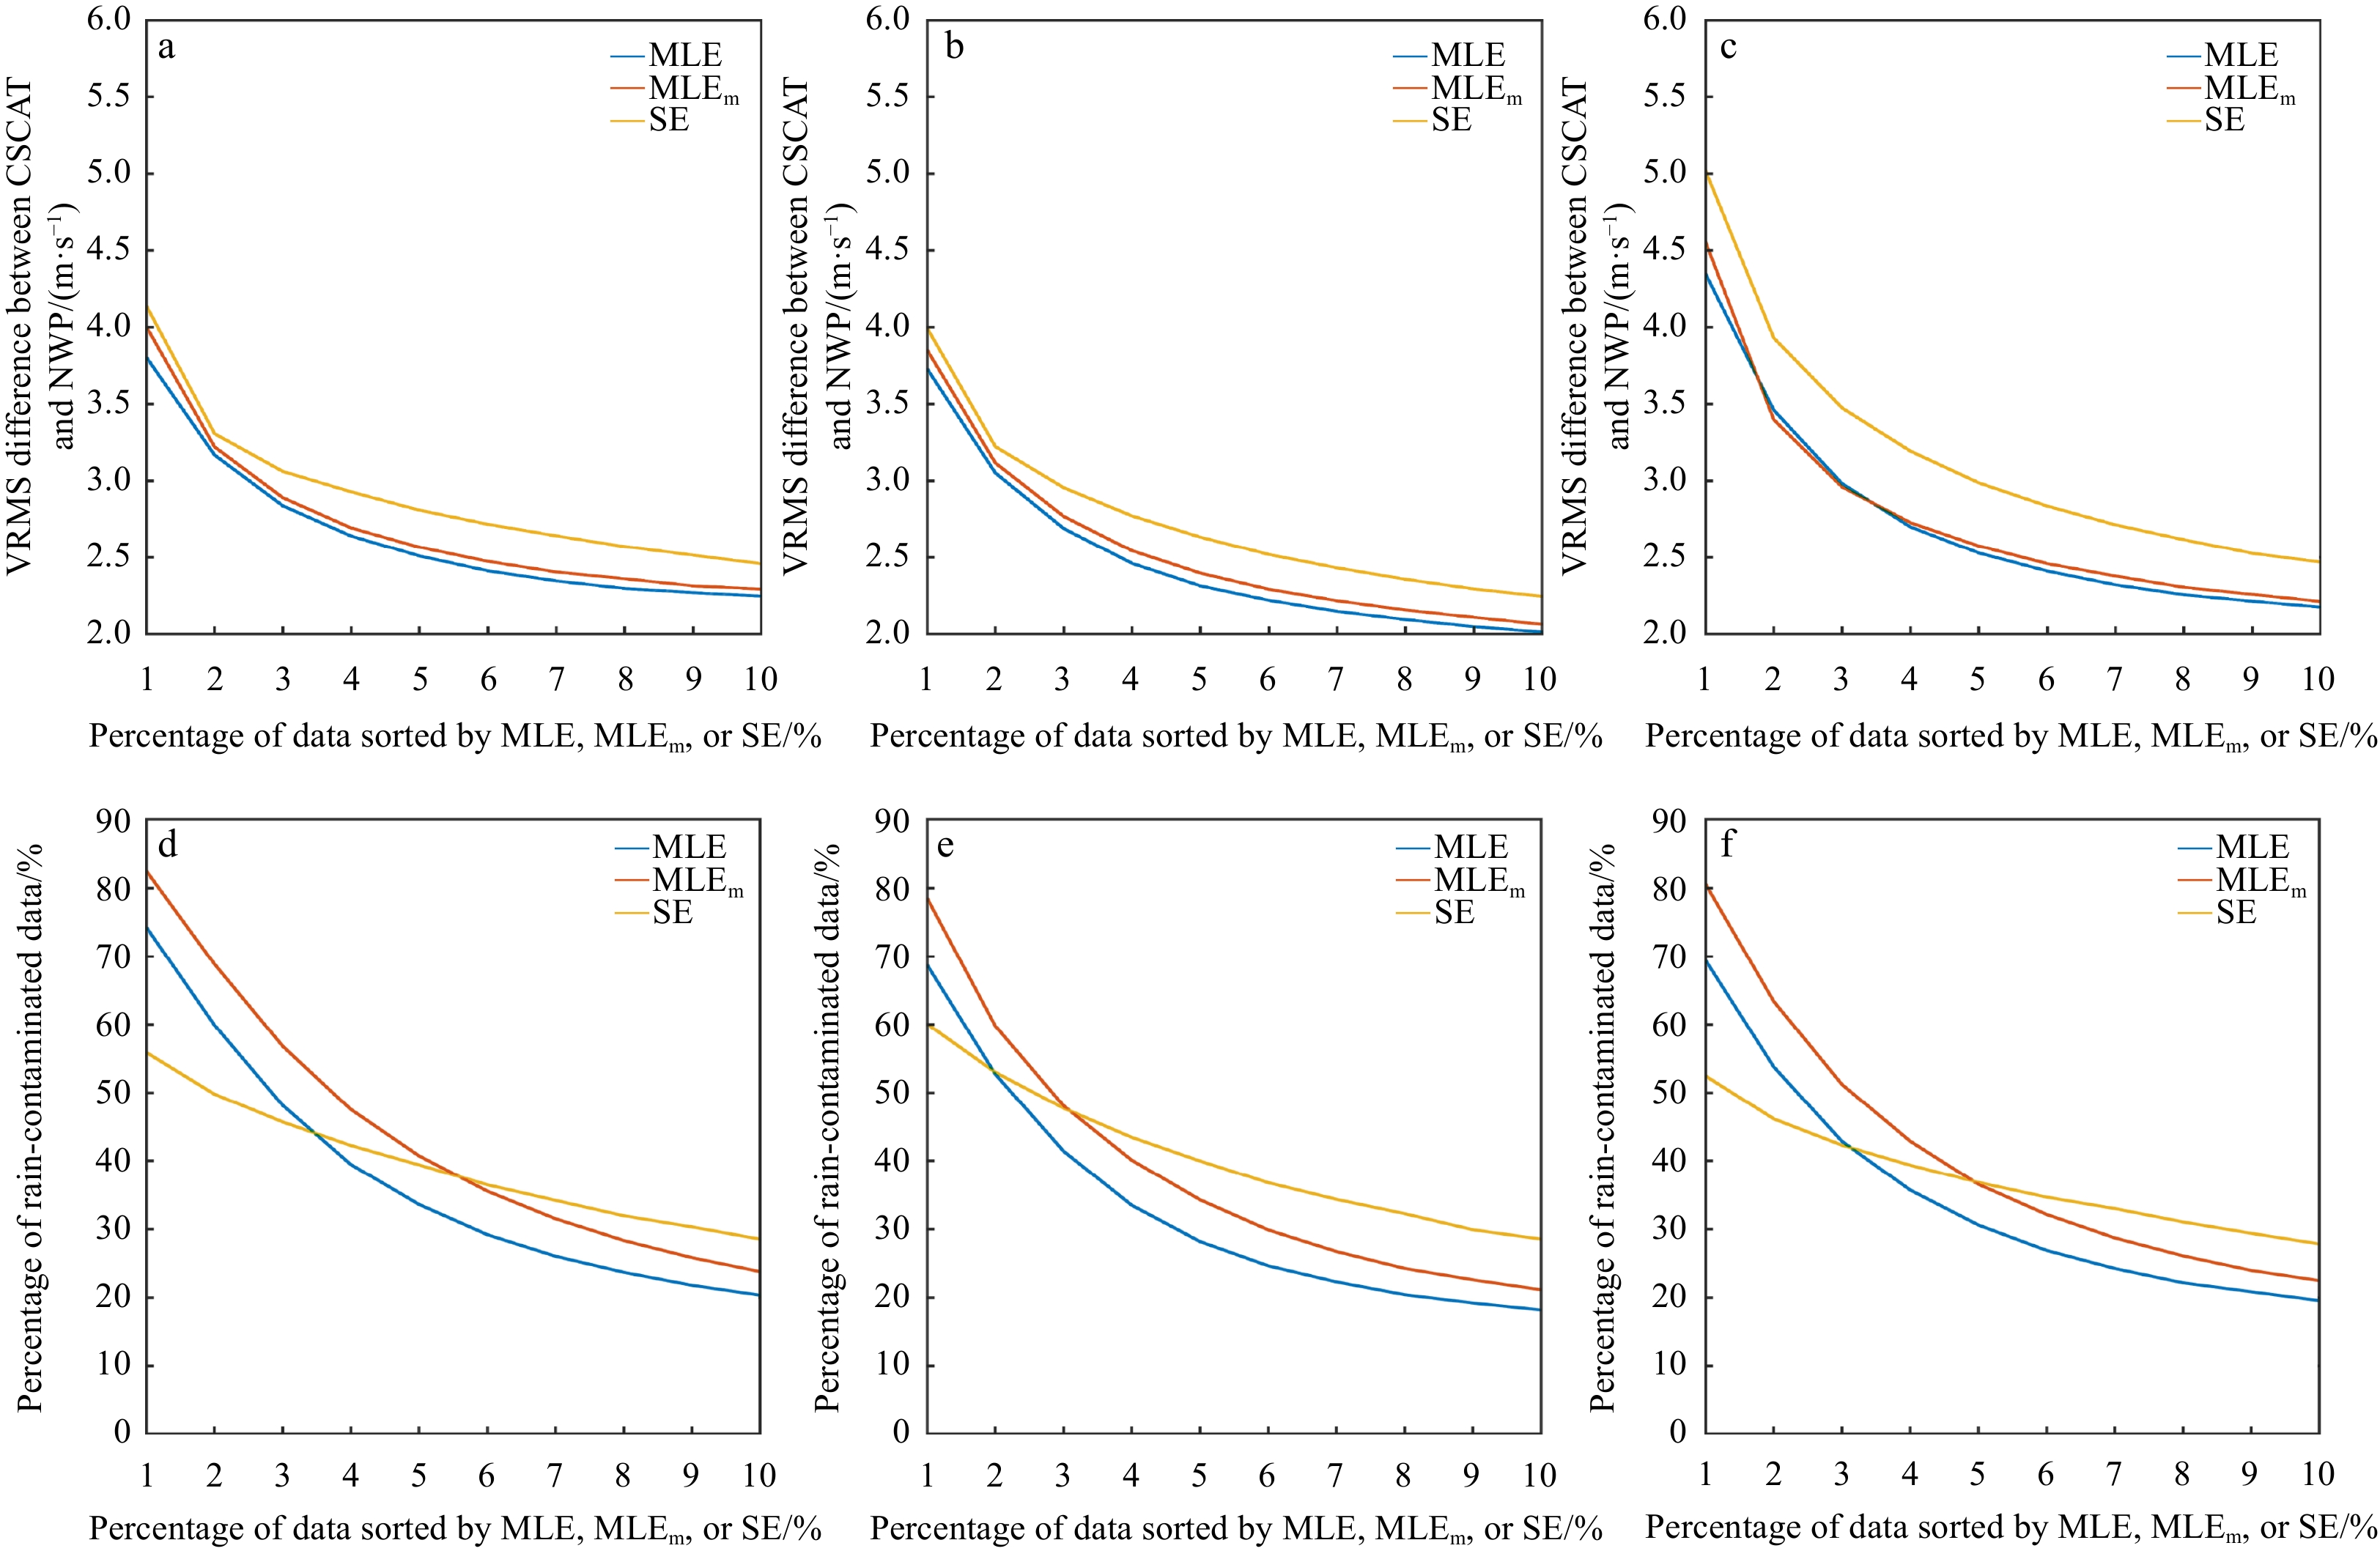
Figure 3. VRMS difference between China-France Oceanography Satellite scatterometer (CSCAT) and numerical weather prediction (NWP) (upper panels), and the percentage of rain-contaminated data (GPM RR > 0 mm/h) (lower panels), as a function of the sorted percentiles by maximum likelihood estimator (MLE, blue), averagred MLE (MLEm, red), and singularity exponents (SE, yellow) for the nadir region (a and d), the sweet region (b and e), and the outer swath (c and f), respectively.
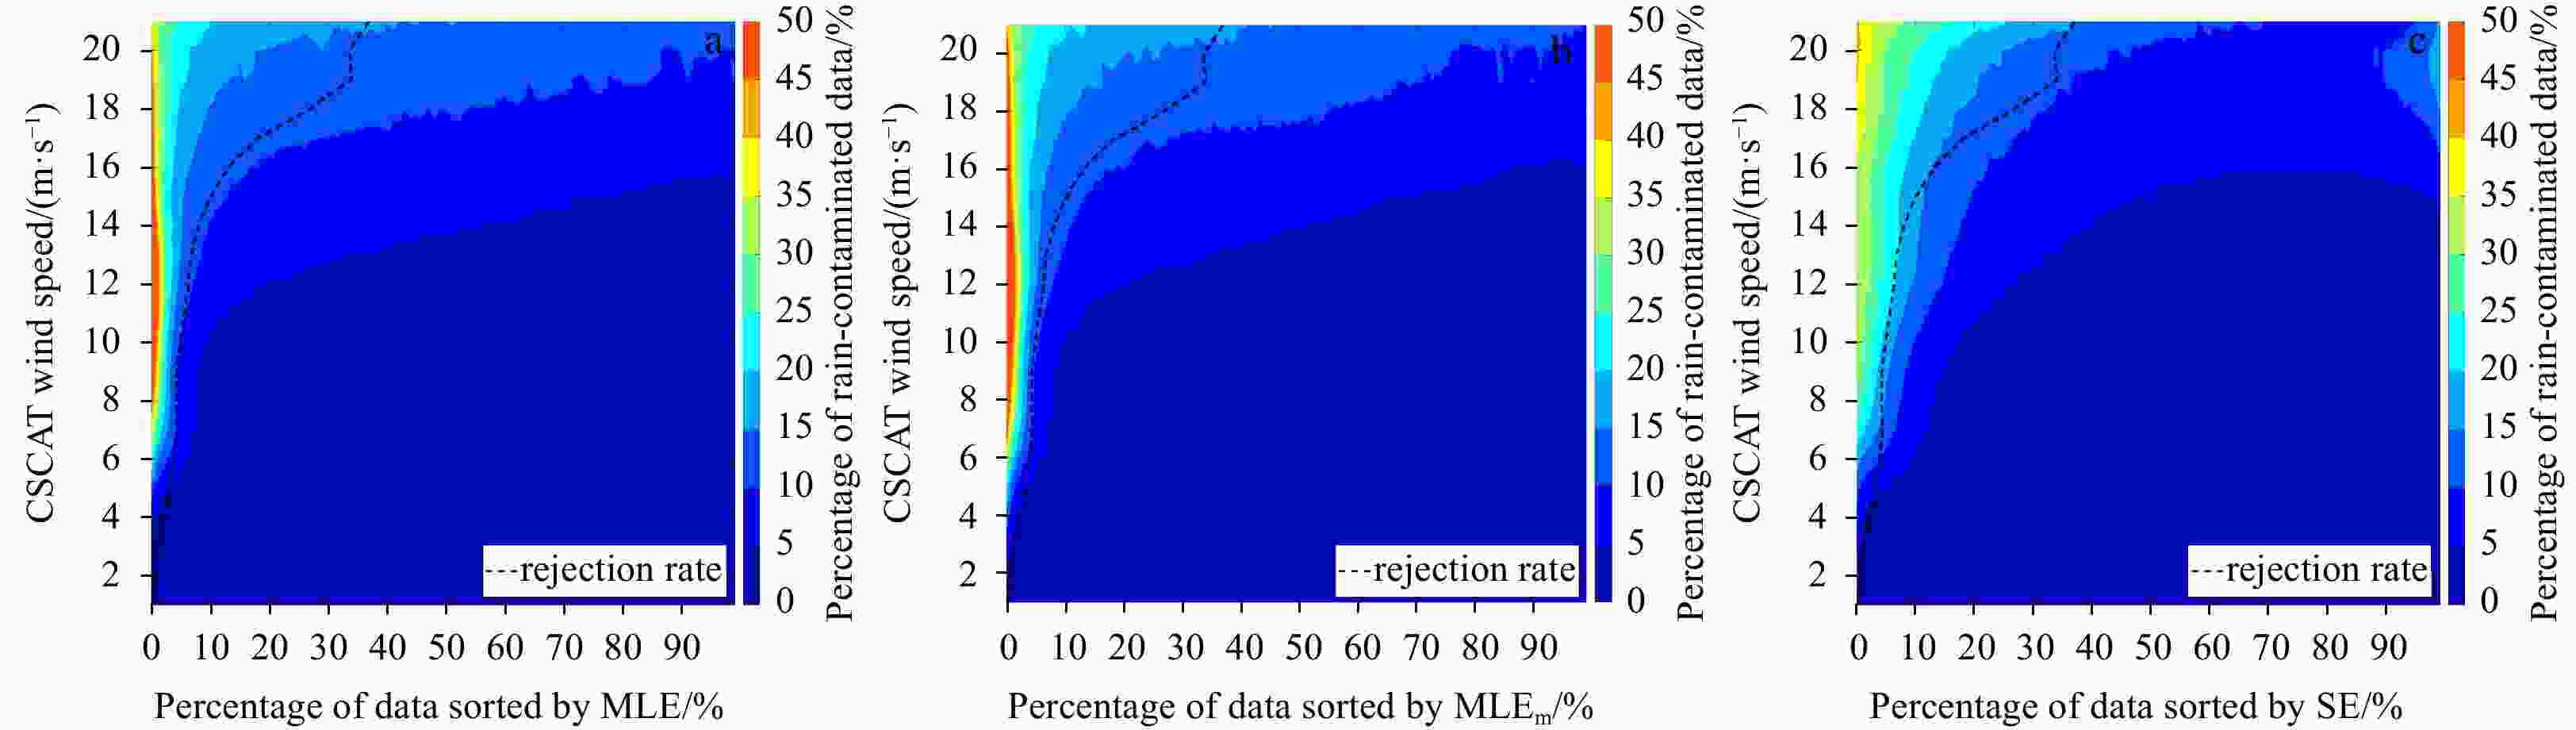
Figure 4. Percentage of rain-contaminated data (GPM RR > 1 mm/h) as a function CSCAT wind speed and the sorted percentiles by maximum likelihood estimator (MLE, a), averaged MLE (MLEm, b), and singularity exponents (SE, c). The black dashed curve indicates the (objective) rejection ratio of the operational MLE-based quality control.
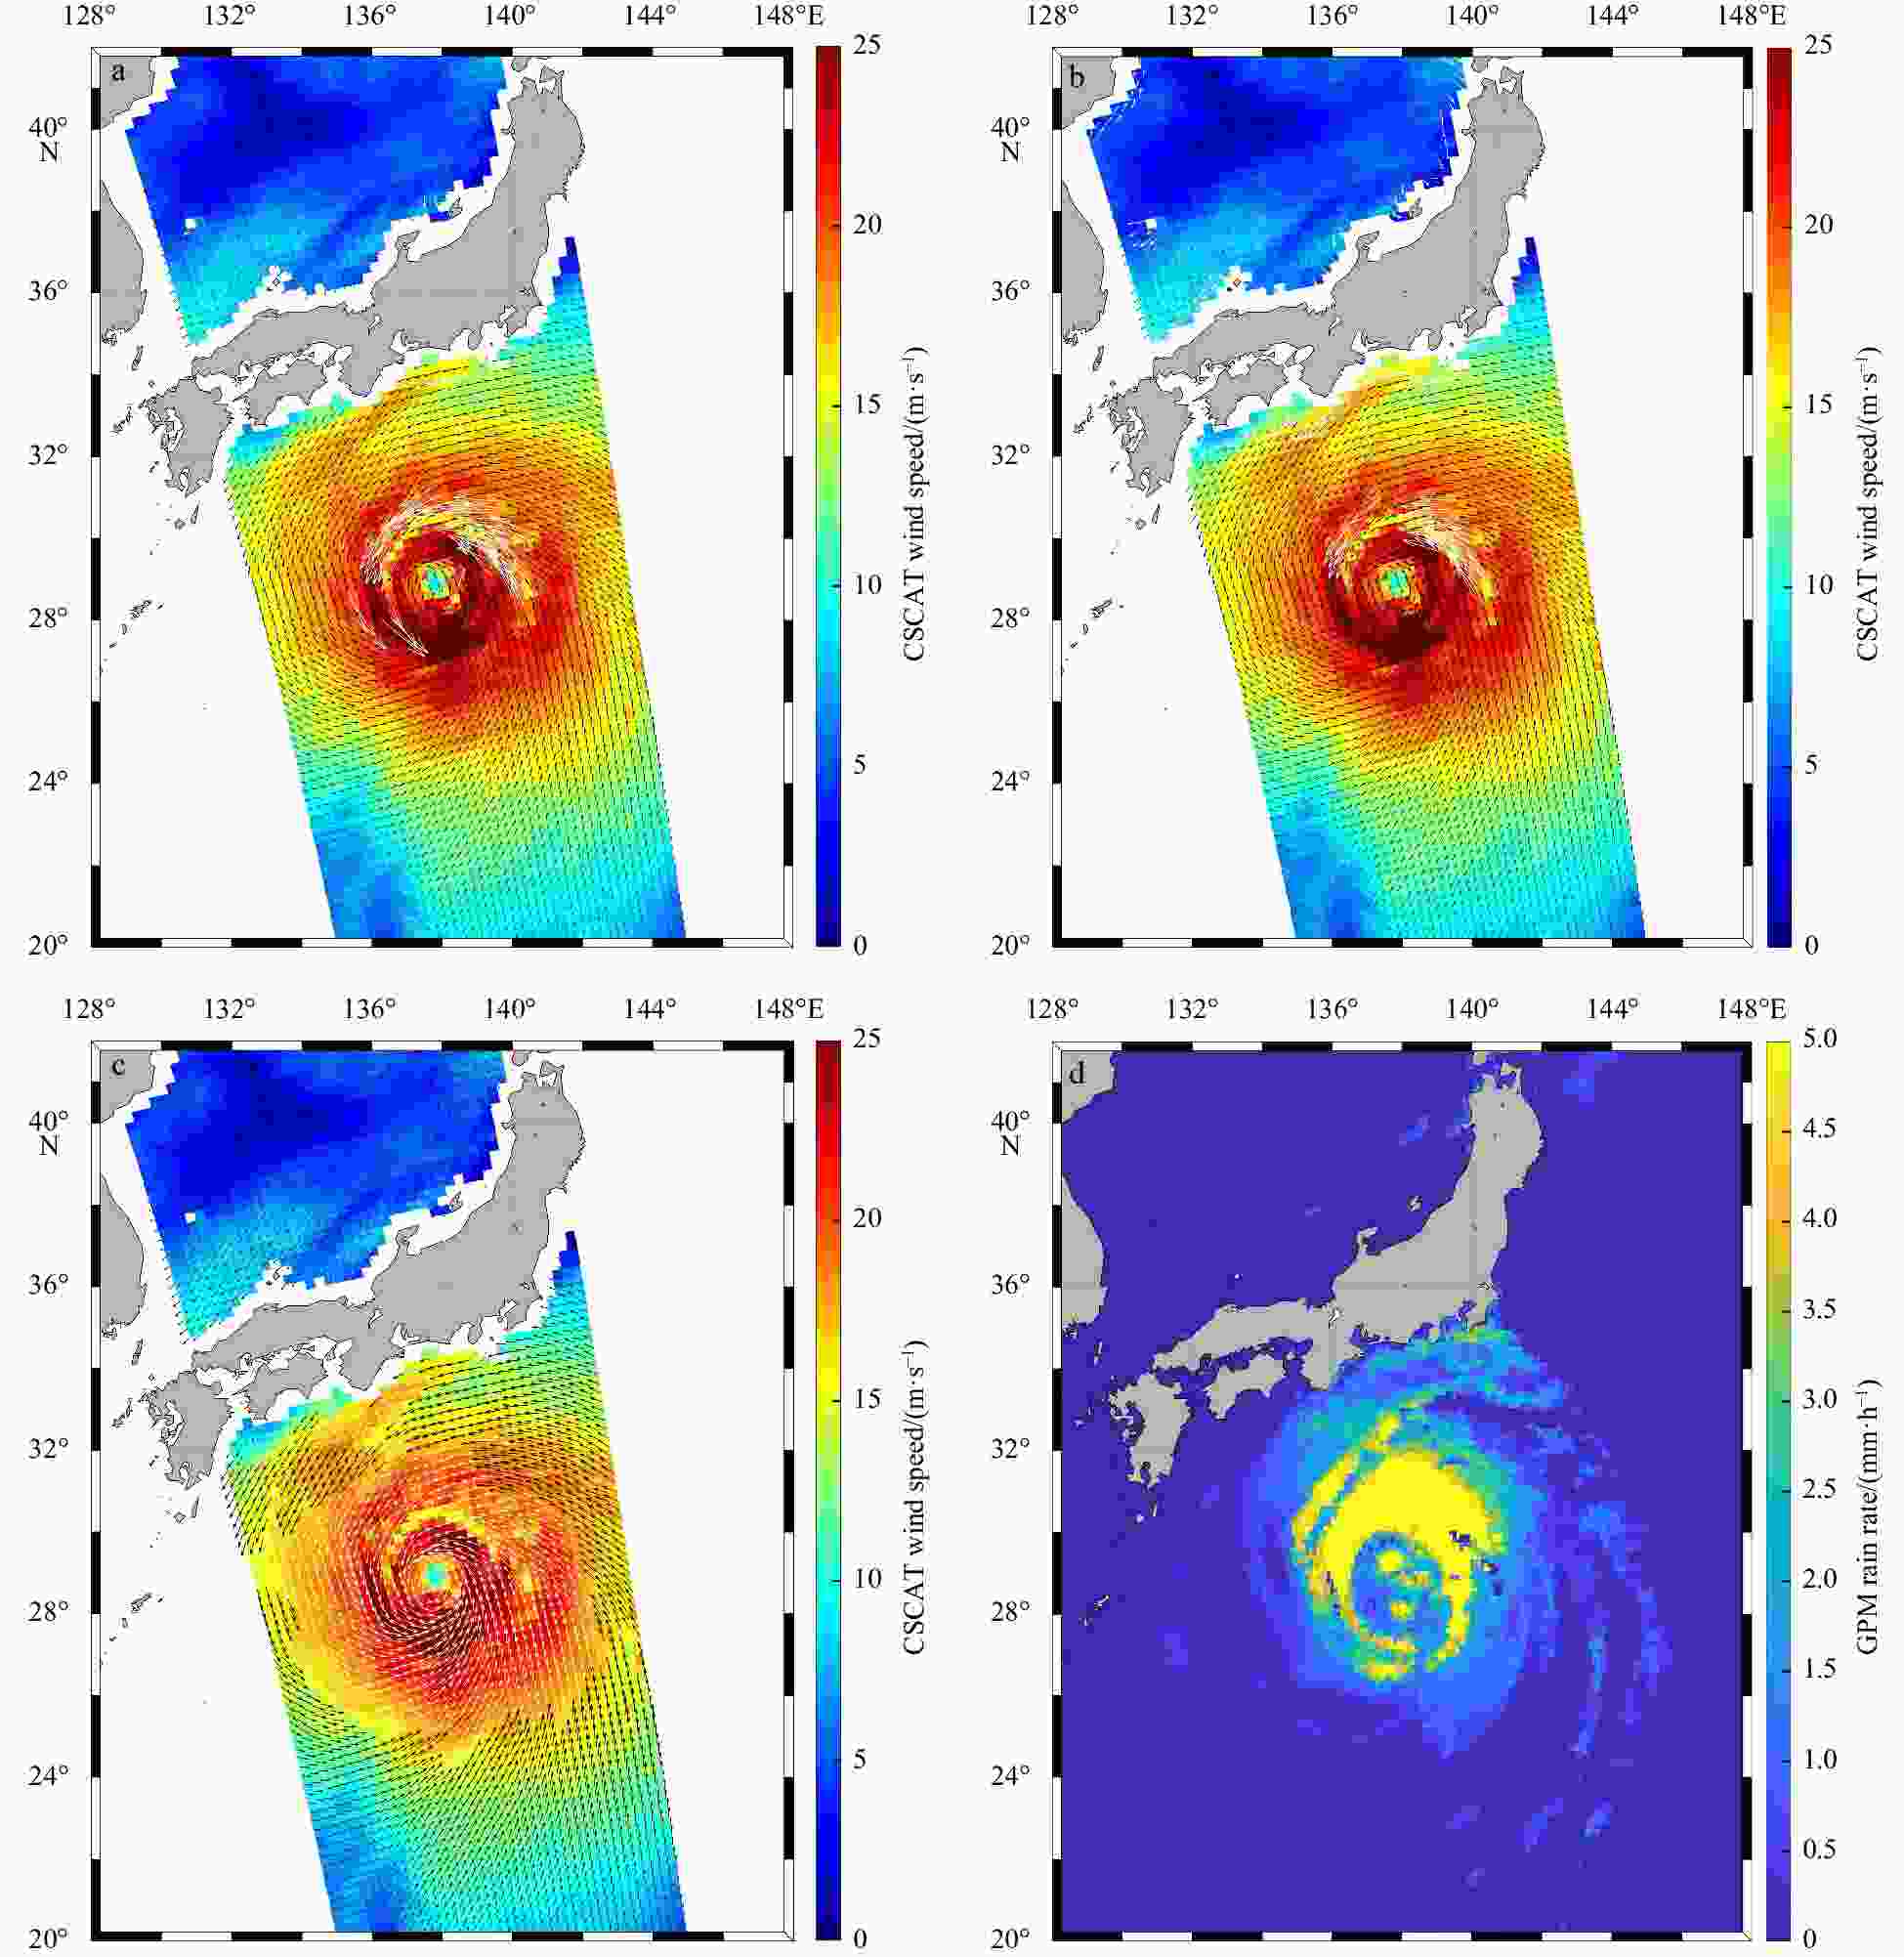
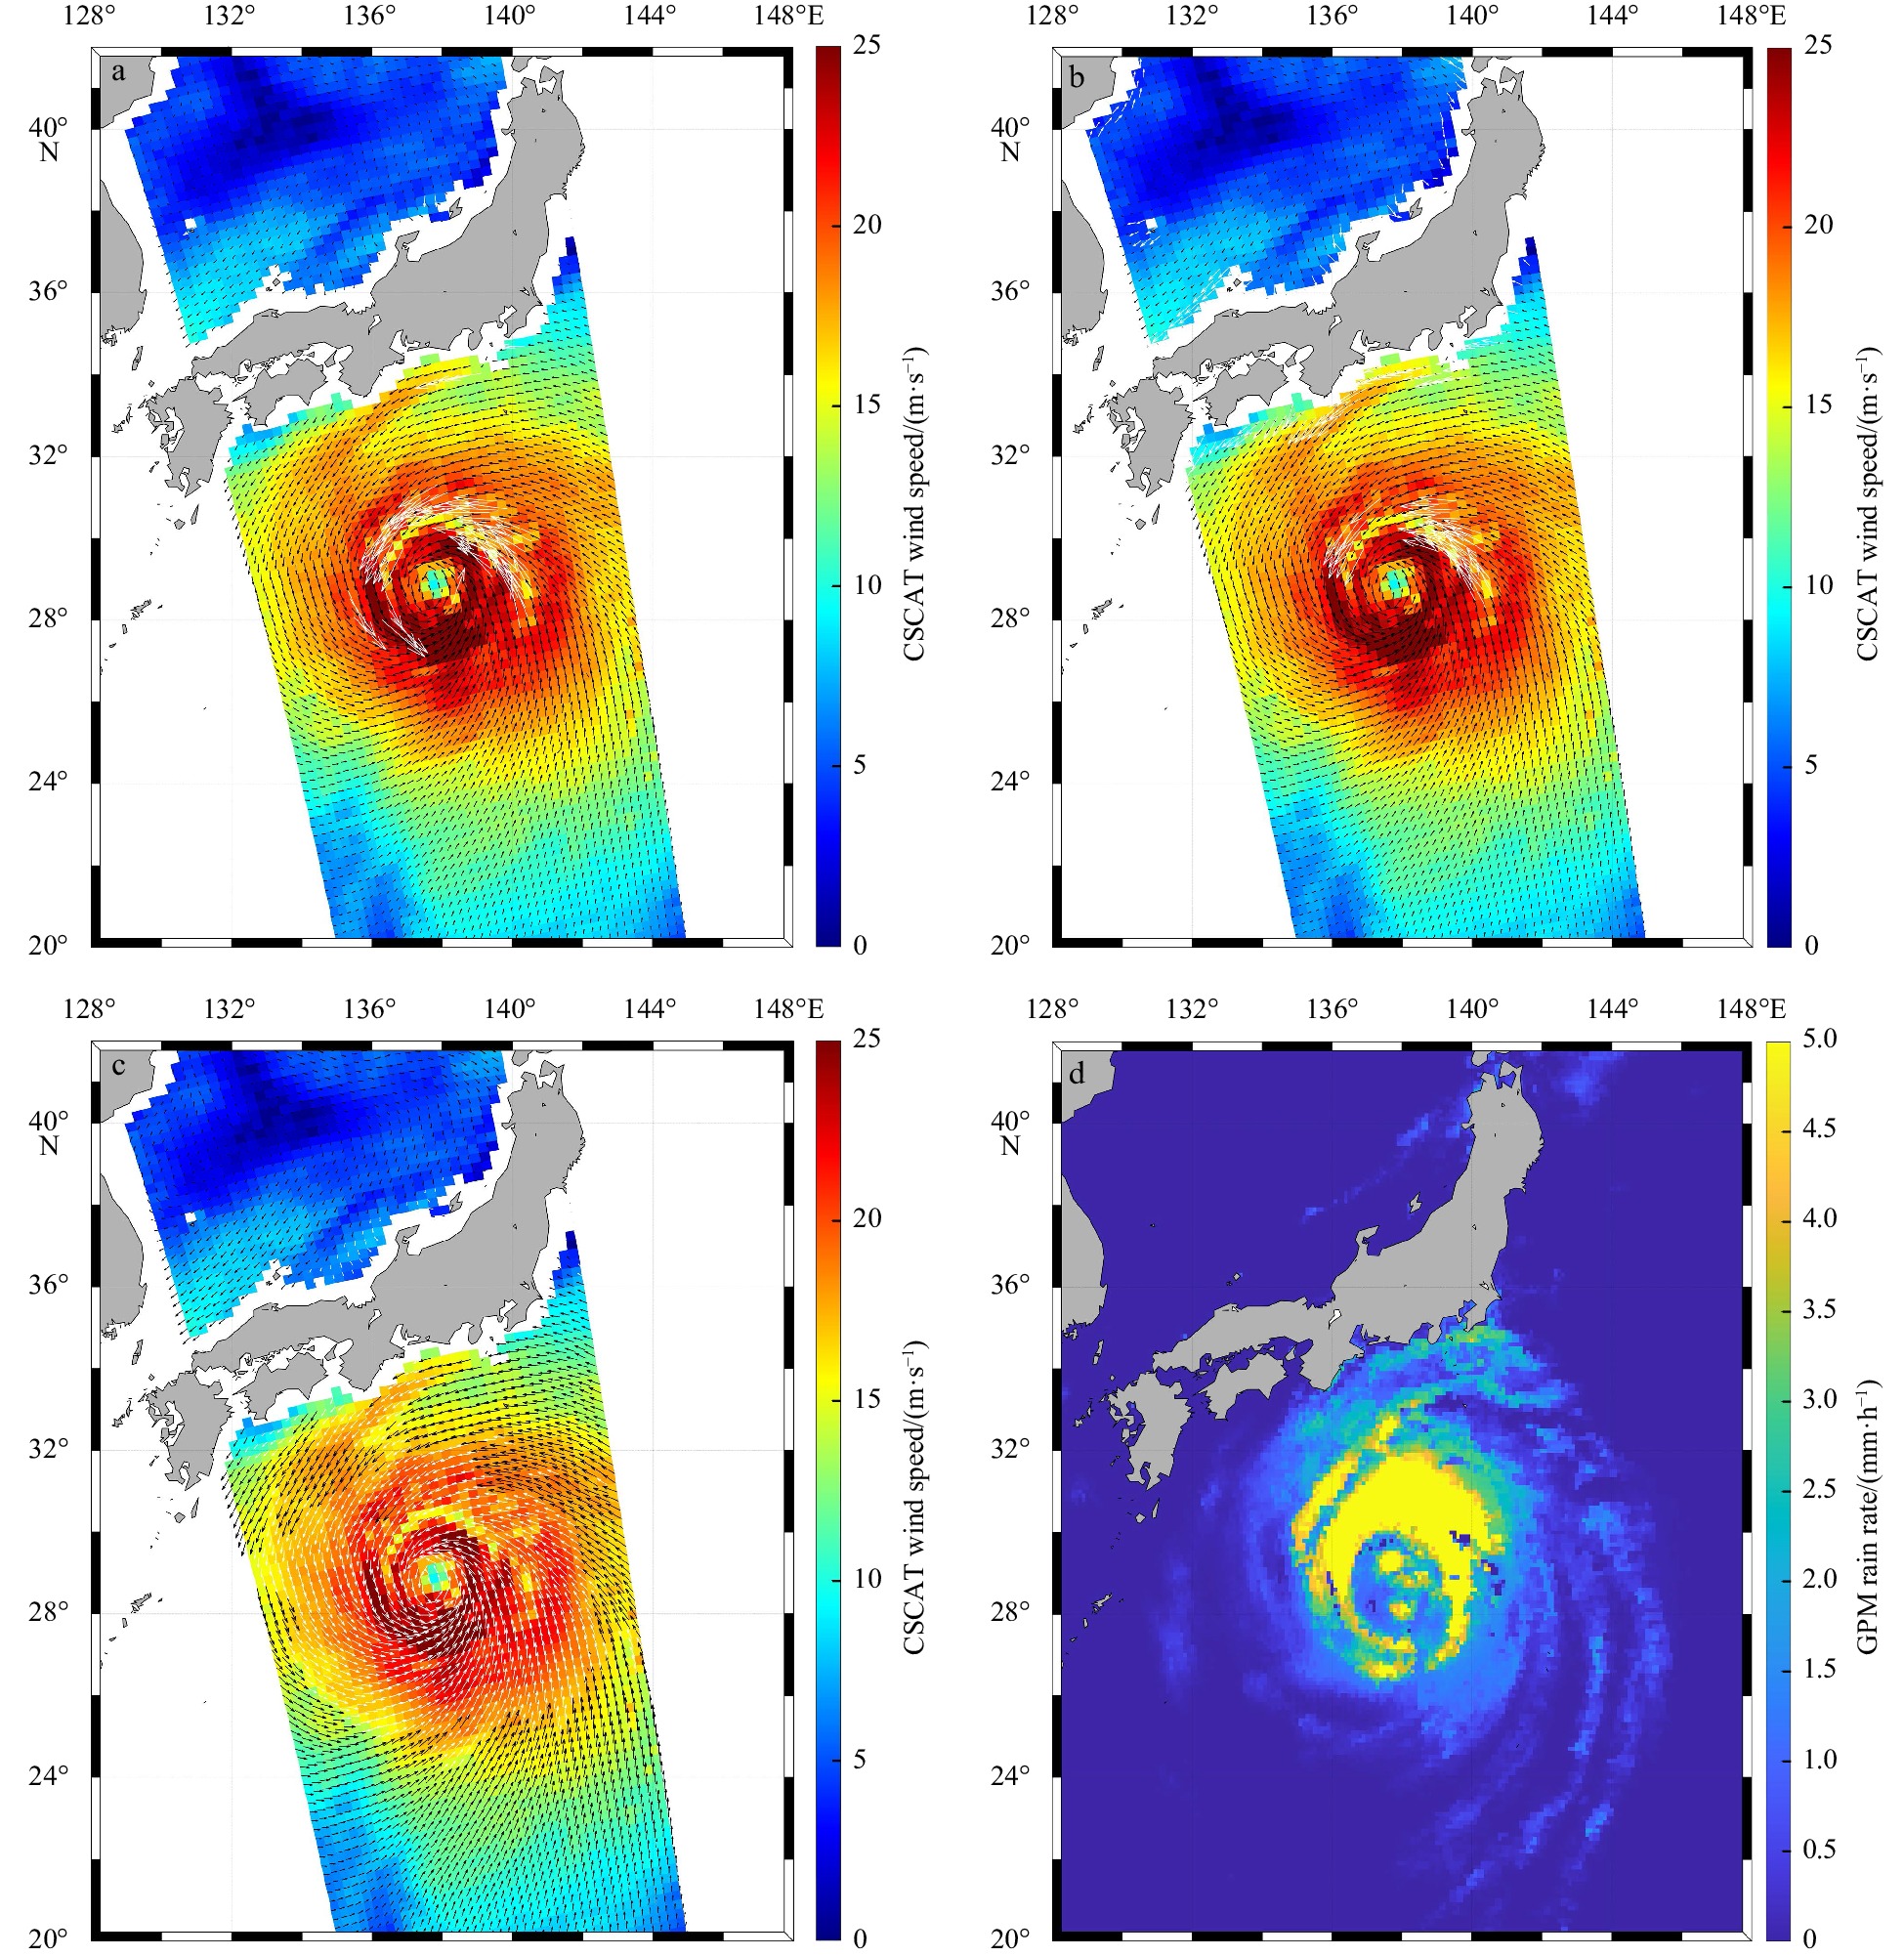
Figure 5. CSCAT wind vectors superimposed on the map of wind speed (a–c) and the collocated GPM rain rate (d). White (black) arrows indicate the winds rejected (accepted) by the maximum likelihood estimator -based quality control (a), the averaged MLE-based quality control (b), and the singularity exponents-based quality control (c).
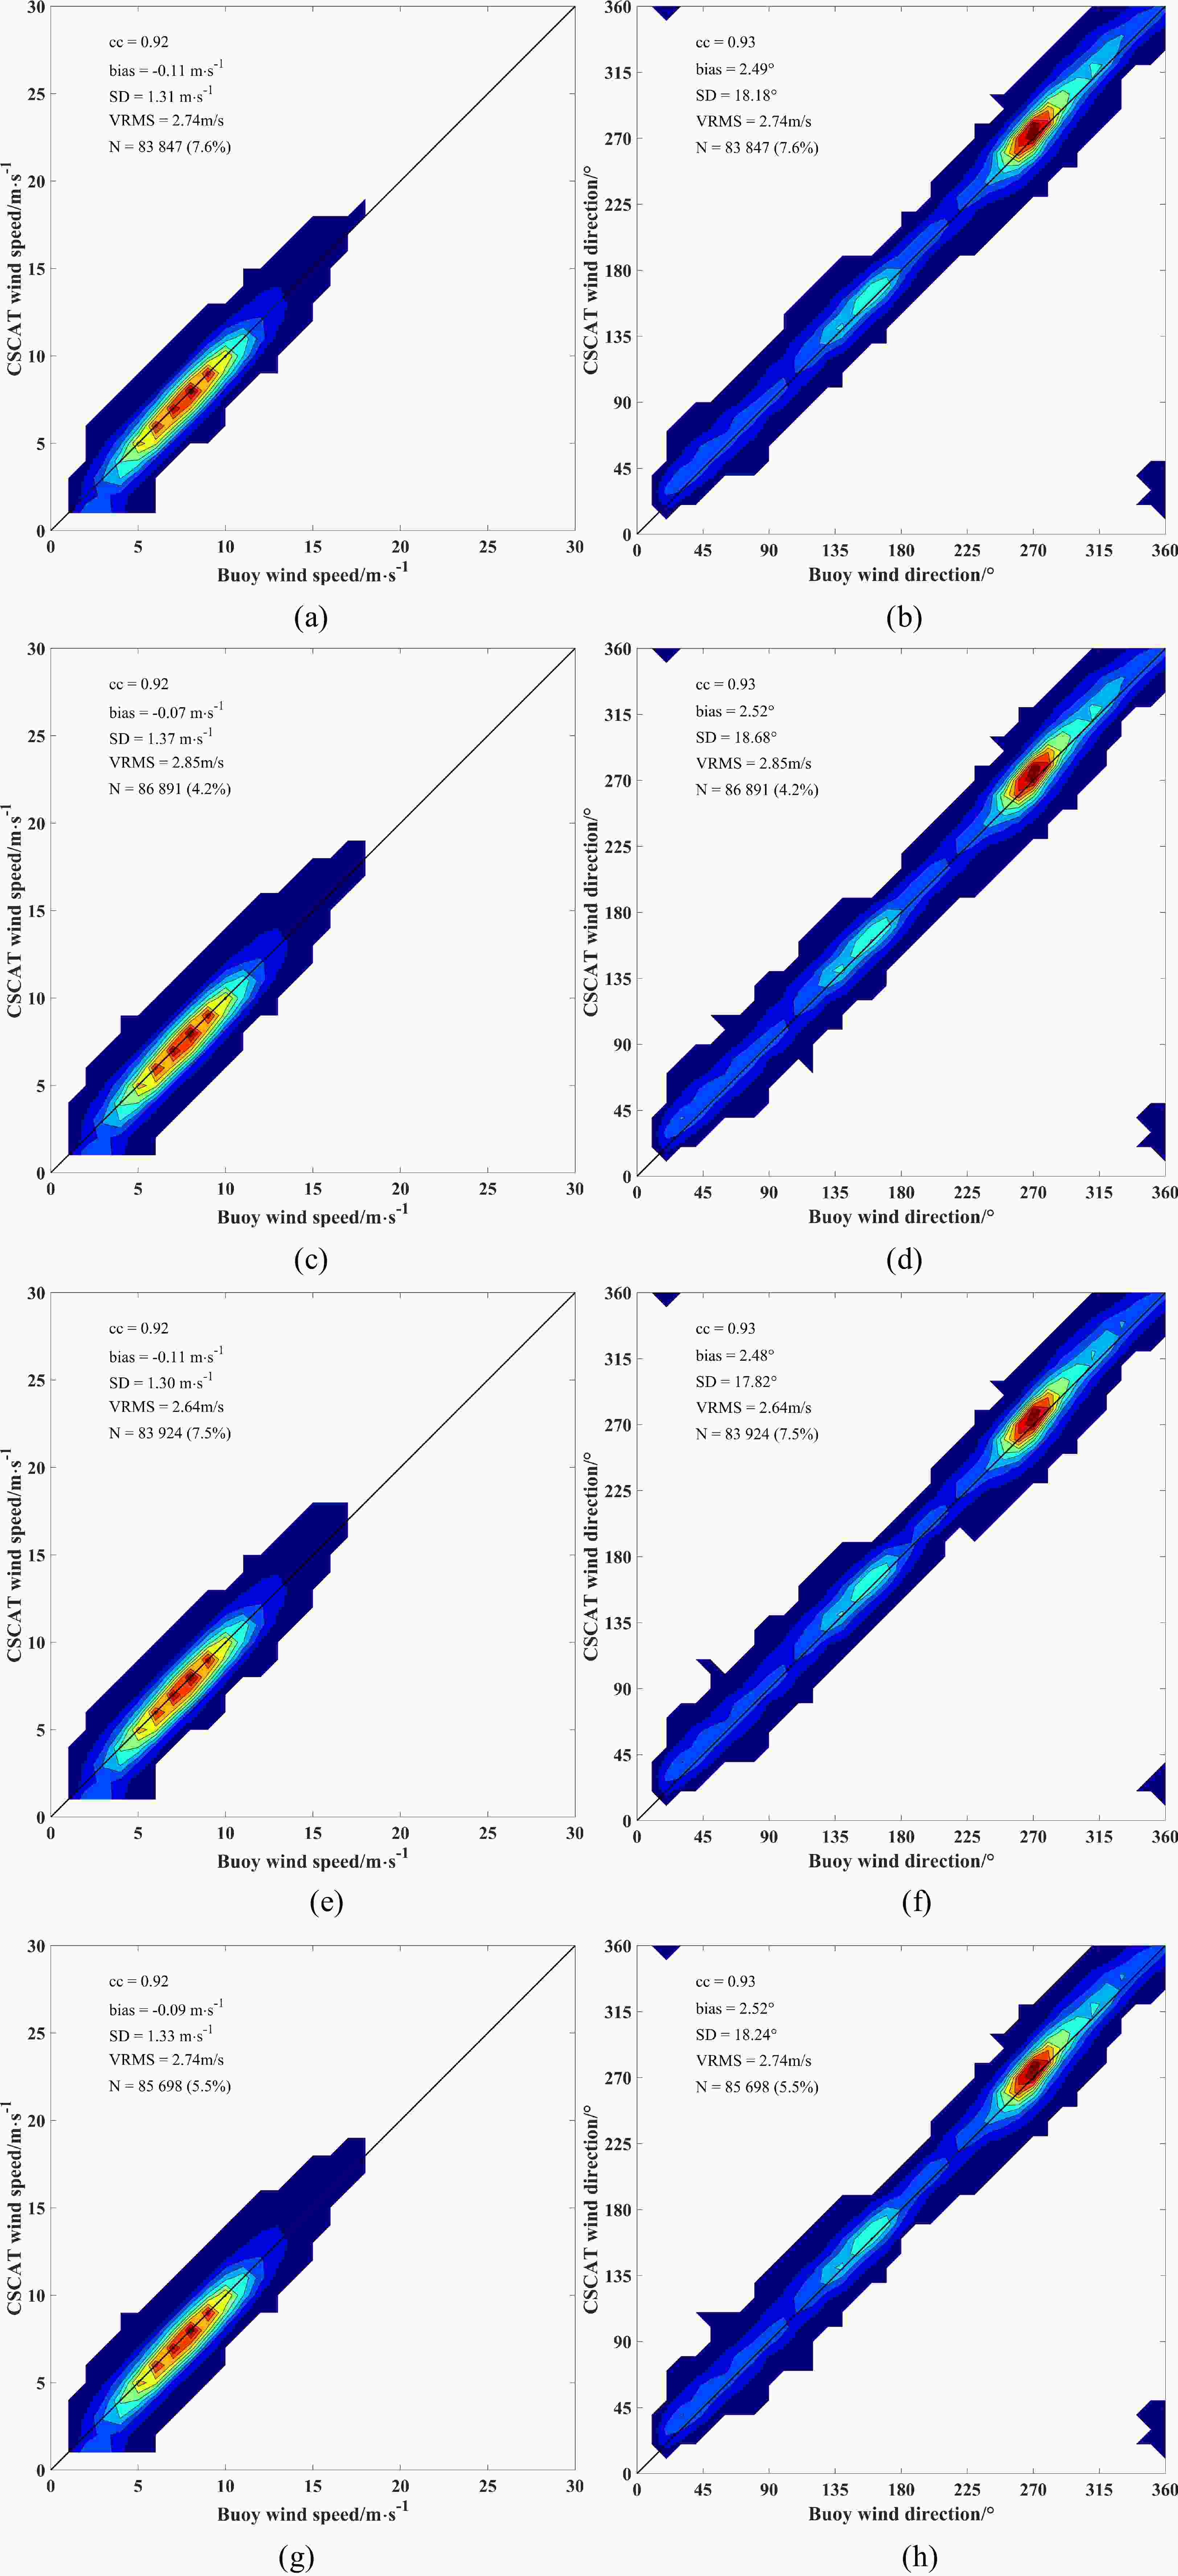
Figure 6. China-France Oceanography Satellite scatterometer reprocessed winds versus buoy wind speed (a, c, e, and g) and wind direction(b, d, f, and h) accepted by the operational maximum likelihood estimator (MLE)-based quality control, averaged MLE-based quality control, SE-based quality control, and the proposed new quality control, respectively.
Table 1. VRMS difference between China-France Oceanography Satellite scatterometer and numerical weather prediction winds categorized by different quality control (QC) methods under different wind speed conditions
Wind speed/(m·s−1) Statistical results over the QC accepted data/(m·s−1) Statistical results over the QC rejected data/(m·s−1) MLE MLEm SE MLE MLEm SE w ≤ 2 1.96 1.96 1.96 2.24 2.22 2.28 2 < w ≤ 14 1.92 1.91 1.90 3.54 3.60 3.74 w > 14 2.16 2.14 2.08 2.88 2.95 3.19  下载: 导出CSV
Table 2. VRMS difference between China-France Oceanography Satellite scatterometer and buoy winds categorized by different quality control (QC) methods in different wind speed bins
Wind speed/(m·s−1) Statistical results over the QC accepted data/(m·s−1) Statistical results over the QC rejected data/(m·s−1) MLE MLEm SE MLE MLEm SE w ≤ 2 2.26 2.25 2.23 4.84 4.54 5.71 2 < w ≤ 14 2.56 2.54 2.50 5.49 5.47 5.92 w > 14 5.37 4.87 4.64 6.51 7.40 7.62
下载: 导出CSV
Table 3. VRMS difference between China-France Oceanography Satellite scatterometer and buoy winds categorized by different quality control (QC) methods for WVCs at different swath
Swath Statistical results over the QC accepted data/(m·s−1) Statistical results over the QC rejected data/(m·s−1) MLE MLEm SE MLE MLEm SE Nadir region 2.81 2.87 2.71 4.72 5.31 5.83 Sweet region 2.62 2.73 2.56 5.41 5.85 5.73 Outer swath 2.98 3.11 2.88 5.81 5.79 6.19
下载: 导出CSV
Table 4. Percentage of rain contaminated data (with GPM RR > 0 mm/h or GPM RR >1 mm/h) for the quality control (QC)-rejected data by different quality indicators over the three swath regions
Swath Percentage of GPM RR > 0 mm/h over the QC rejected data/% Percentage of GPM RR > 1 mm/h over the QC rejected data/% MLE MLEm SE MLE MLEm SE Nadir region 51.0 58.5 47.7 24.1 28.1 20.0 Sweet region 54.3 61.3 50.4 26.1 29.8 22.4 Outer swath 48.9 55.2 53.0 23.4 26.8 25.0
下载: 导出CSV
Table 5. Percentage of rain contaminated data (with GPM RR > 0 mm/h or GPM RR >1 mm/h) over the quality control (QC)-rejected data by different QC indicators in different wind speed bins
Wind speed/
(m·s−1)Percentage of GPM RR > 0 mm/h over the QC rejected data/% Percentage of GPM RR > 1 mm/h over the QC rejected data/% MLE MLEm SE MLE MLEm SE w ≤ 2 8.5 23.3 31.5 1.2 4.7 5.8 2 < w ≤ 14 54.5 61.0 50.1 28.1 31.4 23.7 w > 14 52.3 53.3 57.7 17.7 18.7 21.1
下载: 导出CSV
Table 6. Percentage of rain-contaminated data (with GPM RR > 0 mm/h or GPM RR > 1 mm/h) over the quality control-rejected WVCs for different swaths
Swath Percentage of GPM RR > 0 mm/h
over all rain contaminated data/%Percentage of GPM RR > 1 mm/h
over all rain contaminated data/%MLE MLEm SE MLE MLEm SE Nadir region 17.1 19.0 16.1 8.1 9.1 6.7 Sweet region 18.6 20.3 17.3 8.9 9.9 7.7 Outer swath 16.8 18.3 18.2 8.0 8.9 8.6
下载: 导出CSV
Table 7. Percentage of rain contaminated data (with GPM RR > 0 mm/h or GPM RR > 1 mm/h) over the quality control-rejected wind vector cells for different wind speed bins
Wind speed/(m·s−1)Percentage of GPM RR > 0 mm/h
over all rain contaminated data/%Percentage of GPM RR > 1 mm/h
over all rain contaminated data/%MLE MLEm SE MLE MLEm SE w ≤ 2 1.6 3.9 6.1 0.2 0.8 1.2 2 < w ≤ 14 17.7 19.9 16.6 9.1 10.2 7.8 w > 14 19.1 19.0 20.7 6.5 6.7 7.5
下载: 导出CSV
-
Brennan M J, Hennon C C, Knabb R D. 2009. The operational use of QuikSCAT ocean surface vector winds at the National Hurricane Center. Weather and Forecasting, 24(3): 621–645, doi: 10.1175/2008WAF2222188.1 Chen Yaodeng, Cui Yemeng, Lin Wenming, et al. 2023. The impacts of assimilating CFOSAT scatterometer winds for Typhoon cases based on real-time rain quality control. Atmospheric Research, 285: 106621, doi: 10.1016/j.atmosres.2023.106621 Huddleston J N, Stiles B W. 2000. A multidimensional histogram rain-flagging technique for SeaWinds on QuikSCAT. In: Proceedings of the IGARSS 2000. IEEE 2000 International Geoscience and Remote Sensing Symposium. Honolulu, HI, USA: IEEE, 3: 1232–1234,doi: 10.1109/IGARSS.2000.858077 Huffman G J, Bolvin D T, Braithwaite D, et al. 2018. NASA global precipitation measurement (GPM) integrated multi-satellite retrievals for GPM (IMERG). Greenbelt, MD, USA: NASA.https://gpm.nasa.gov/sites/default/files/document_files/IMERG_ATBD_V5.2_0.pdf [2018-02-07/2023-12-20] Lang Shuyan, Lin Wenming, Zhang Yi, et al. 2022. On the quality control of HY-2 scatterometer high winds. Remote Sensing, 14(21): 5565, doi: 10.3390/rs14215565 Lin Wenming, Dong Xiaolong, Portabella M, et al. 2019. A perspective on the performance of the CFOSAT rotating fan-beam scatterometer. IEEE Transactions on Geoscience and Remote Sensing, 57(2): 627–639, doi: 10.1109/TGRS.2018.2858852 Lin Wenming, Portabella M. 2017. Toward an improved wind quality control for RapidScat. IEEE Transactions on Geoscience and Remote Sensing, 55(7): 3922–3930, doi: 10.1109/TGRS.2017.2683720 Lin Wenming, Portabella M, Stoffelen A, et al. 2014. Rain identification in ASCAT winds using singularity analysis. IEEE Geoscience and Remote Sensing Letters, 11(9): 1519–1523, doi: 10.1109/LGRS.2014.2298095 Lin Wenming, Portabella M, Stoffelen A, et al. 2015a. ASCAT wind quality control near rain. IEEE Transactions on Geoscience and Remote Sensing, 53(8): 4165–4177, doi: 10.1109/TGRS.2015.2392372 Lin Wenming, Portabella M, Stoffelen A, et al. 2015b. ASCAT wind quality under high subcell wind variability conditions. Journal of Geophysical Research: Oceans, 120(8): 5804–5819, doi: 10.1002/2015JC010861 Lin Wenming, Portabella M, Turiel A, et al. 2016. An improved singularity analysis for ASCAT wind quality control: Application to low winds. IEEE Transactions on Geoscience and Remote Sensing, 54(7): 3890–3898, doi: 10.1109/TGRS.2016.2529700 Liu W T, Katsaros K B, Businger J A. 1979. Bulk parameterization of air-sea exchanges of heat and water vapor including the molecular constraints at the interface. Journal of the Atmospheric Sciences, 36(9): 1722–1735, doi: 10.1175/1520-0469(1979)036<1722:BPOASE>2.0.CO;2 Liu Jianqiang, Lin Wenming, Dong Xiaolong, et al. 2020. First results from the rotating fan beam scatterometer onboard CFOSAT. IEEE Transactions on Geoscience and Remote Sensing, 58(12): 8793–8806, doi: 10.1109/TGRS.2020.2990708 Liu Siqi, Lin Wenming, Portabella M, et al. 2022. Characterization of tropical cyclone intensity using the HY-2B scatterometer wind data. Remote Sensing, 14(4): 1035, doi: 10.3390/rs14041035 Mironov A S, Quilfen Y, Piolle J F, et al. 2023. A method for continues calibration of a rotating antenna scatterometer in application to CFOSAT measurements. In: Proceedings of the IGARSS 2023-2023 IEEE International Geoscience and Remote Sensing Symposium. Pasadena, CA, USA: IEEE, 4072–4075 Mou Xiaoheng, Lin Wenming, He Yijun. 2023. Towards a consistent wind data record for the CFOSAT scatterometer. Remote Sensing, 15(8): 2081, doi: 10.3390/rs15082081 Peng Yihuan, Xie Xuetong, Lin Mingsen, et al. 2021. A study of sea surface rain identification based on HY-2A scatterometer. Remote Sensing, 13(17): 3475, doi: 10.3390/rs13173475 Pierson Jr W J. 1989. Probabilities and statistics for backscatter estimates obtained by a scatterometer. Journal of Geophysical Research: Oceans, 94(C7): 9743–9759 Portabella M, Lin Wenming, Stoffelen A, et al. 2021. Consolidation of quality control procedures for scatterometers. In: Proceedings of the 2021 IEEE International Geoscience and Remote Sensing Symposium IGARSS. Brussels, Belgium: IEEE, 1630–1633 Portabella M, Stoffelen A. 2001. Rain detection and quality control of SeaWinds. Journal of Atmospheric and Oceanic Technology, 18(7): 1171–1183, doi: 10.1175/1520-0426(2001)018<1171:RDA QCO>2.0.CO;2 Portabella M, Stoffelen A. 2002a. A comparison of KNMI quality control and JPL rain flag for SeaWinds. Canadian Journal of Remote Sensing, 28(3): 424–430, doi: 10.5589/m02-040 Portabella M, Stoffelen A. 2002b. Characterization of residual information for SeaWinds quality control. IEEE transactions on geoscience and remote sensing, 40(12): 2747–2759, doi: 10.1109/TGRS.2002.807750 Portabella M, Stoffelen A, Lin Wenming, et al. 2012. Rain effects on ASCAT-retrieved winds: Toward an improved quality control. IEEE Transactions on Geoscience and Remote Sensing, 50(7): 2495–2506, doi: 10.1109/TGRS.2012.2185933 Prakash S, Mitra A K, Pai D S, et al. 2016. From TRMM to GPM: How well can heavy rainfall be detected from space?. Advances in Water Resources, 88: 1–7 Stiles B W, Dunbar R S. 2010. A neural network technique for improving the accuracy of scatterometer winds in rainy conditions. IEEE Transactions on Geoscience and Remote Sensing, 48(8): 3114–3122, doi: 10.1109/TGRS.2010.2049362 Stiles B W, Yueh S H. 2002. Impact of rain on spaceborne Ku-band wind scatterometer data. IEEE Transactions on Geoscience and Remote Sensing, 40(9): 1973–1983, doi: 10.1109/TGRS.2002.803846 Stoffelen A, Anderson D. 1997. Scatterometer data interpretation: Measurement space and inversion. Journal of Atmospheric and Oceanic Technology, 14(6): 1298–1313, doi: 10.1175/1520-0426(1997)014<1298:SDIMSA>2.0.CO;2 Stoffelen A, Portabella M. 2006. On Bayesian scatterometer wind inversion. IEEE Transactions on Geoscience and Remote Sensing, 44(6): 1523–1533, doi: 10.1109/TGRS.2005.862502 Tournadre J, Quilfen Y. 2003. Impact of rain cell on scatterometer data: 1. Theory and modeling. Journal of Geophysical Research: Oceans, 108(C7): 3225 Verhoef A, Vogelzang J, Verspeek J, et al. 2015. PenWP user manual and reference guide. KNMI, De Bilt, the Netherlands: NWP SAF Rep. NWPSAF-KN-UD-009. https://knmi-scatterometer-website-prd.s3.amazonaws.com/publications/NWPSAF-KN-UD-009_PenWP_User_Guide_v4.0.pdf [2022–08/2023–12–23] Weissman D E, Bourassa M A. 2008. Measurements of the effect of rain-induced sea surface roughness on the QuikSCAT scatterometer radar cross section. IEEE Transactions on Geoscience and Remote Sensing, 46(10): 2882–2894, doi: 10.1109/TGRS.2008.2001032 Xu Ying, Liu Jianqiang, Xie Lingling, et al. 2019. China-France Oceanography Satellite (CFOSAT) simultaneously observes the typhoon-induced wind and wave fields. Acta Oceanologica Sinica, 38(11): 158–161, doi: 10.1007/s13131-019-1506-3 Xu Xingou, Stoffelen A. 2020. Improved rain screening for Ku-band wind scatterometry. IEEE Transactions on Geoscience and Remote sensing, 58(4): 2494–2503, doi: 10.1109/TGRS.2019.2951726 Xu Xingou, Stoffelen A, Lin Wenming, et al. 2022. Rain false-alarm-rate reduction for CSCAT. IEEE Geoscience and Remote Sensing Letters, 19: 1–5 Zhao Xiaokang, Lin Wenming, Portabella M, et al. 2022. Effects of rain on CFOSAT scatterometer measurements. Remote Sensing of Environment, 274: 113015, doi: 10.1016/j.rse.2022.113015 -


 点击查看大图
计量
- 文章访问数: 85
- HTML全文浏览量: 33
- PDF下载量: 11
- 被引次数: 0

