

Quantitative analysis and prediction of the sound field convergence zone in mesoscale eddy environment based on data mining methods
-
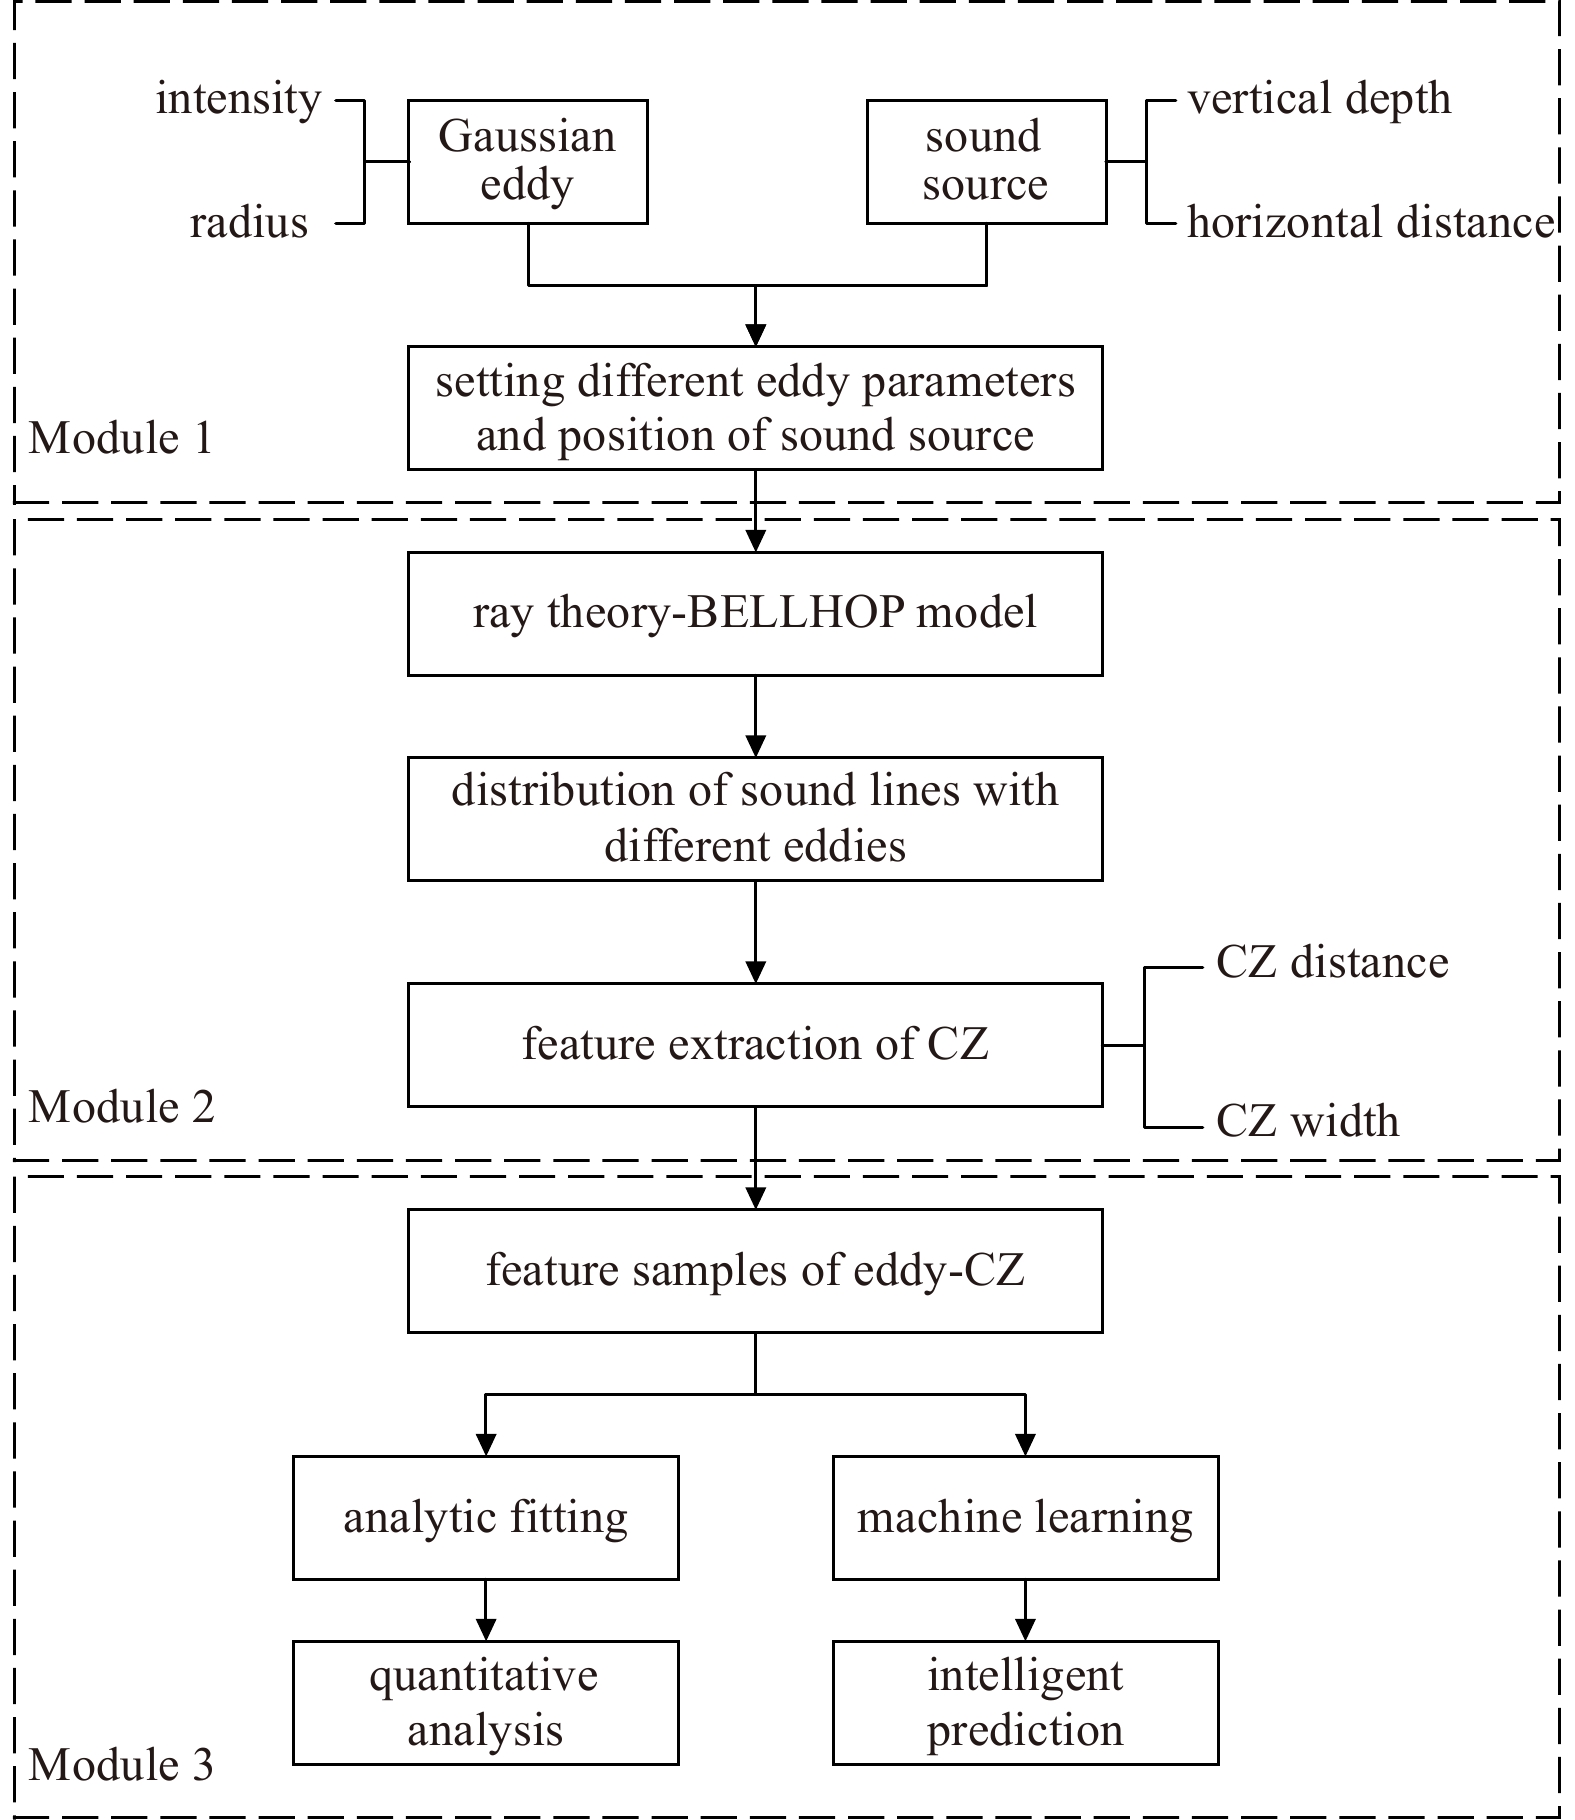
Abstract: The mesoscale eddy (ME) has a significant influence on the convergence effect in deep-sea acoustic propagation. This paper use statistical approaches to express quantitative relationships between the ME conditions and convergence zone (CZ) characteristics. Based on the Gaussian vortex model, we construct various sound propagation scenarios under different eddy conditions, and carry out sound propagation experiments to obtain simulation samples. With a large number of samples, we first adopt the unified regression to set up analytic relationships between eddy conditions and CZ parameters. The sensitivity of eddy indicators to the CZ is quantitatively analyzed. Then, we adopt the machine learning (ML) algorithms to establish prediction models of CZ parameters by exploring the nonlinear relationships between multiple ME indicators and CZ parameters. Through the research, we can express the influence of ME on the CZ quantitatively, and achieve the rapid prediction of CZ parameters in ocean eddies. The prediction accuracy (R) of the CZ distance (mean R: 0.9815) is obviously better than that of the CZ width (mean R: 0.8728). Among the three ML algorithms, Gradient Boosting Decision Tree has the best prediction ability (root mean square error (RMSE): 0.136), followed by Random Forest (RMSE: 0.441) and Extreme Learning Machine (RMSE: 0.518).
-
Key words:
- convergence zone /
- mesoscale eddy /
- statistic analysis /
- quantitative prediction /
- machine learning
-
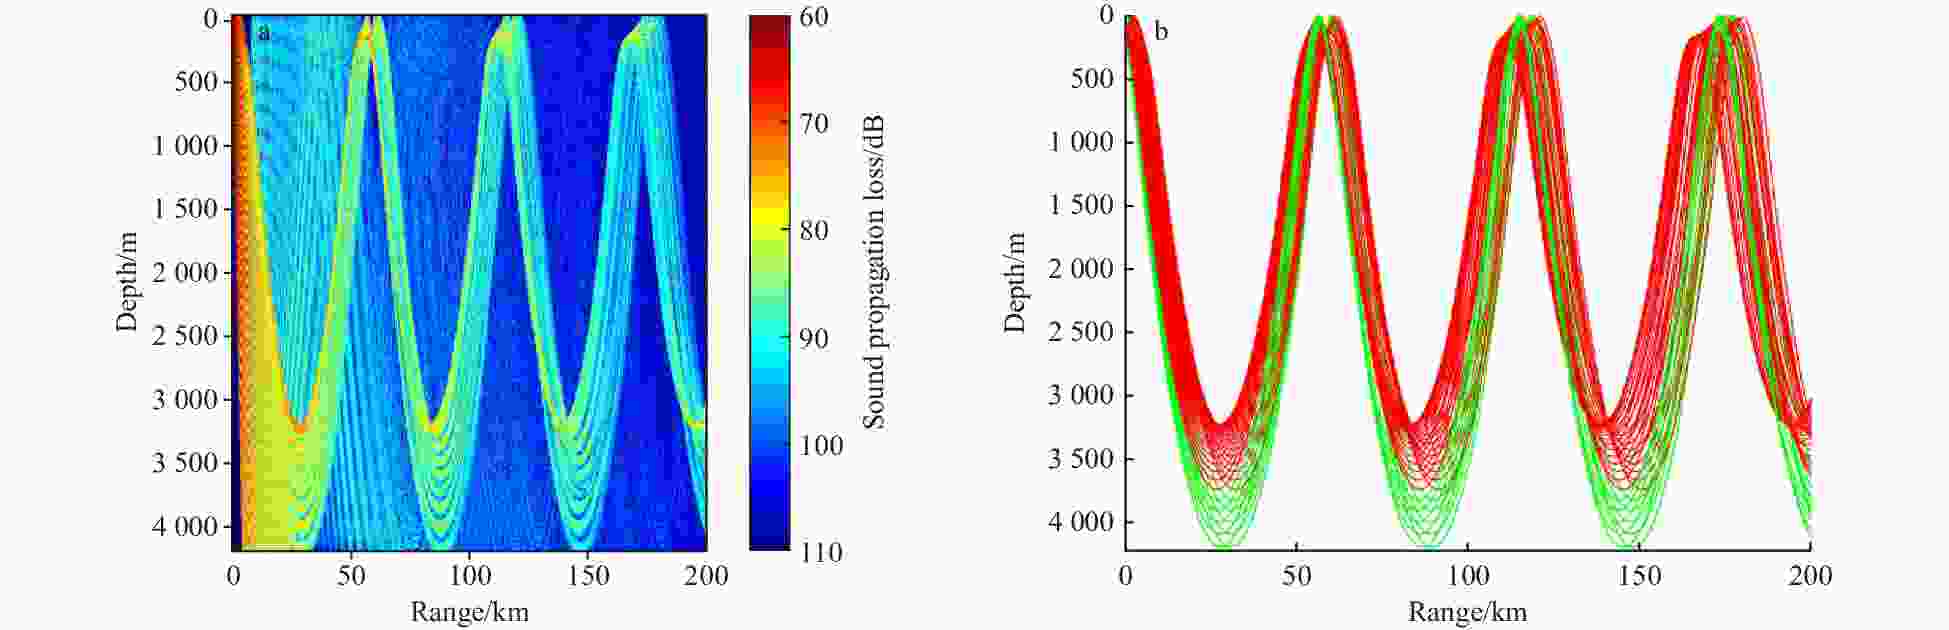
Figure 5. Characteristics of sound propagation with a warm eddy: the sound propagation loss (a) and sound ray (b) distribution. In b, the red line represents the refracted sound, and the green line represents the reflected sound.

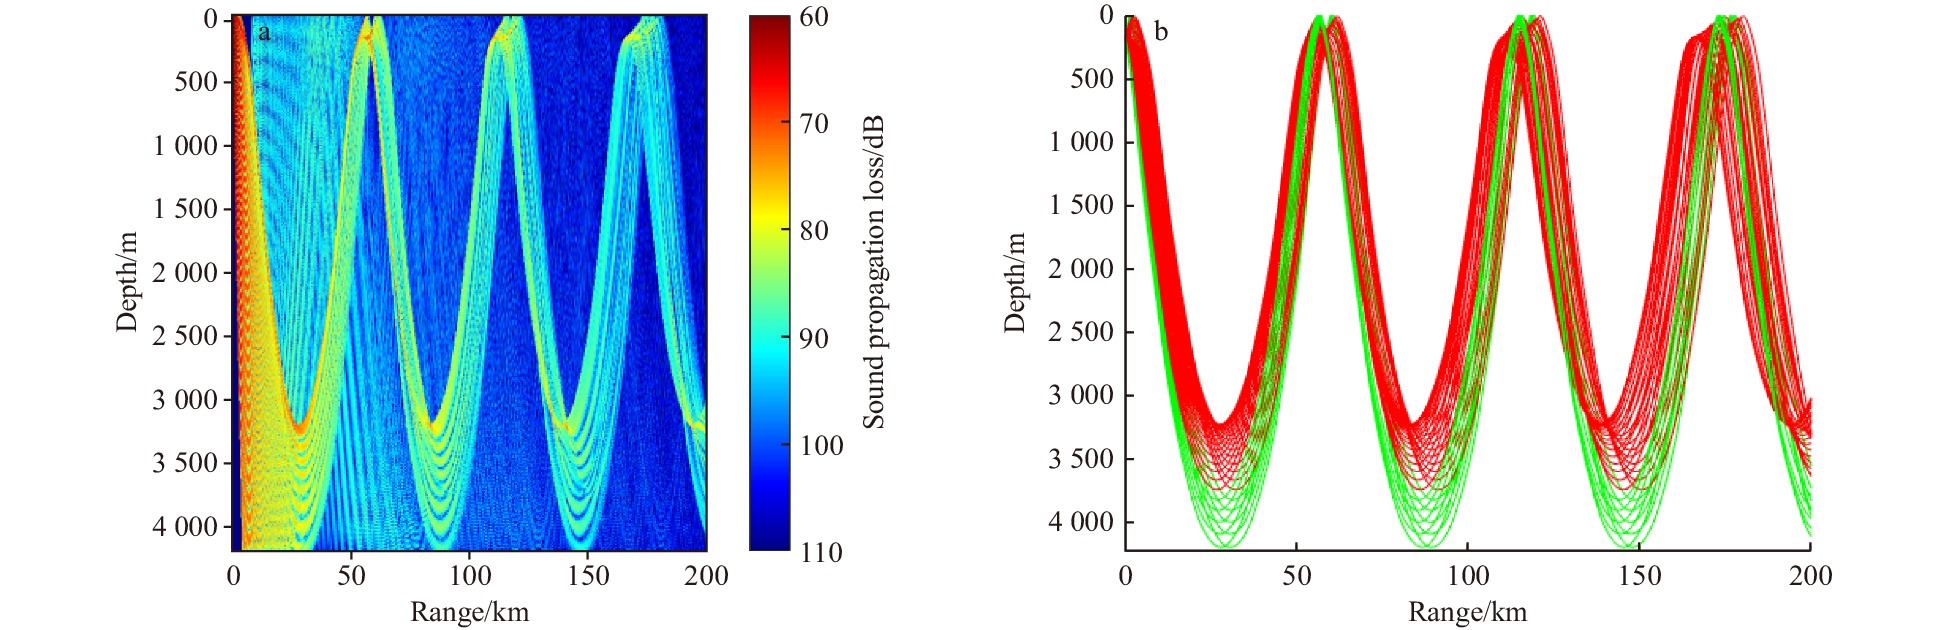
Figure 6. Characteristics of sound propagation with no eddy: the sound propagation loss (a) and sound ray (b) distribution. In b, the red line represents the refracted sound, and the green line represents the reflected sound.
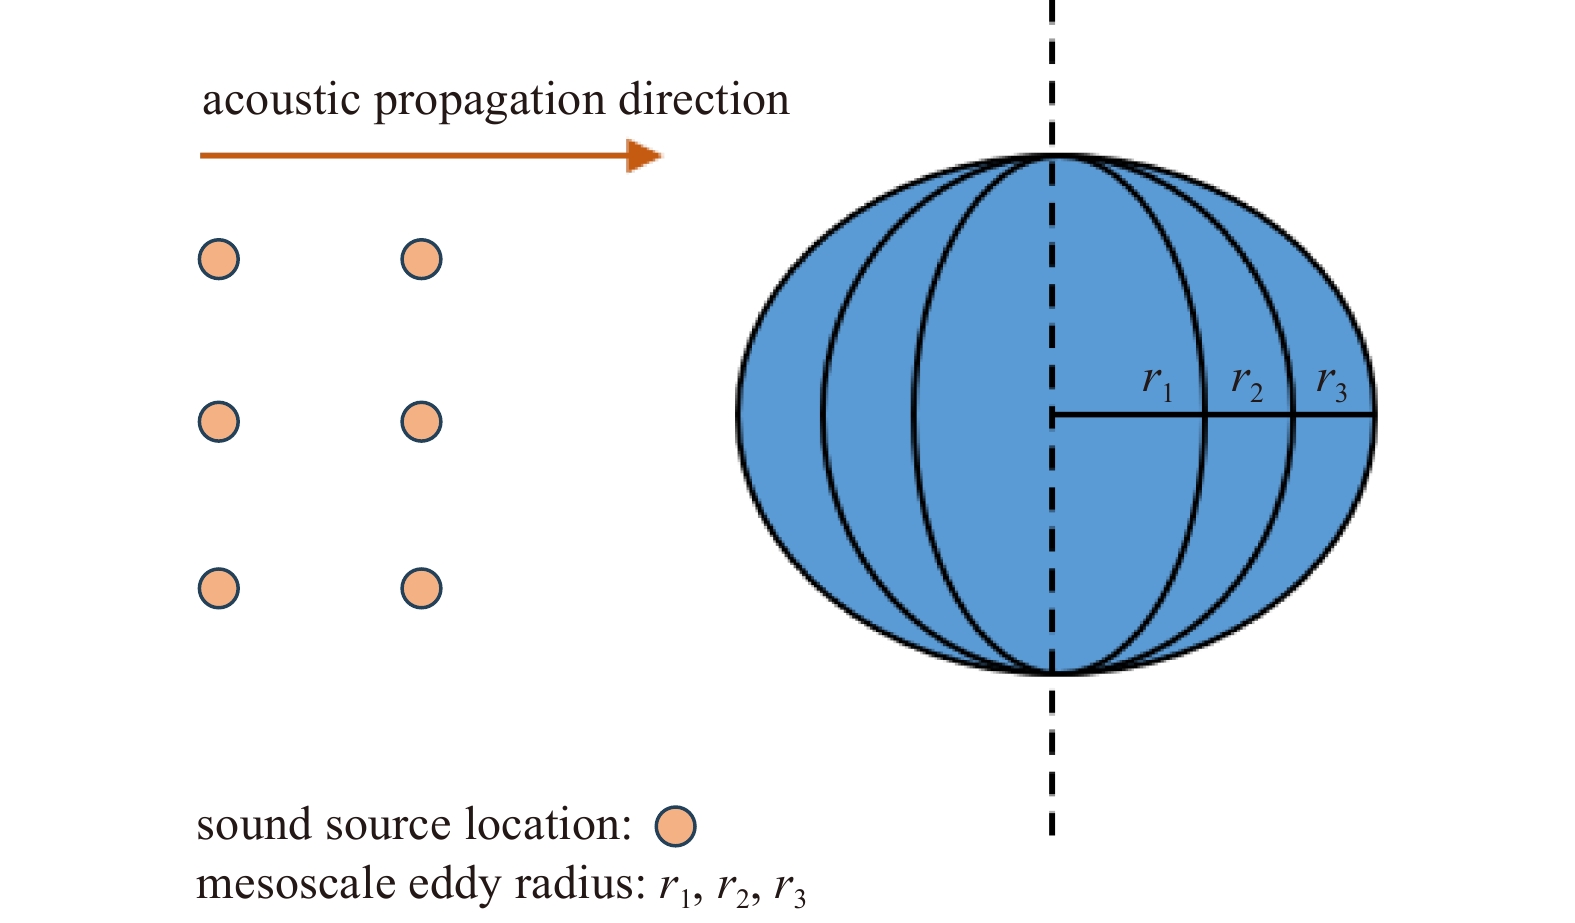
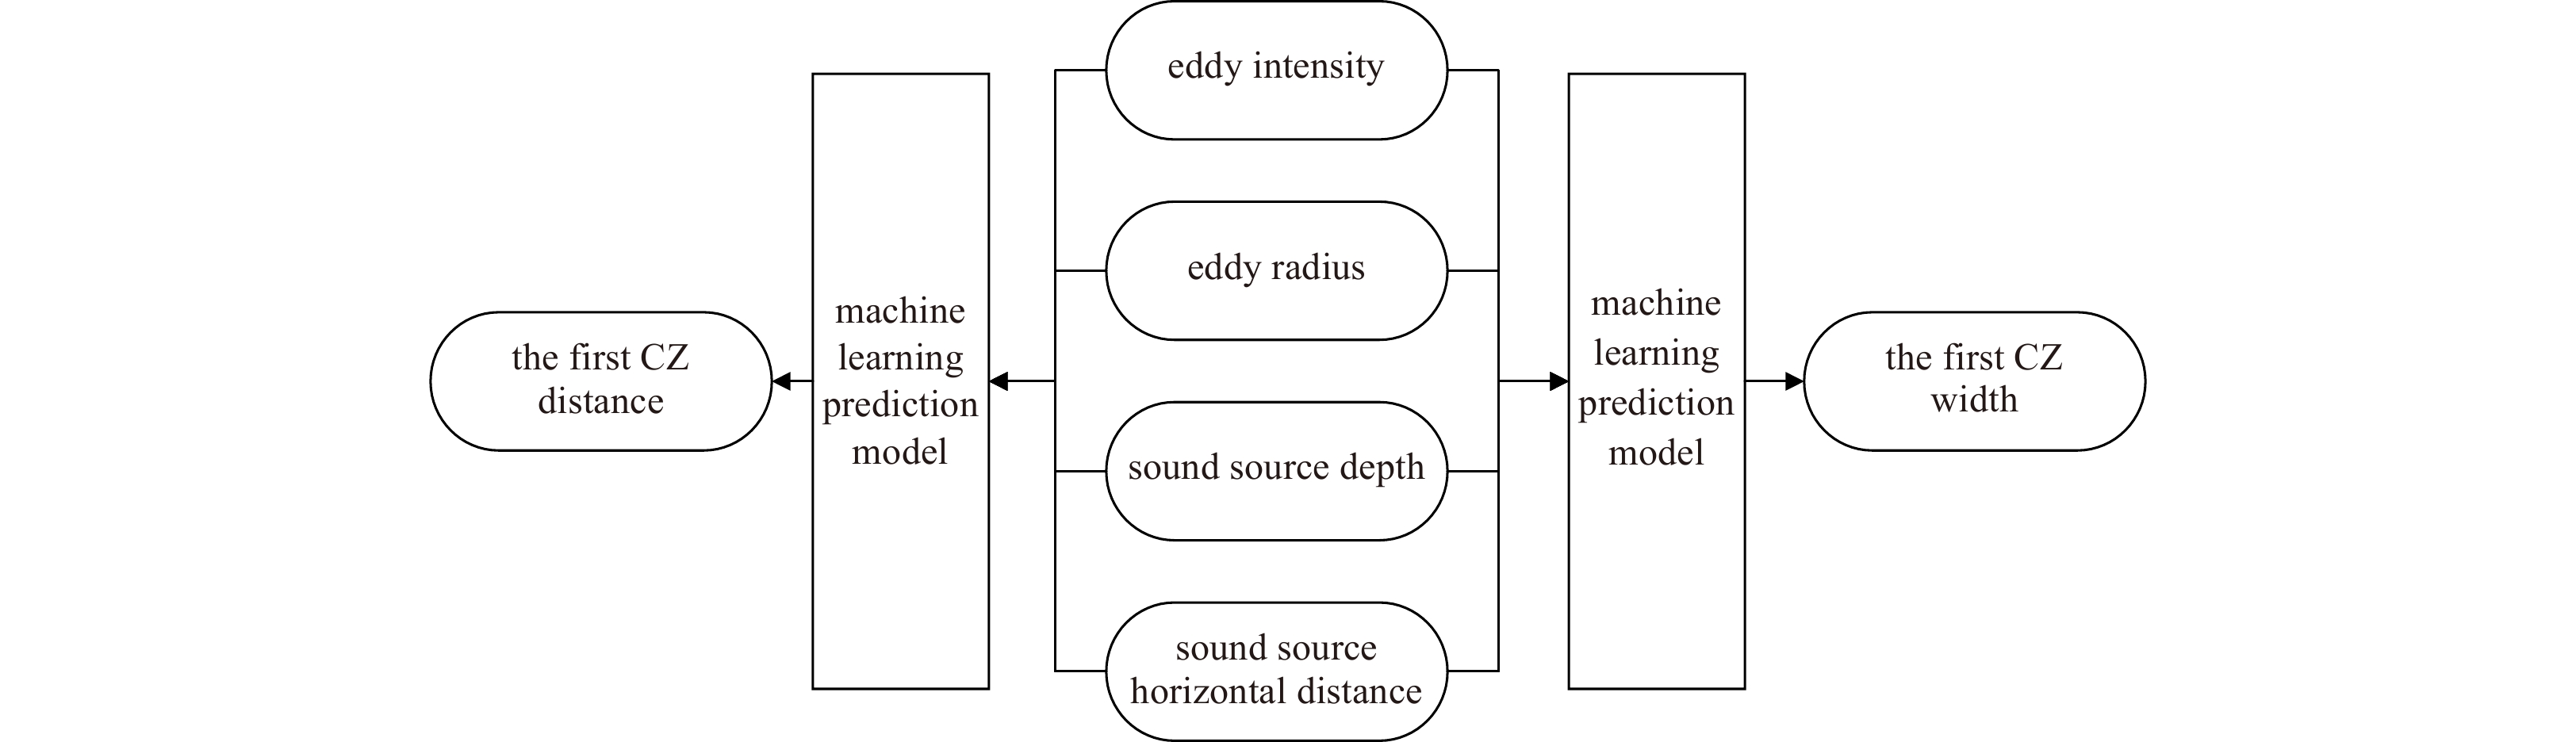
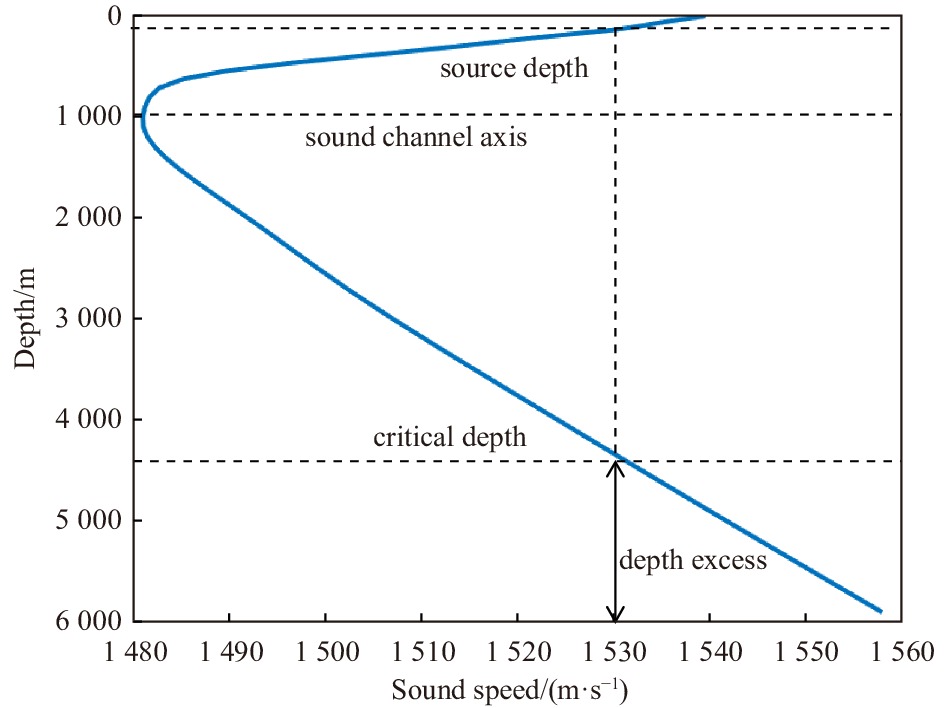
Table 1. The description of eddy parameters and sound source position
Parameter Definition Setting Eddy intensity/(m·s−1) it is characterized by the sound velocity difference between the eddy center and the edge value range is –50 m/s to +50 m/s, gap is +5 m/s;
+ indicates warm eddy and – indicates cold eddyEddy radius/km it is characterized by the horizontal distance between the eddy center and the edge value range is 20 km to 300 km, gap is 20 km Depth of sound source/m literal meaning value range is 100 m to 400 m, gap is 20 m Distance of sound source/km it is characterized by the horizontal distance of the sound source from the eddy center (vertical central axis) value range is 0 km to 150 km, gap is 15 km  下载: 导出CSV
Table 2. Regression analysis between CZ distance and eddy intensity
Model Depth/m Regression equation R2 F Sig. RMSE Linear regression model 100 y = 0.07615x + 53.15 0.992 14598.965 0 0.226 200 y = 0.08775x + 49.94 0.998 19823.564 0 0.307 300 y = 0.09979x + 47.14 0.988 10479.997 0 0.181 Quadratic regression model 100 y = 0.00024x2 + 0.07615x + 52.92 0.999 13874.476 0 0.079 200 y = 0.00032x2 + 0.08775x + 49.64 0.998 14462.807 0 0.121 300 y = 0.00017x2 + 0.04979x + 46.98 0.996 9134.502 0 0.096
下载: 导出CSV
Table 3. Regression analysis between CZ distance and eddy radius
Model Depth/m Regression equation R2 F Sig. RMSE Linear regression model 100 y = 0.01253x + 54.59 0.752 1124.873 0 0.625 200 y = 0.01651x + 51.37 0.839 1952.309 0 0.626 300 y = 0.00886x + 48.02 0.793 1267.598 0 0.392 Quadratic regression model 100 y = −0.00011x2 + 0.04102x + 52.93 0.963 11269.375 0 0.244 200 y = −0.00012x2 + 0.04471x + 49.73 0.973 14633.754 0 0.261 300 y = −0.00011x2 + 0.02719x + 46.96 0.979 15124.561 0 0.127
下载: 导出CSV
Table 4. Regression analysis between the CZ width and eddy intensity
Model Depth/m Regression equation R2 F Sig. RMSE Linear regression model 100 y = −0.03299x + 5.979 0.973 12531.632 0 0.264 200 y = −0.04228x + 9.829 0.978 13105.415 0 0.256 300 y = −0.06683x + 14.51 0.184 / / 4.549 Quadratic regression model 100 y = 0.00022x2 − 0.03299x + 5.77 0.942 9975.143 0 0.183 200 y = 0.00017x2 − 0.04228x + 9.67 0.966 10132.472 0 0.211 300 y = 0.00292x2 − 0.06683x + 11.68 0.454 / / 3.787 Note: / indicates invalid value.
下载: 导出CSV
Table 5. Regression analysis between the CZ width and eddy radius
Model Depth/m Regression equation R2 F RMSE Linear regression model 100 y = −0.00197x + 5.022 0.411 / 0.254 200 y = −0.00475x + 8.996 0.721 1024.143 0.256 300 y = 0.00516x + 12.81 0.789 1322.219 0.231 Quadratic regression model 100 y = 0.000032x2 − 0.01243x + 5.63 0.788 1387.458 0.133 200 y = 0.000019x2 − 0.01103x + 9.36 0.789 1269.655 0.226 300 y = −0.0000015x2 − 0.0054x + 12.82 0.787 1463.914 0.236 Note: / indicates invalid value.
下载: 导出CSV
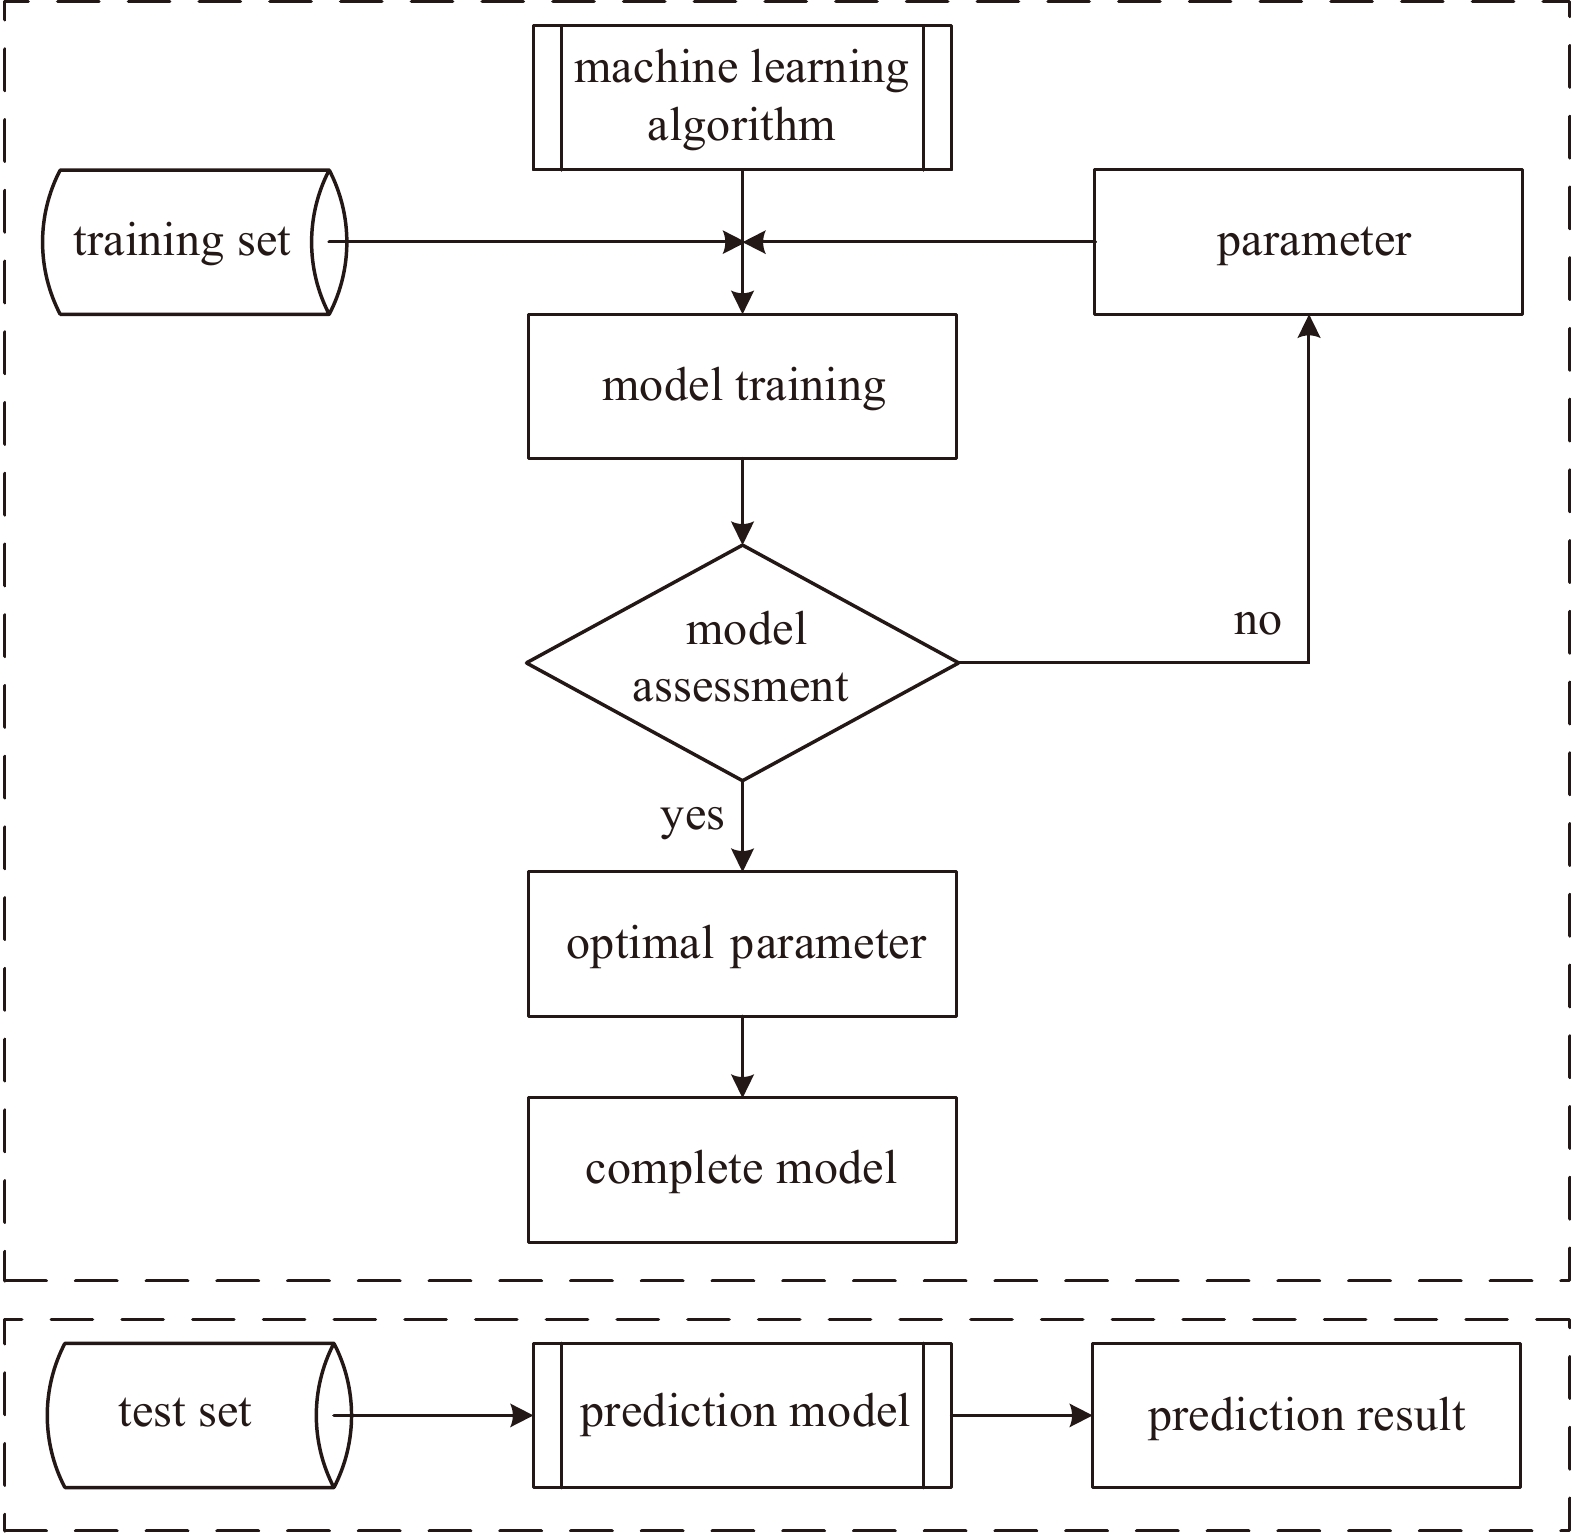
Table 6. Parameters set of the three ML algorithms
ML algorithm Parameter setting RF the number of decision trees, the maximum depth of each tree, and the number of node samples are set as 100, 30, and 10; the remaining parameters are left with the default values GBDT the maximum depth of the tree is 5; maximum iteration is 5; learning rate is 0.1; the remaining parameters are left with the default values SaD-ELM the number of hidden layers is 3; the number of neurons in each hidden layer is 10; the excitation function is “sig.”; the population number, variation probability and crossover probability are set as 30, 0.5, and 0.4; the remaining parameters
are left with the default values
下载: 导出CSV
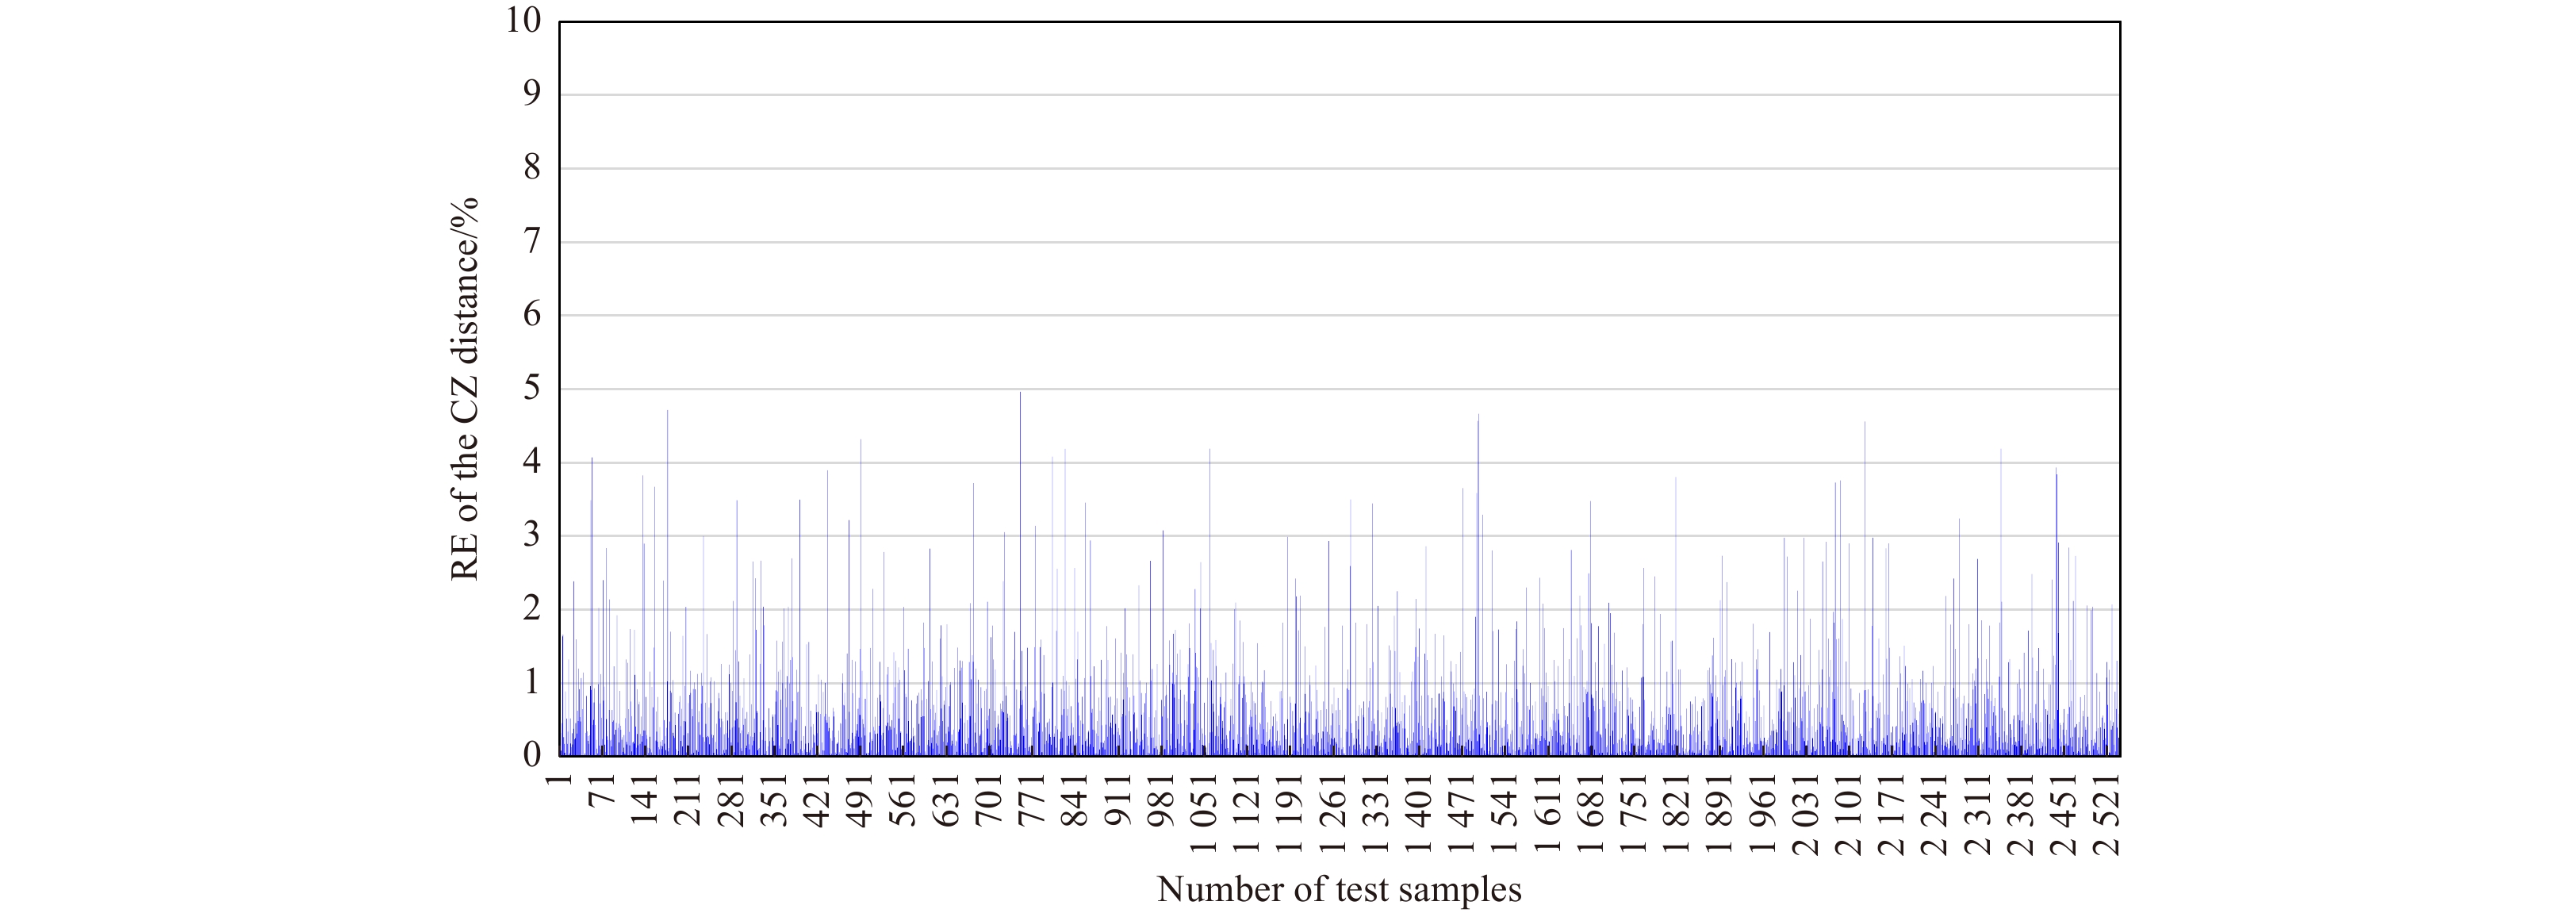
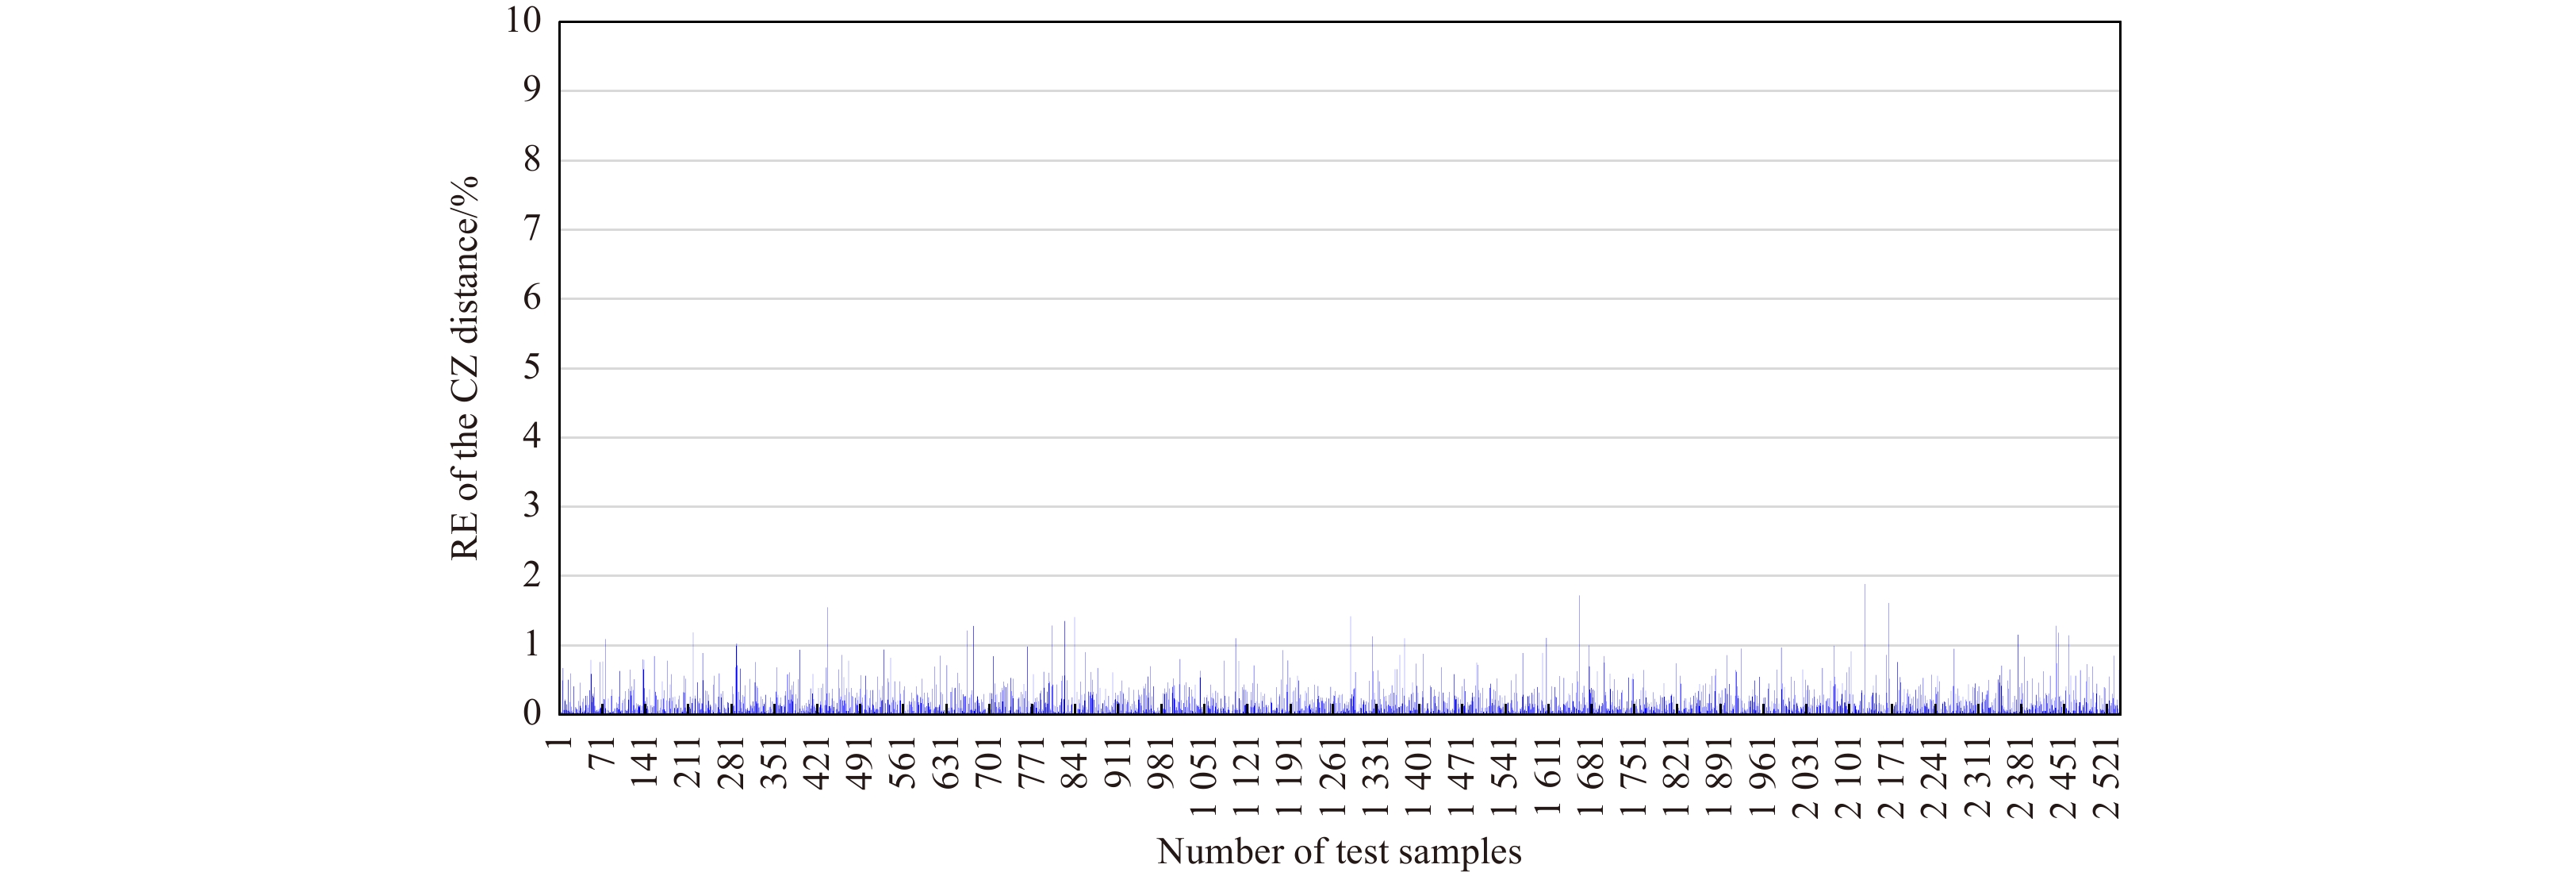
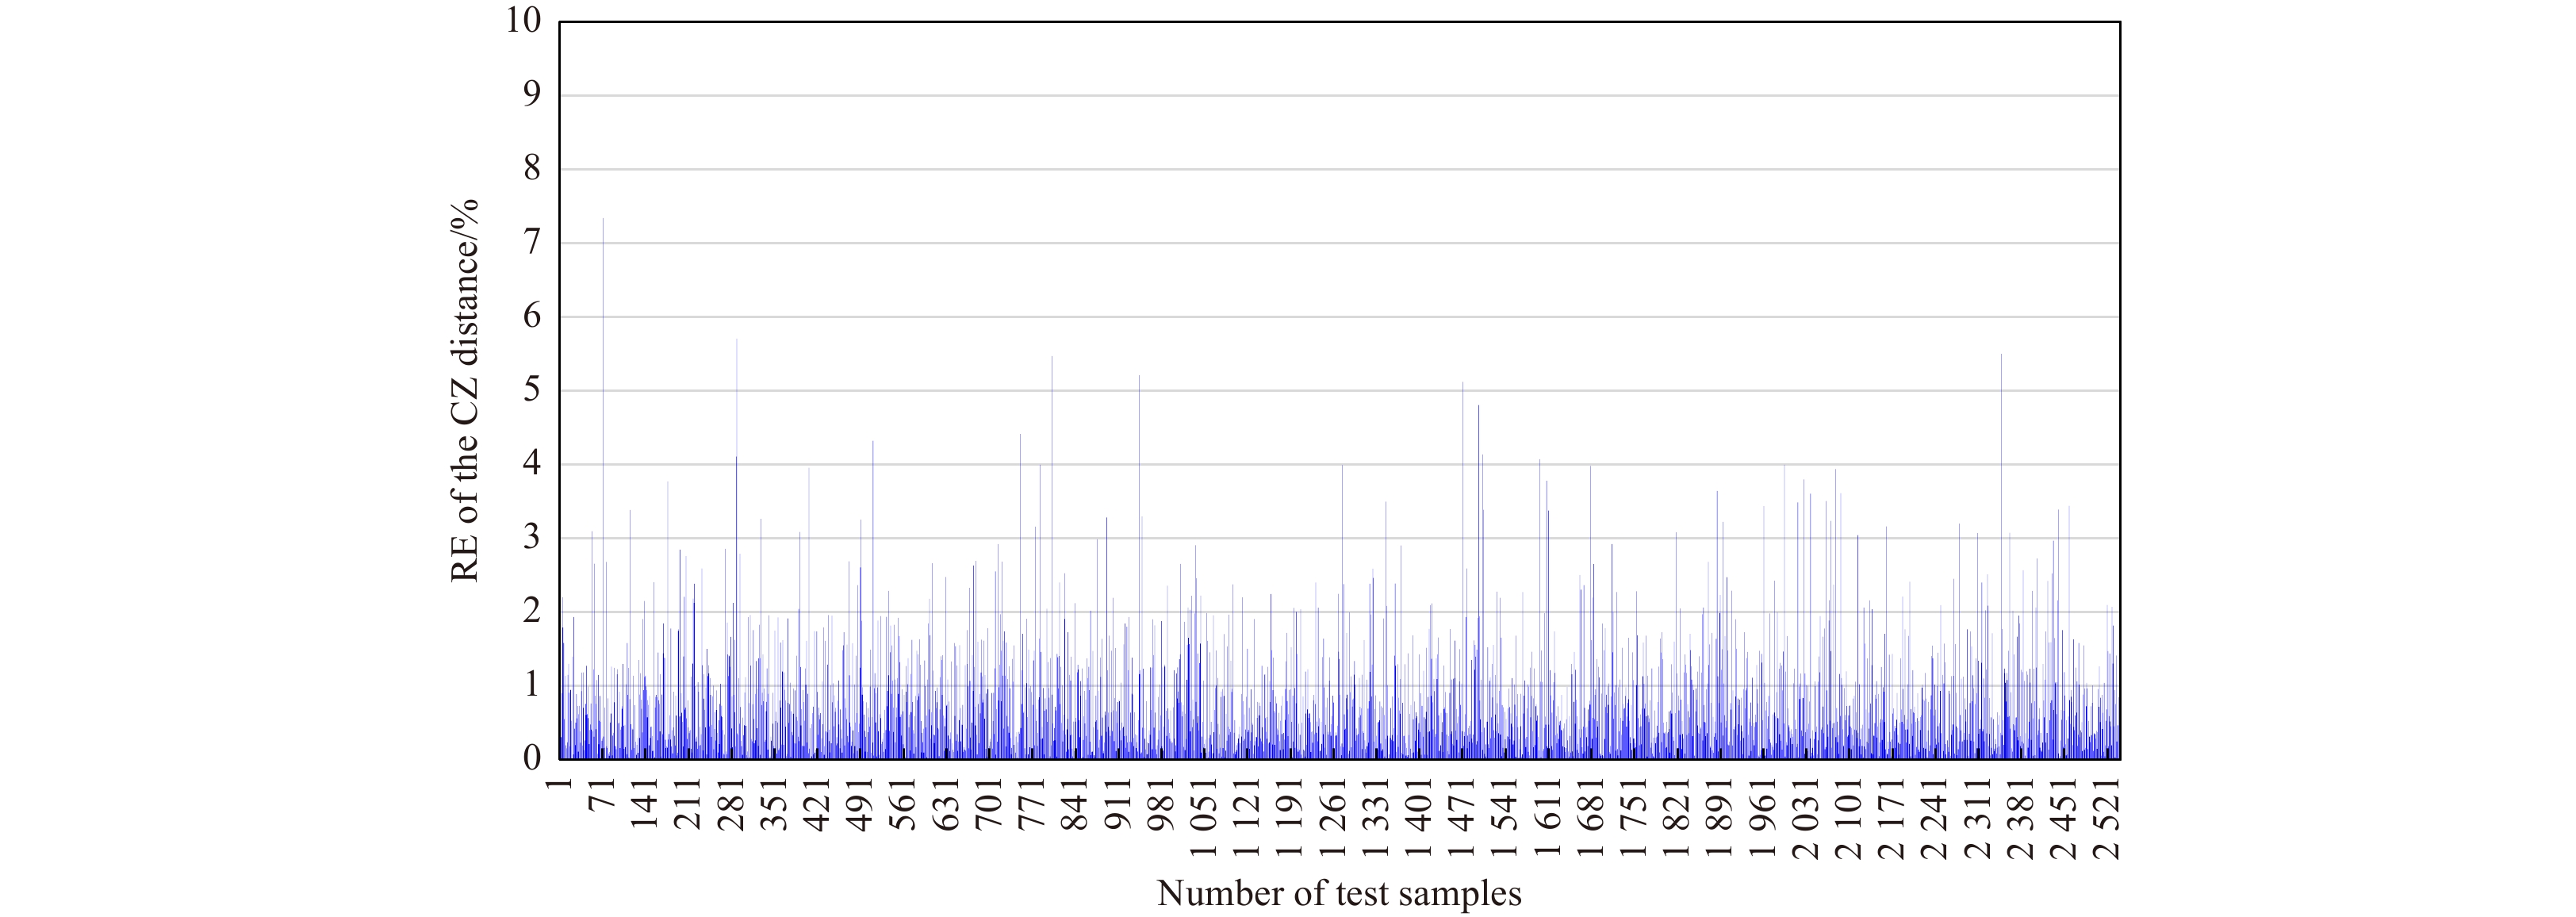
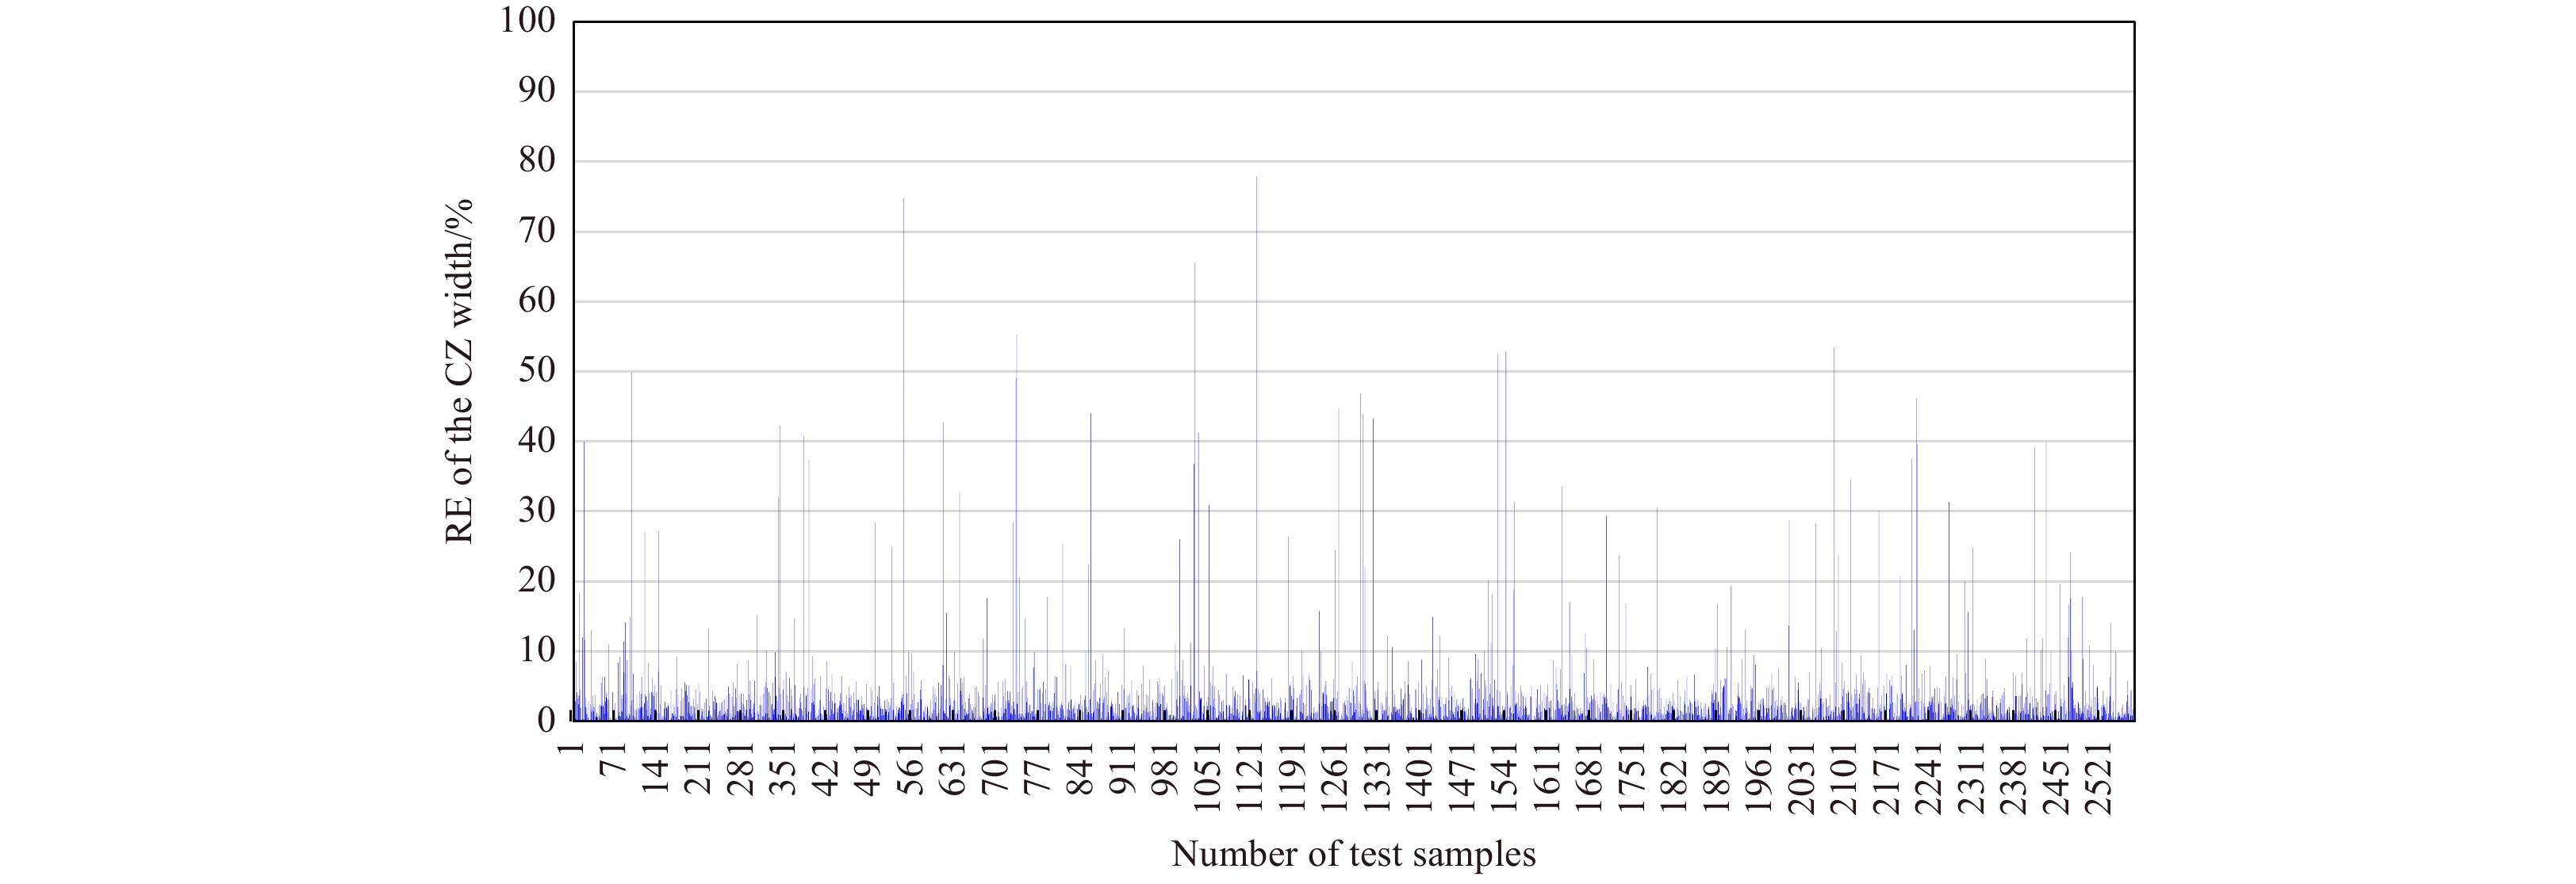
Table 7. Error measures of the predicted CZ parameters
CZ parameter Assessing indicator RF GBDT SaD-ELM CZ distance RMSE 0.4412 0.1353 0.5182 CC 0.9771 0.9982 0.9694 NSE 0.9149 0.9829 0.9134 CZ width RMSE 1.3345 1.3093 1.3642 CC 0.8733 0.8782 0.8671 NSE 0.6047 0.6231 0.5023
下载: 导出CSV
Table 8. CZ parameters calculated by ML and simulation
Eddy Distance of the first CZ/km Width of the first CZ/m GBDT BELLHOP GBDT BELLHOP Eddy A 56.3 63.9 9.2 4.8 Eddy B 60.5 62.3 11.3 8.3 Eddy C 57.1 59.3 9.5 5.2 Eddy D 52.8 61.7 10.9 6.4 Eddy E 55.6 63.8 12.1 7.2
下载: 导出CSV
-
Blatstein I M. 1971. Calculations of underwater explosion pulses at caustics. The Journal of the Acoustical Society of America, 49(5B): 1568–1579, doi: 10.1121/1.1912534 Bongiovanni K P, Siegmann W L, Ko D S. 1996. Convergence zone feature dependence on ocean temperature structure. The Journal of the Acoustical Society of America, 100(5): 3033–3041, doi: 10.1121/1.417115 Cao Jiuwen, Lin Zhiping, Huang Guangbin. 2012. Self-adaptive evolutionary extreme learning machine. Neural Processing Letters, 36(3): 285–305, doi: 10.1007/s11063-012-9236-y Cong Hongri. 2010. Study on general simulation model of searching effectiveness of sonobuoy array. System Simulation Technology (in Chinese), 6(2): 104–109 Duan W Y, Han Y, Huang L M, et al. 2016. A hybrid EMD-SVR model for the short-term prediction of significant wave height. Ocean Engineering, 124: 54–73, doi: 10.1016/j.oceaneng.2016.05.049 Fan Peiqin, Da Lianglong, Li Yuyang. 2012. Research on characteristic parameter computation method of convergence zones in deep ocean. Ocean Technology (in Chinese), 31(4): 23–25 Gong Min, Xiao Jinquan, Wang Mengxin, et al. 1987. An experimental investigation of turning-point convergence-zones in a deep sound channel in the South China Sea. Acta Acustica (in Chinese), 12(6): 417–423 Guan Dinghua, Zhang Renhe, Sun Zhenge, et al. 1998. Spatial coherence of sound in convergence zones and shallow zones in the South China Sea. The Journal of the Acoustical Society of America, 103(S5): 2856 Guo Tingting, Gao Wenyang. 2015. Phenomenon of ocean front and it impact on the sound propagation. Marine Forecasts (in Chinese), 32(5): 80–88 Hale F E. 1961. Long-range sound propagation in the deep ocean. The Journal of the Acoustical Society of America, 33(4): 456–464, doi: 10.1121/1.1908691 Heaney K D, Campbell R L, Murray J J, et al. 2011. Detection performance modeling and measurements for convergence zone (CZ) propagation in deep water. The Journal of the Acoustical Society of America, 130(S4): 2530 Lawrence M W. 1983. Modeling of acoustic propagation across warm-core eddies. The Journal of the Acoustical Society of America, 73(2): 474–485, doi: 10.1121/1.388982 Li Ming, Liu Kefeng, Li Hongchen, et al. 2023. Quantitative analysis on the influence of the oceanic front on underwater acoustic detection with investigated marine data. Journal of Marine Science and Engineering, 11(8): 1574, doi: 10.3390/jmse11081574 Liu Qingyu. 2006. The research of wave propagation in ocean environment with mesoscale phenomena (in Chinese)[dissertation]. Harbin: Harbin Engineering University Liu Dai, Li Zhenglin, Wang Guangxu, et al. 2021a. Sound propagation with undulating bottom in shallow water. Journal of Marine Science and Engineering, 9(9): 1010, doi: 10.3390/jmse9091010 Liu Jiaqi, Piao Shengchun, Gong Lijia, et al. 2021b. The effect of mesoscale eddy on the characteristic of sound propagation. Journal of Marine Science and Engineering, 9(8): 787, doi: 10.3390/jmse9080787 Piao Shengchun, Li Ziyang, Wang Xiaohan, et al. 2021. Lower turning point convegence zone in deep water with an incomplete channel. Acta Physica Sinica (in Chinese), 70(2): 024301, doi: 10.7498/aps.70.20201375 Urick R J, Lund G R. 1968. Coherence of convergence zone sound. The Journal of the Acoustical Society of America, 43(4): 723–729, doi: 10.1121/1.1910888 Van Uffelen L J, Worcester P F, Dzieciuch M A, et al. 2010. Effects of upper ocean sound-speed structure on deep acoustic shadow-zone arrivals at 500- and 1000-km range. The Journal of the Acoustical Society of America, 127(4): 2169–2181, doi: 10.1121/1.3292948 Wu Shuanglin, Li Zhenglin, Qin Jixing, et al. 2022. The effects of sound speed profile to the convergence zone in deep water. Journal of Marine Science and Engineering, 10(3): 424, doi: 10.3390/jmse10030424 Zhang Renhe. 1982. Turning-point convergence-zones in underwater sound channel (II) A generalized ray theory. Acta Acustica (in Chinese), 7(2): 75–87 Zhang Qingqing, Li Zhenglin, Ren Yun, et al. 2022. Sound field statistical characteristics caused by linear internal waves in Dongsha sea area of the South China Sea. Acta Acustica (in Chinese), 47(2): 198–209 Zhang Xin, Zhang Xiaoji. 2012. Theory and Application of Underwater Acoustic Communication (in Chinese). Xi'an: Northwestern Polytechnical University Press, 23–29 Zhang Xu, Zhang Jianxue, Zhang Yonggang, et al. 2011. Effect of acoustic propagation in convergence zone under a warm eddy environment in the western South China Sea. The Ocean Engineering (in Chinese), 29(2): 83–91 Zhao Yue. 2015. Study on sound propagation through a mesoscale eddy environment (in Chinese)[dissertation]. Qingdao: Ocean University of China Zhu Fengqin, Zhang Haigang, Qu Ke. 2021. Influence of mesoscale warm eddies on sound propagation in the northeastern South China Sea. Journal of Harbin Engineering University (in Chinese), 42(10): 1496–1502 -


 点击查看大图
计量
- 文章访问数: 298
- HTML全文浏览量: 119
- PDF下载量: 20
- 被引次数: 0

