

Prediction of discharge in a tidal river using the LSTM-based sequence-to-sequence models
-
Abstract: The complexity of river-tide interaction poses a significant challenge in predicting discharge in tidal rivers. Long short-term memory (LSTM) networks excel in processing and predicting crucial events with extended intervals and time delays in time series data. Additionally, the sequence-to-sequence (Seq2Seq) model, known for handling temporal relationships, adapting to variable-length sequences, effectively capturing historical information, and accommodating various influencing factors, emerges as a robust and flexible tool in discharge forecasting. In this study, we introduce the application of LSTM-based Seq2Seq models for the first time in forecasting the discharge of a tidal reach of the Changjiang River (Yangtze River) Estuary. This study focuses on discharge forecasting using three key input characteristics: flow velocity, water level, and discharge, which means the structure of multiple input and single output is adopted. The experiment used the discharge data of the whole year of 2020, of which the first 80% is used as the training set, and the last 20% is used as the test set. This means that the data covers different tidal cycles, which helps to test the forecasting effect of different models in different tidal cycles and different runoff. The experimental results indicate that the proposed models demonstrate advantages in long-term, mid-term, and short-term discharge forecasting. The Seq2Seq models improved by 6%–60% and 5%–20% of the relative standard deviation compared to the harmonic analysis models and improved back propagation neural network models in discharge prediction, respectively. In addition, the relative accuracy of the Seq2Seq model is 1% to 3% higher than that of the LSTM model. Analytical assessment of the prediction errors shows that the Seq2Seq models are insensitive to the forecast lead time and they can capture characteristic values such as maximum flood tide flow and maximum ebb tide flow in the tidal cycle well. This indicates the significance of the Seq2Seq models.
-
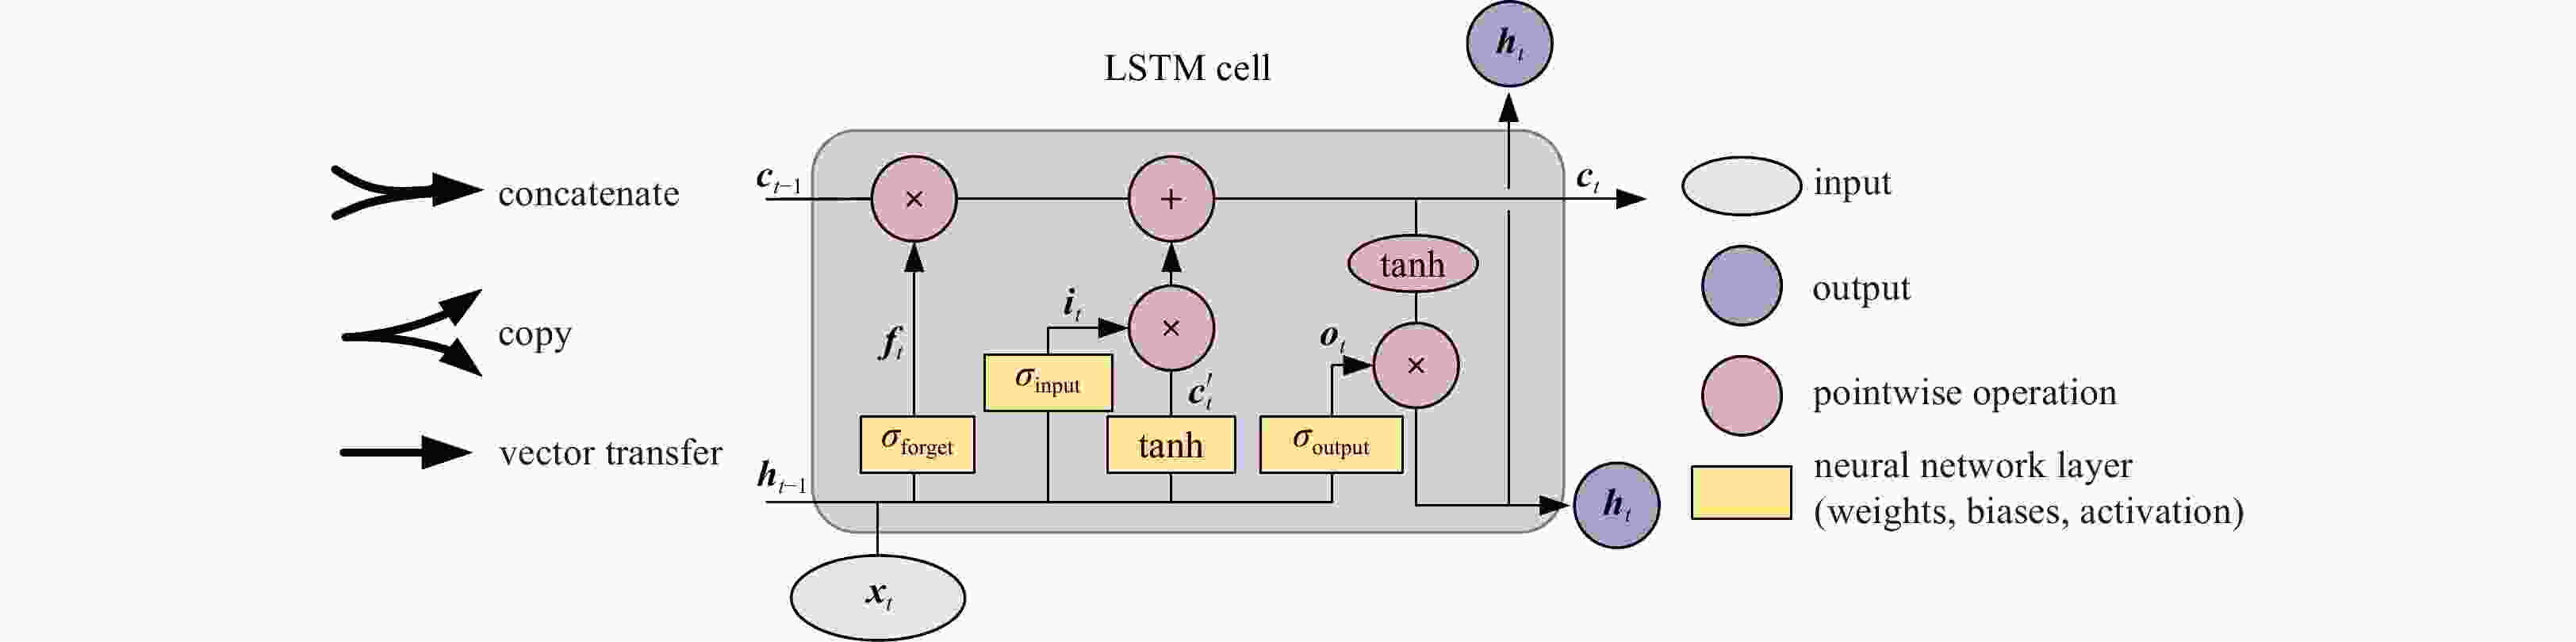
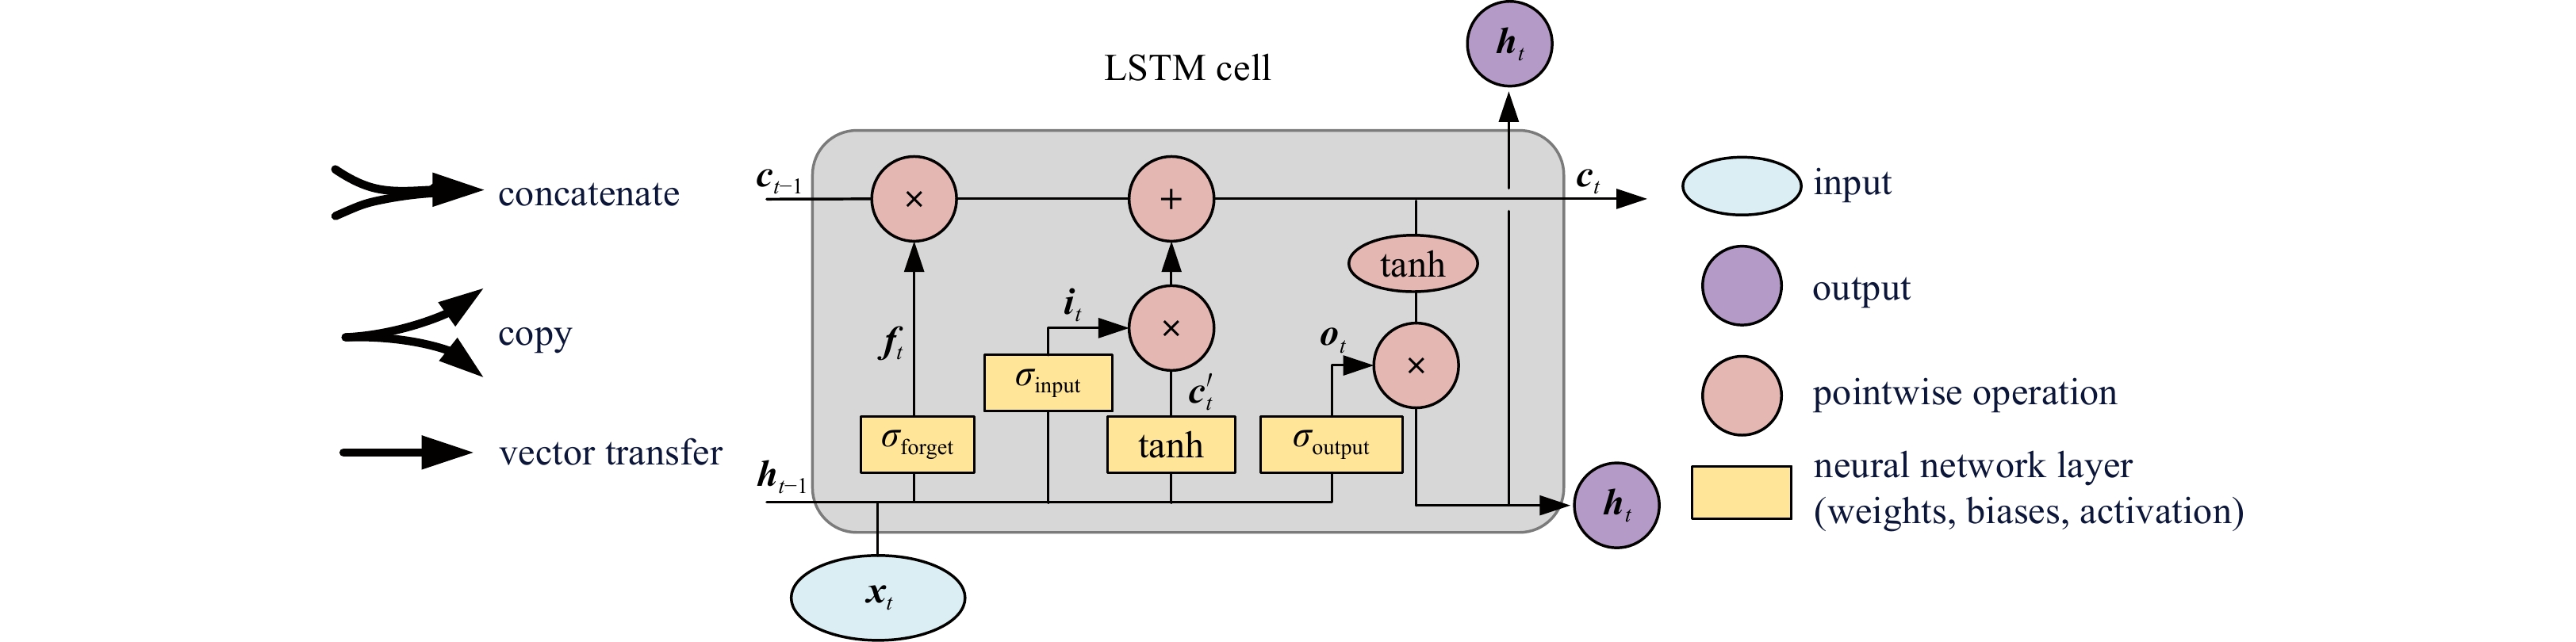
Figure 3. Schematic diagram for the longshort-term memory (LSTM) recurrent cell, adapted and reproduced from Olah (2015) and Lees et al. (2022). These cells are repeated from the first timestep to the last one of the sequence. From one timestep to the next, ct captures the state of the system at time t. A series of gates, such as the forget gate (ft), the input gate (it), and the output gate (ot), protect and control the information flow from the input data xt to the cell state ct.
${\boldsymbol{c}}'_t $ is the candidate cell-state value, which transformed through the tanh layer that are passed into ct base on the output of ot. The layers of neural networks: weights (w), biases (b), and activation functions (σ, tanh) correspond to the yellow layers are also shown in the diagram. The subscripts of σ indicate the three different gates in LSTM, which are a way to optionally let information through.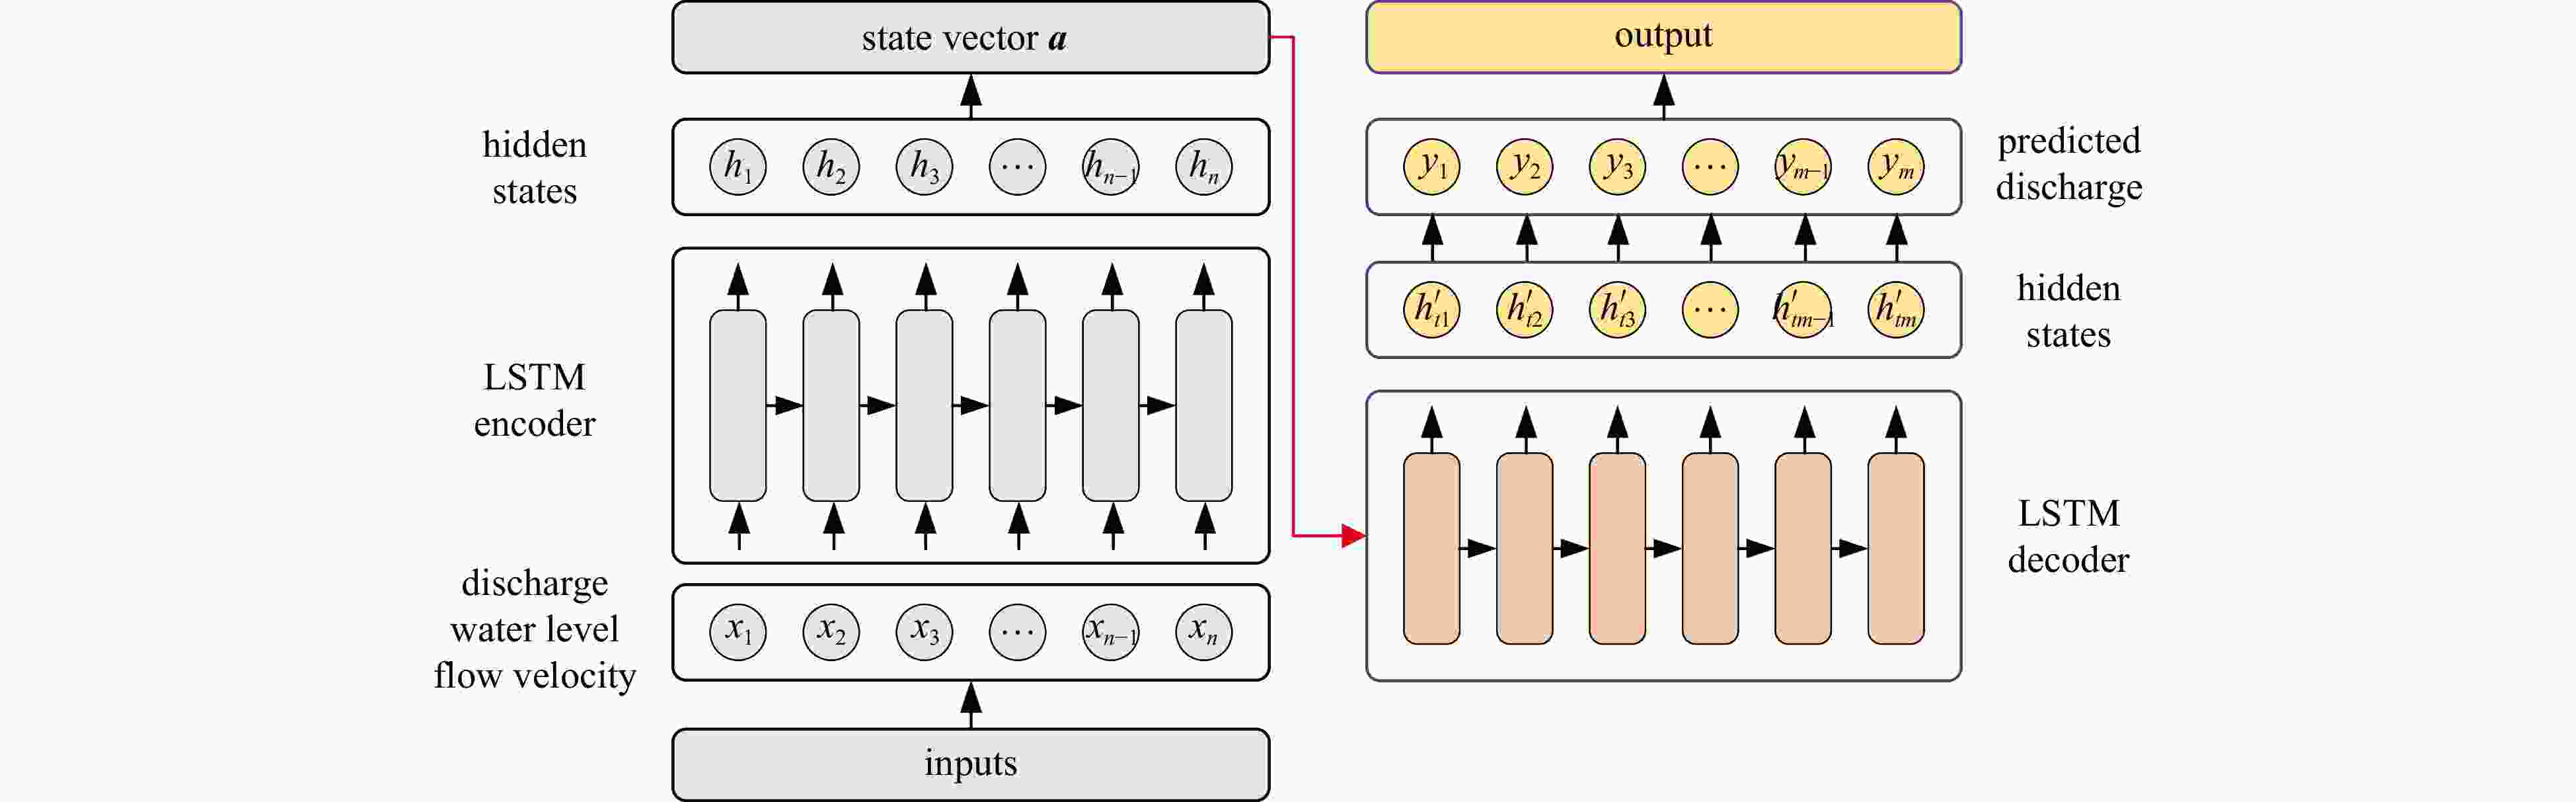
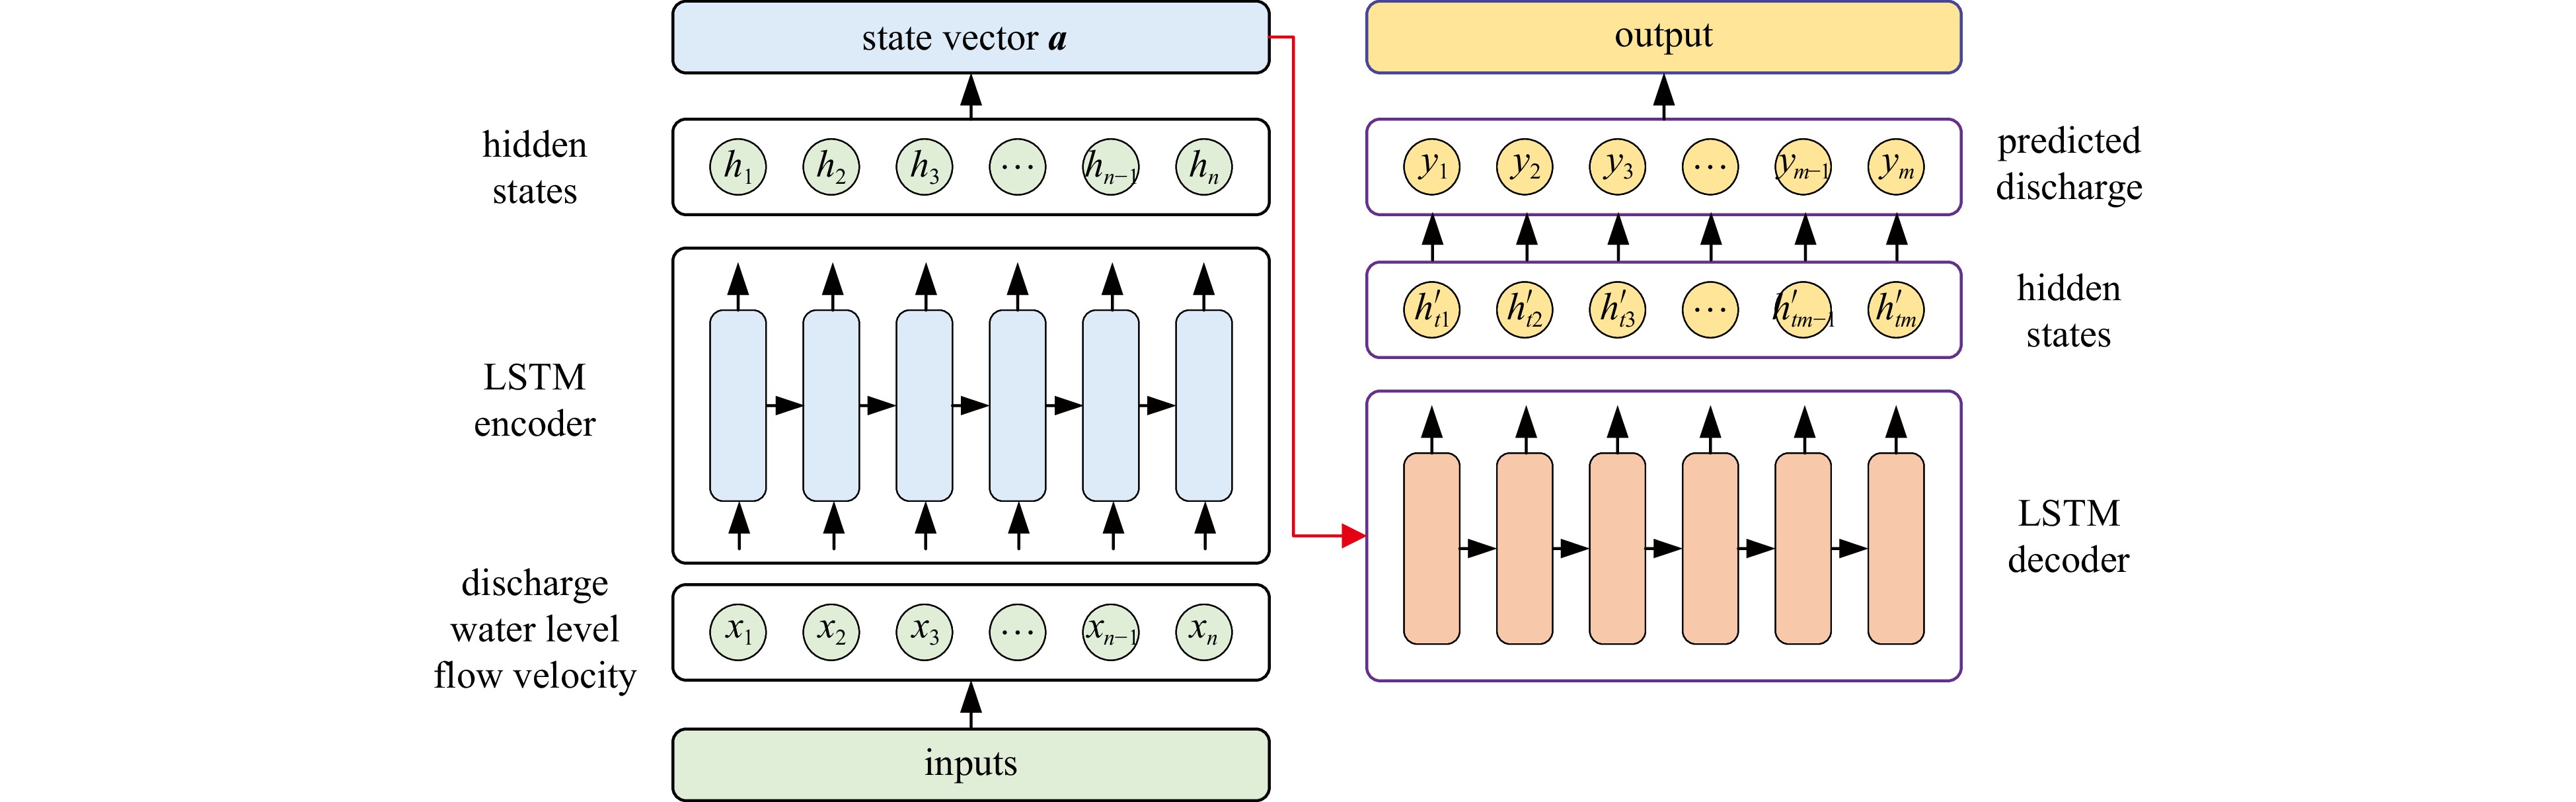
Figure 4. Schematic diagram for Seq2Seq model employed in this study. LSTM, long short-term memory
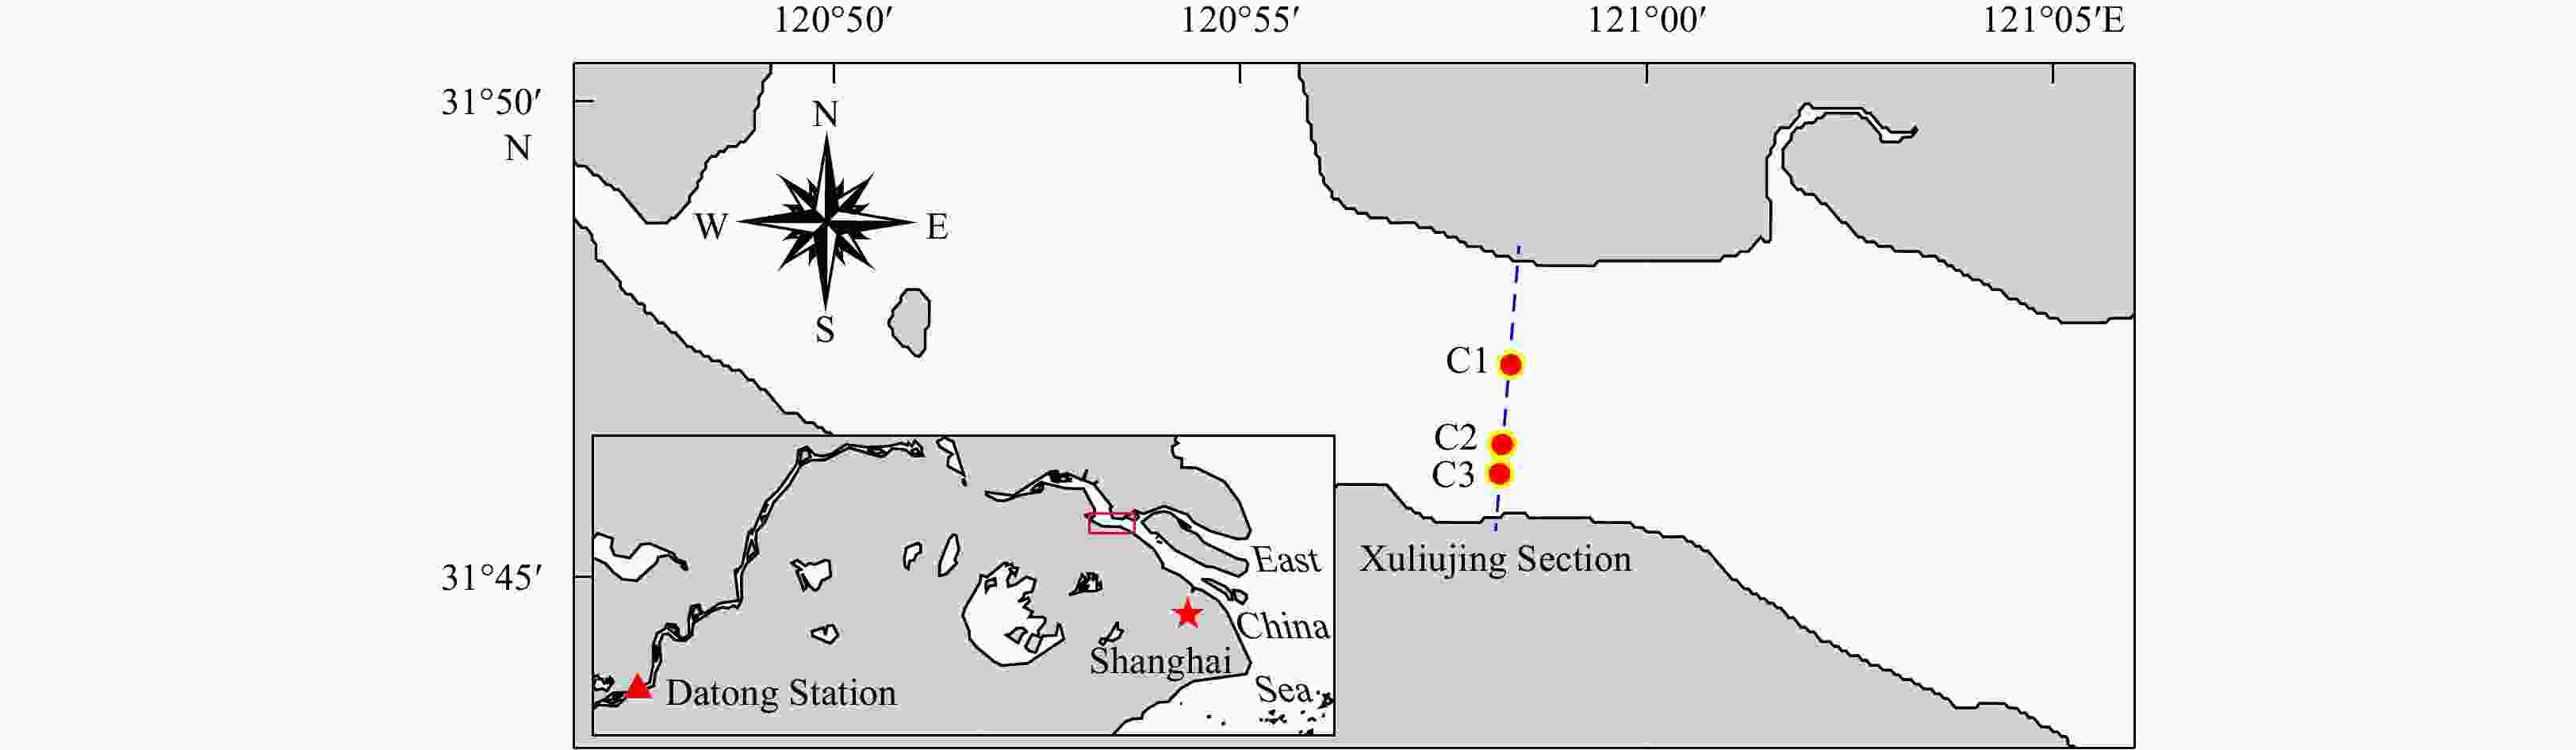
Figure 5. Area of study. Red circles indicate (C1, C2, and C3) the deploy locations of the Acoustic Doppler Current Profilers, and the dashed blue line represents the Xuliujing Section.
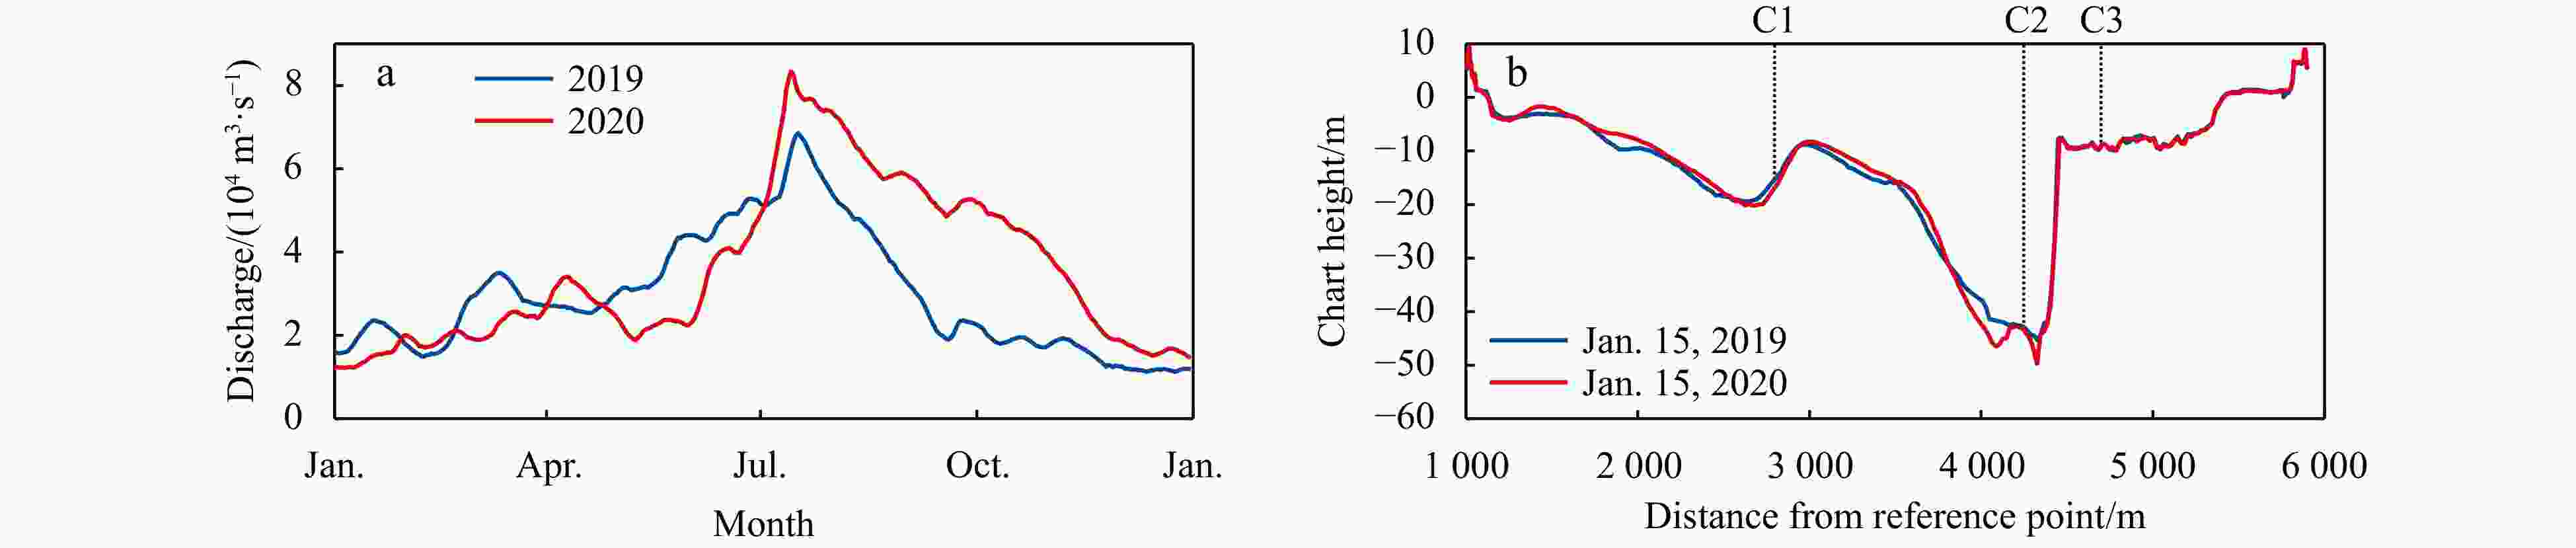
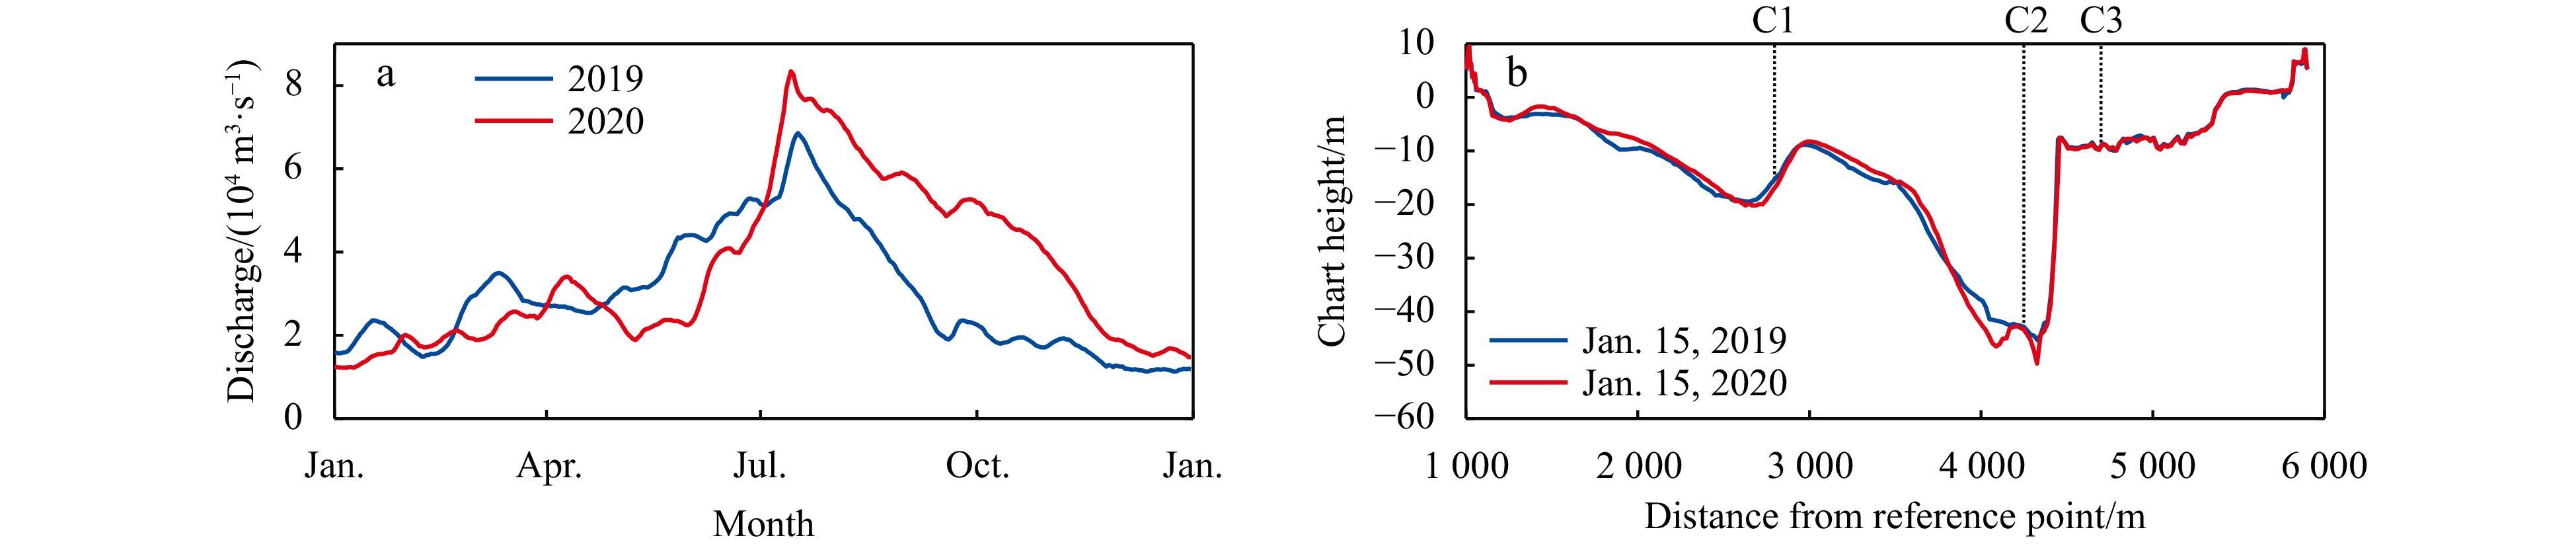
Figure 6. Time series of the discharges at Datong Station (a) and shapes of the Xuliujing Section on two dates in 2019 and 2020 (b). The discharge in Xuliujing Station is difficult to observe or estimate due to the large section and tide influence, so the discharge in Datong Station (shown in Fig. 5) is commonly regarded as the net discharge into the East China Sea. A boat-mounted single-beam echo sounder transducer (sonar) was used for bathymetric surveying at Xuliujing Section (Fig. 5) once a month.

Figure 7. Short-term discharge prediction by means of the four different models. Here discharge values of 12 h are used as input data and another 3 h ones are used as output data. The blue dotted line is the predicted discharge by harmonic analysis, the green dotted line is the predicted discharge by harmonic analysis PSO-BP neural network, the black dotted line is the predicted discharge by LSTM, the red dotted line is the predicted discharge by Seq2Seq, and the black line is the measured data.
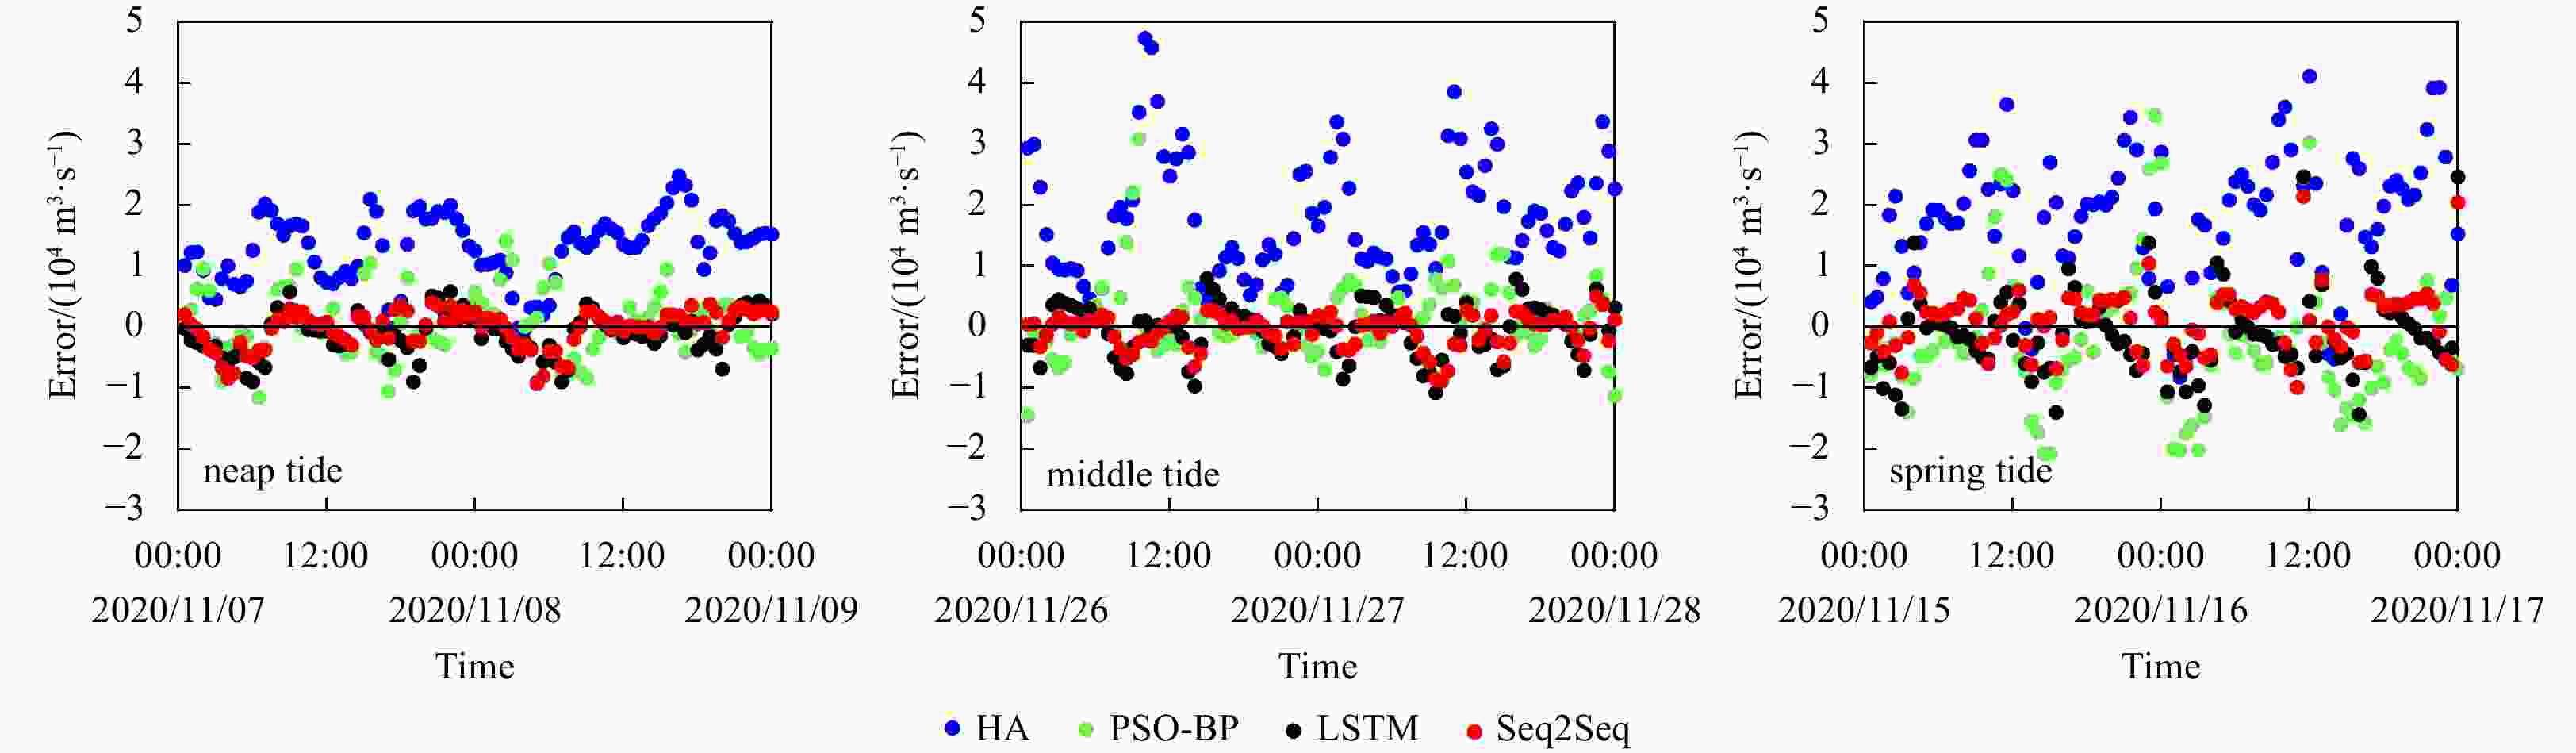
Figure 8. Estimation error of four different models in short-term discharge prediction.

Figure 9. Middle-term discharge prediction. Here discharge values of 24 h are used as input data and another 6 h ones are used as output data.

Figure 10. Estimation error of four different models in middle-term discharge prediction.

Figure 11. Long-term discharge prediction. Here discharge values of 72 h are used as input data and another 24 h ones are used as output data.
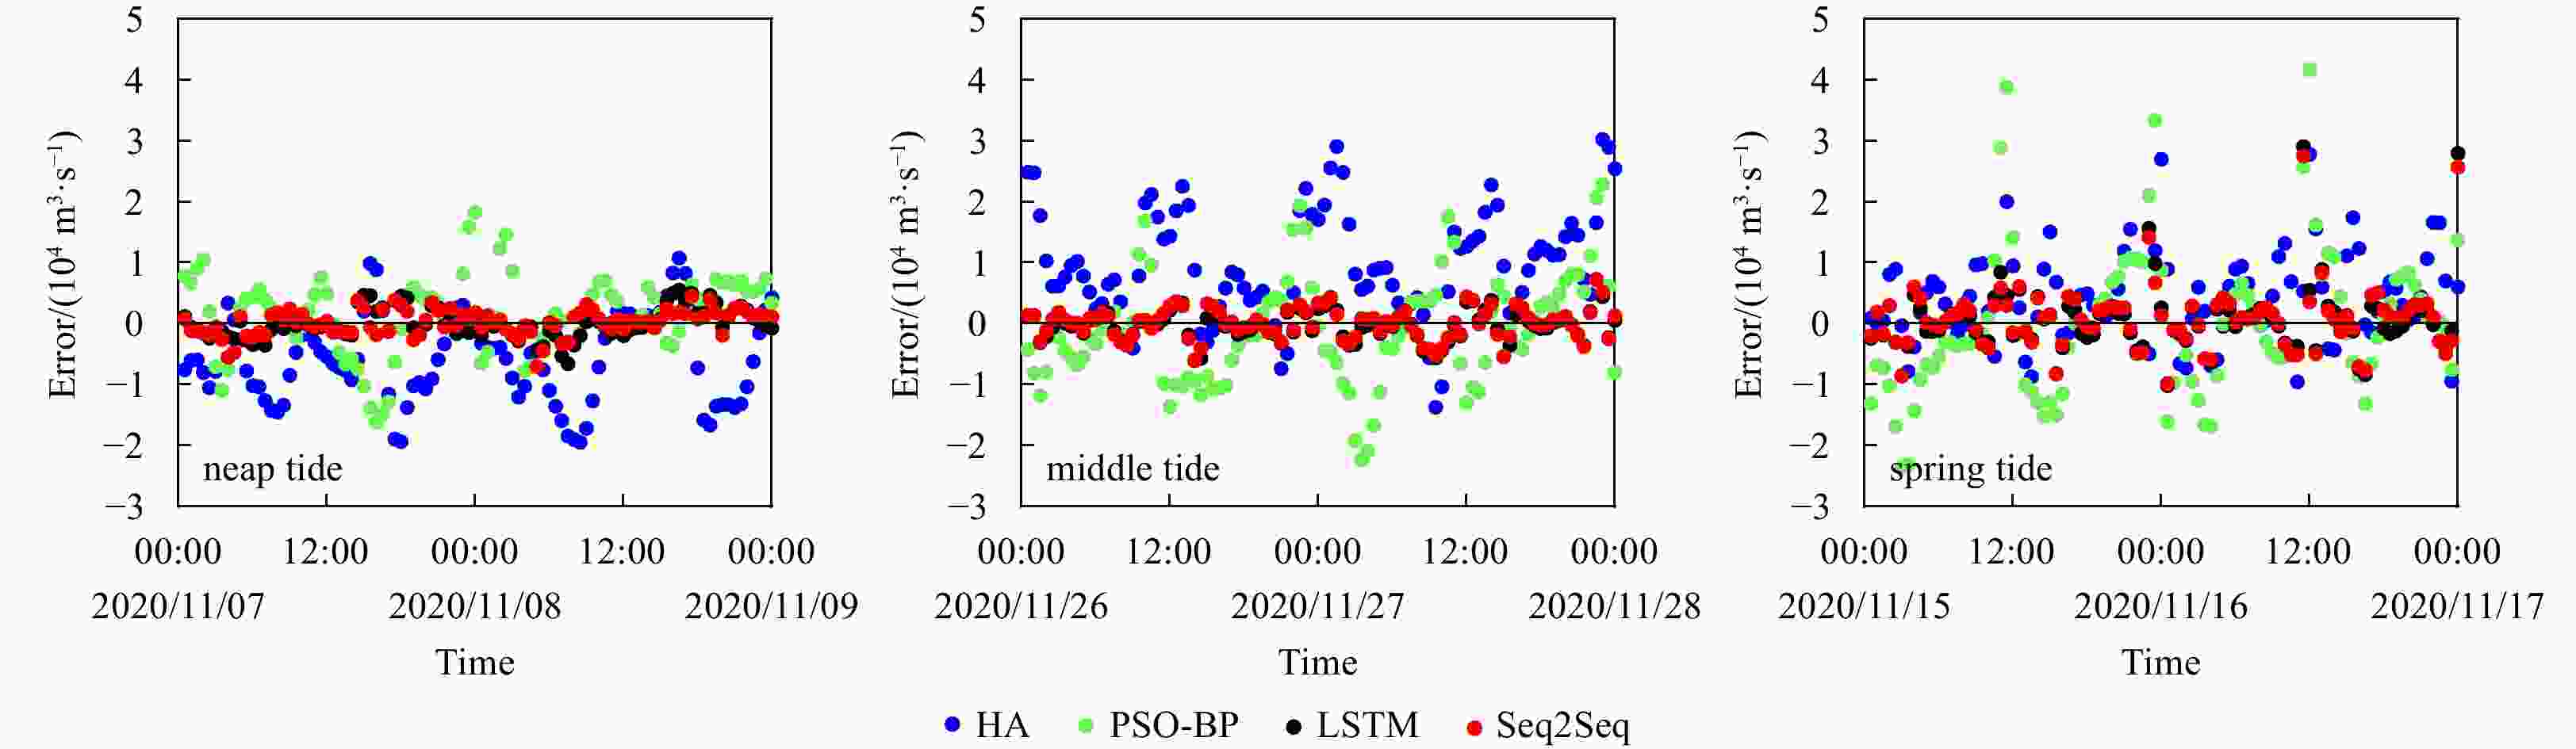
Figure 12. Estimation error of four different models in long-term discharge prediction.
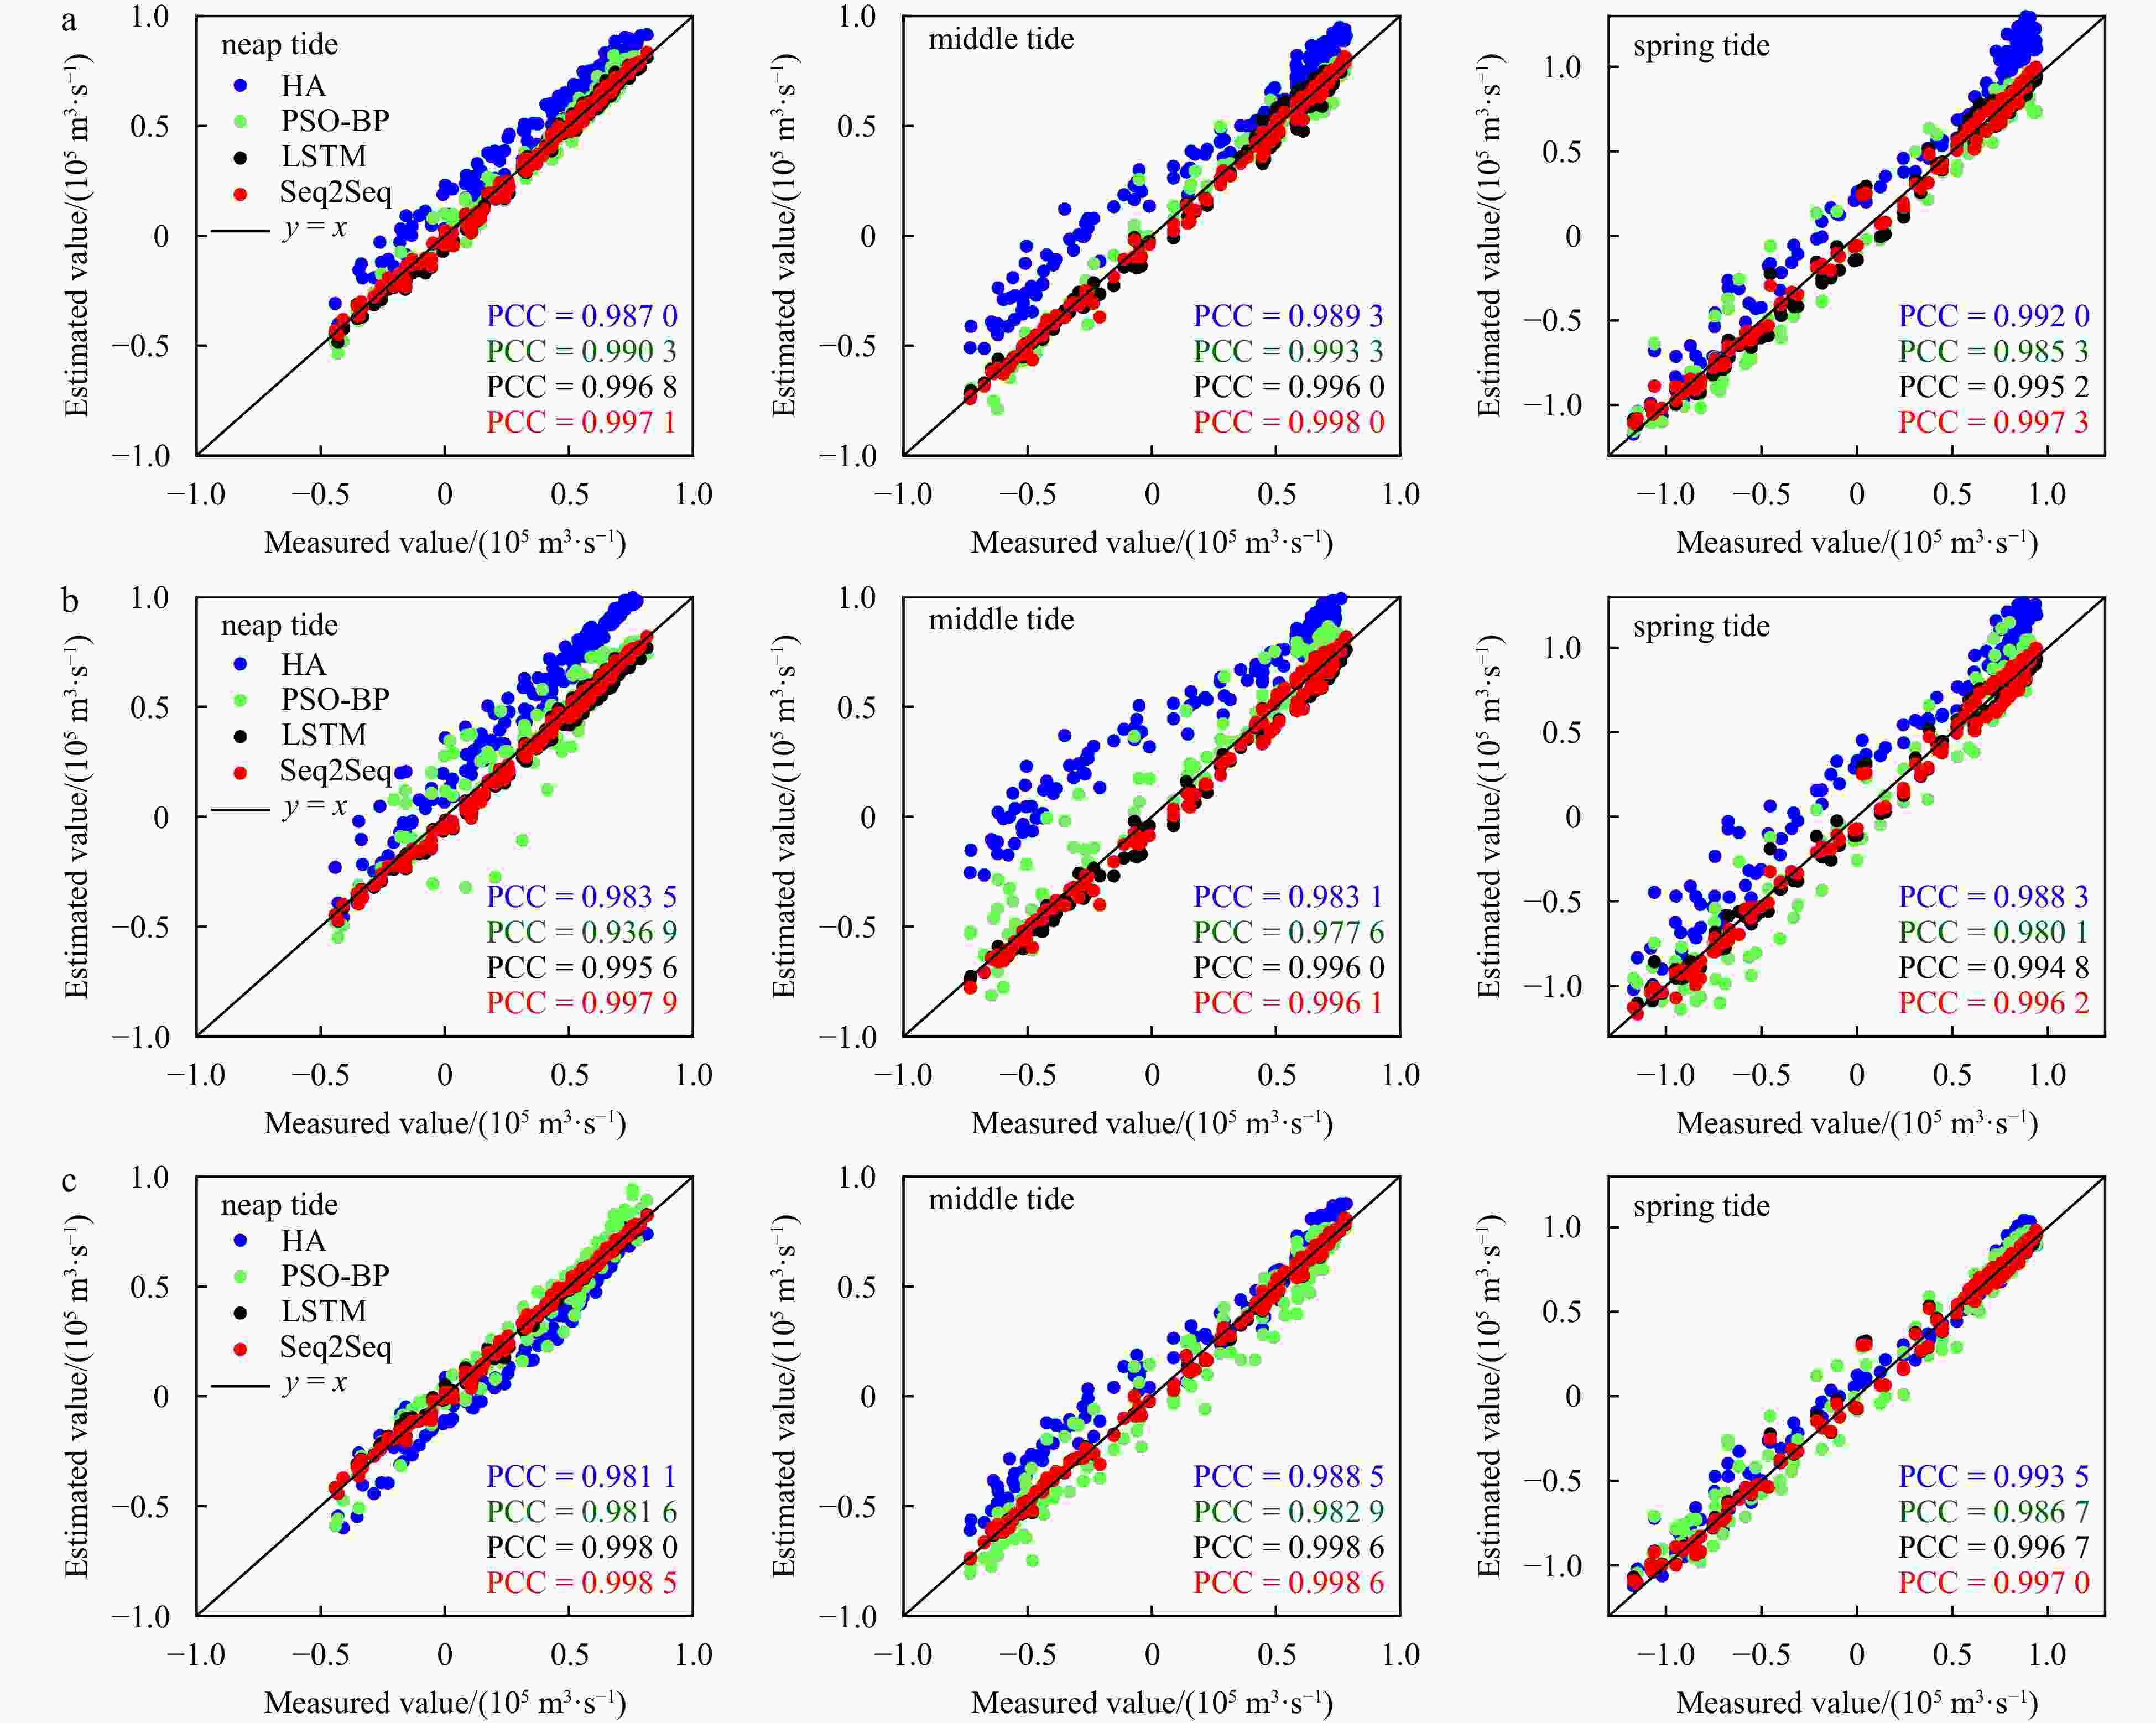
Table 1. The starting and ending time of the datasets
Forecast duration (lead time) Starting and ending time (YYYY/MM/DD) Neap tide Spring tide Middle tide Short term (3 h) 2020/10/01–2020/11/10 2020/10/01–2020/11/18 2020/10/01–2020/11/29 Middle term (6 h) 2020/08/01–2020/11/10 2020/08/01–2020/11/18 2020/08/01–2020/11/29 Long term (24 h) 2020/01/01–2020/11/10 2020/01/01–2020/11/18 2020/01/01–2020/11/29 Note: All datasets are sampled at half-hour intervals.  下载: 导出CSV
Table 2. Tidal constituents at Xuliujing with amplitudes greater than
8000 m3/sTide
constituentFrequency/
(cycle·h–1)Amplitude/
(m3·s–1)Phase/(°) Signal-to-noise
ratioM2 0.080511 63408 216.67 220 S2 0.083333 28935 267.85 46 M4 0.161023 15747 233.32 36 MS4 0.163845 12991 298.97 25 K1 0.041781 8642 24.510 330
下载: 导出CSV
Table 3. Parameter setting of PSO algorithm
Parameter Value Swarm size 30 Inertia weight 0.5 Personal learning factor 4.494 Social learning factor 4.494 Maximum velocity 1.0 Number of iterations 200 Fitness function root mean square error
下载: 导出CSV
Table 4. Parameter setting of LSTM model
Parameter Value Short term Middle term Long term Hidden size 128 128 128 Num layers 1 1 1 Input dimension 3 3 / Input length 24 48 144 Output dimension 1 1 1 Output length 6 12 48 Learning rate 0.01 0.01 0.01 Target error 0.001 0.001 0.001 Batch size 256 256 256 Epochs 200 200 200 Regularization 0.001 0.001 0.001 Activation ReLU ReLU ReLU Optimizer Adam Adam Adam Note: For different forecast durations, only the length of the input and output length is different. / represents no data.
下载: 导出CSV
-
Amanambu A C, Mossa J, Chen Yin-Hsuen. 2022. Hydrological drought forecasting using a deep transformer model. Water, 14(22): 3611 Anshuka A, Chandra R, Buzacott A J V, et al. 2022. Spatio temporal hydrological extreme forecasting framework using LSTM deep learning model. Stochastic Environmental Research and Risk Assessment, 36(10): 3467–3485 Bai Longhu, Xu Hang. 2021. Accurate estimation of tidal level using bidirectional long short-term memory recurrent neural network. Ocean Engineering, 235: 108765 Cai Huayang, Li Bo, Garel E, et al. 2023. A data-driven model to quantify the impact of river discharge on tide-river dynamics in the Yangtze River estuary. Journal of Hydrology, 620: 129411 Cho K, Van Merriënboer B, Gulcehre C, et al. 2014. Learning phrase representations using RNN encoder–decoder for statistical machine translation. In: Proceedings of the 2014 Conference on Empirical Methods in Natural Language Processing. Doha, The State of Qatar: ACL, 1724–1734 Dennis R E, Long E E. 1971. A user’s guide to a computer program for harmonic analysis of data at tidal frequencies. NOAA NOS, 41: 3–11 Foreman M G G. 1977. Manual for tidal heights analysis and prediction. Pacific Marine Science Report. Sidney, BC, Canada: Institute of Ocean Sciences, Patricia Bay, 77–10 Foreman M G G, Henry R F. 1989. The harmonic analysis of tidal model time series. Advances in Water Resources, 12(3): 109–120 Gan Min, Chen Yongping, Pan Haidong, et al. 2024. Study on the spatiotemporal variation of the Yangtze estuarine tidal species. Estuarine, Coastal and Shelf Science, 298: 108637 Harris D L, Pore N A, Cummings R A. 2015. Tide and tidal current prediction by high speed digital computer. The International Hydrographic Review, 42(1): 95–103 Hidayat H, Hoitink A J F, Sassi M G, et al. 2014. Prediction of discharge in a tidal river using artificial neural networks. Journal of Hydrologic Engineering, 19(8): 04014006 Hochreiter S, Schmidhuber J. 1997. Long short-term memory. Neural Computation, 9(8): 1735–1780 Jain M, Saihjpal V, Singh N, et al. 2022. An overview of variants and advancements of PSO algorithm. Applied Sciences, 12(17): 8392 Ji Zhong, Xiong Kailin, Pang Yanwei, et al. 2020. Video summarization with attention-based encoder–decoder networks. IEEE Transactions on Circuits and Systems for Video Technology, 30(6): 1709–1717 Kao I-Feng, Zhou Yanlai, Chang Li-Chiu, et al. 2020. Exploring a long short-term memory based encoder-decoder framework for multi-step-ahead flood forecasting. Journal of Hydrology, 583: 124631 Kennedy J, Eberhart R. 1995. Particle swarm optimization. In: Proceedings of ICNN’95 - International Conference on Neural Networks. Perth: IEEE, 1942–1948 Kratzert F, Herrnegger M, Klotz D, et al. 2019. NeuralHydrology—Interpreting LSTMs in hydrology. In: Samek W, Montavon G, Vedaldi A, et al, eds. Explainable AI: Interpreting, Explaining and Visualizing Deep Learning. Cham: Springer, 347–362 Kratzert F, Klotz D, Brenner C, et al. 2018. Rainfall–runoff modelling using long short-term memory (LSTM) networks. Hydrology and Earth System Sciences, 22(11): 6005–6022 Lee T L. 2004. Back-propagation neural network for long-term tidal predictions. Ocean Engineering, 31(2): 225–238 Lees T, Reece S, Kratzert F, et al. 2022. Hydrological concept formation inside long short-term memory (LSTM) networks. Hydrology and Earth System Sciences, 26(12): 3079–3101 Matte P, Jay D A, Zaron E D. 2013. Adaptation of classical tidal harmonic analysis to nonstationary tides, with application to river tides. Journal of Atmospheric and Oceanic Technology, 30(3): 569–589 Olah C. 2015. Understanding LSTM networks. https://colah.github.io/posts/2015-08-Understanding-LSTMs/[2015-08] Pan Haidong, Jiao Shengyi, Xu Tengfei, et al. 2022. Investigation of tidal evolution in the Bohai Sea using the combination of satellite altimeter records and numerical models. Estuarine, Coastal and Shelf Science, 279: 108140 Pan Haidong, Lv Xianqing, Wang Yingying, et al. 2018. Exploration of tidal-fluvial interaction in the columbia river estuary using S_TIDE. Journal of Geophysical Research: Oceans, 123(9): 6598–6619 Pan Haidong, Xu Tengfei, Wei Zexun. 2023. A modified tidal harmonic analysis model for short-term water level observations. Ocean Modelling, 186: 102251 Pawlowicz R, Beardsley B, Lentz S. 2002. Classical tidal harmonic analysis including error estimates in MATLAB using T_TIDE. Computers & Geosciences, 28(8): 929–937 Rumelhart D E, Hinton G E, Williams R J. 1986. Learning representations by back-propagating errors. Nature, 323(6088): 533–536 Sahoo B B, Jha R, Singh A, et al. 2019. Long short-term memory (LSTM) recurrent neural network for low-flow hydrological time series forecasting. Acta Geophysica, 67(5): 1471–1481 Shin M J, Moon S H, Kang K G, et al. 2020. Analysis of groundwater level variations caused by the changes in groundwater withdrawals using long short-term memory network. Hydrology, 7(3): 64 Sutskever I, Vinyals O, Le Q V. 2014. Sequence to sequence learning with neural networks. In: Proceedings of the 27th International Conference on Neural Information Processing Systems. Montreal: MIT Press, 3104–3112 Yin Hanlin, Guo Zilong, Zhang Xiuwei, et al. 2021a. Runoff predictions in ungauged basins using sequence-to-sequence models. Journal of Hydrology, 603: 126975 Yin Hanlin, Zhang Xiuwei, Wang Fandu, et al. 2021b. Rainfall-runoff modeling using LSTM-based multi-state-vector sequence-to-sequence model. Journal of Hydrology, 598: 126378 Yuan Xiaohui, Chen Chen, Lei Xiaohui, et al. 2018. Monthly runoff forecasting based on LSTM–ALO model. Stochastic Environmental Research and Risk Assessment, 32(8): 2199–2212 Zhang E F, Savenije H H G, Chen S L, et al. 2012. An analytical solution for tidal propagation in the Yangtze Estuary, China. Hydrology and Earth System Sciences, 16(9): 3327–3339 Zhang Min, Townend I, Zhou Yunxuan, et al. 2016. Seasonal variation of river and tide energy in the Yangtze Estuary, China. Earth Surface Processes and Landforms, 41(1): 98–116 Zhao Jianhu, Chen Zhigao, Zhang Hongmei, et al. 2016. Multiprofile discharge estimation in the tidal reach of Yangtze Estuary. Journal of Hydraulic Engineering, 142(12): 04016056 -


 点击查看大图

计量
- 文章访问数: 380
- HTML全文浏览量: 149
- PDF下载量: 16
- 被引次数: 0

