Influence of mixed layer depth on chlorophyll-a concentration in the Southern Ocean
-
Abstract: The element iron limitation is one of the crucial factors contributing to high nutrient low chlorophyll in the Southern Ocean (SO). Mixed layer dynamics regulate the availability of iron to phytoplankton. In this paper, we investigate the influence of surface iron supplementation triggered by the mixed layer depth (MLD) variation on chlorophyll-a (Chl-a) concentration in the SO on seasonal and interannual timescales. This analysis is based on the Biogeochemical Southern Ocean State Estimate for the period from 2013 to 2021. We provide a comprehensive and systematic mapping of the regions within the SO, where Chl-a is affected by iron input related to MLD deepening. The relationship between the MLD and the Chl-a varies with the latitude on the seasonal time scale. Both the MLD and sea ice melting affect the distribution of Chl-a. On the interannual scale, iron supply due to MLD deepening occurs primarily north of 60°S. Horizontal advection-induced entrainment enhances the surface iron input during the austral summer, which favors Chl-a increase. In addition to the MLD, the melting of sea ice and cooling of the sea surface can also alter iron input and subsequently affect Chl-a distribution in the austral summer. During the austral winter, entrainment can boost iron stocks, stimulating a subsequent spring increase of Chl-a in the SO. Furthermore, sea surface temperature declines during the austral winter, promoting an increased iron supply and creating favorable conditions for the subsequent spring Chl-a increase in the SO.
-
Key words:
- mixed layer depth /
- entrainment /
- chlorophyll-a concentration /
- Southern Ocean
-
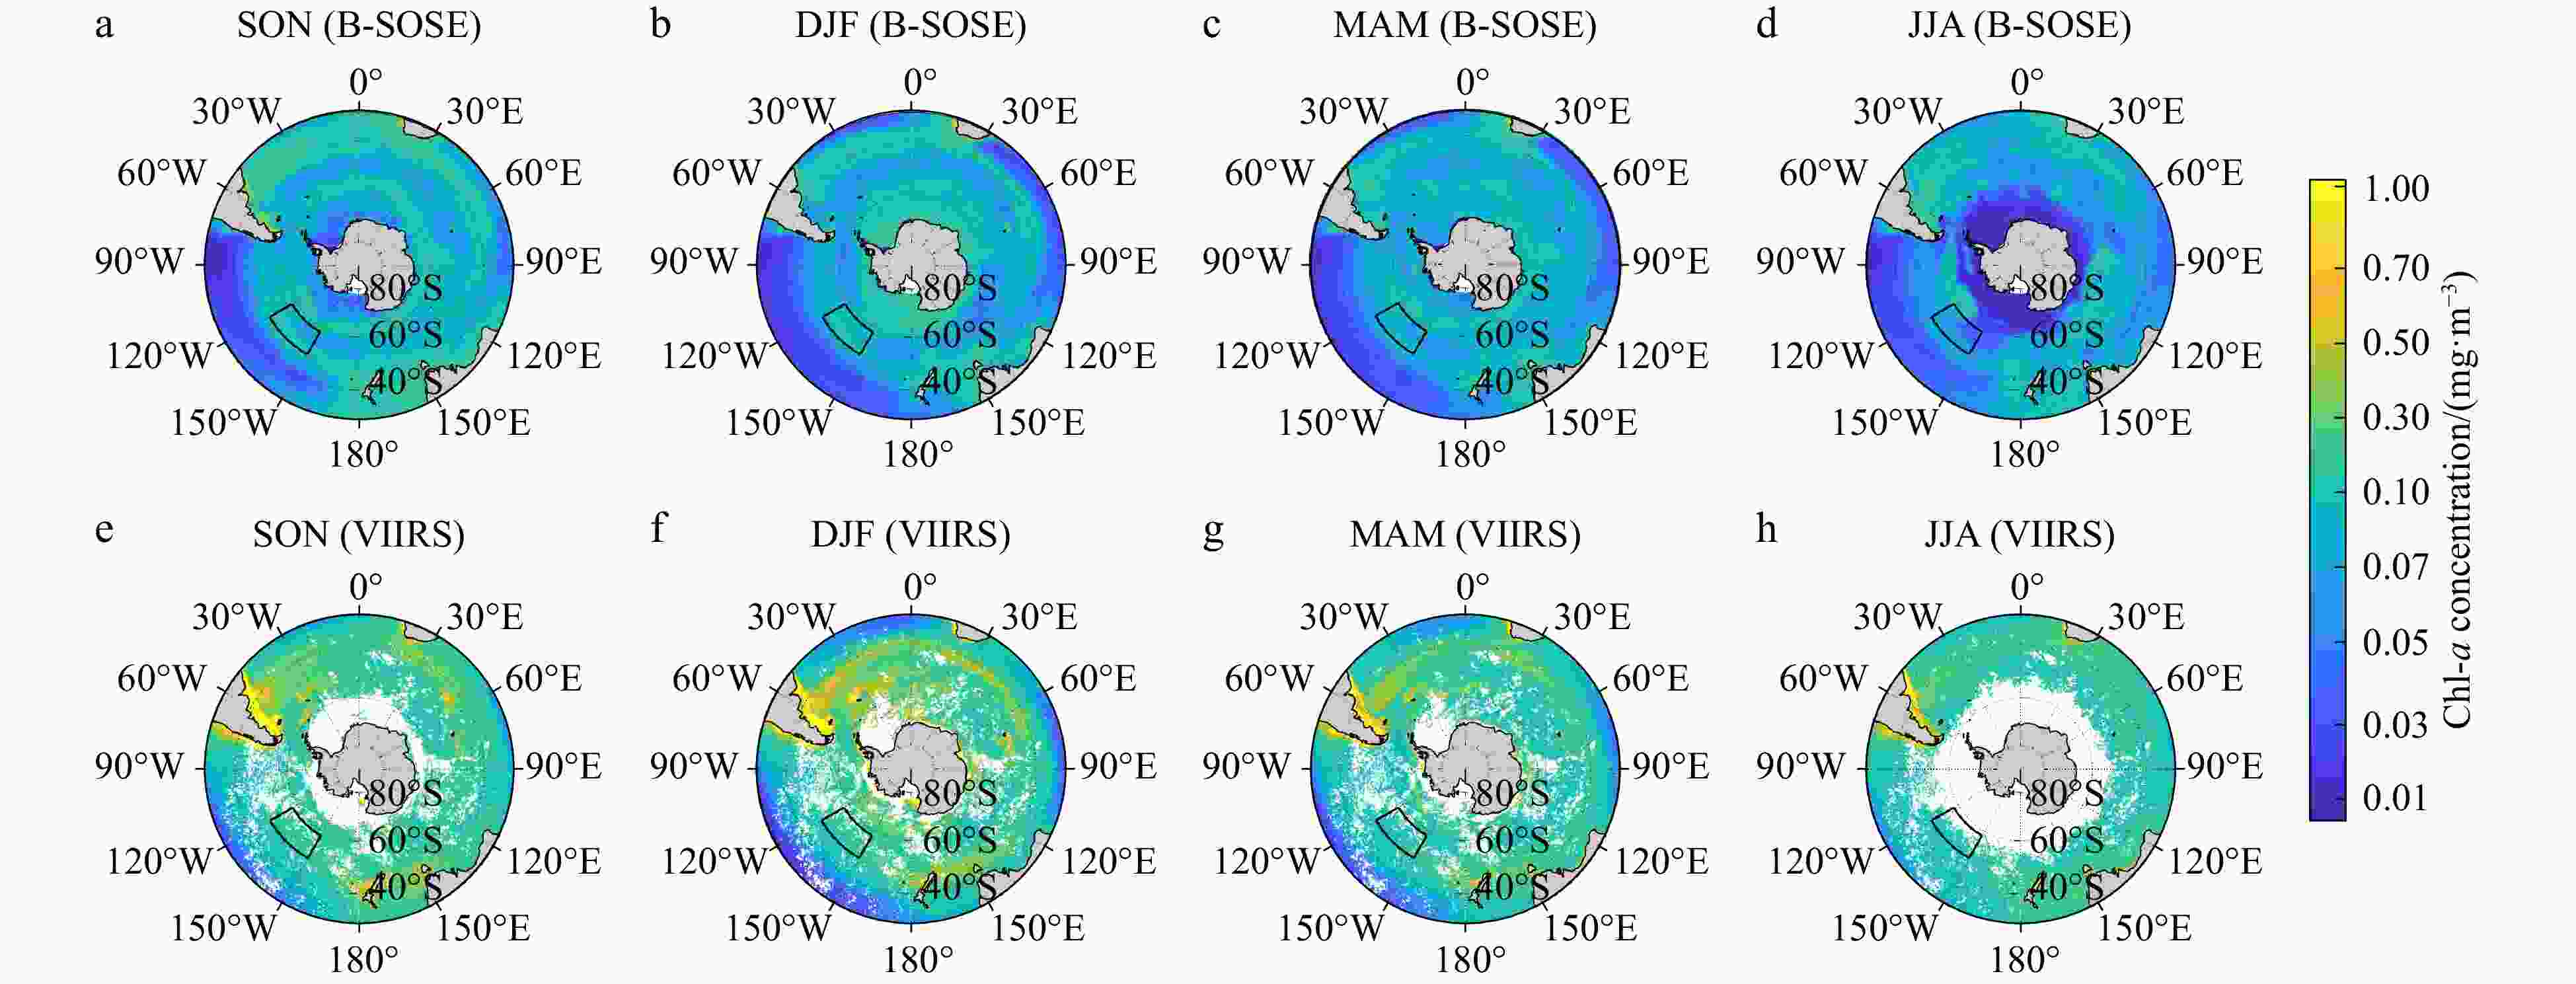
Figure 1. Seasonal cycle of MLD from B-SOSE (a–d) and WOD18 (e–h). The values represent the climatological mean over the period during 2013 to 2018. A region within the deep MLD band is randomly selected to test the credibility of B-SOSE (black box in Fig. 1). The seasons are defined as spring including March, April, and May (MAM), summer including June, July, and August (JJA), autumn including September, October, and November (SON) and winter including December, January, and February (DJF).
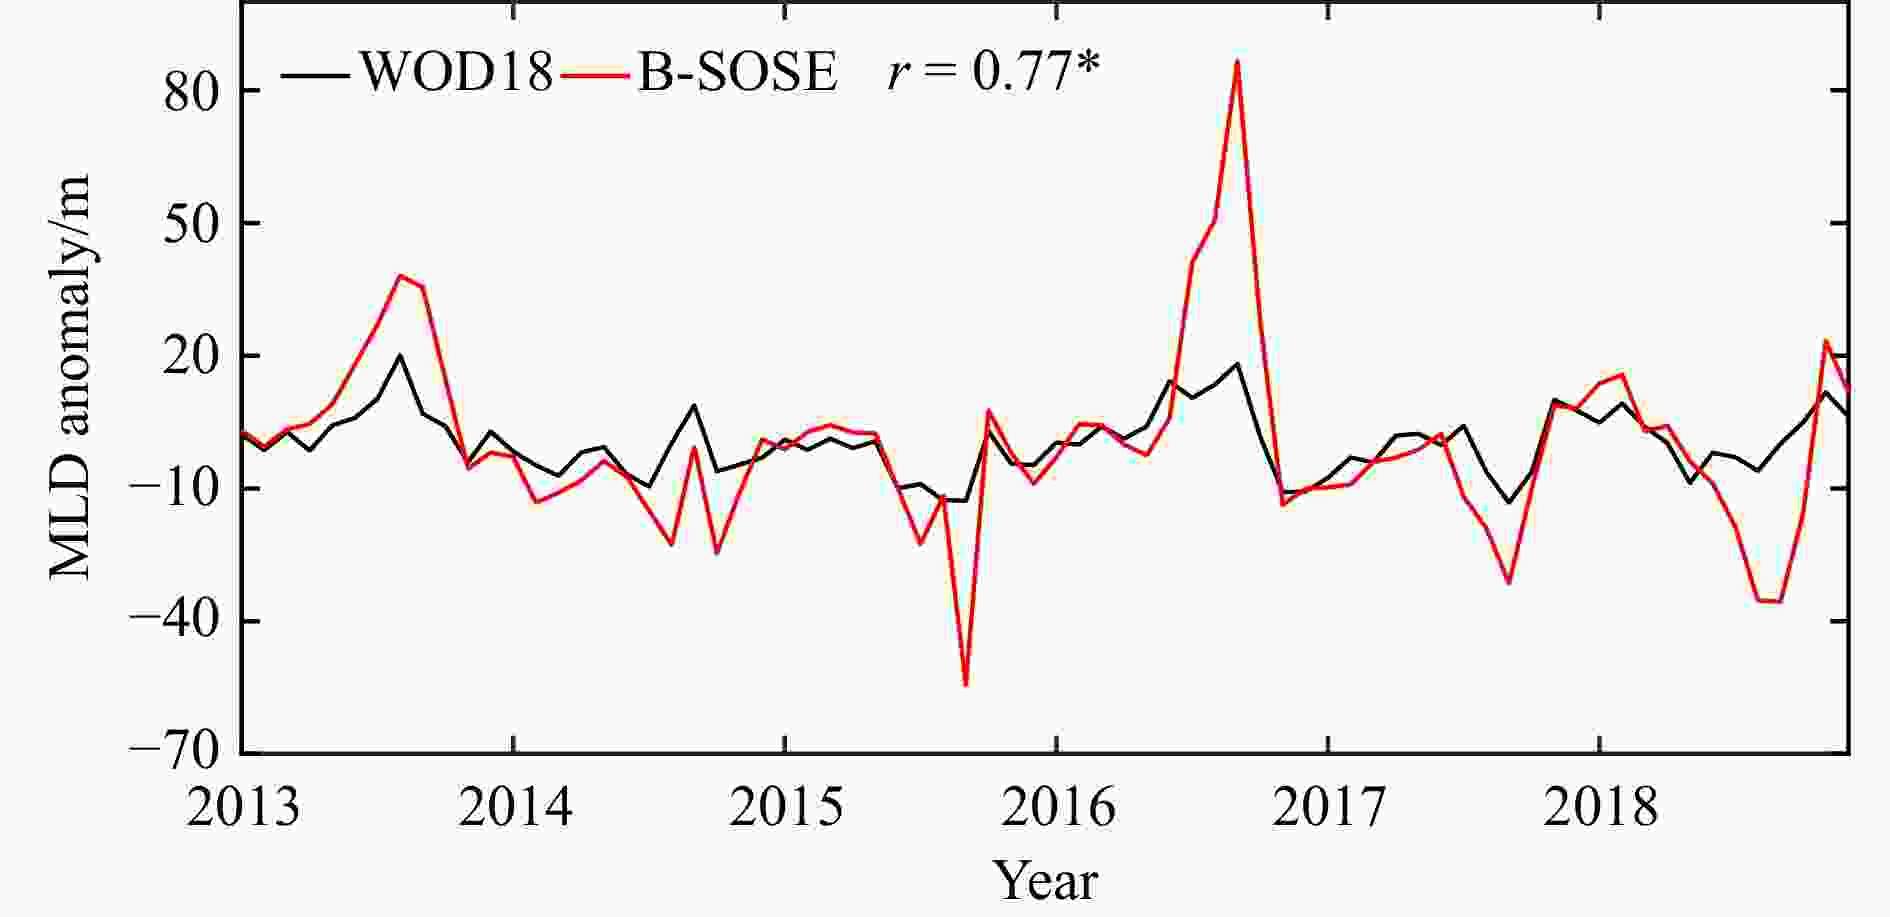
Figure 3. Time series of monthly MLD anomaly from B-SOSE and WOD18. The values are calculated by the black box depicted in Fig. 1. The asterisk (*) represents that the results are statistically significant at the 95% confidence level.
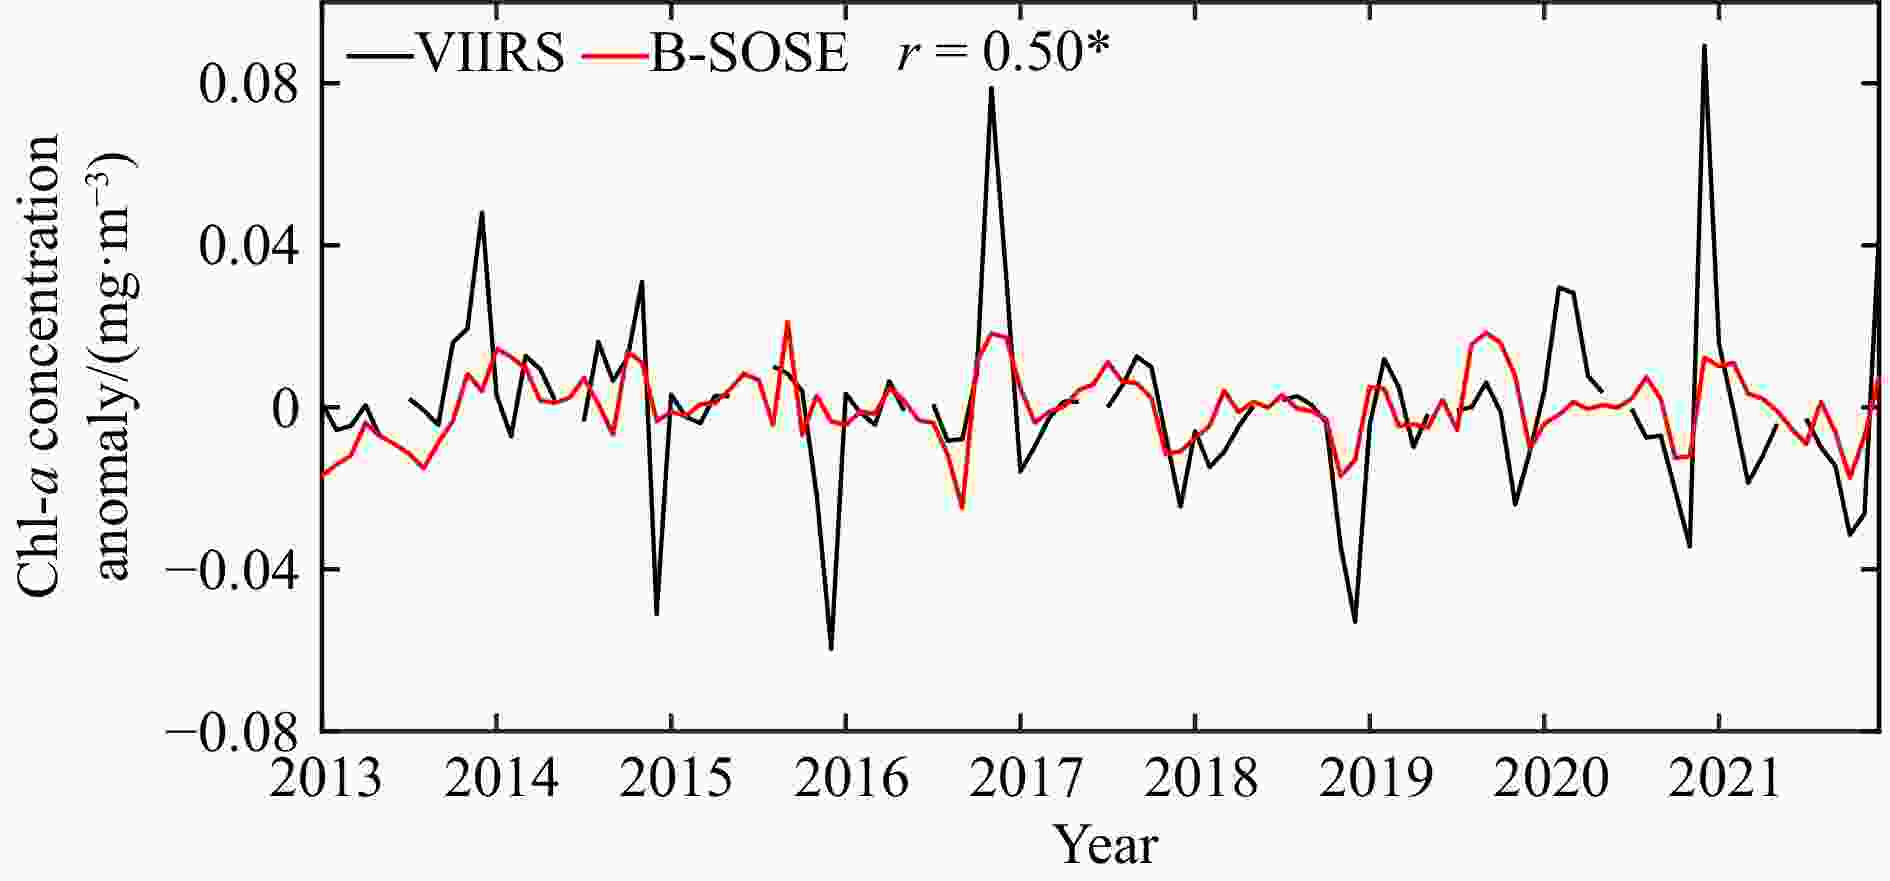
Figure 4. Time series of monthly Chl-a anomaly derived from B-SOSE and VIIRS sensor. The values are calculated by the black box depicted in Fig. 2. The asterisk (*) represents that the results are statistically significant at the 95% confidence level.
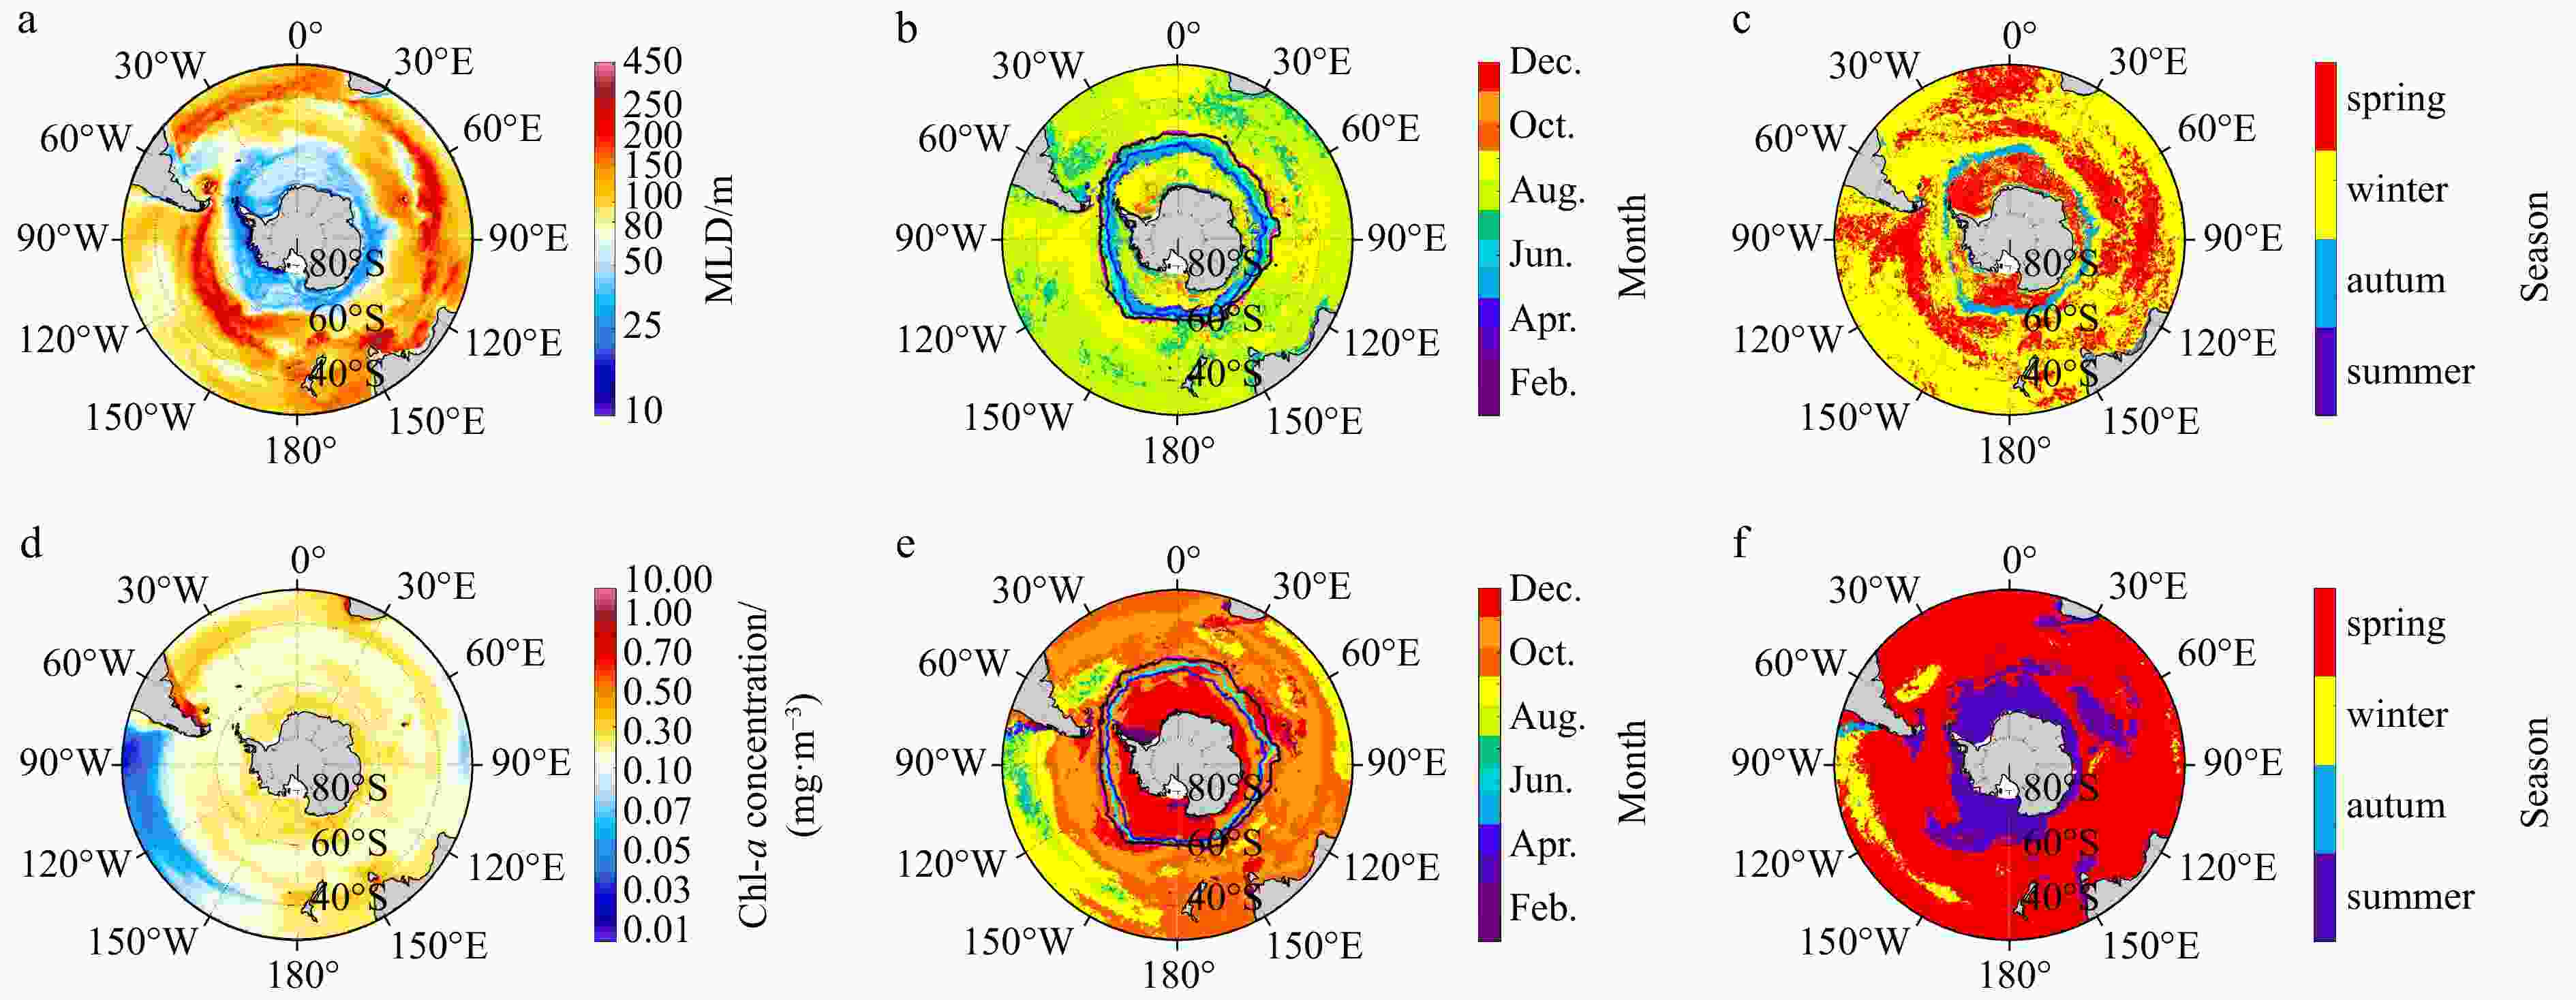
Figure 5. Maximum values of MLD (a) and Chl-a (d) and the occurrence time of maximum MLD (b, c) and Chl-a (e, f) from B-SOSE. b and e show the months when the maximum value occurs, c and f show the seasons when the maximum value occurs. In c and f, the colored contours represent the edges of sea ice in four seasons: the black, cyan, blue, and pink contours represent austral spring, summer, autumn, and winter, respectively.
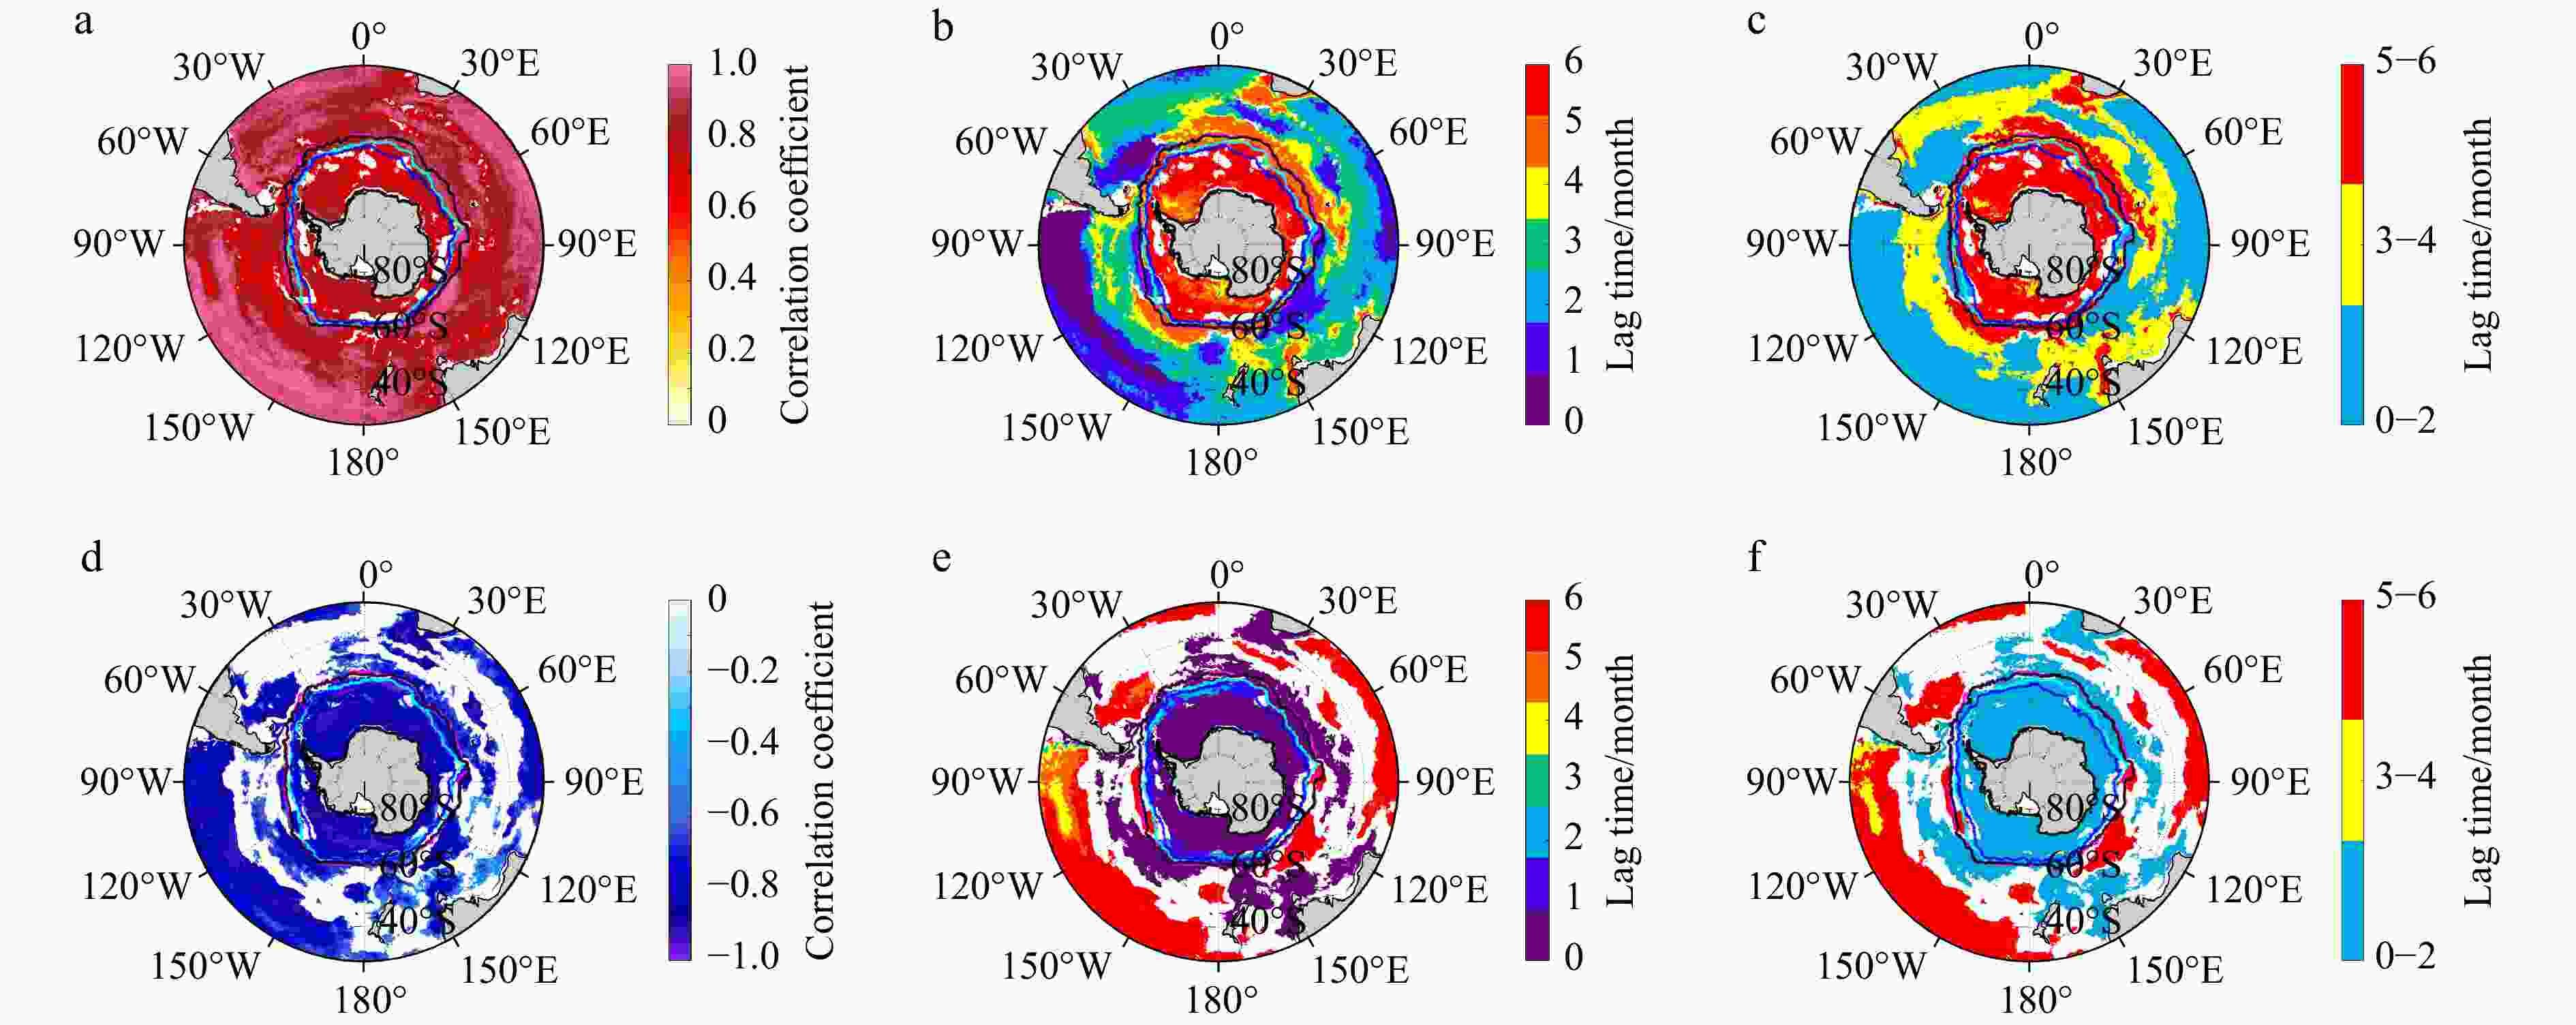
Figure 6. Strongest positive (a) and negative (d) correlation coefficients between the MLD and Chl-a and the time that Chl-a lags the MLD when the strongest correlation coefficient occurs (b, c, e, f). Figures 6a and d are statistically significant, and the statistically insignificant points have been removed. The colored contours represent the edges of sea ice in four seasons. The black, cyan, blue, and pink contours represent austral spring, summer, autumn, and winter, respectively.
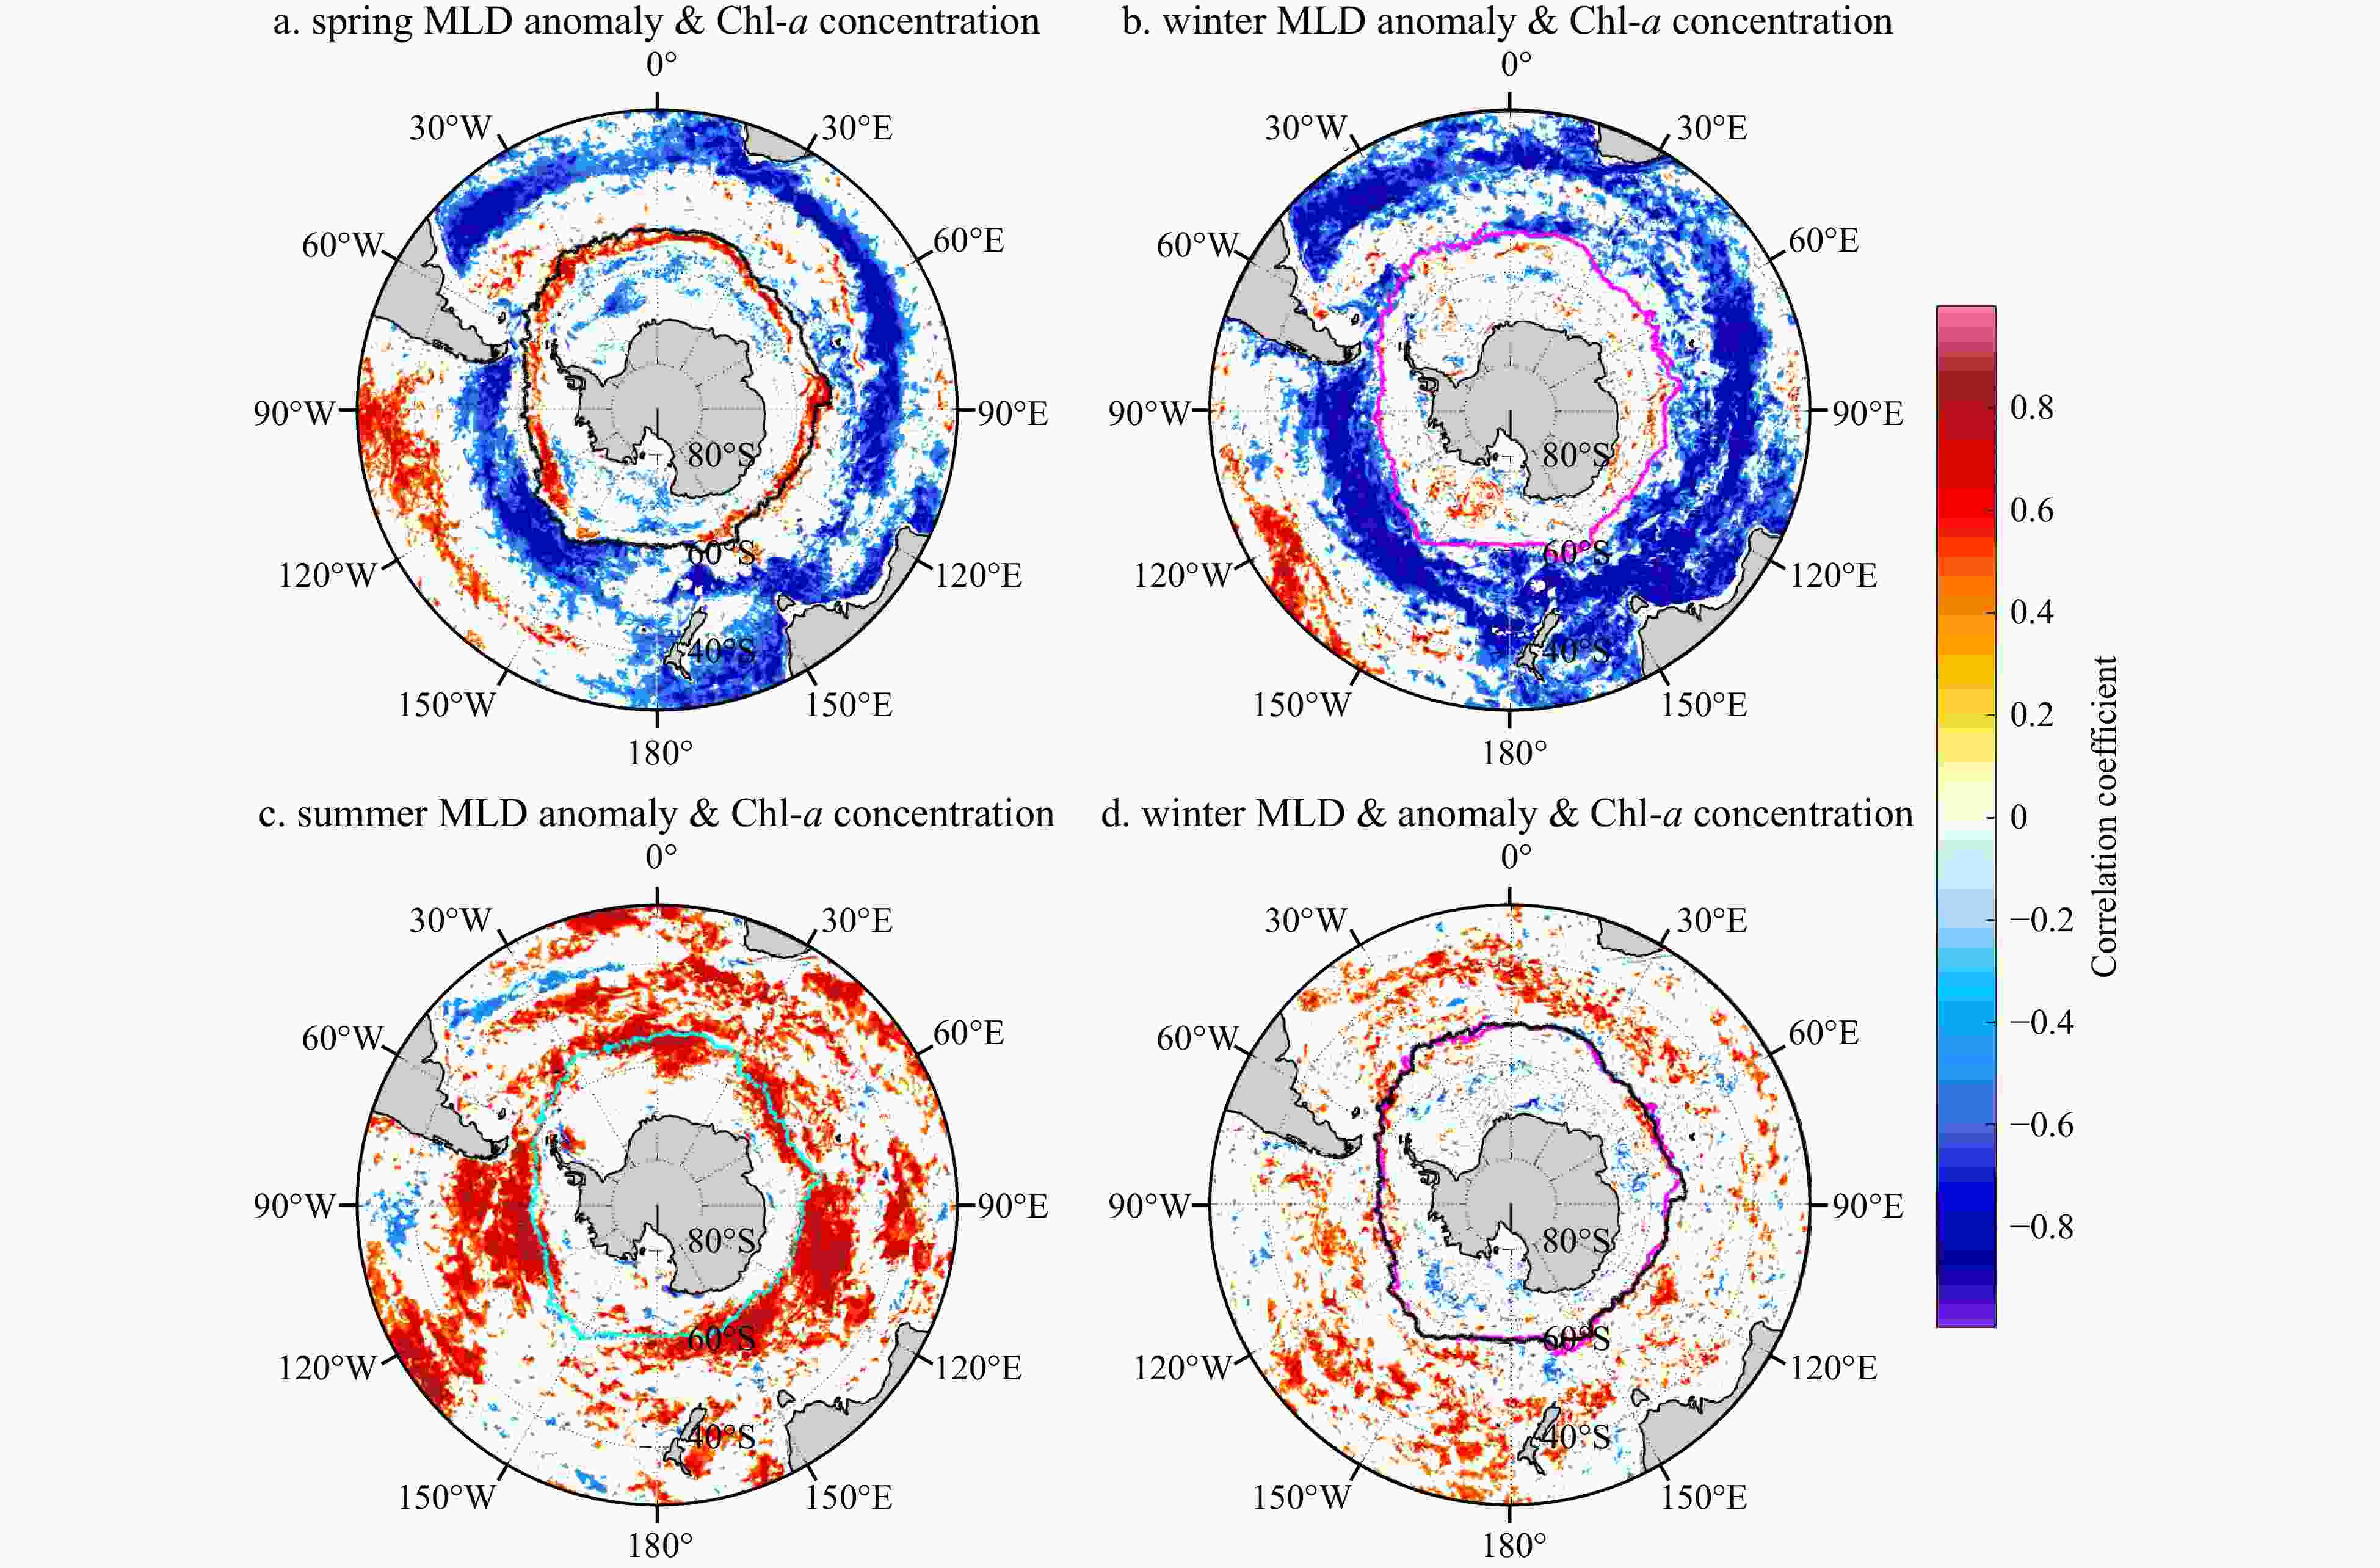
Figure 12. Correlation coefficients between MLD anomaly and Chl-a anomaly in the austral spring (a), summer (b), autumn (c), and winter (d) MLD and spring Chl-a. The black, cyan, and pink contours represent the edges of sea ice in the austral spring, summer, and winter, respectively. White regions represent correlations with p > 0.05.
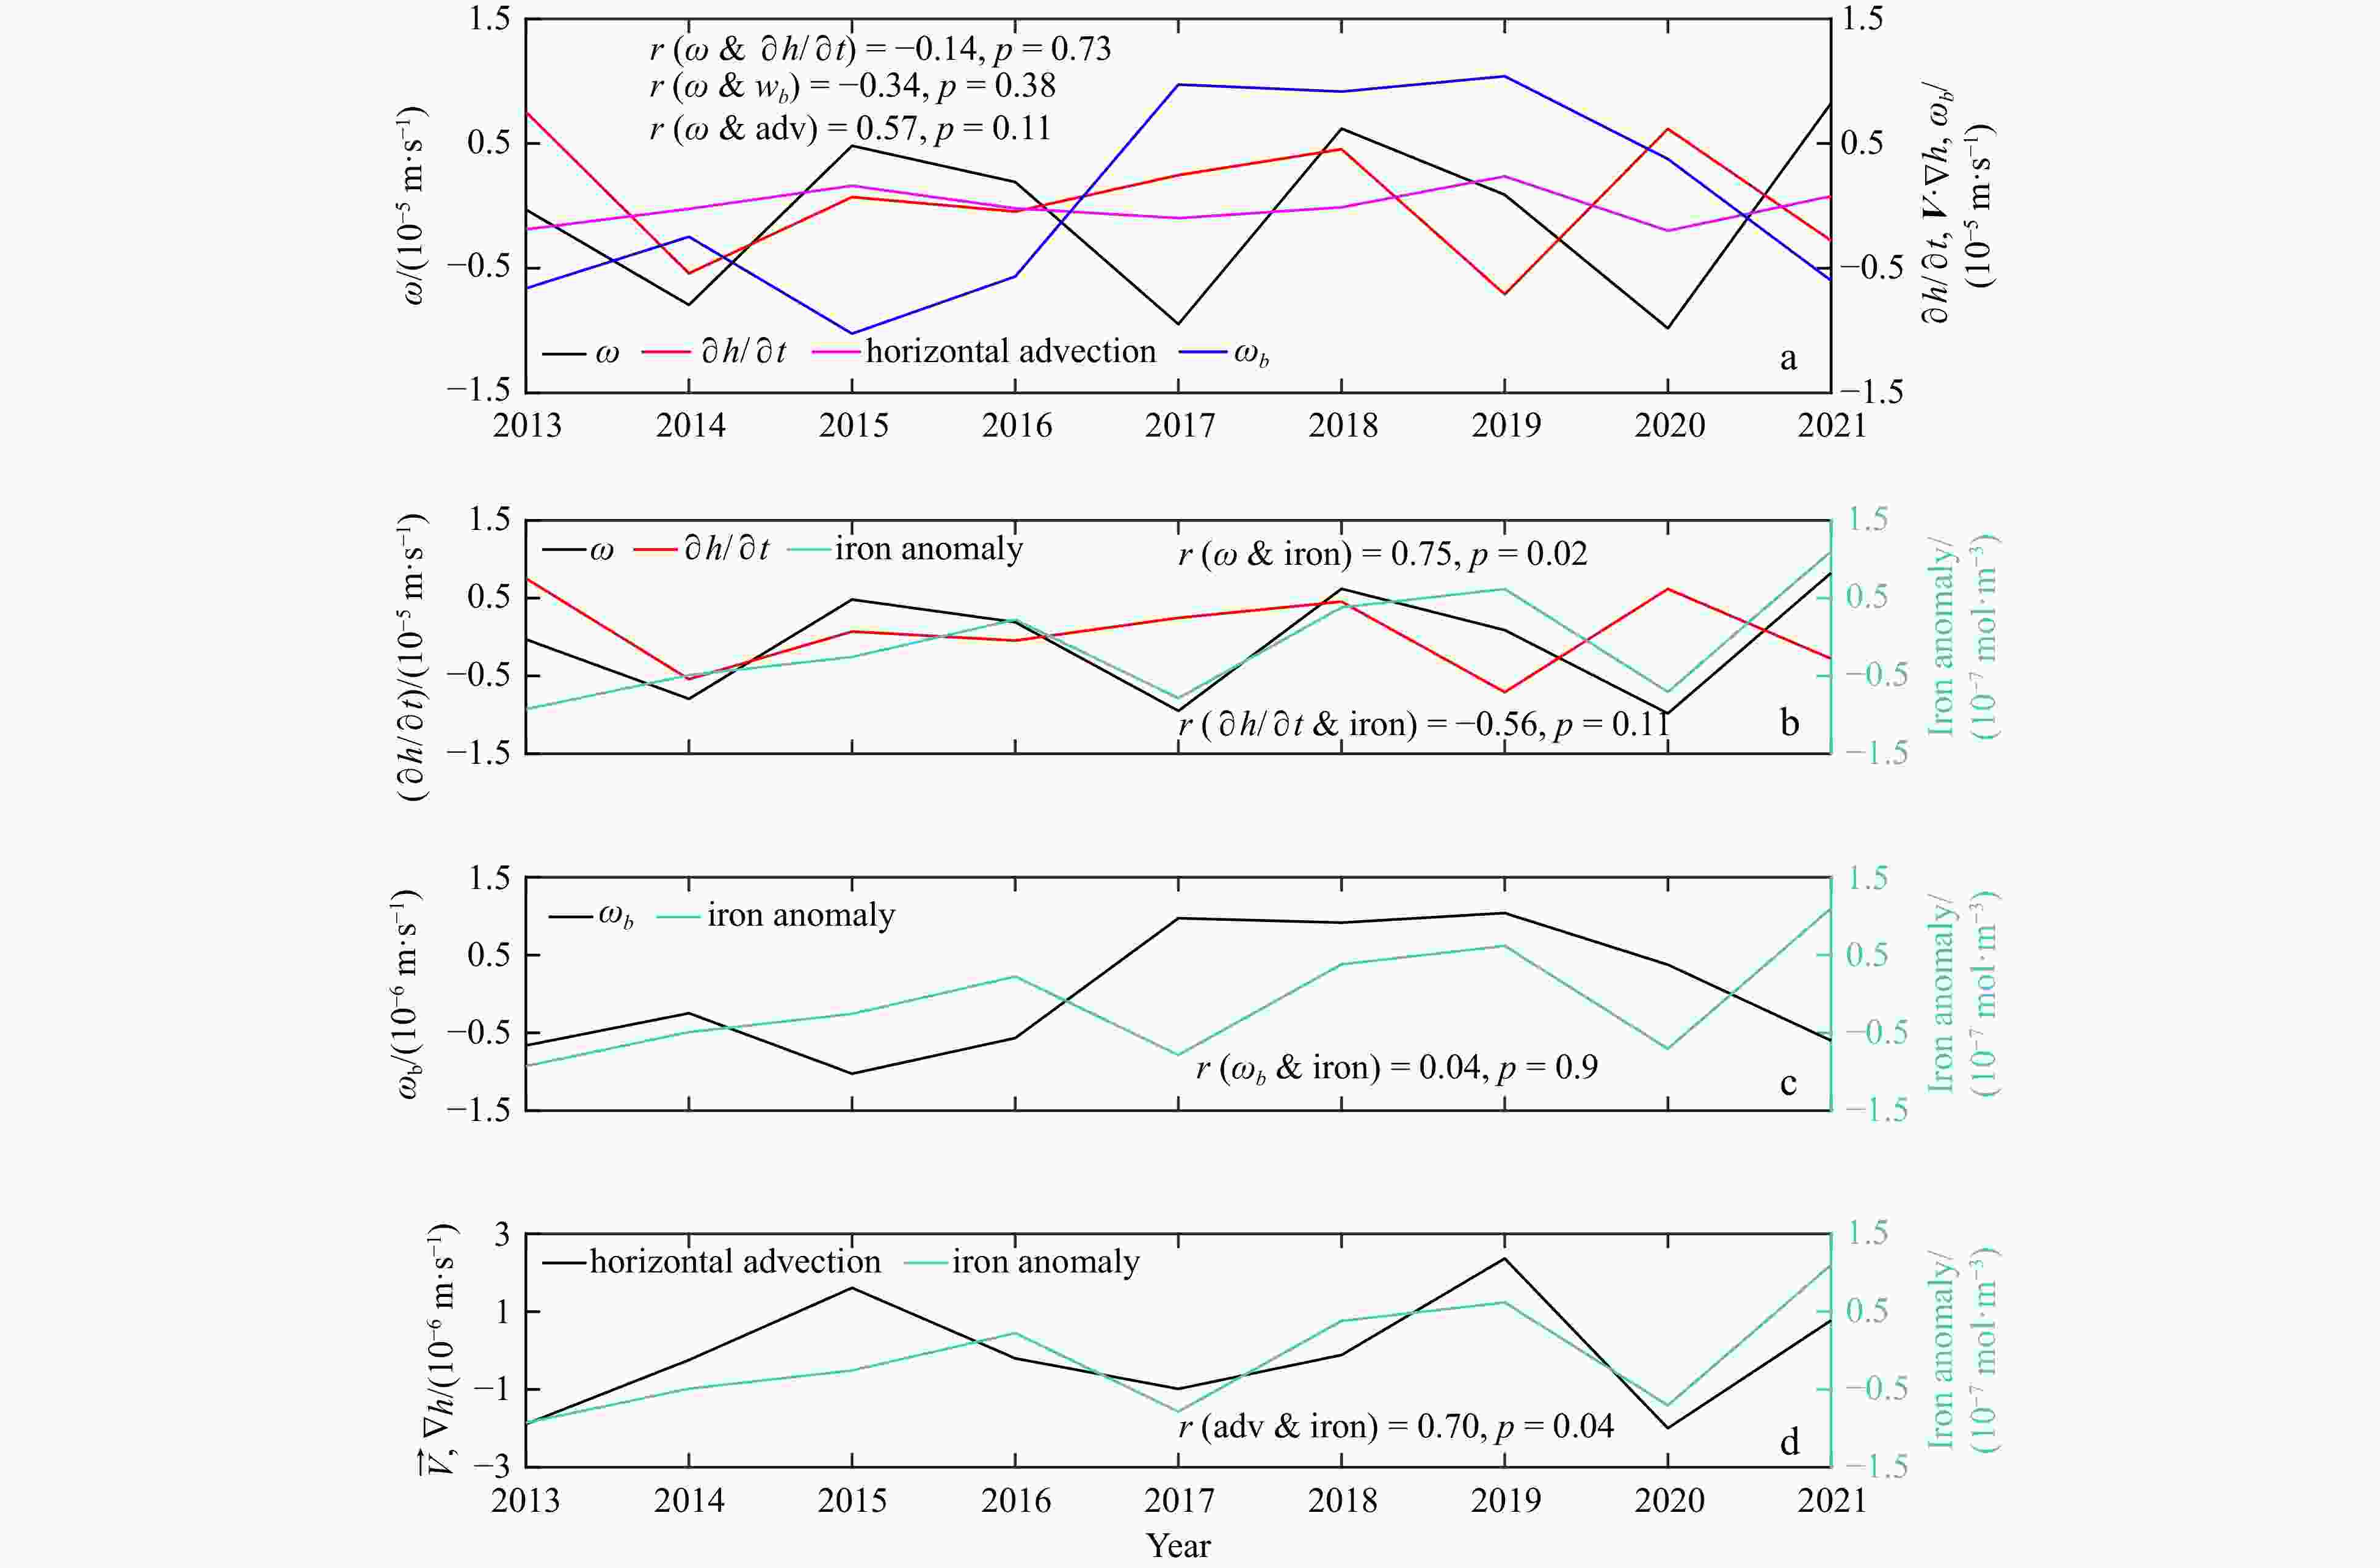
Figure 15. Time series and connections of the three terms in Eq. (5) [
$ {\partial {h}} $ /${\partial {t}} $ , the rate of MLD deepening;$ {{w}}_{{b}} $ , the vertical velocity at the ML base;$ \overrightarrow{{V}}\cdot \nabla {h} $ , the horizontal advection (adv) of water in the ML] and iron anomalies in annual summer. The magnitudes are calculated by domain-averaged over Fig. 14a, where the MLD works in the austral summer.Figure 18. Time series and connections of three terms in Eq. (5) (
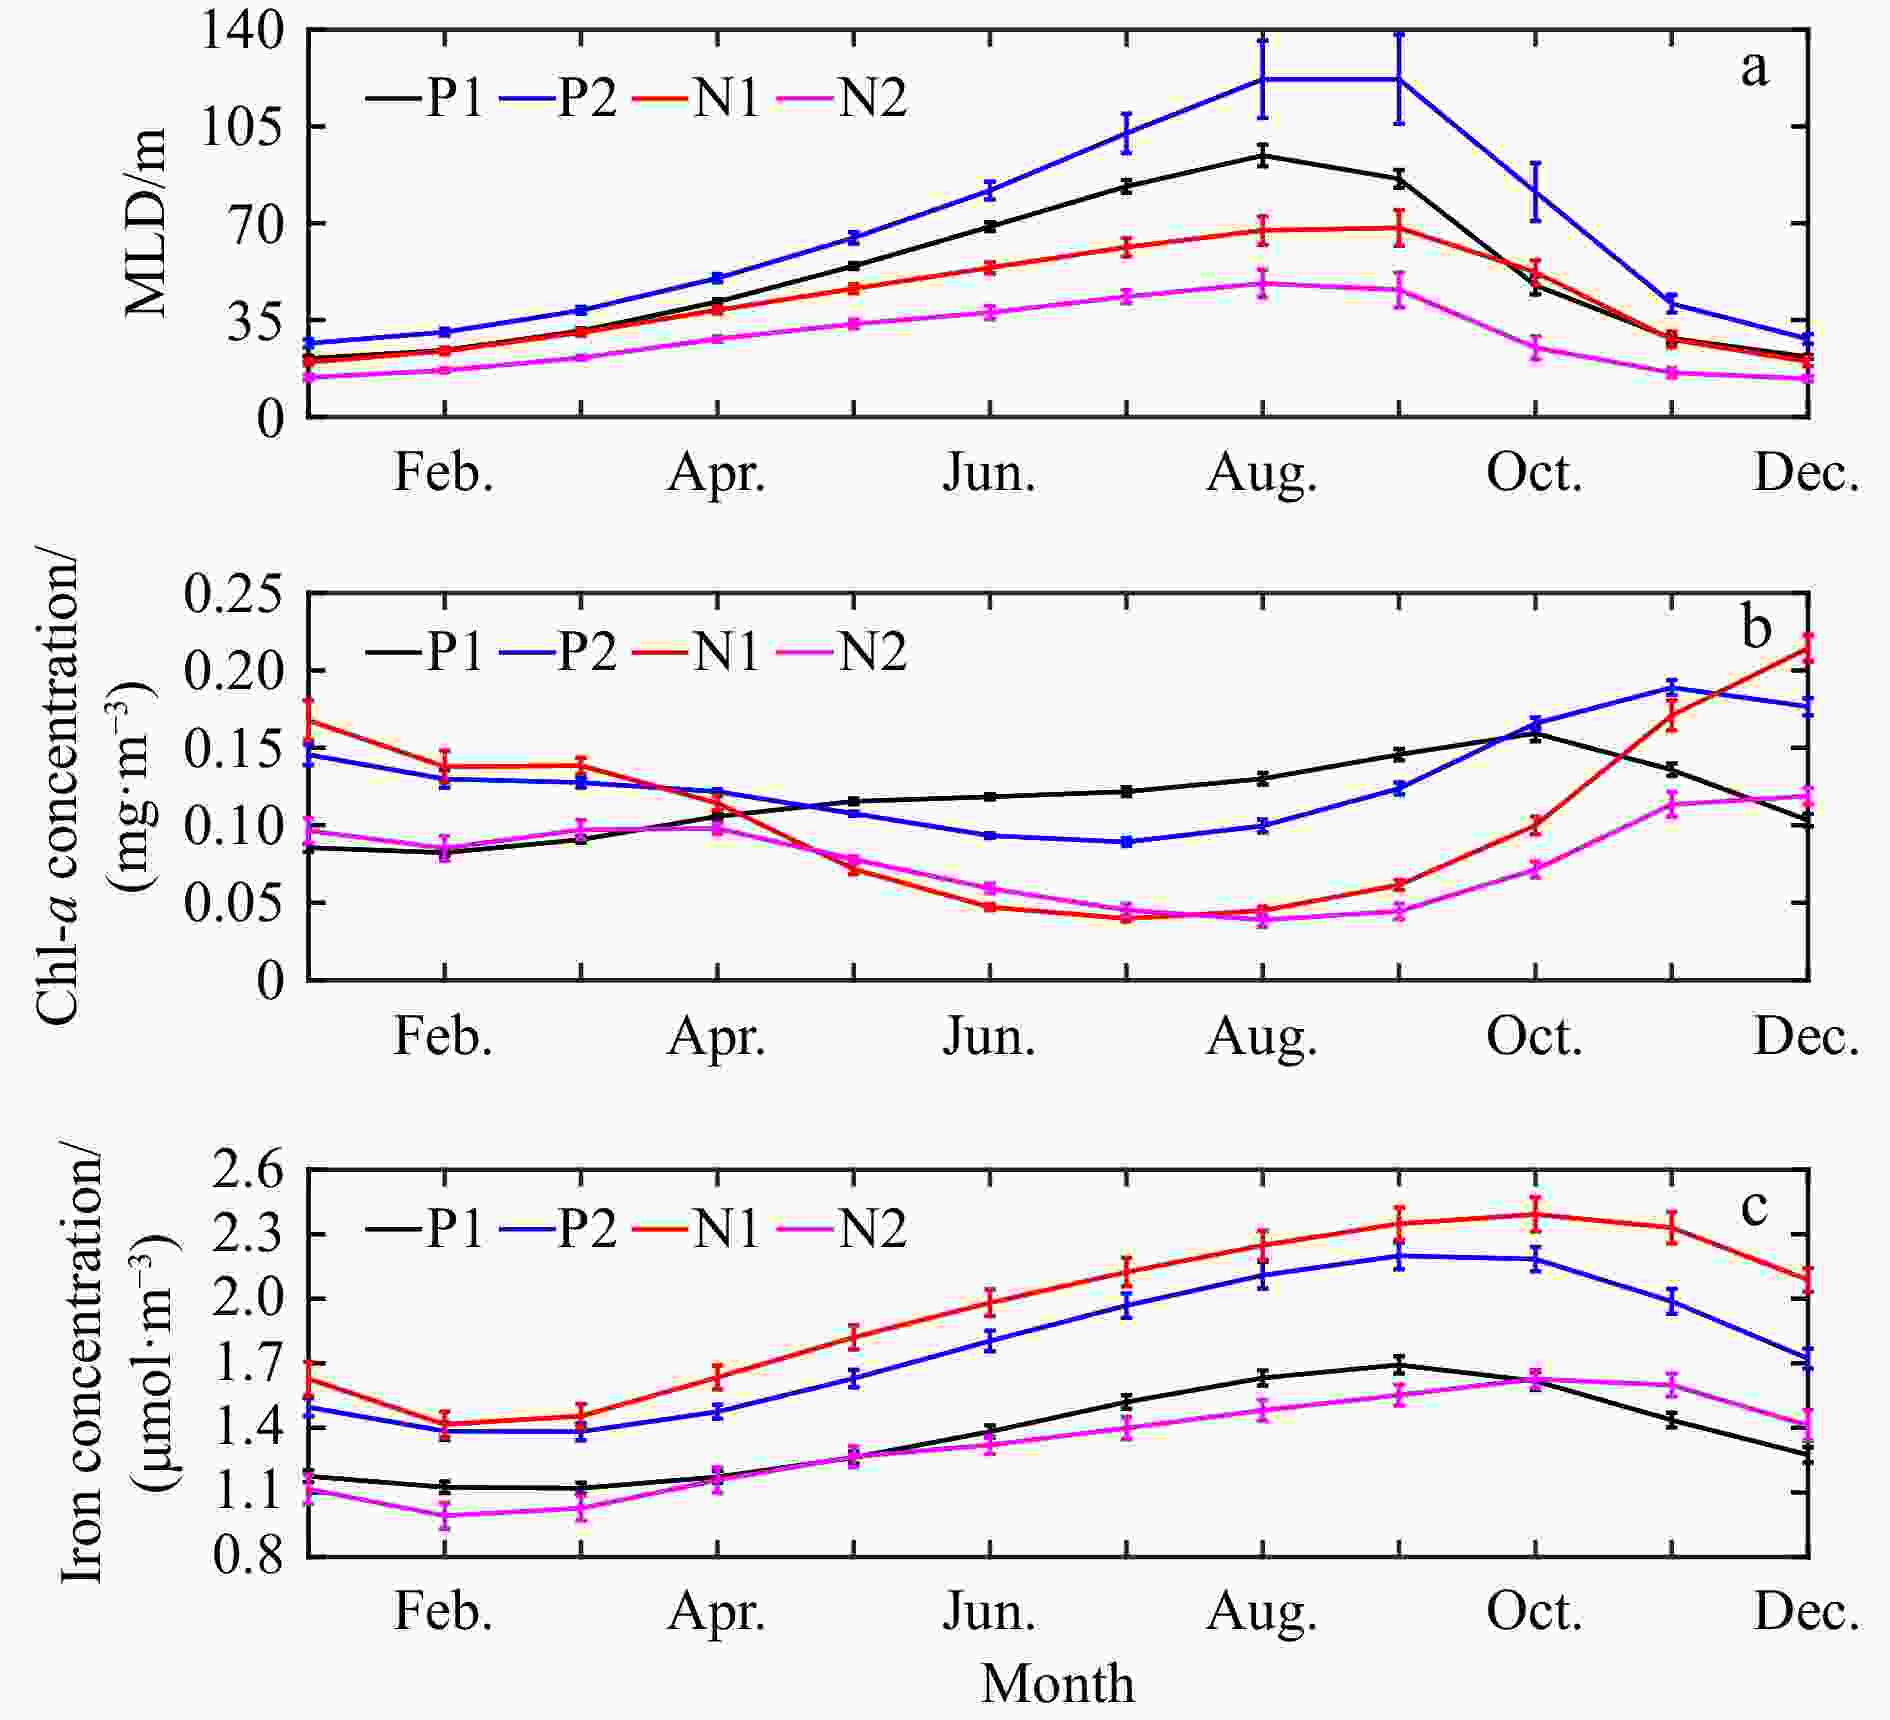
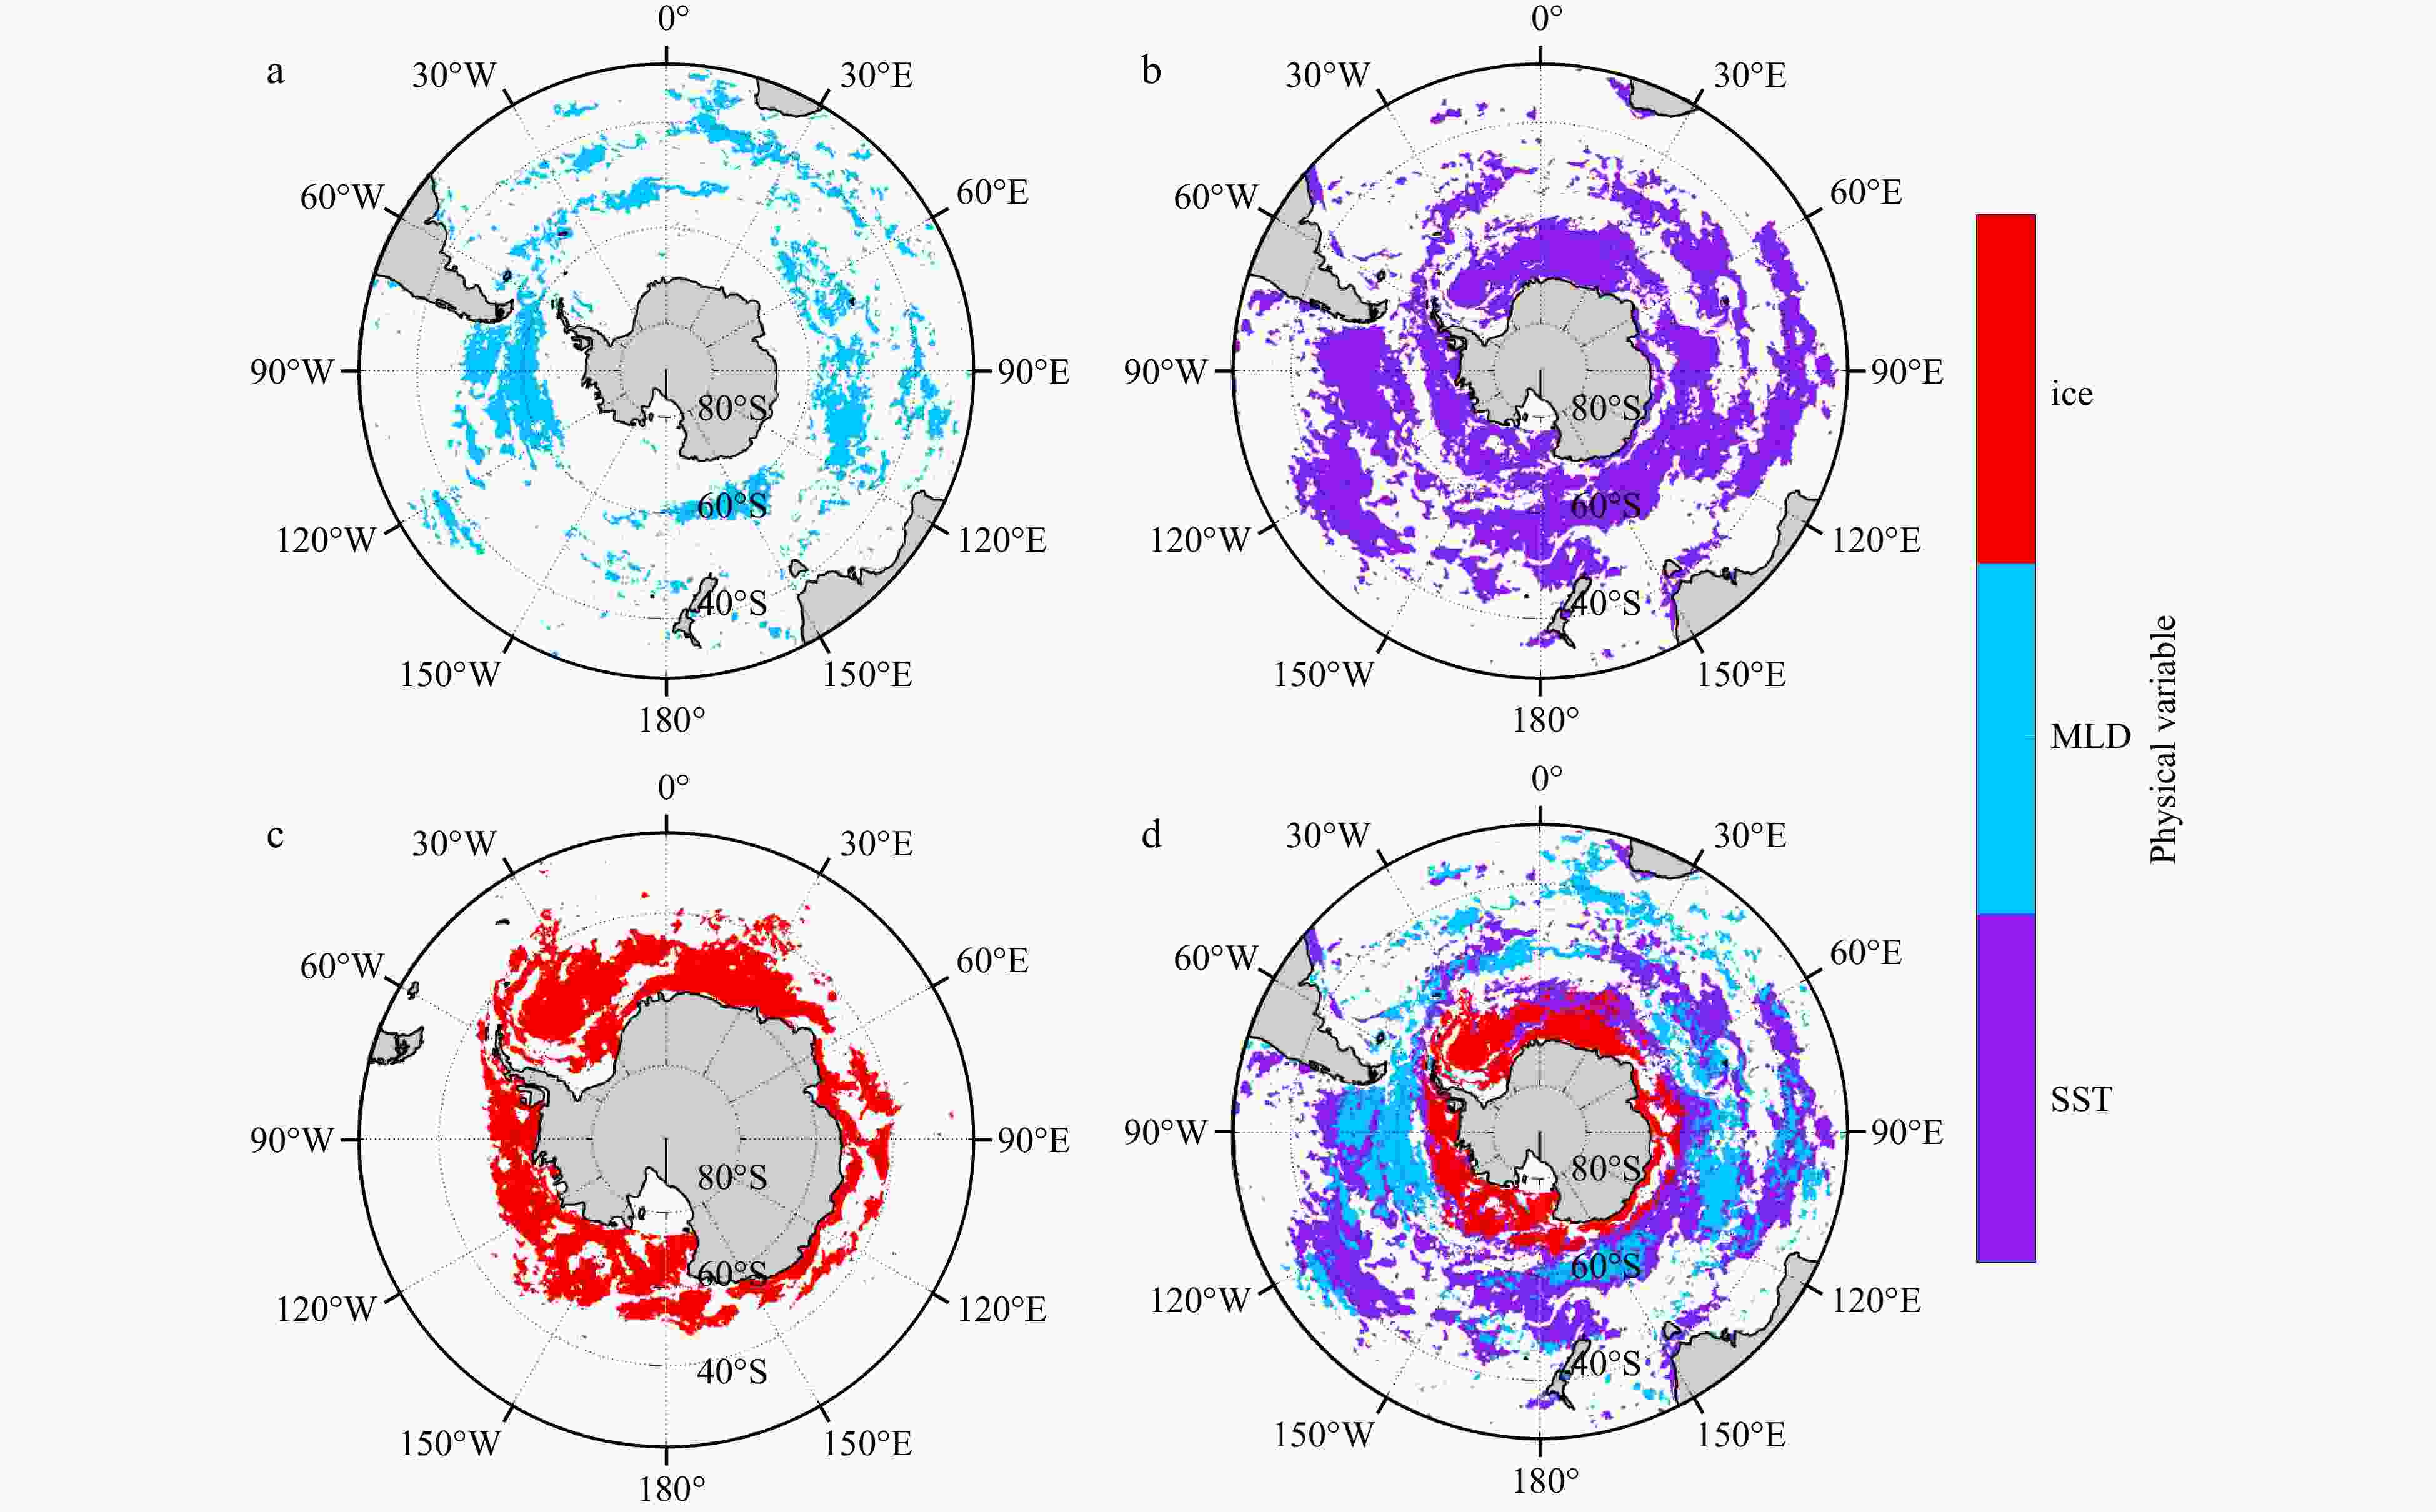
$ {\partial {h}} $ /${\partial {t}} $ , the rate of MLD deepening;$ {{w}}_{{b}} $ , the vertical velocity at the ML base;$ {{\boldsymbol{V}}}\cdot \nabla {h} $ , the horizontal advection (adv) of water in the ML) and iron in annual winter. The magnitudes are calculated by domain-averaged over Fig. 17a, where the MLD works in winter.Figure 19. A schematic summarizing the response of phytoplankton biomass to various primary physical variables in the SO on seasonal (a, b) and interannual (c, d) time scales. a. Positively correlated regions, regions in pink (P1) and red (P2) represent regions of deep MLD with high Chl-a (positively correlated). b. Negatively correlated regions, regions in light blue (N1) and blue (N2) represent regions of deep MLD with low Chl-a (negatively correlated). Regions P1 and N1 exhibit synchronous responses of Chl-a to the MLD, while Regions P2 and N2 show a one-season lagged responses of Chl-a to the MLD. c. Synchronous influence regions, regions showing positive anomalies in summer Chl-a are associated with negative anomalies in summer SST (purple), positive anomalies in summer MLD (blue), and positive anomalies in summer SIC (red). d. Delayed influence regions, regions showing positive anomalies in spring Chl-a are associated with negative anomalies in winter SST (purple), positive anomalies in winter MLD (blue), and negative anomalies in winter SIC (red).
Table 1. Correlation coefficients for each term in Eq. (5) and the MLD and iron over Region P1 in summer
w $ \dfrac{\partial h}{\partial t} $ wb $ {{\boldsymbol{V}}}\cdot \nabla h $ w – –0.07 0.26 0.40 MLD 0.29 –0.53 0.06 0.49 Fe 0.84* –0.16 0.24 0.39 Note: The asterisk (*) represents that the results are statistically significant at the 95% confidence level. – denotes no data. -
Aguirre C, García-Loyola S, Testa G, et al. 2018. Insight into anthropogenic forcing on coastal upwelling off south-central Chile. Elementa: Science of the Anthropocene, 6: 59, doi: 10.1525/elementa.314 Arrigo K R, Van Dijken G L. 2003. Phytoplankton dynamics within 37 Antarctic coastal polynya systems. Journal of Geophysical Research: Oceans, 108(C8): 3271, doi: 10.1029/2002jc001739 Arrigo K R, Van Dijken G L, Bushinsky S. 2008. Primary production in the Southern Ocean, 1997–2006. Journal of Geophysical Research: Oceans, 113(C8): C08004, doi: 10.1029/2007jc004551 Behera N, Swain D, Sil S. 2020. Effect of Antarctic sea ice on chlorophyll concentration in the Southern Ocean. Deep-Sea Research Part II: Topical Studies in Oceanography, 178: 104853, doi: 10.1016/j.dsr2.2020.104853 Behrenfeld M J, Doney S C, Lima I, et al. 2013. Annual cycles of ecological disturbance and recovery underlying the subarctic Atlantic spring plankton bloom. Global Biogeochemical Cycles, 27(2): 526–540, doi: 10.1002/gbc.20050 Blain S, Quéguiner B, Armand L, et al. 2007. Effect of natural iron fertilization on carbon sequestration in the Southern Ocean. Nature, 446(7139): 1070–1074, doi: 10.1038/nature05700 Bowie A R, Van Der Merwe P, Quéroué F, et al. 2015. Iron budgets for three distinct biogeochemical sites around the Kerguelen Archipelago (Southern Ocean) during the natural fertilisation study, KEOPS-2. Biogeosciences, 12(14): 4421–4445, doi: 10.5194/bg-12-4421-2015 Boyd P W. 2002. Environmental factors controlling phytoplankton processes in the Southern Ocean. Journal of Phycology, 38(5): 844–861, doi: 10.1046/j.1529-8817.2002.t01-1-01203.x Boyd P W, Arrigo K R, Strzepek R, et al. 2012. Mapping phytoplankton iron utilization: insights into Southern Ocean supply mechanisms. Journal of Geophysical Research: Oceans, 117(C6): C06009, doi: 10.1029/2011jc007726 Boyer T P, Baranova O K, Coleman C, et al. 2019. World ocean database 2018. Silver Spring: U.S. Department of Commerce Boyd P W, Ellwood M J. 2010. The biogeochemical cycle of iron in the ocean. Nature Geoscience, 3(10): 675–682, doi: 10.1038/ngeo964 Boyd P, Laroche J, Gall M, et al. 1999. Role of iron, light, and silicate in controlling algal biomass in subantarctic waters SE of New Zealand. Journal of Geophysical Research: Oceans, 104(C6): 13395–13408, doi: 10.1029/1999jc900009 Boyd P W, Watson A J, Law C S, et al. 2000. A mesoscale phytoplankton bloom in the polar Southern Ocean stimulated by iron fertilization. Nature, 407(6805): 695–702, doi: 10.1038/35037500 Carranza M M, Gille S T. 2015. Southern Ocean wind-driven entrainment enhances satellite chlorophyll-a through the summer. Journal of Geophysical Research: Oceans, 120(1): 304–323, doi: 10.1002/2014jc010203 Carton J A, Grodsky S A, Liu Hailong. 2008. Variability of the oceanic mixed layer, 1960–2004. Journal of Climate, 21(5): 1029–1047, doi: 10.1175/2007jcli1798.1 Chu P C. 1993. Generation of low-frequency unstable modes in a coupled equatorial troposphere and ocean mixed-layer model. Journal of the Atmospheric Sciences, 50(5): 731–749, doi: 10.1175/1520-0469(1993)0502.0.CO;2 Chu P C, Garwood R W Jr. 1991. On the two-phase thermodynamics of the coupled cloud-ocean mixed layer. Journal of Geophysical Research: Oceans, 96(S01): 3425–3436, doi: 10.1029/90JC01862 Chu P C, Garwood R W Jr, Muller P. 1990. Unstable and damped modes in coupled ocean mixed layer and cloud models. Journal of Marine Systems, 1(1/2): 1–11, doi: 10.1016/0924-7963(90)90051-B De Baar H J W, De Jong J T M, Bakker D C E, et al. 1995. Importance of iron for plankton blooms and carbon dioxide drawdown in the Southern Ocean. Nature, 373(6513): 412–415, doi: 10.1038/373412a0 De Boyer Montégut C, Madec G, Fischer A S, et al. 2004. Mixed layer depth over the global ocean: an examination of profile data and a profile-based climatology. Journal of Geophysical Research: Oceans, 109(C12): C12003, doi: 10.1029/2004jc002378 Dong Shenfu, Sprintall J, Gille S T, et al. 2008. Southern Ocean mixed-layer depth from argo float profiles. Journal of Geophysical Research: Oceans, 113(C6): C06013, doi: 10.1029/2006jc004051 Fauchereau N, Tagliabue A, Bopp L, et al. 2011. The response of phytoplankton biomass to transient mixing events in the Southern Ocean. Geophysical Research Letters, 38(17): L17601, doi: 10.1029/2011gl048498 Frants M, Gille S T, Hatta M, et al. 2013. Analysis of horizontal and vertical processes contributing to natural iron supply in the mixed layer in southern Drake Passage. Deep Sea Research Part II: Topical Studies in Oceanography, 90: 68–76, doi: 10.1016/j.dsr2.2012.06.001 Galbraith E D, Gnanadesikan A, Dunne J P, et al. 2010. Regional impacts of iron-light colimitation in a global biogeochemical model. Biogeosciences, 7(3): 1043–1064, doi: 10.5194/bg-7-1043-2010 Geibert W, Assmy P, Bakker D C E, et al. 2010. High productivity in an ice melting hot spot at the eastern boundary of the Weddell Gyre. Global Biogeochemical Cycles, 24(3): GB3007, doi: 10.1029/2009GB003657 Graham R M, De Boer A M, Van Sebille E, et al. 2015. Inferring source regions and supply mechanisms of iron in the Southern Ocean from satellite chlorophyll data. Deep-Sea Research Part I: Oceanographic Research Papers, 104: 9–25, doi: 10.1016/j.dsr.2015.05.007 He Qingyou, Zhan Haigang, Cai Shuqun, et al. 2016. Eddy effects on surface chlorophyll in the northern South China Sea: mechanism investigation and temporal variability analysis. Deep Sea Research Part I: Oceanographic Research Papers, 112: 25–36, doi: 10.1016/j.dsr.2016.03.004 Helber R W, Kara A B, Richman J G, et al. 2012. Temperature versus salinity gradients below the ocean mixed layer. Journal of Geophysical Research: Oceans, 117(C5): C05006, doi: 10.1029/2011jc007382 Hense I, Bathmann U V, Timmermann R. 2000. Plankton dynamics in frontal systems of the Southern Ocean. Journal of Marine Systems, 27(1–3): 235–252, doi: 10.1016/S0924-7963(00)00070-1 Korb R E, Whitehouse M J, Atkinson A, et al. 2008. Magnitude and maintenance of the phytoplankton bloom at South Georgia: a naturally iron-replete environment. Marine Ecology Progress Series, 368: 75–91, doi: 10.3354/meps07525 Lancelot C, De Montety A, Goosse H, et al. 2009. Spatial distribution of the iron supply to phytoplankton in the Southern Ocean: a model study. Biogeosciences, 6(12): 2861–2878, doi: 10.5194/bg-6-2861-2009 Li Zuchuan, Lozier M S, Cassar N. 2021. Linking Southern Ocean mixed-layer dynamics to net community production on various timescales. Journal of Geophysical Research: Oceans, 126(10): e2021JC017537, doi: 10.1029/2021jc017537 Ma Jinfeng, Liu Hailong, Lin Pengfei, et al. 2021. Effects of the seasonal variation in chlorophyll concentration on sea surface temperature in the global ocean. Acta Oceanologica Sinica, 40(11): 50–61, doi: 10.1007/s13131-021-1765-7 Marinov I, Follows M, Gnanadesikan A, et al. 2008. How does ocean biology affect atmospheric pCO2? Theory and models. Journal of Geophysical Research: Oceans, 113(C7): C07032, doi: 10.1029/2007jc004598 Martin J H, Fitzwater S E, Gordon R M. 1990a. Iron deficiency limits phytoplankton growth in Antarctic waters. Global Biogeochemical Cycles, 4(1): 5–12, doi: 10.1029/GB004i001p00005 Martin J H, Gordon R M, Fitzwater S E. 1990b. Iron in Antarctic waters. Nature, 345(6271): 156–158, doi: 10.1038/345156a0 Mazloff M R, Heimbach P, Wunsch C. 2010. An eddy-permitting Southern Ocean state estimate. Journal of Physical Oceanography, 40(5): 880–899, doi: 10.1175/2009jpo4236.1 Mcgillicuddy D J, Sedwick P N, Dinniman M S, et al. 2015. Iron supply and demand in an Antarctic shelf ecosystem. Geophysical Research Letters, 42(19): 8088–8097, doi: 10.1002/2015gl065727 Medina-Gómez I, Trujillo A A, Marino-Tapia I, et al. 2019. Phytoplankton responses under a joint upwelling event and an algal bloom scenario in the southeast Gulf of Mexico. Continental Shelf Research, 184: 30–43, doi: 10.1016/j.csr.2019.07.006 Mitchell B G, Brody E A, Holm-Hansen O, et al. 1991. Light limitation of phytoplankton biomass and macronutrient utilization in the Southern Ocean. Limnology and Oceanography, 36(8): 1662–1677, doi: 10.4319/lo.1991.36.8.1662 Moline M A, Claustre H, Frazer T K, et al. 2004. Alteration of the food web along the Antarctic Peninsula in response to a regional warming trend. Global Change Biology, 10(12): 1973–1980, doi: 10.1111/j.1365-2486.2004.00825.x Moore J K, Abbott M R. 2000. Phytoplankton chlorophyll distributions and primary production in the Southern Ocean. Journal of Geophysical Research: Oceans, 105(C12): 28709–28722, doi: 10.1029/1999JC000043 Moore J K, Doney S C, Glover D M, et al. 2001. Iron cycling and nutrient-limitation patterns in surface waters of the world ocean. Deep Sea Research Part II: Topical Studies in Oceanography, 49(1–3): 463–507, doi: 10.1016/S0967-0645(01)00109-6 Moore J K, Doney S C, Lindsay K. 2004. Upper ocean ecosystem dynamics and iron cycling in a global three-dimensional model. Global Biogeochemical Cycles, 18(4): GB4028, doi: 10.1029/2004gb002220 Pang Shanshan, Wang Xidong, Liu Hailong, et al. 2019. Decadal variability of the barrier layer and forcing mechanism in the Bay of Bengal. Journal of Geophysical Research: Oceans, 124(7): 5289–5307, doi: 10.1029/2018jc014918 Park J, Oh I S, Kim H C, et al. 2010. Variability of SeaWiFs chlorophyll-a in the southwest Atlantic sector of the Southern Ocean: strong topographic effects and weak seasonality. Deep-Sea Research Part I: Oceanographic Research Papers, 57(4): 604–620, doi: 10.1016/j.dsr.2010.01.004 Pauly D, Christensen V. 1995. Primary production required to sustain global fisheries. Nature, 374(6519): 255–257, doi: 10.1038/374255a0 Qiu Yun, Cai Wenju, Li Li, et al. 2012. Argo profiles variability of barrier layer in the tropical Indian Ocean and its relationship with the Indian Ocean Dipole. Geophysical Research Letters, 39(8): L08605, doi: 10.1029/2012gl051441 Sallée J B, Speer K G, Rintoul S R. 2010. Zonally asymmetric response of the Southern Ocean mixed-layer depth to the southern annular mode. Nature Geoscience, 3(4): 273–279, doi: 10.1038/ngeo812 Schueler C F, Clement J E, Ardanuy P E, et al. 2002. NPOESS VIIRS sensor design overview. In: Proceedings of SPIE 4483, Earth Observing Systems VI. San Diego, CA, USA: SPIE, 11–23, doi: 10.1117/12.453451 Shi Yuxin, Liu Hailong, Wang Xidong, et al. 2024. Responses of the southern ocean mixed layer depth to the eastern and central Pacific El Niño events during austral winter. Acta Oceanologica Sinica, 43(7), doi: 10.1007/s13131-023-2228-0 Smith W O Jr, Comiso J C. 2008. Influence of sea ice on primary production in the Southern Ocean: a satellite perspective. Journal of Geophysical Research: Oceans, 113(C5): C05S93, doi: 10.1029/2007jc004251 Sverdrup H U. 1953. On conditions for the vernal blooming of phytoplankton. ICES Journal of Marine Science, 18(3): 287–295, doi: 10.1093/icesjms/18.3.287 Tagliabue A, Sallée J B, Bowie A R, et al. 2014. Surface-water iron supplies in the Southern Ocean sustained by deep winter mixing. Nature Geoscience, 7(4): 314–320, doi: 10.1038/ngeo2101 Taylor J R, Ferrari R. 2011. Ocean fronts trigger high latitude phytoplankton blooms. Geophysical Research Letters, 38(23): L23601, doi: 10.1029/2011gl049312 Thomalla S J, Fauchereau N, Swart S, et al. 2011. Regional scale characteristics of the seasonal cycle of chlorophyll in the Southern Ocean. Biogeosciences, 8(10): 2849–2866, doi: 10.5194/bg-8-2849-2011 Tripathy S C, Pavithran S, Sabu P, et al. 2015. Deep chlorophyll maximum and primary productivity in Indian Ocean sector of the Southern Ocean: case study in the subtropical and polar front during austral summer 2011. Deep-Sea Research Part II: Topical Studies in Oceanography, 118: 240–249, doi: 10.1016/j.dsr2.2015.01.004 Venables H, Moore C M. 2010. Phytoplankton and light limitation in the Southern Ocean: learning from high-nutrient, high-chlorophyll areas. Journal of Geophysical Research: Oceans, 115(C2): C02015, doi: 10.1029/2009jc005361 Verdy A, Mazloff M R. 2017. A data assimilating model for estimating Southern Ocean biogeochemistry. Journal of Geophysical Research: Oceans, 122(9): 6968–6988, doi: 10.1002/2016jc012650 Ying Meijia, Liu Hailong, Wang Fuchang, et al. 2019. Spatio-temporal variations of mixed layer depth in Southern Ocean. Oceanologia et Limnologia Sinica (in Chinese), 50(6): 1223–1232, doi: 10.11693/hyhz20190800153 -


 下载:
下载:
