Mangrove monitoring and extraction based on multi-source remote sensing data: A deep learning method based on SAR and optical image fusion
-
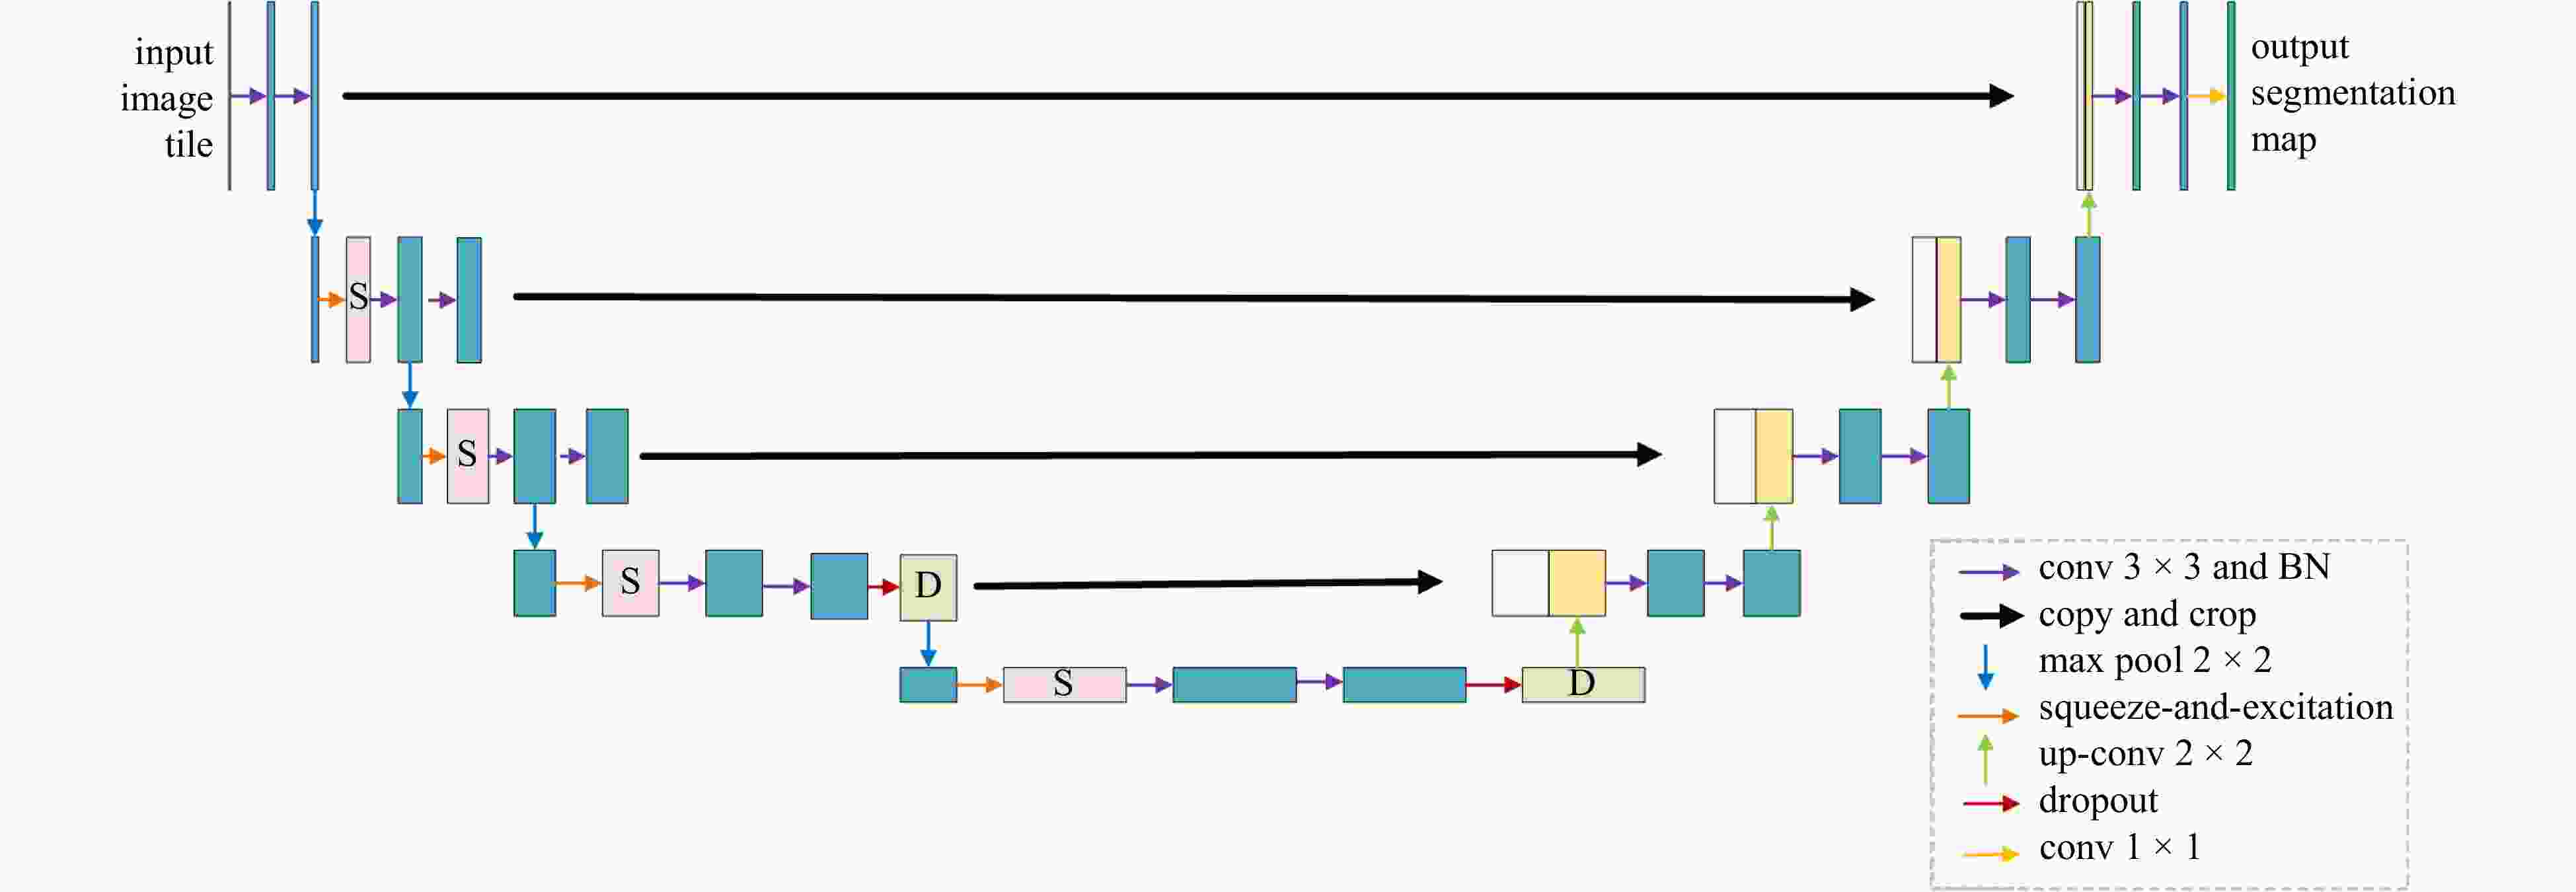
Abstract: Mangroves are indispensable to coastlines, maintaining biodiversity, and mitigating climate change. Therefore, improving the accuracy of mangrove information identification is crucial for their ecological protection. Aiming at the limited morphological information of synthetic aperture radar (SAR) images, which is greatly interfered by noise, and the susceptibility of optical images to weather and lighting conditions, this paper proposes a pixel-level weighted fusion method for SAR and optical images. Image fusion enhanced the target features and made mangrove monitoring more comprehensive and accurate. To address the problem of high similarity between mangrove forests and other forests, this paper is based on the U-Net convolutional neural network, and an attention mechanism is added in the feature extraction stage to make the model pay more attention to the mangrove vegetation area in the image. In order to accelerate the convergence and normalize the input, batch normalization (BN) layer and Dropout layer are added after each convolutional layer. Since mangroves are a minority class in the image, an improved cross-entropy loss function is introduced in this paper to improve the model’s ability to recognize mangroves. The AttU-Net model for mangrove recognition in high similarity environments is thus constructed based on the fused images. Through comparison experiments, the overall accuracy of the improved U-Net model trained from the fused images to recognize the predicted regions is significantly improved. Based on the fused images, the recognition results of the AttU-Net model proposed in this paper are compared with its benchmark model, U-Net, and the Dense-Net, Res-Net, and Seg-Net methods. The AttU-Net model captured mangroves’ complex structures and textural features in images more effectively. The average OA, F1-score, and Kappa coefficient in the four tested regions were 94.406%, 90.006%, and 84.045%, which were significantly higher than several other methods. This method can provide some technical support for the monitoring and protection of mangrove ecosystems.
-
Key words:
- image fusion /
- SAR image /
- optical image /
- mangrove /
- deep learning /
- attention mechanism
-
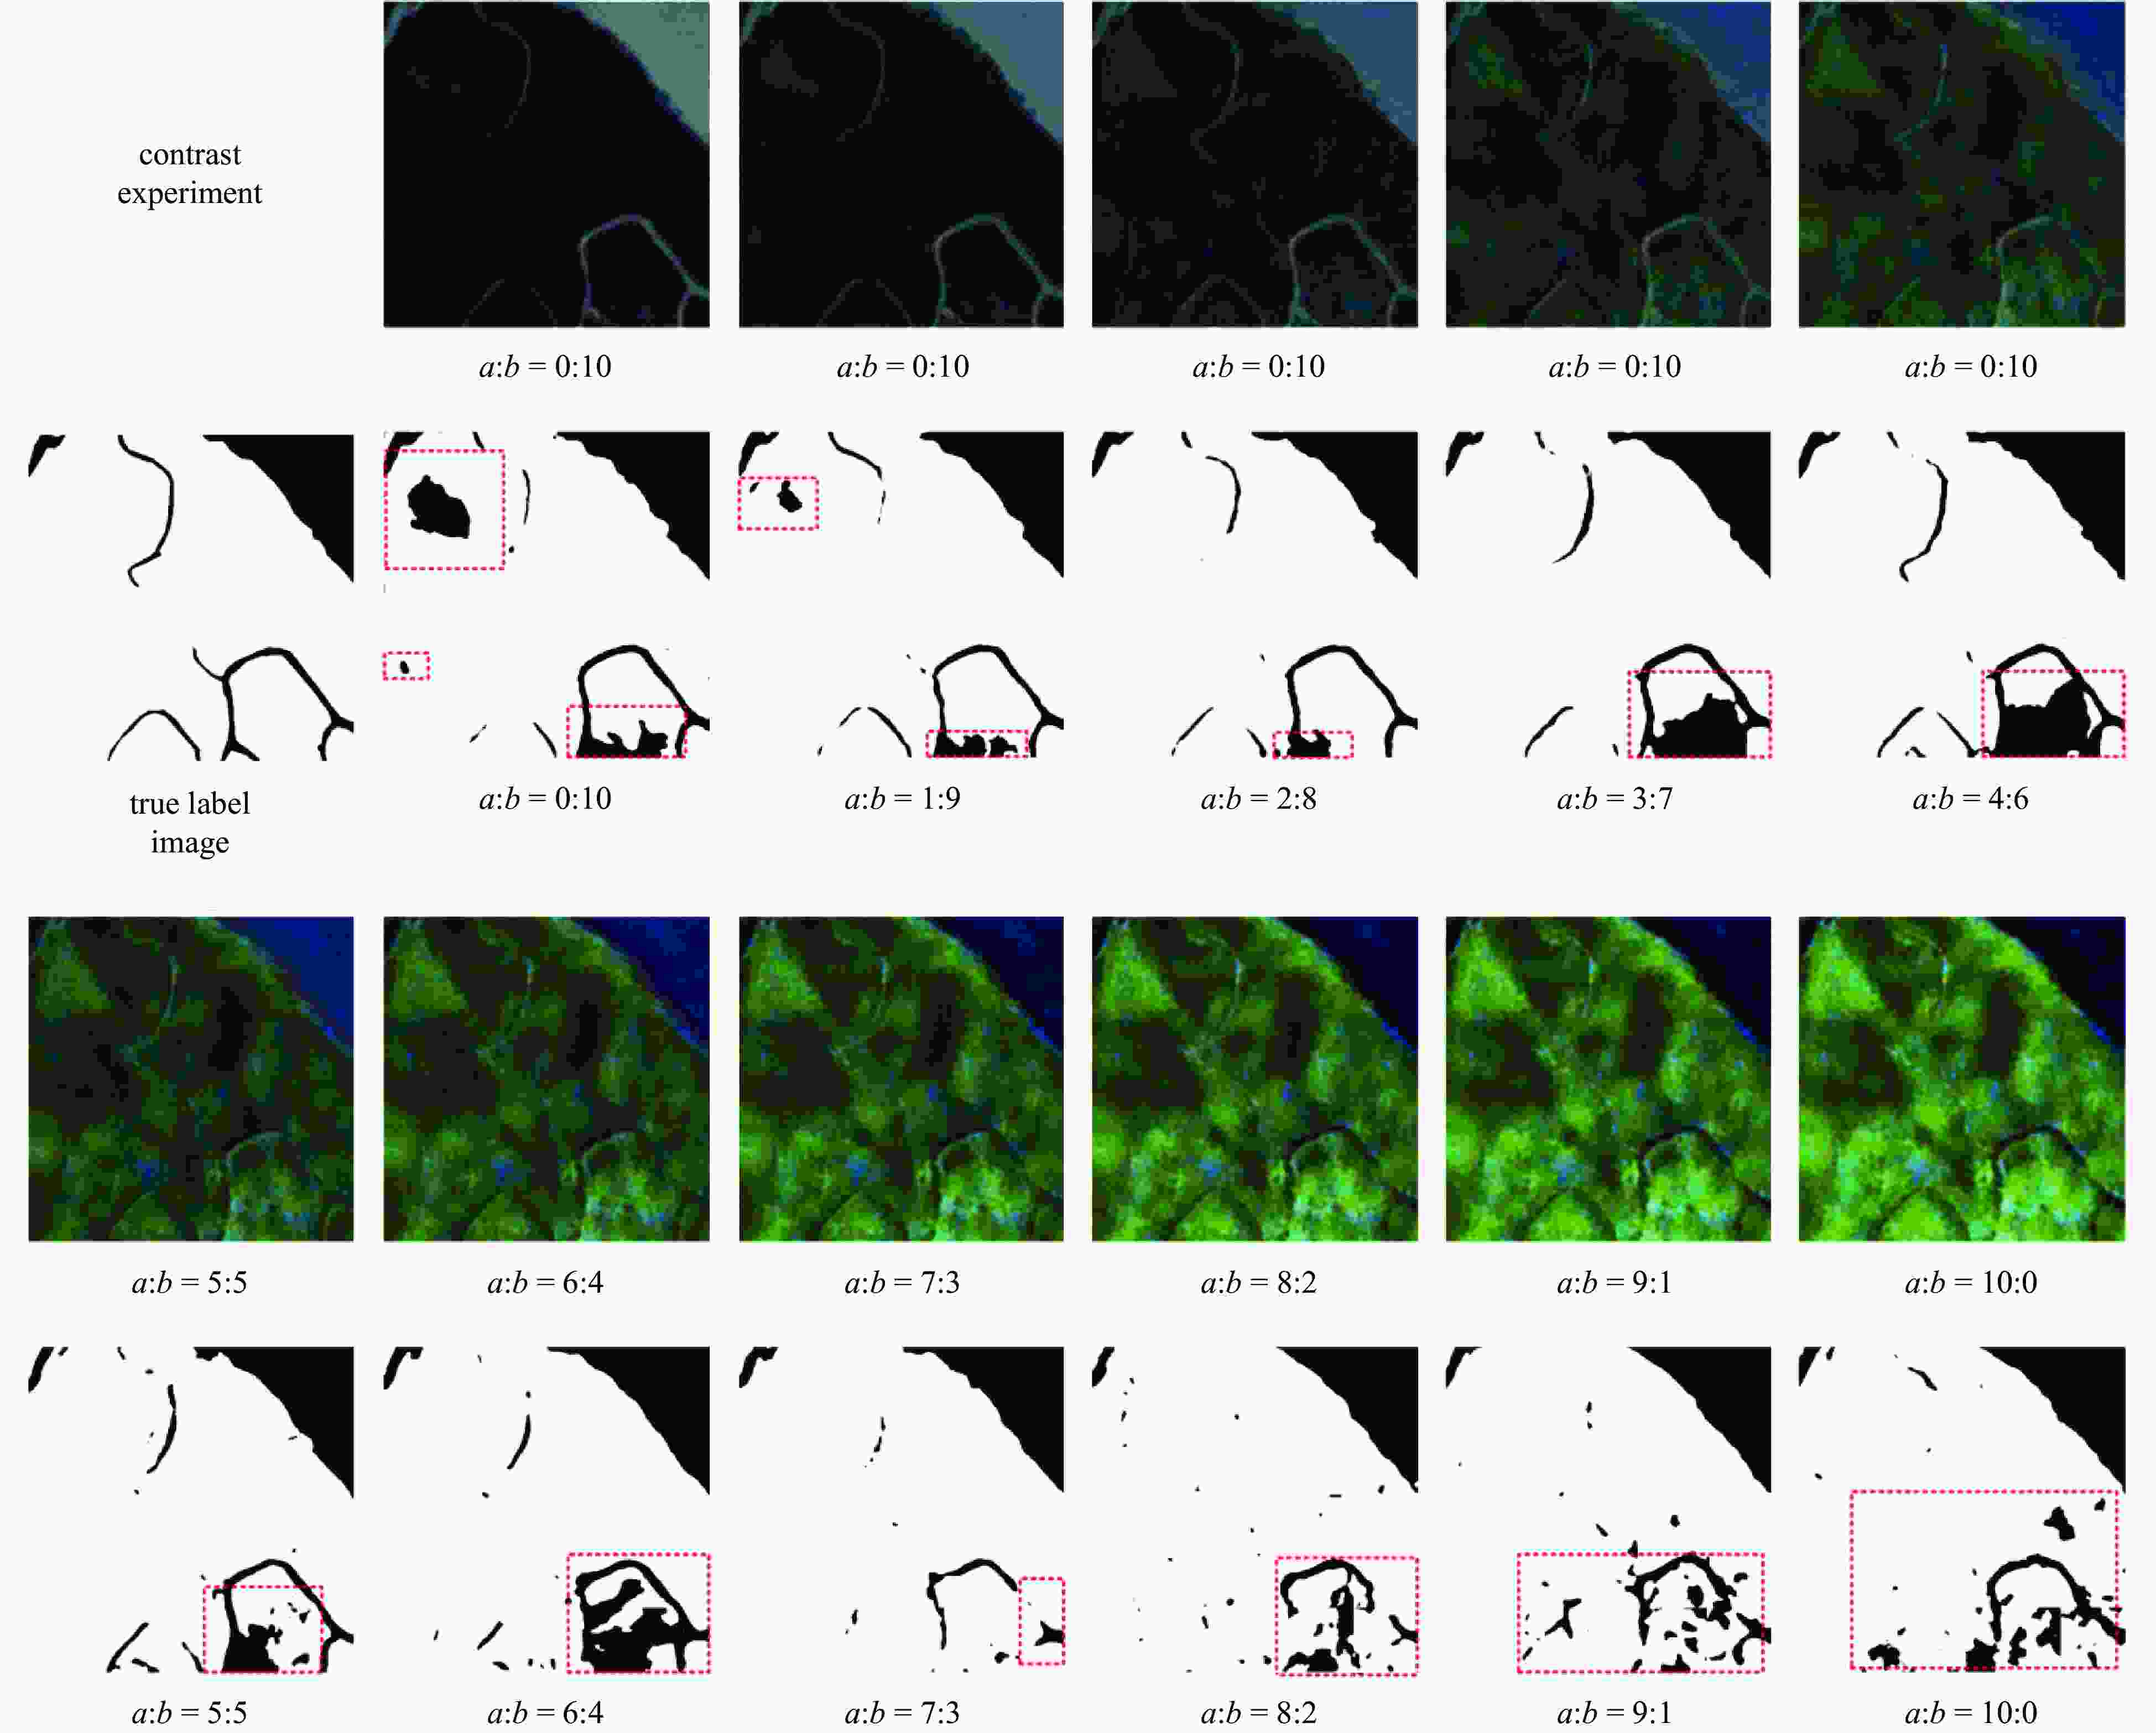
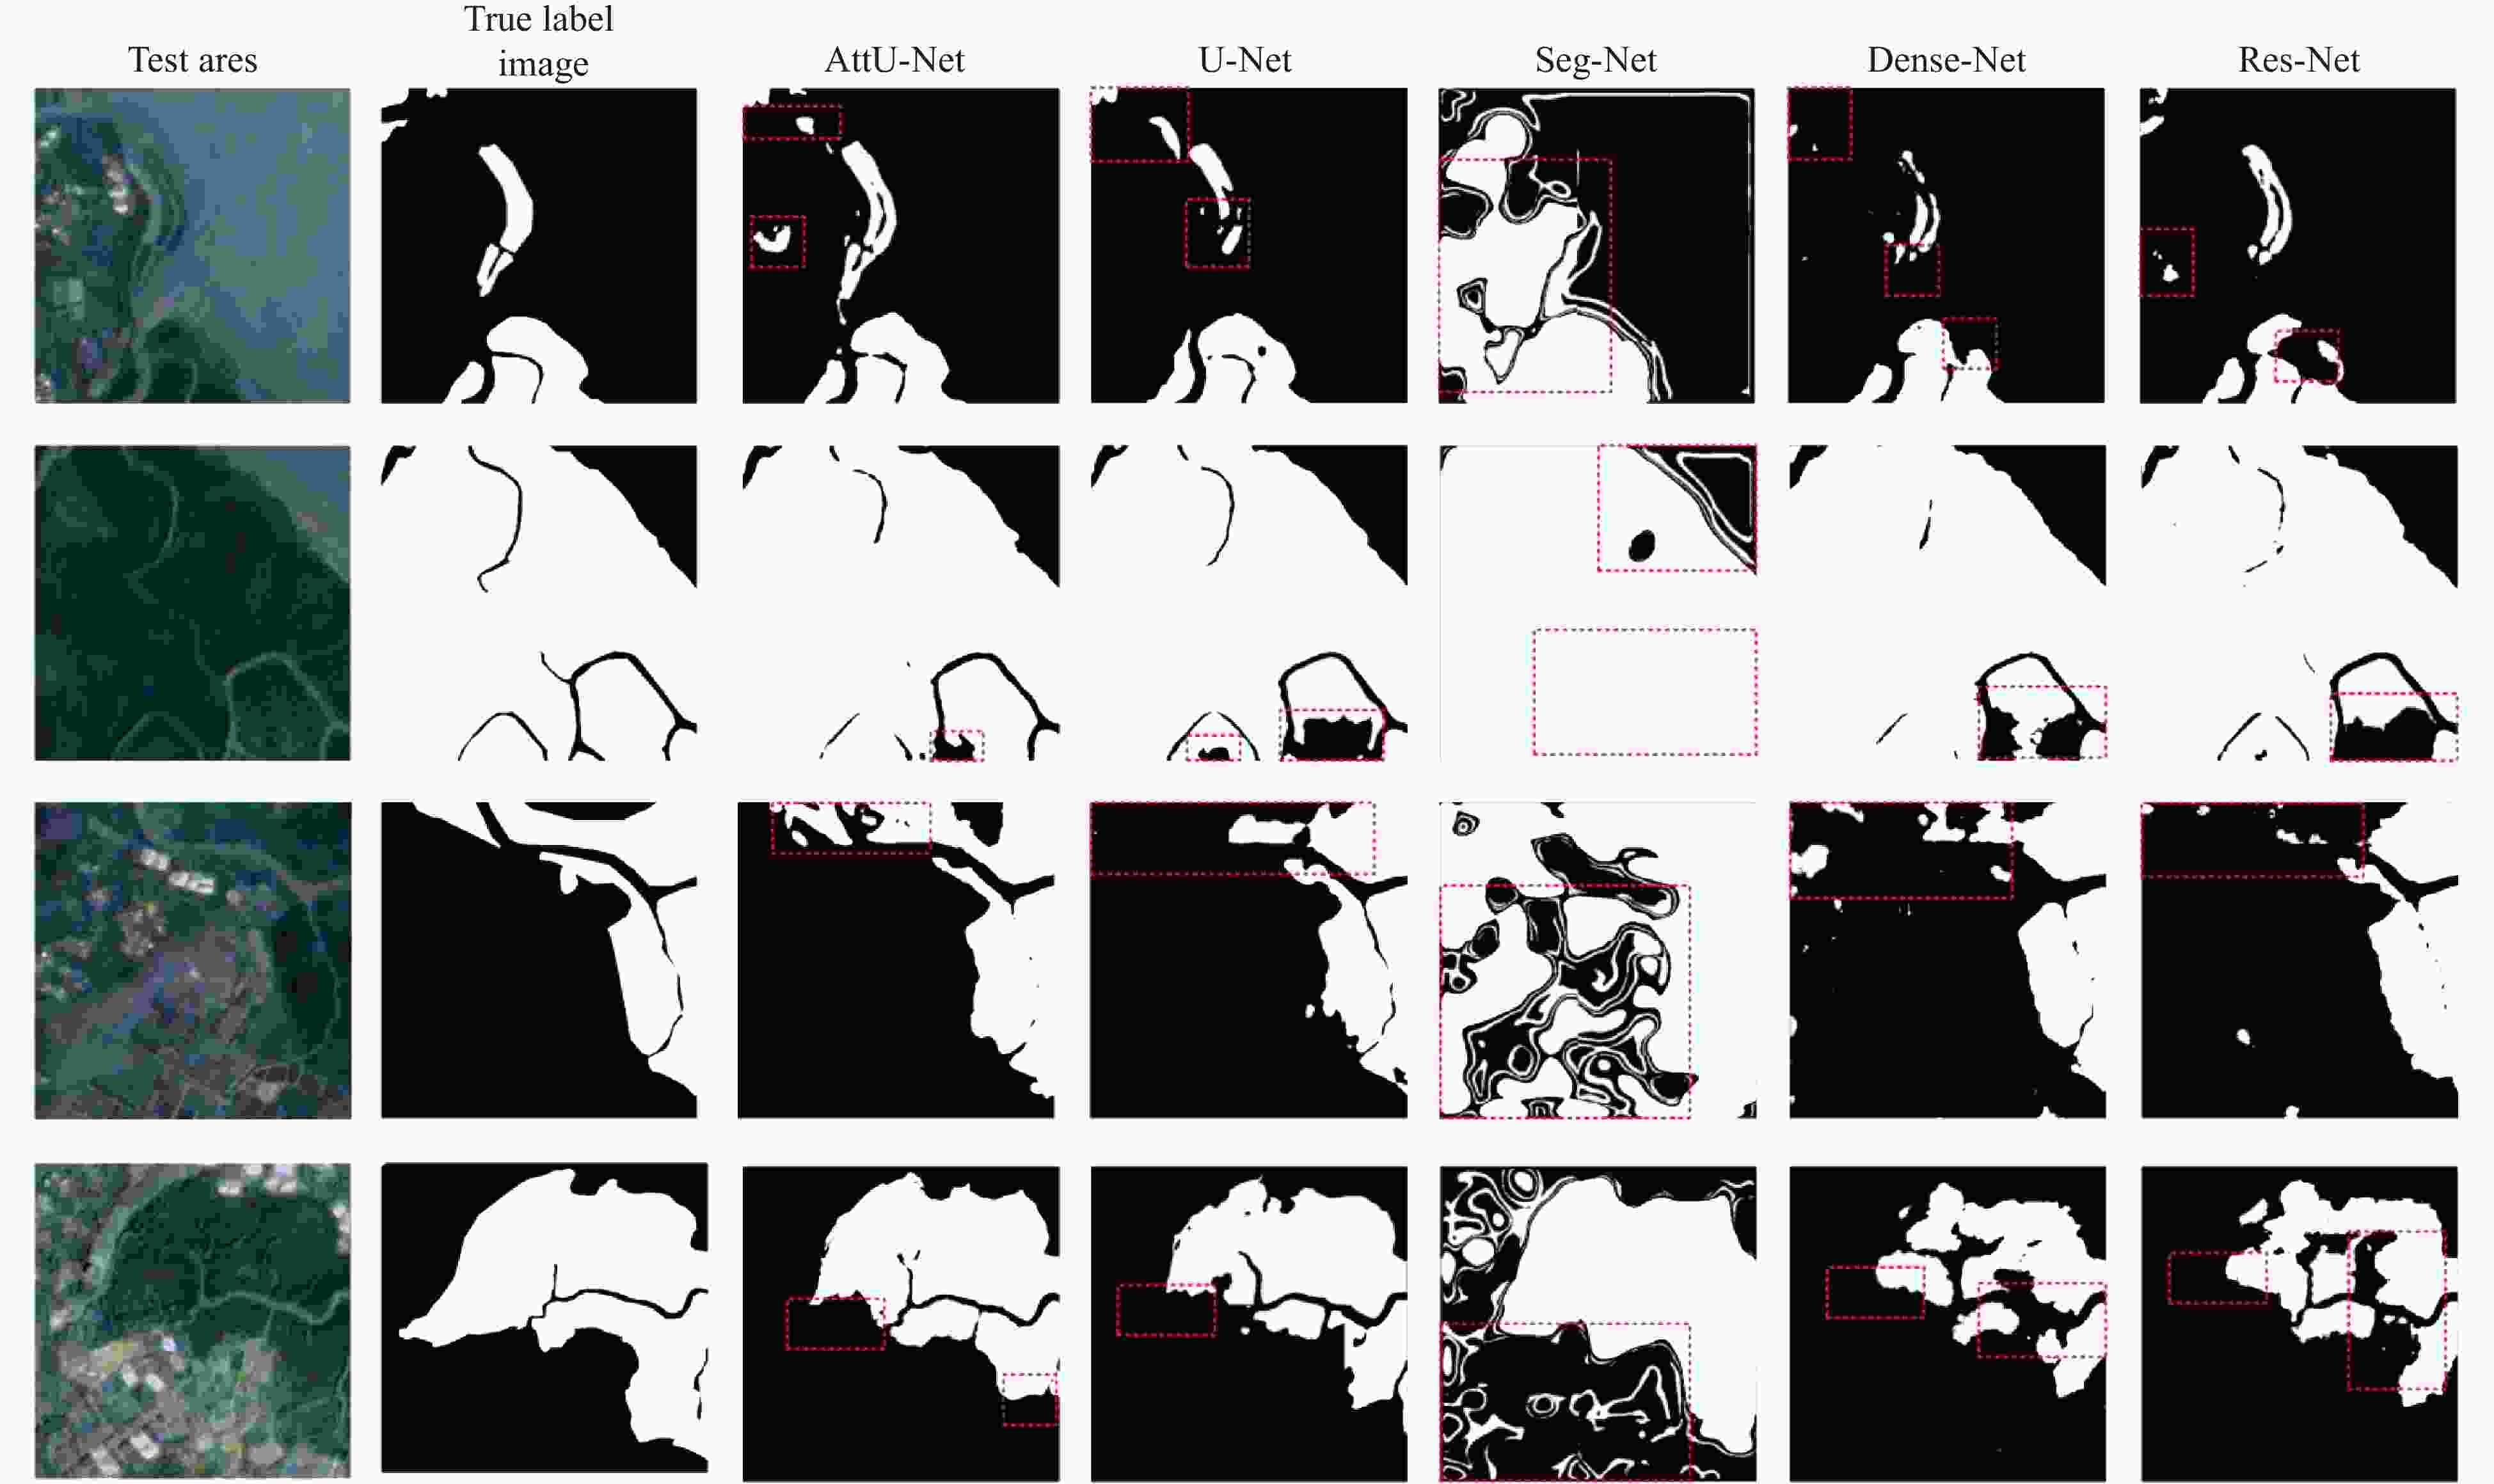
Figure 5. Experimental comparison diagram of a comparison experiment. The white area in the image represents the area considered by the model as mangrove vegetation. The black area represents the area where the model considers non-mangrove vegetation. The red dashed box indicates the area with obvious recognition error.
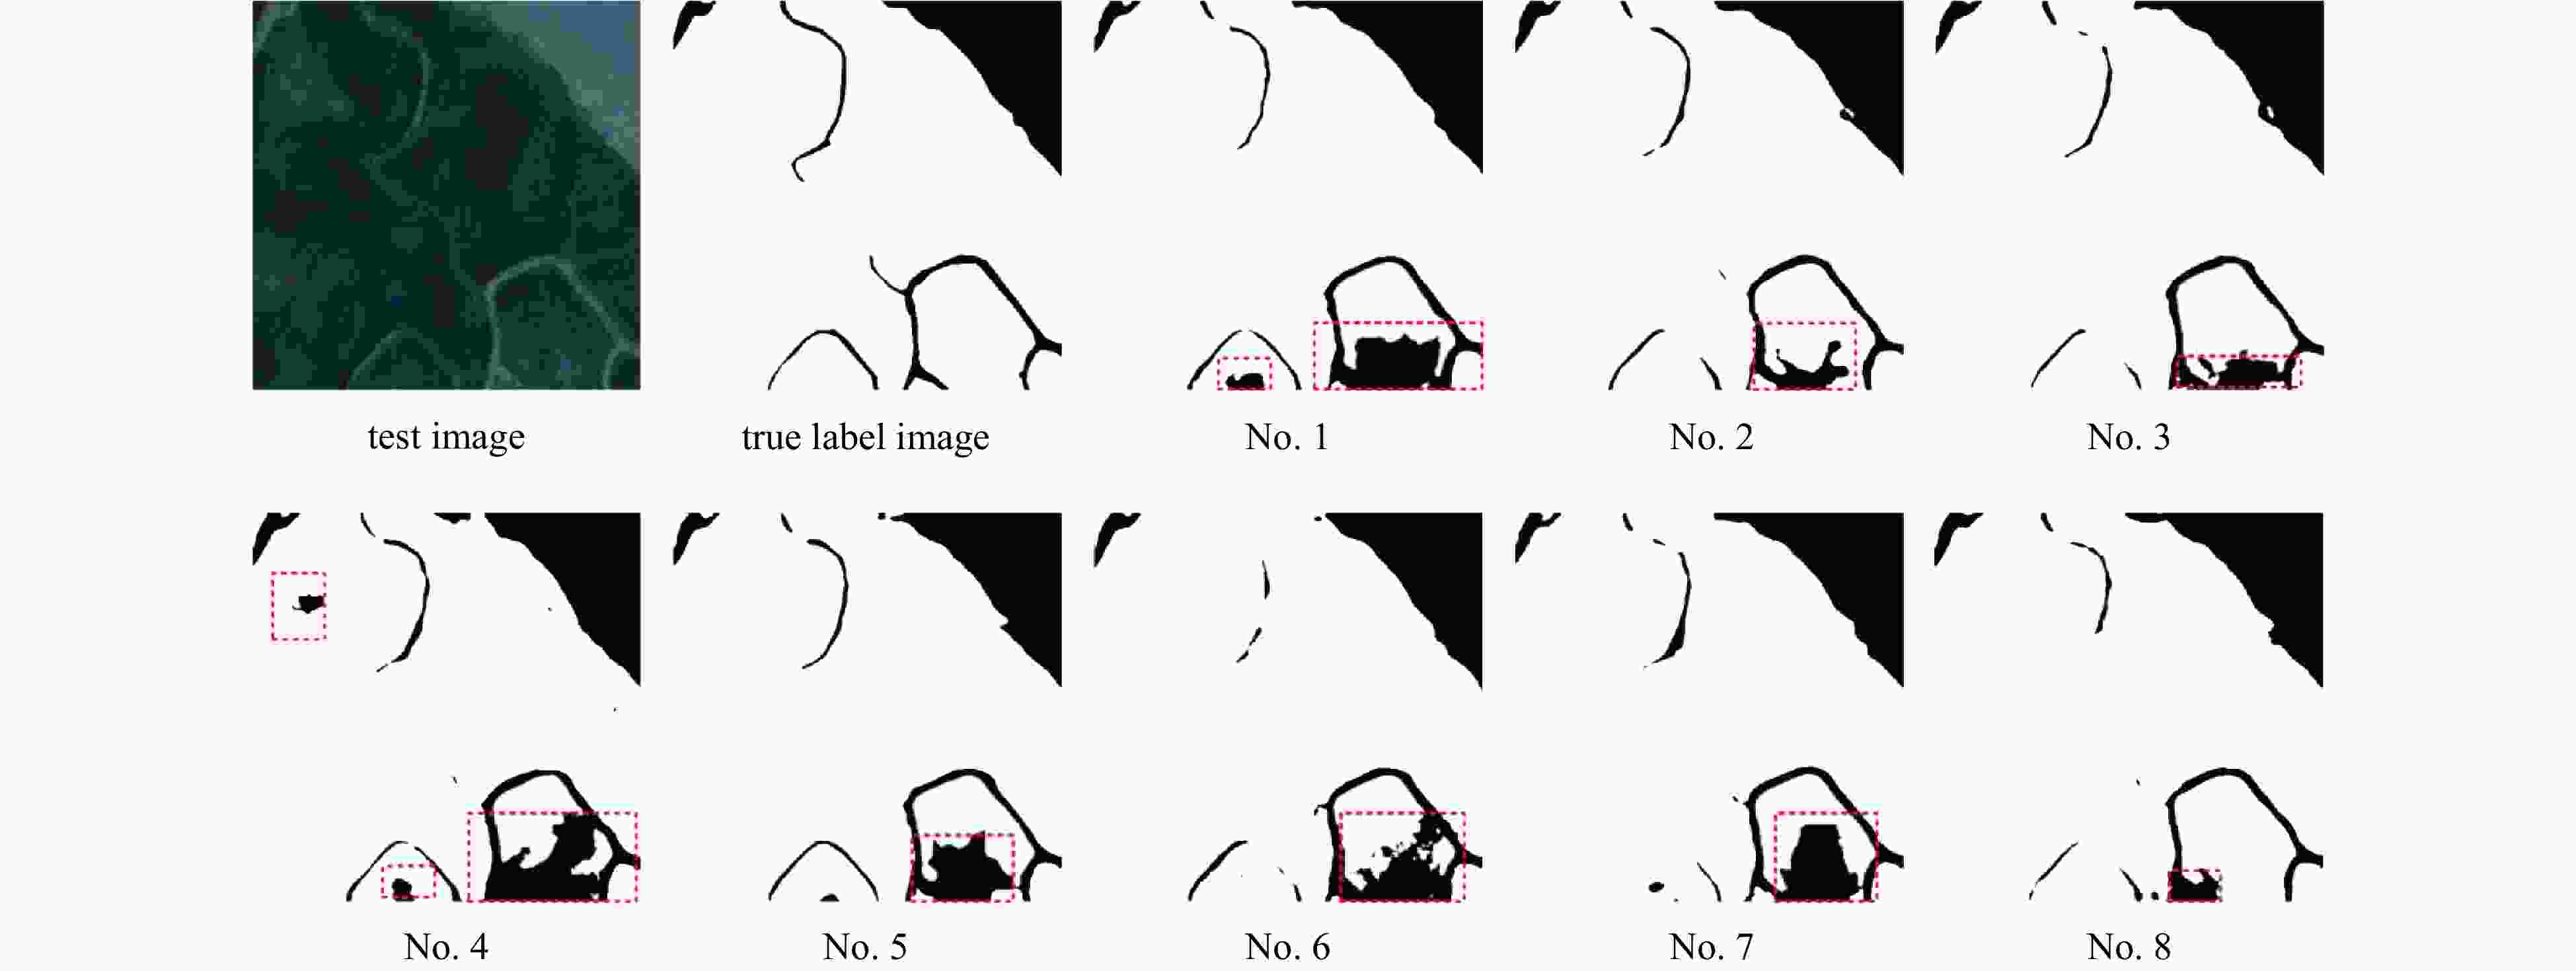
Figure 6. Comparison of predicted results of ablation experiments. The white area in the image represents the area considered by the model as mangrove vegetation. The black area represents the area where the model considers non-mangrove vegetation. The red dashed box indicates the area with obvious recognition error.
Figure 8. Comparison of prediction results of mangrove vegetation in the test area. The white area in the image represents the area considered by the model as mangrove vegetation. The black area represents the area where the model considers non-mangrove vegetation. The red dashed box indicates the area with obvious recognition error.
Table 1. Full polarization imaging mode and capability of Gaofen-3 SAR image
Serial
numberWorking mode Angle of
incidence/(°)Visual number
A × EResolution/m Imaging bandwidth/km Polarization
modeWave
positionNominal Azimuth
directionDistance
directionNominal Scope 1 fully polarized band 1 20–41 1 × 1 8 8 6−9 30 20–35 full polarization Q1–Q28 2 fully polarized band 2 20–38 3 × 2 25 25 15–30 40 35–50 full polarization WQ1–WQ16 3 wave pattern 20–41 1 × 2 10 10 8–12 5 × 5 5 × 5 full polarization Q1–Q28 Table 2. Satellite payload of Gaofen-6
Camera type Band number Spectrum/μm Substellar point pixel resolution Covering width Off-axis TMA total reflection type panchromatic band (P) 0.45–0.90 full color: better than 2 m >90 km Off-axis TMA total reflection type blue spectrum (B1) 0.45–0.52 multispectral: better than 8 m >90 km Off-axis TMA total reflection type green spectrum (B2) 0.52–0.60 multispectral: better than 8 m >90 km Off-axis TMA total reflection type red band (B3) 0.63–0.69 multispectral: better than 8 m >90 km Off-axis TMA total reflection type near-infrared spectrum (B4) 0.76–0.90 multispectral: better than 8 m >90 km Table 3. Layout of confusion matrix
Prediction type Real type Terrace Non-terraced field Terrace TP (true positive) FP (false positive) Non-terraced field FN (false negative) TN (true negative) Table 4. Precision evaluation results of comparison experiments based on fusion images
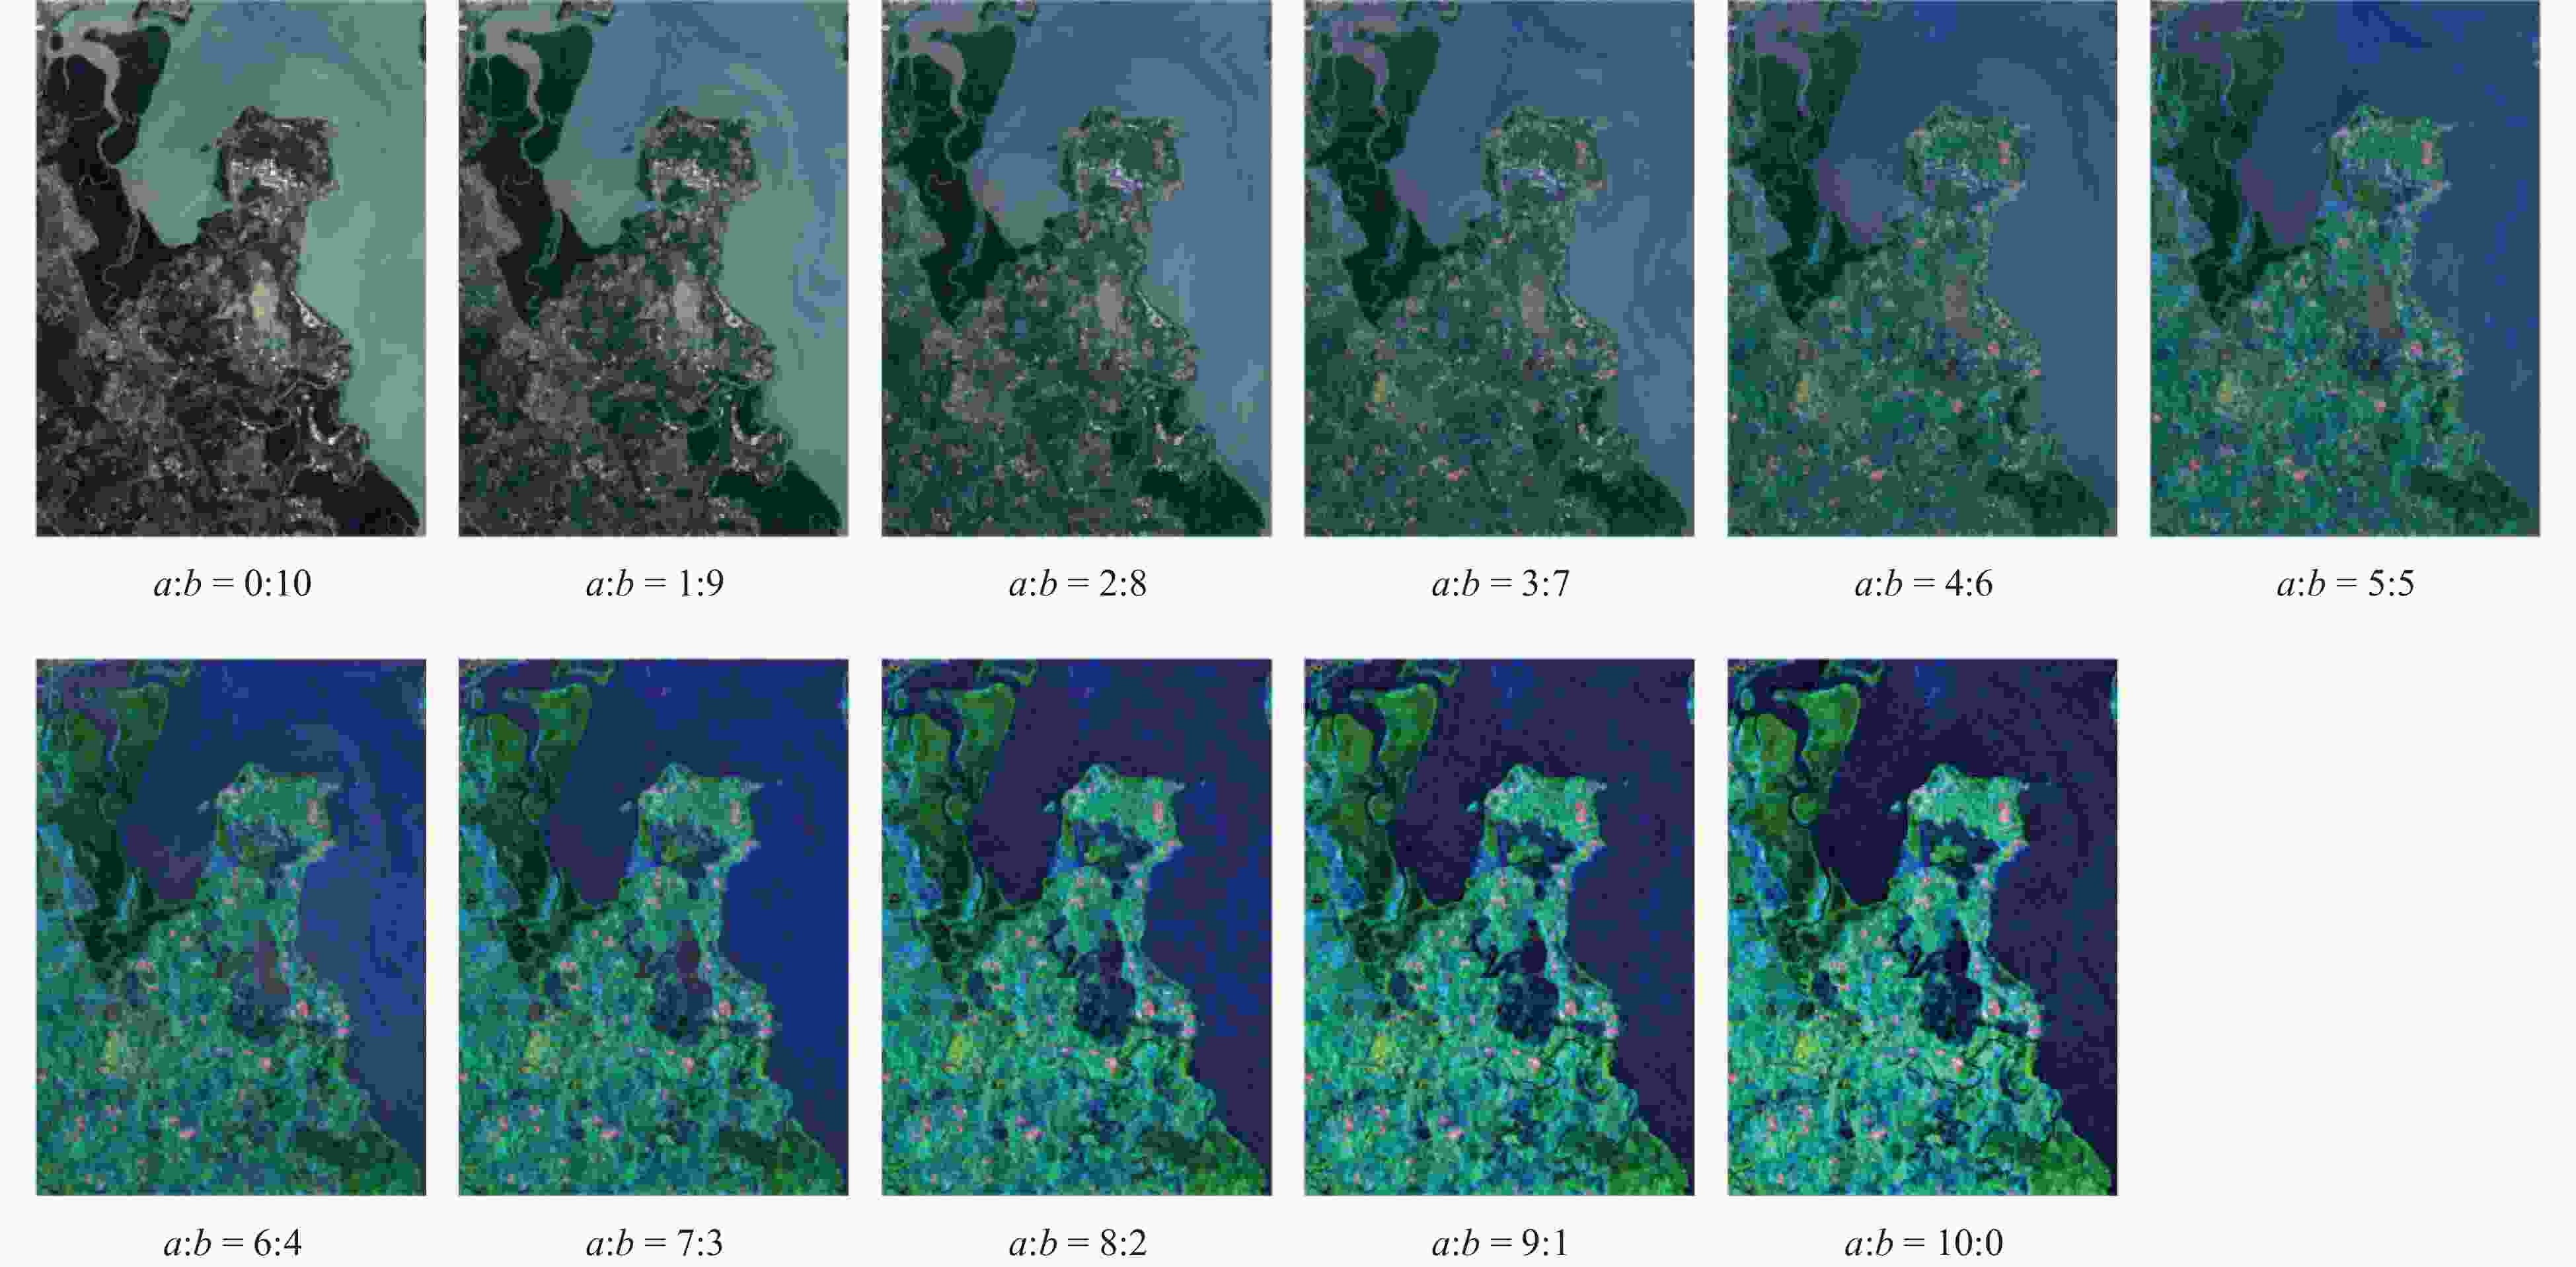
Contrast region (a:b) F1-score/% OA/% Kappa/% 0:10 96.696 94.347 77.192 1:9 98.282 97.016 86.968 2:8 98.567 97.506 88.959 3:7 96.688 94.350 77.542 4:6 96.067 93.349 74.674 5:5 97.643 95.936 82.919 6:4 96.039 93.257 73.462 7:3 98.067 96.598 83.897 8:2 96.969 94.721 76.504 9:1 96.438 93.835 73.547 10:0 95.635 92.481 68.569 Table 5. Accuracy evaluation results of ablation test area
No. Base SE-Net Drop. BN OA/% F1-score/% Kappa/% 1 √ 95.038 97.107 79.694 2 √ √ 96.948 98.239 86.797 3 √ √ 96.697 98.092 85.814 4 √ √ 93.804 96.352 75.891 5 √ √ √ 95.755 97.529 82.494 6 √ √ √ 94.962 97.073 79.015 7 √ √ √ 95.203 97.206 80.302 8 √ √ √ √ 97.507 98.568 88.959 Note: √ in the table proves that the module is added to the model; if √ is not marked, it proves that the module is not added to the model. Bold font denotes the highest value in this accuracy evaluation metric. Table 6. Training parameter settings
Parameter Specific setting Batch size 16 Learning rate 1 × 10⁻⁴ Epoch 65 Optimizer Adam Table 7. Accuracy evaluation results of test area
Test area Model Accuracy evaluation OA/% F1-Score/% Kappa/% Test area 1 AttU-Net (ours) 97.082 88.008 86.348 U-Net 95.870 81.583 79.268 Seg-Net 71.099 39.136 25.900 Dense-Net 95.056 75.064 72.445 Res-Net 94.974 75.102 72.410 Test area 2 AttU-Net (ours) 97.506 98.567 88.959 U-Net 95.038 97.107 79.694 Seg-Net 92.363 95.753 58.229 Dense-Net 94.571 96.835 80.925 Res-Net 94.083 96.524 76.728 Test area 3 AttU-Net (ours) 93.952 87.878 83.851 U-Net 93.553 86.171 82.009 Seg-Net 51.064 50.002 19.944 Dense-Net 91.625 82.041 76.633 Res-Net 92.383 83.158 78.328 Test area 4 AttU-Net (ours) 89.083 85.572 77.021 U-Net 85.762 80.093 69.644 Seg-Net 83.485 82.329 67.046 Dense-Net 78.289 65.889 52.542 Res-Net 80.267 69.966 57.147 Note: Bold font denates xxx.. -
Braun A C. 2021. More accurate less meaningful? A critical physical geographer’s reflection on interpreting remote sensing land-use analyses. Progress in Physical Geography: Earth and Environment, 45(5): 706–735, doi: 10.1177/0309133321991814 Cao Jingjing, Leng Wanchun, Liu Kai, et al. 2018. Object-based mangrove species classification using unmanned aerial vehicle hyperspectral images and digital surface models. Remote Sensing, 10(1): 89, doi: 10.3390/rs10010089 Chen Zhaojun, Zhang Meng, Zhang Huaiqing, et al. 2023. Mapping mangrove using a red-edge mangrove index (REMI) based on Sentinel-2 multispectral images. IEEE Transactions on Geoscience and Remote Sensing, 61: 4409511 Darko P O, Kalacska M, Arroyo-Mora J P, et al. 2021. Spectral complexity of hyperspectral images: A new approach for mangrove classification. Remote Sensing, 13(13): 2604, doi: 10.3390/rs13132604 de Souza Moreno G M, de Carvalho Júnior O A, de Carvalho O L F, et al. 2023. Deep semantic segmentation of mangroves in Brazil combining spatial, temporal, and polarization data from Sentinel-1 time series. Ocean & Coastal Management, 231: 106381 Fu Bolin, Liang Yiyin, Lao Zhinan, et al. 2023. Quantifying scattering characteristics of mangrove species from Optuna-based optimal machine learning classification using multi-scale feature selection and SAR image time series. International Journal of Applied Earth Observation and Geoinformation, 122: 103446, doi: 10.1016/j.jag.2023.103446 Fu Chang, Song Xiqiang, Xie Yu, et al. 2022. Research on the spatiotemporal evolution of mangrove forests in the Hainan Island from 1991 to 2021 based on SVM and Res-UNet Algorithms. Remote Sensing, 14(21): 5554, doi: 10.3390/rs14215554 Giri C. 2016. Observation and monitoring of mangrove forests using remote sensing: opportunities and challenges. Remote Sensing, 8(9): 783, doi: 10.3390/rs8090783 Gonzalez-Perez A, Abd-Elrahman A, Wilkinson B, et al. 2022. Deep and machine learning image classification of coastal wetlands using unpiloted aircraft system multispectral images and Lidar datasets. Remote Sensing, 14(16): 3937, doi: 10.3390/rs14163937 Huang Sha, Tang Lina, Hupy J P, et al. 2021. A commentary review on the use of normalized difference vegetation index (NDVI) in the era of popular remote sensing. Journal of Forestry Research, 32(1): 1–6, doi: 10.1007/s11676-020-01155-1 Jia Mingming, Wang Zongming, Wang Chao, et al. 2019. A new vegetation index to detect periodically submerged mangrove forest using single-tide Sentinel-2 imagery. Remote Sensing, 11(17): 2043, doi: 10.3390/rs11172043 Kamal M, Phinn S, Johansen K. 2014. Characterizing the spatial structure of mangrove features for optimizing image-based mangrove mapping. Remote Sensing, 6(2): 984–1006, doi: 10.3390/rs6020984 Kulkarni S C, Rege P P. 2020. Pixel level fusion techniques for SAR and optical images: a review. Information Fusion, 59: 13–29, doi: 10.1016/j.inffus.2020.01.003 Li Jinjin, Zhang Jiacheng, Yang Chao, et al. 2023. Comparative analysis of pixel-level fusion algorithms and a new high-resolution dataset for SAR and optical image fusion. Remote Sensing, 15(23): 5514, doi: 10.3390/rs15235514 Lu Ying, Wang Le. 2021. How to automate timely large-scale mangrove mapping with remote sensing. Remote Sensing of Environment, 264: 112584, doi: 10.1016/j.rse.2021.112584 Luo Yanmin, Ouyang Yi, Zhang Rencheng, et al. 2017. Multi-feature joint sparse model for the classification of mangrove remote sensing images. ISPRS International Journal of Geo-Information, 6(6): 177, doi: 10.3390/ijgi6060177 Mahmoud M I. 2012. Information extraction from paper maps using object oriented analysis (OOA) [dissertation]. Enschede: University of Twente Maurya K, Mahajan S, Chaube N. 2021. Remote sensing techniques: mapping and monitoring of mangrove ecosystem—A review. Complex & Intelligent Systems, 7(6): 2797–2818 Purnamasayangsukasih P R, Norizah K, Ismail A A M, et al. 2016. A review of uses of satellite imagery in monitoring mangrove forests. IOP Conference Series: Earth and Environmental Science, 37: 012034, doi: 10.1088/1755-1315/37/1/012034 Raghavendra N S, Deka P C. 2014. Support vector machine applications in the field of hydrology: a review. Applied Soft Computing, 19: 372–386, doi: 10.1016/j.asoc.2014.02.002 Sandra M C, Rajitha K. 2023. Random forest and support vector machine classifiers for coastal wetland characterization using the combination of features derived from optical data and synthetic aperture radar dataset. Journal of Water & Climate Change, 15(1): 29–49 Shen Zhen, Miao Jing, Wang Junjie, et al. 2023. Evaluating feature selection methods and machine learning algorithms for mapping mangrove forests using optical and synthetic aperture radar data. Remote Sensing, 15(23): 5621, doi: 10.3390/rs15235621 Su Jiming, Zhang Fupeng, Yu Chuanxiu, et al. 2023. Machine learning: next promising trend for microplastics study. Journal of Environmental Management, 344: 118756, doi: 10.1016/j.jenvman.2023.118756 Tian Lei, Wu Xiaocan, Tao Yu, et al. 2023. Review of remote sensing-based methods for forest aboveground biomass estimation: progress, challenges, and prospects. Forests, 14(6): 1086, doi: 10.3390/f14061086 Toosi N B, Soffianian A R, Fakheran S, et al. 2019. Comparing different classification algorithms for monitoring mangrove cover changes in southern Iran. Global Ecology and Conservation, 19: e00662., doi: 10.1016/j.gecco.2019.e00662 Tran T V, Reef R, Zhu Xuan. 2022. A review of spectral indices for mangrove remote sensing. Remote Sensing, 14(19): 4868, doi: 10.3390/rs14194868 Twilley R R. 2019. Mangrove wetlands. In: Messina M G, Conner W H, eds. Southern Forested Wetlands. London: Routledge, 445–473 Wang Pin, Fan En, Wang Peng. 2021a. Comparative analysis of image classification algorithms based on traditional machine learning and deep learning. Pattern Recognition Letters, 141: 61–67, doi: 10.1016/j.patrec.2020.07.042 Wang Youshao, Gu Jidong. 2021b. Ecological responses, adaptation and mechanisms of mangrove wetland ecosystem to global climate change and anthropogenic activities. International Biodeterioration & Biodegradation, 162: 105248 Wei Yidi, Cheng Yongcun, Yin Xiaobin, et al. 2023. Deep learning-based classification of high-resolution satellite images for mangrove mapping. Applied Sciences, 13(14): 8526, doi: 10.3390/app13148526 Xie Yiheng, Chen Renxi, Yu Mingge, et al. 2023. Improvement and application of UNet network for avoiding the effect of urban dense high-rise buildings and other feature shadows on water body extraction. International Journal of Remote Sensing, 44(12): 3861–3891, doi: 10.1080/01431161.2023.2229498 Xu Chen, Wang Juanle, Sang Yu, et al. 2023a. An effective deep learning model for monitoring mangroves: a case study of the Indus delta. Remote Sensing, 15(9): 2220, doi: 10.3390/rs15092220 Xu Mengjie, Sun Chuanwang, Zhan Yanhong, et al. 2023b. Impact and prediction of pollutant on mangrove and carbon stocks: a machine learning study based on urban remote sensing data. Geoscience Frontiers, 15(3): 101665 Yang Gang, Huang Ke, Sun Weiwei, et al. 2022. Enhanced mangrove vegetation index based on hyperspectral images for mapping mangrove. ISPRS Journal of Photogrammetry and Remote Sensing, 189: 236–254, doi: 10.1016/j.isprsjprs.2022.05.003 Yu Mingge, Rui Xiaoping, Zou Yarong, et al. 2023. Research on automatic recognition of mangrove forests based on CU net model. Journal of Oceanography (in Chinese), 45(3): 125–135 Zhang Junyao, Yang Xiaomei, Wang Zhihua, et al. 2021. Remote sensing based spatial-temporal monitoring of the changes in coastline mangrove forests in China over the last 40 years. Remote Sensing, 13(10): 1986, doi: 10.3390/rs13101986 -


 下载:
下载:
