Accuracy assessment of global vertical displacement loading tide models for the equatorial and Indian Ocean
-
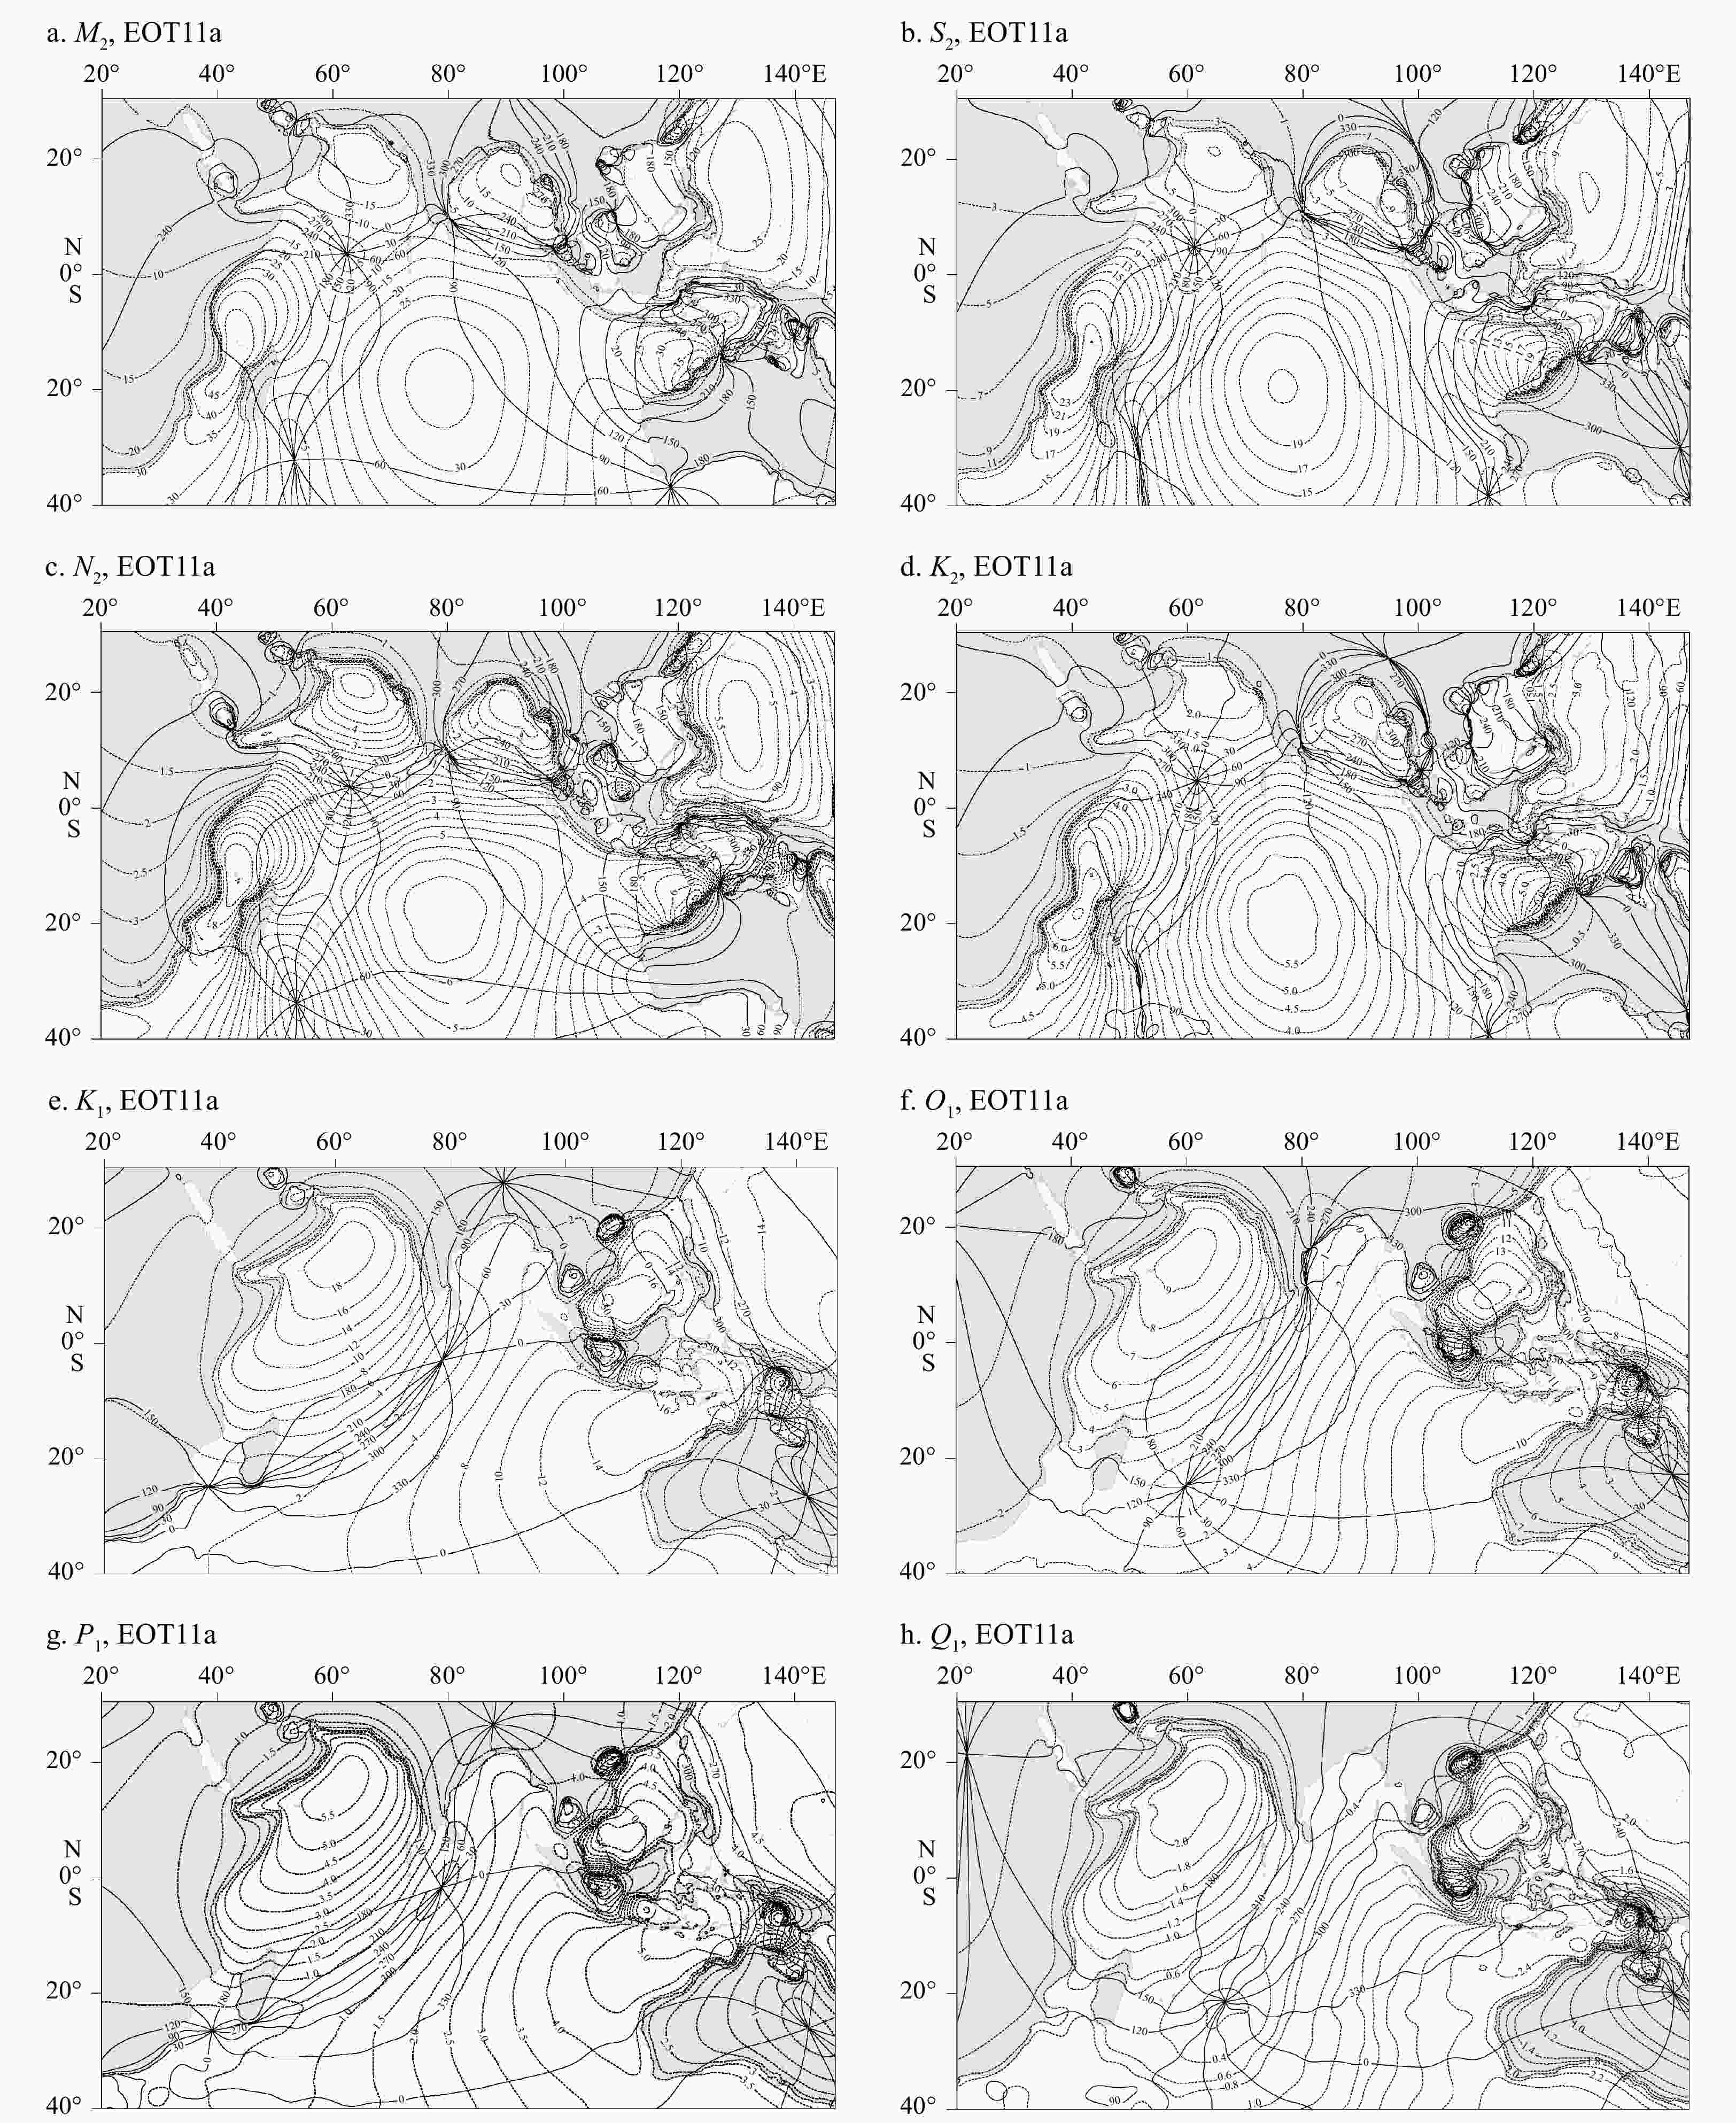
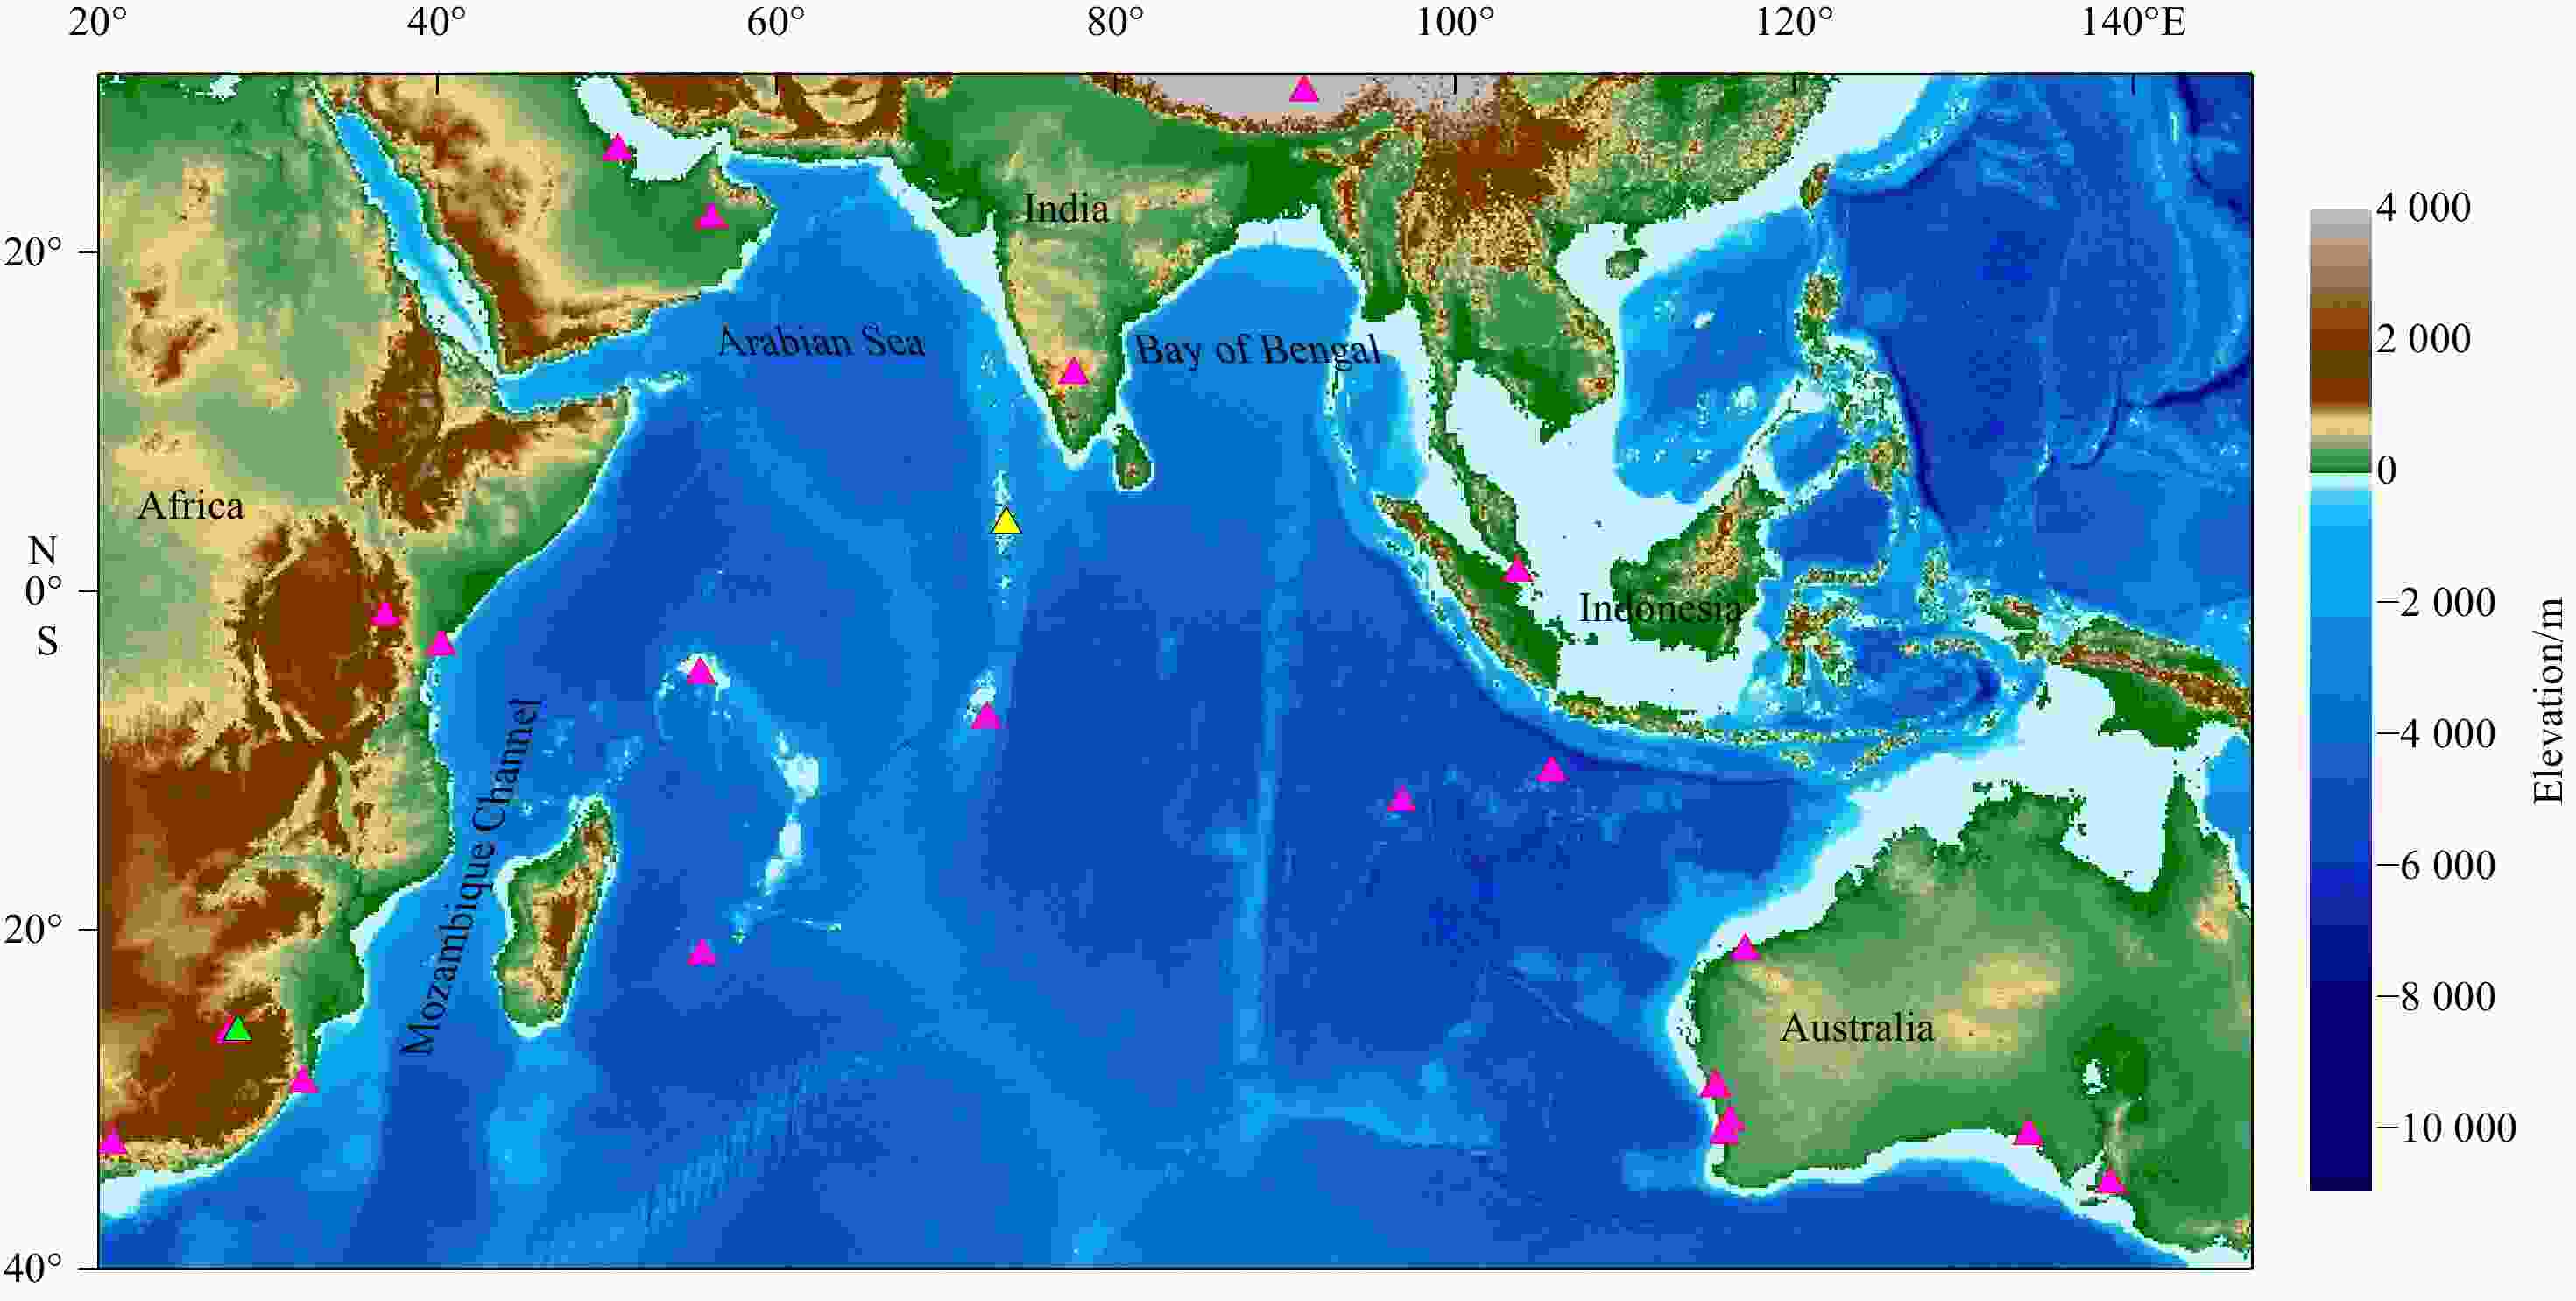
Abstract: The three-dimensional displacements caused by ocean loading effects are significant enough to impact spatial geodetic measurements on sub-daily or longer timescales, particularly in the vertical direction. Currently, most tide models incorporate the distribution of vertical displacement loading tides; however, their accuracy has not been assessed for the equatorial and Indian Ocean regions. Global Positioning System (GPS) observations provide high-precision data on sea-level changes, enabling the assessment of the accuracy and reliability of vertical displacement tide models. However, because the tidal period of the K2 constituent is almost identical to the orbital period of GPS constellations, the estimation of the K2 tidal constituent from GPS observations is not satisfactory. In this study, the principle of smoothness is employed to correct the systematic error in K2 estimates in GPS observations through quadratic fitting. Using the adjusted harmonic constants from 31 GPS stations for the equatorial and Indian Ocean, the accuracy of eight major constituents from five global vertical displacement tide models (FES2014, EOT11a, GOT4.10c, GOT4.8, and NAO.99b) is evaluated for the equatorial and Indian Ocean. The results indicate that the EOT11a and FES2014 models exhibit higher accuracy in the vertical displacement tide models for the equatorial and Indian Ocean, with root sum squares (RSS) errors of 2.29 mm and 2.34 mm, respectively. Furthermore, a brief analysis of the vertical displacement tide distribution characteristics of the eight major constituents for the equatorial and Indian Ocean was conducted using the EOT11a model.
-
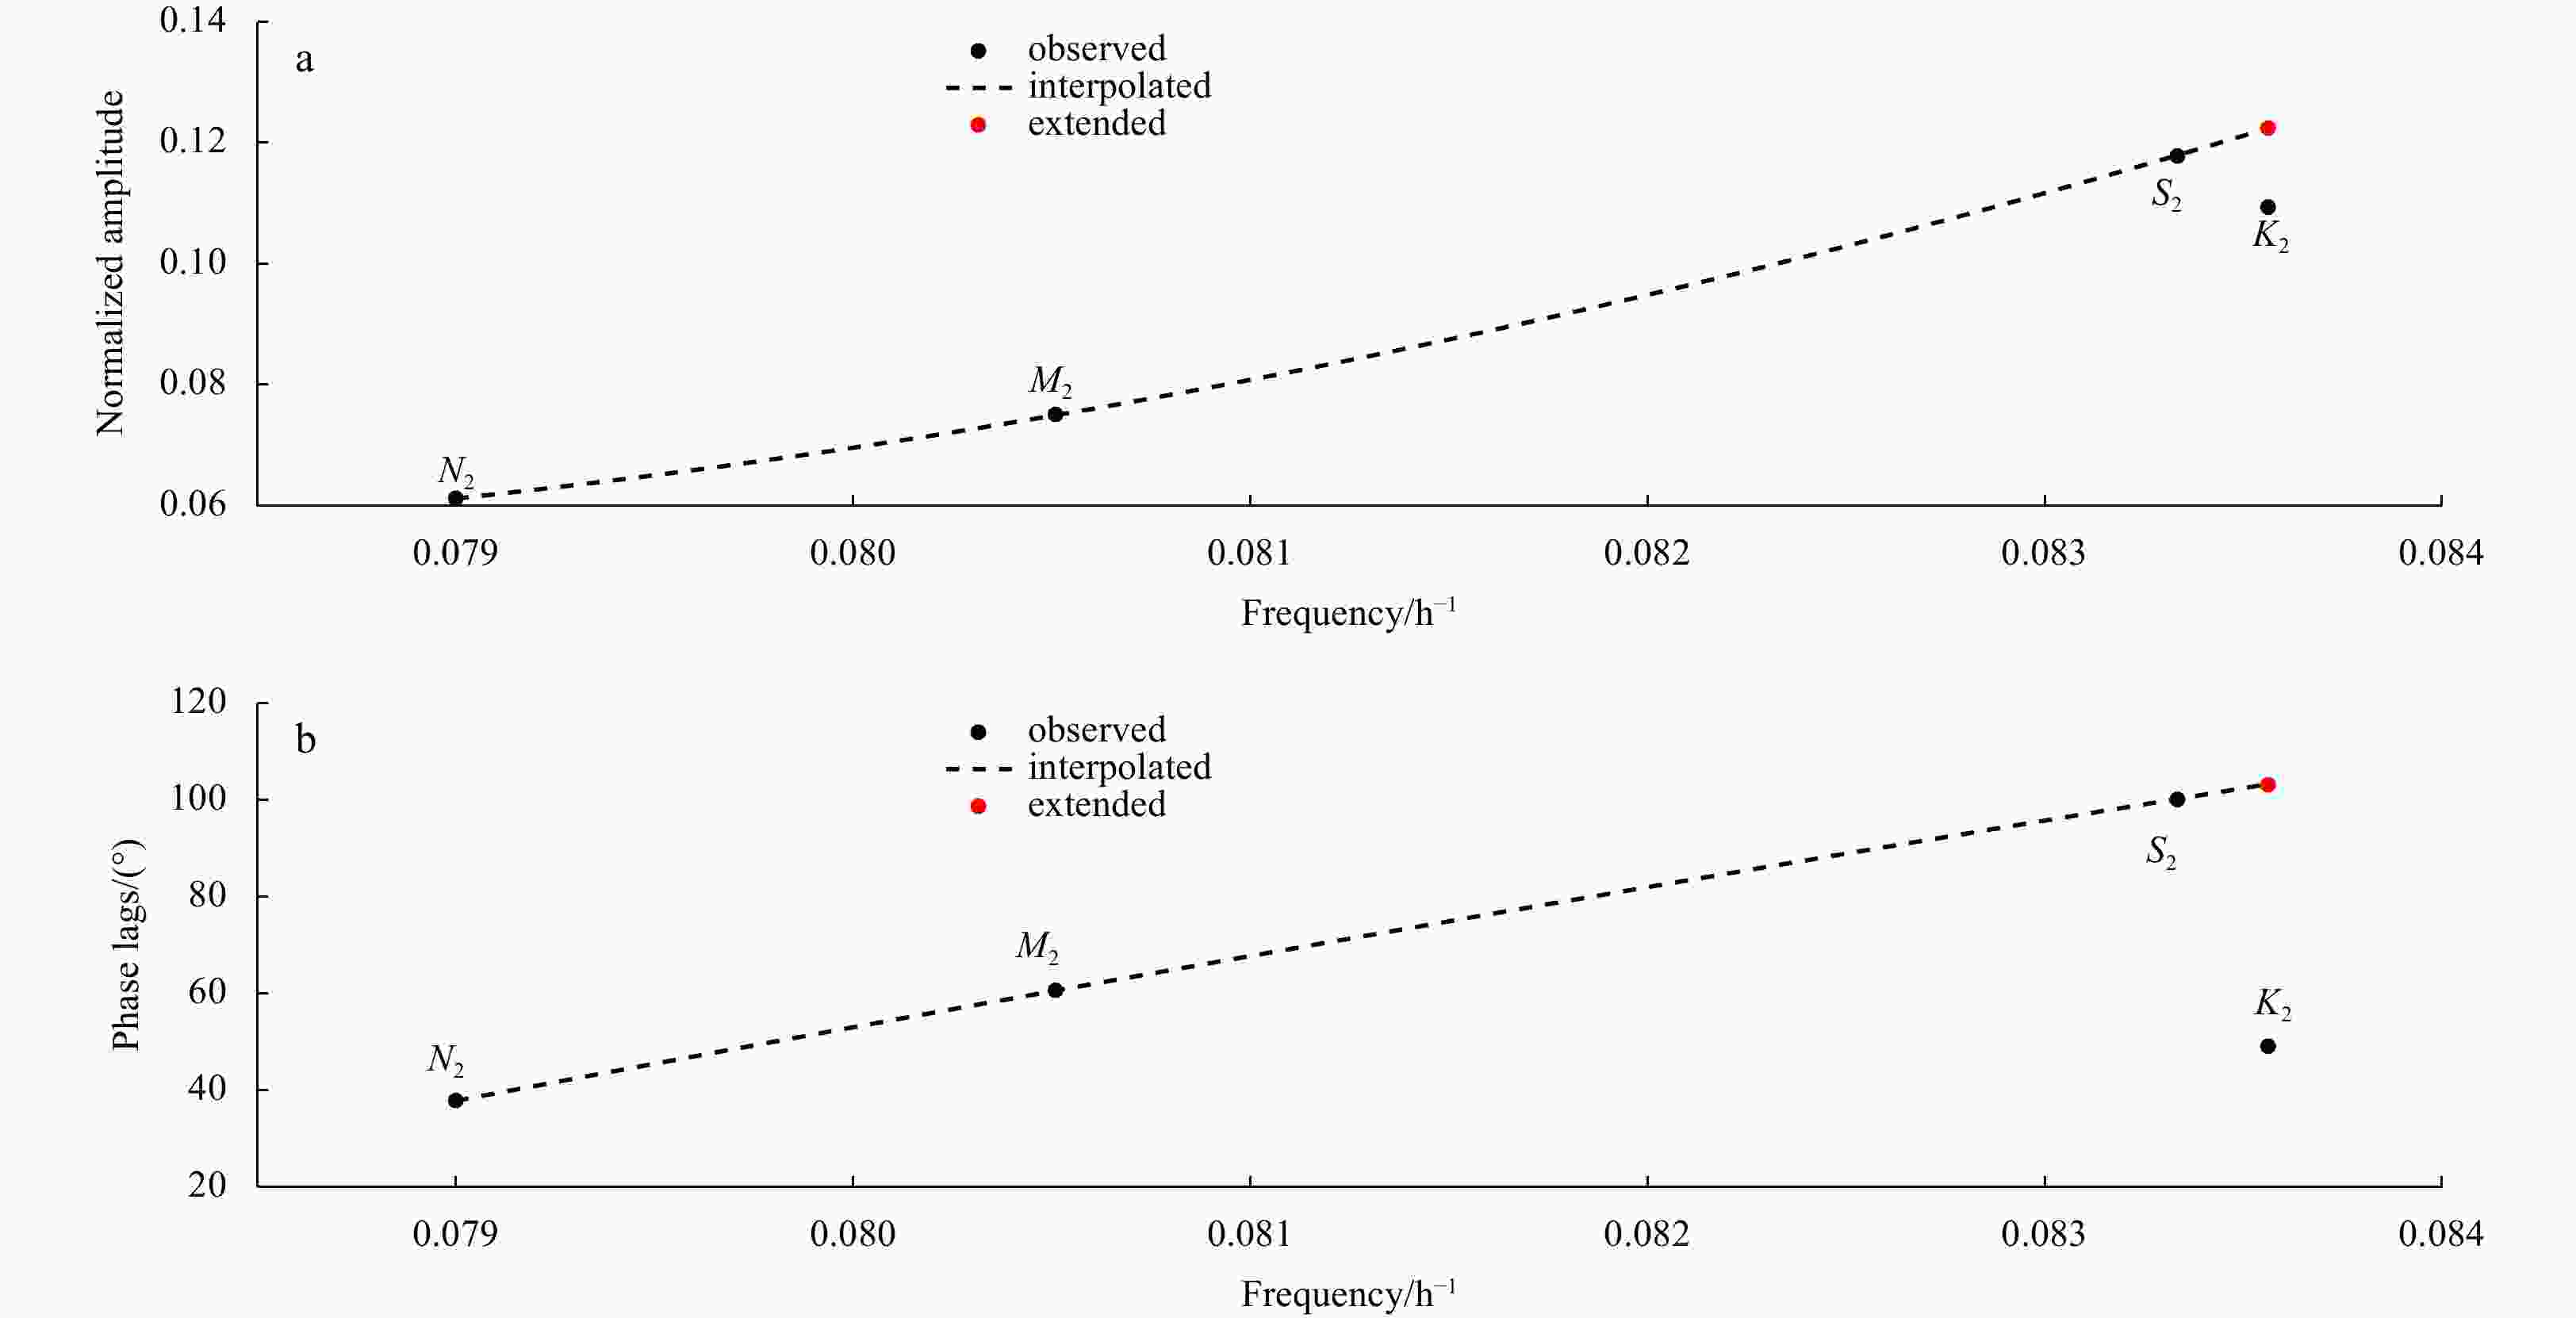
Figure 2. Tidal admittances of the semi-diurnal VDL tide at Mald station in the CM frame. a. The distribution between normalized amplitudes and the frequency of semi-diurnal constituents. b. The distribution between Phase lags and the frequency of semi-diurnal constituents. Black dots signify the observed tidal admittances while the dashed lines indicate the interpolated curves. Red dots denote the extended K2 values based on the interpolated curves.
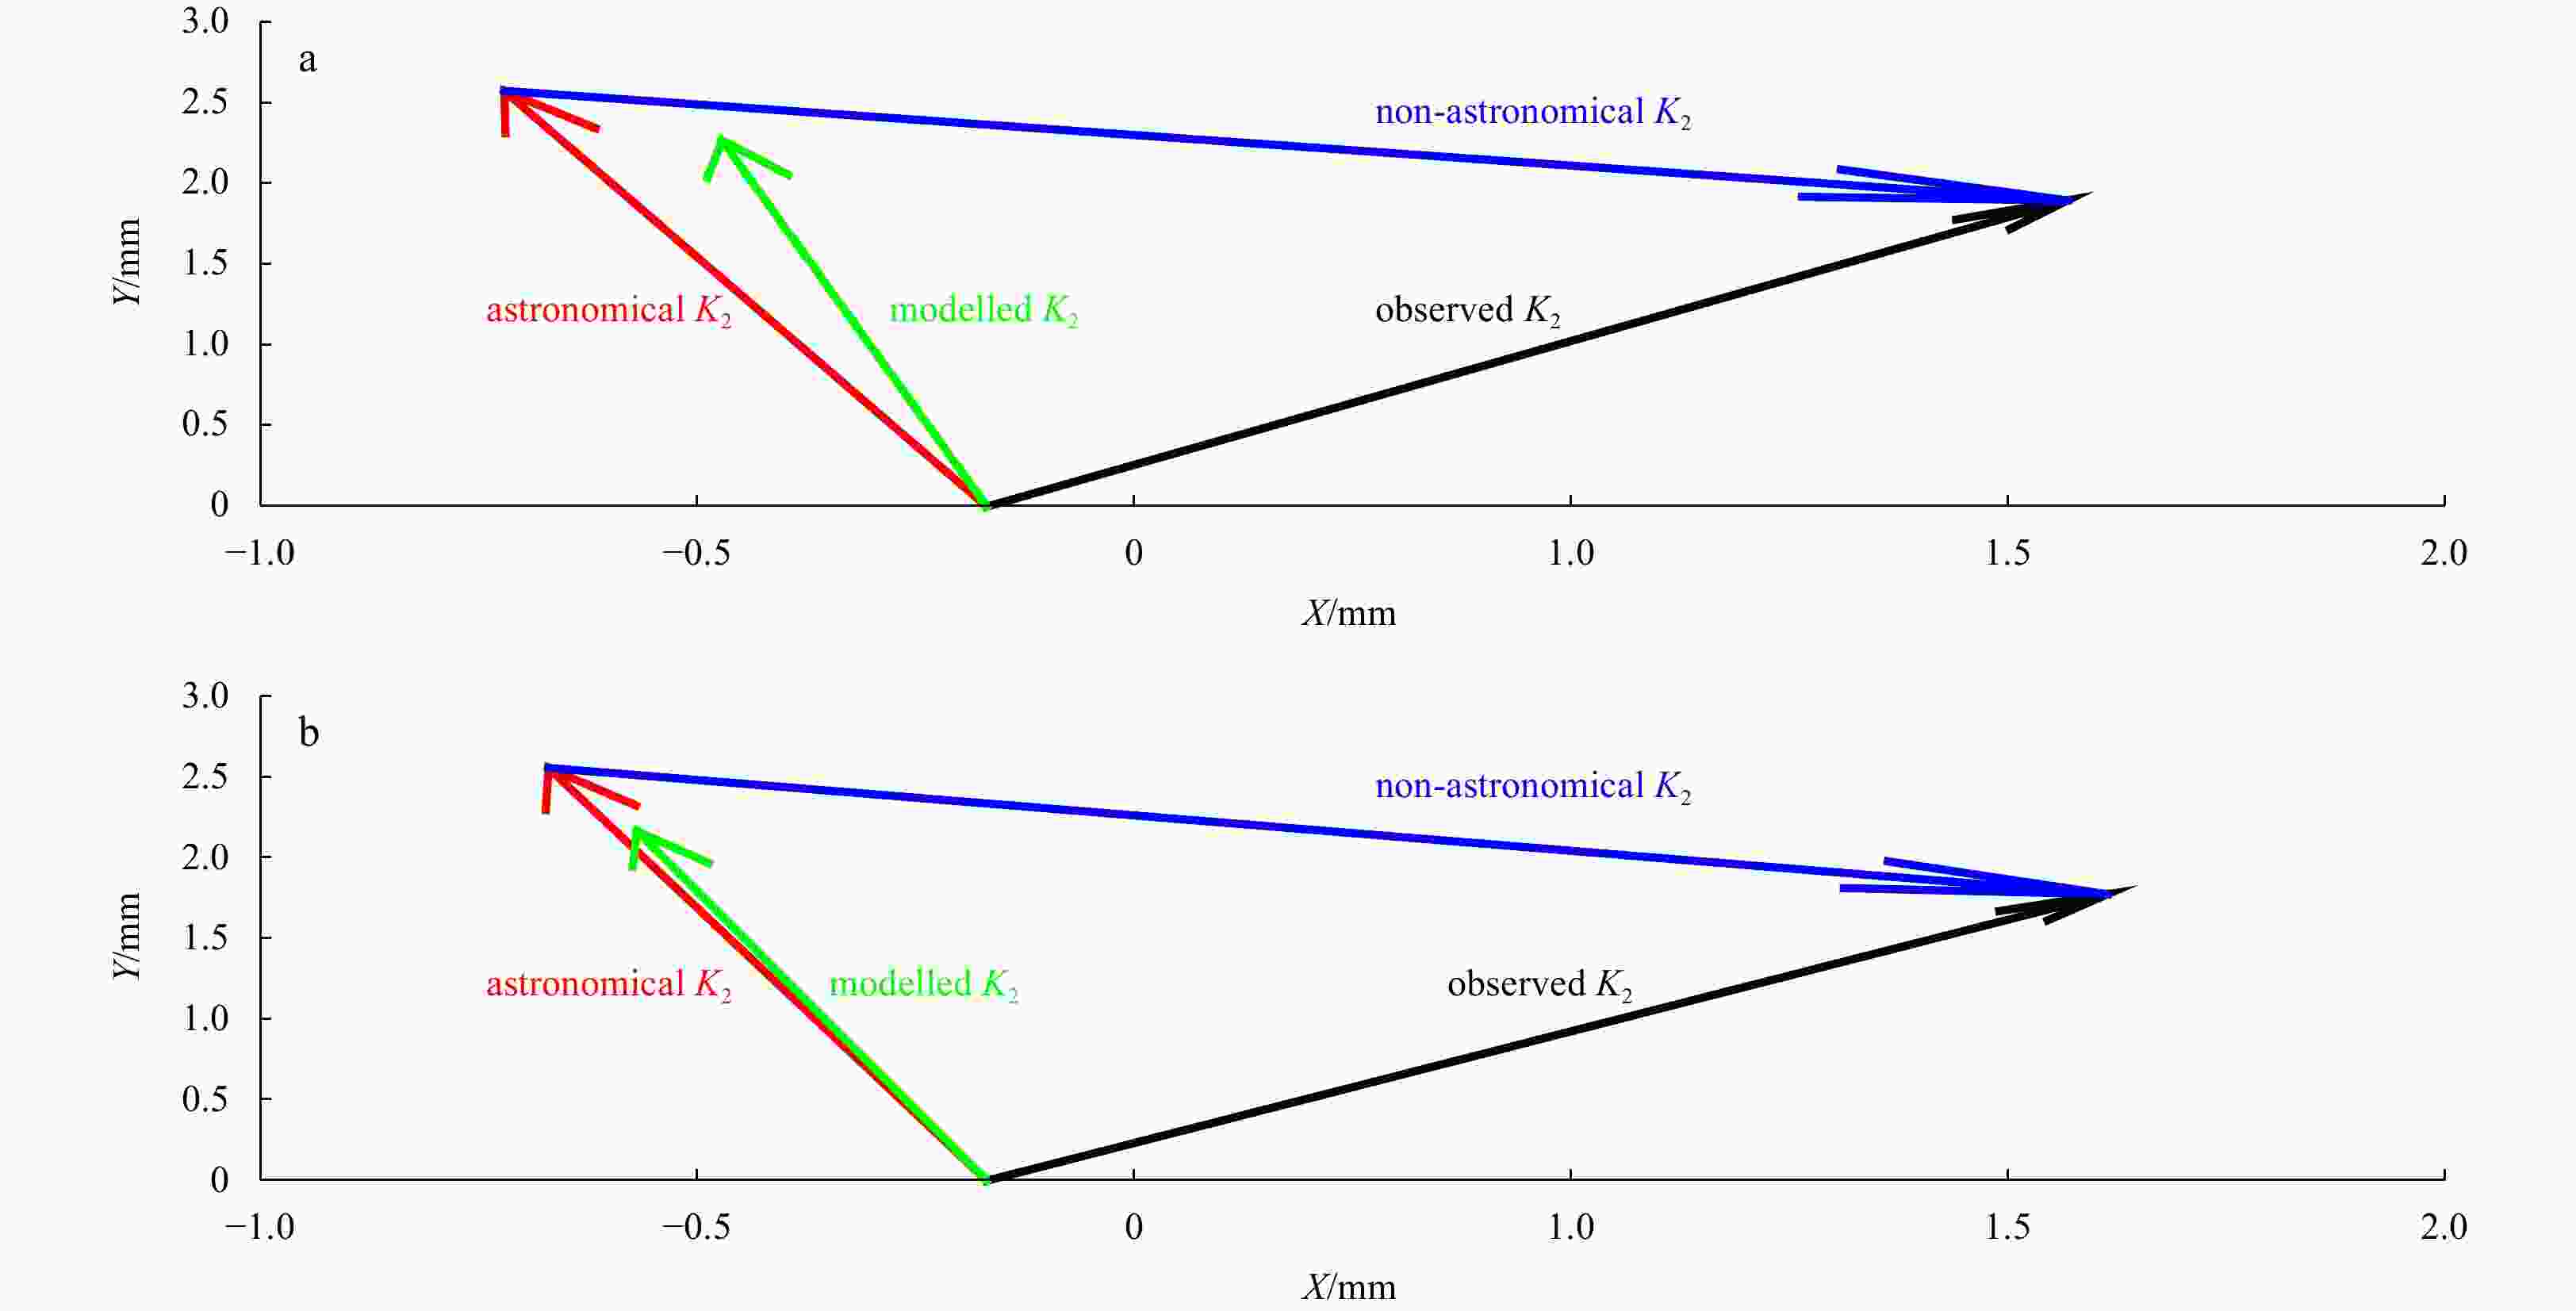
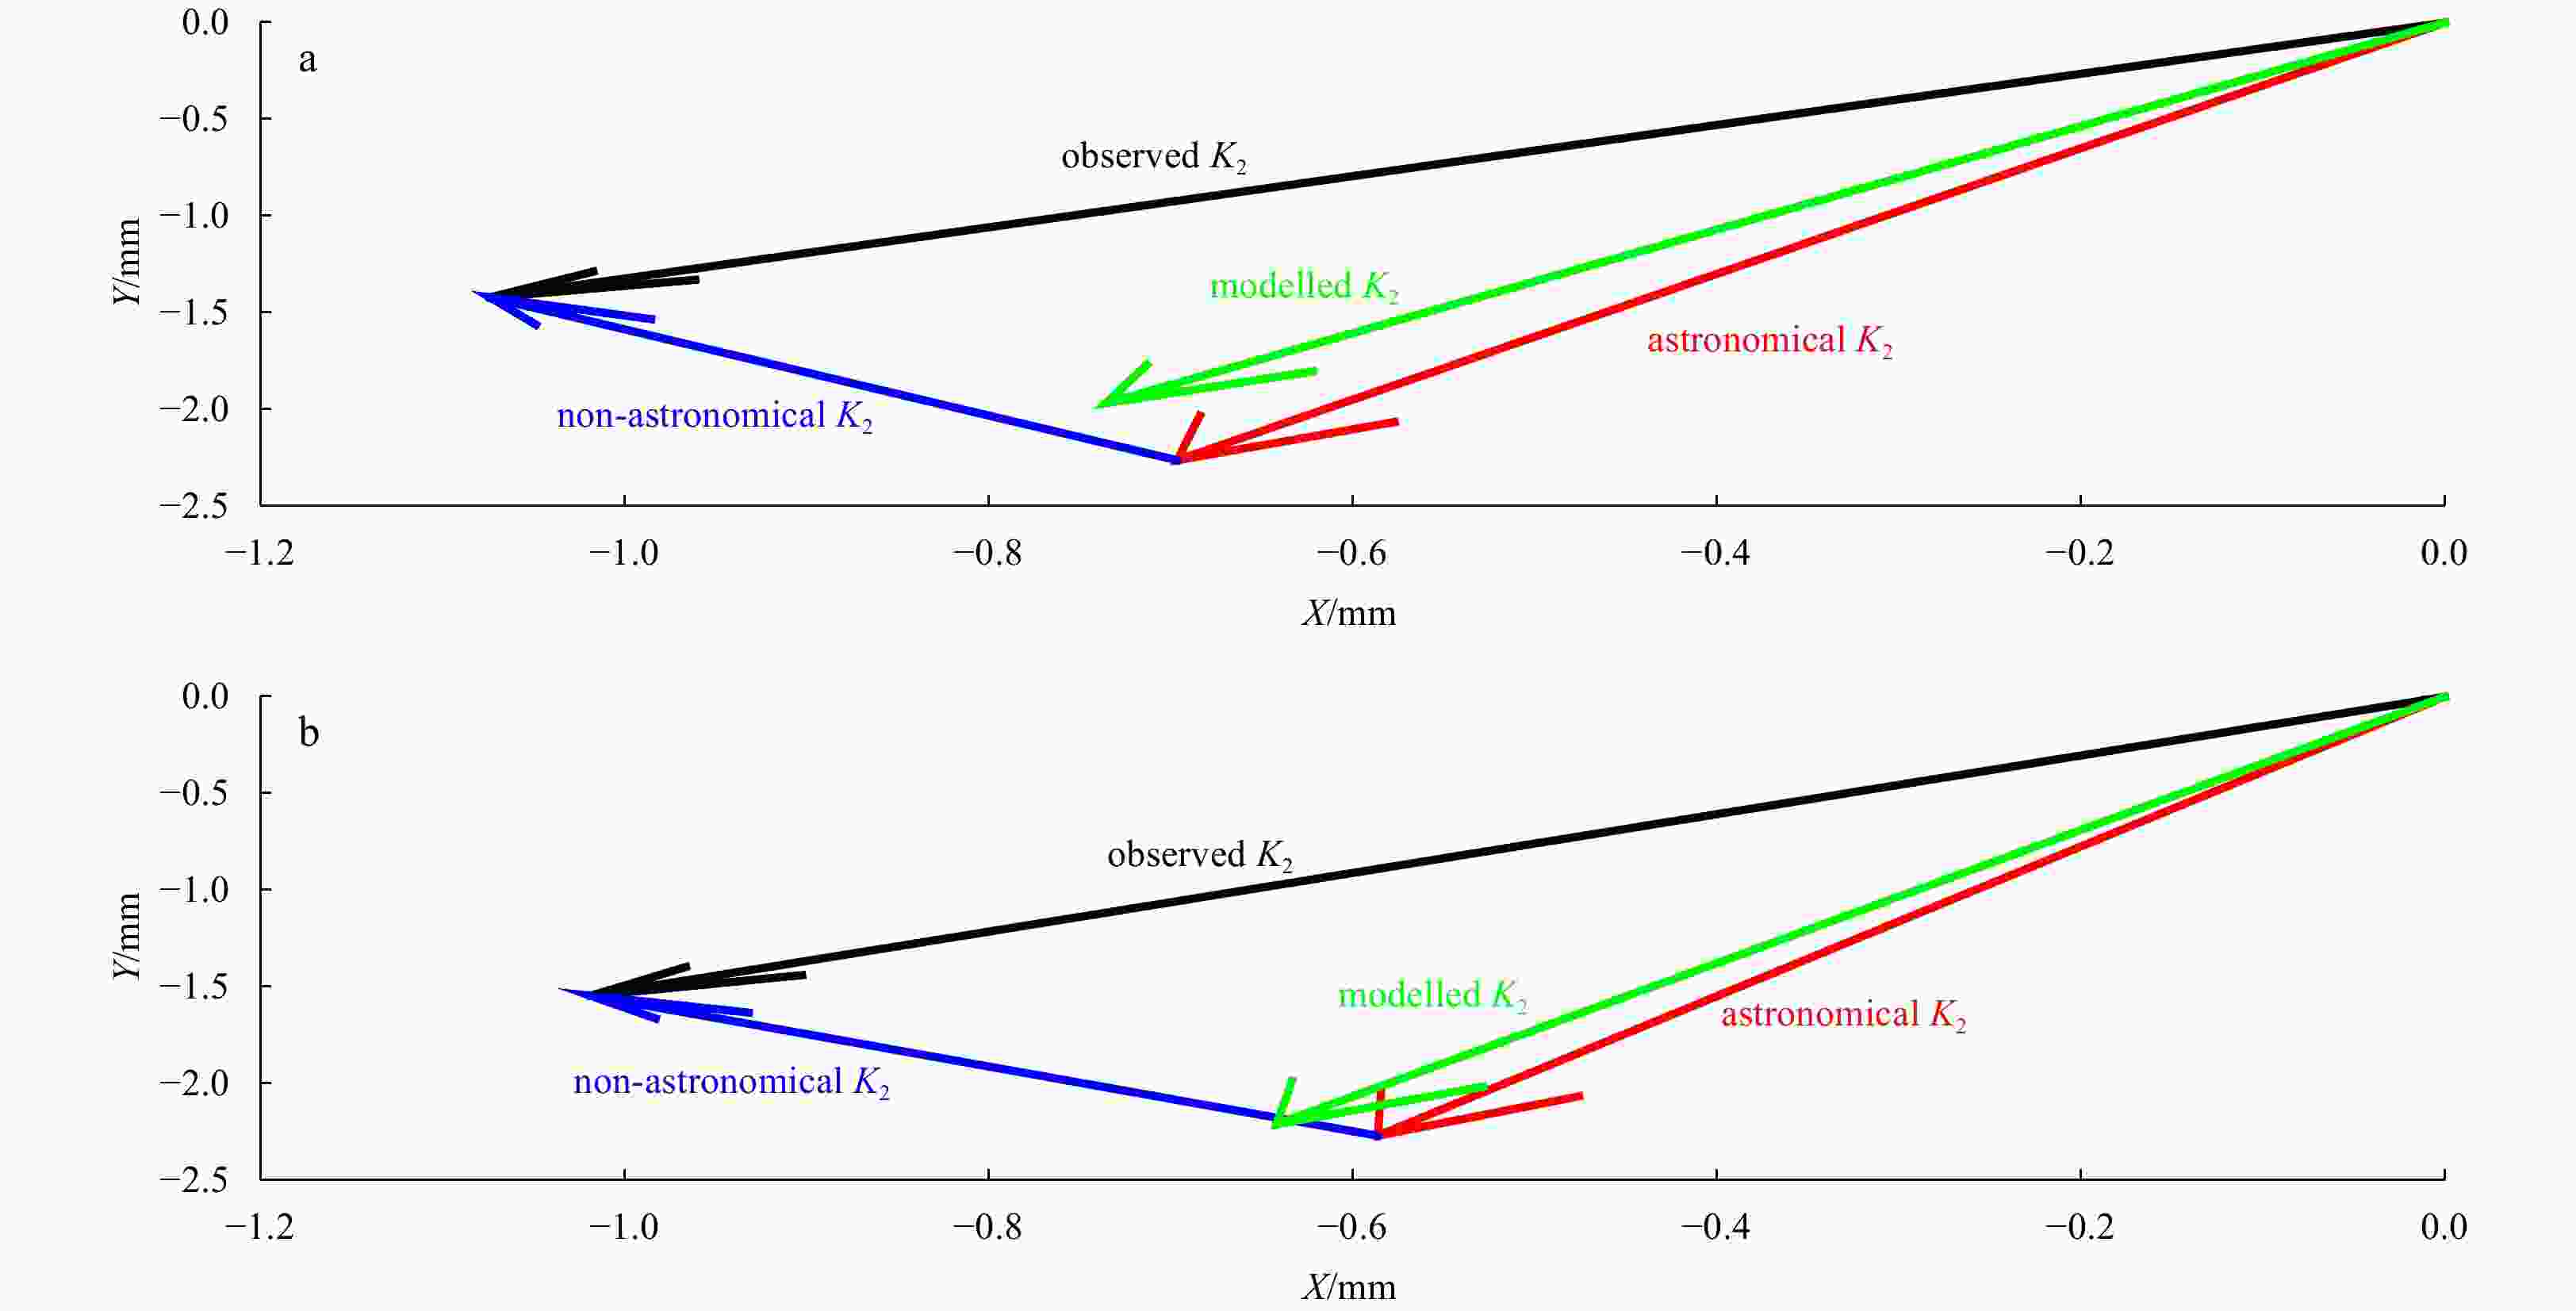
Figure 4. The vectorial composition of the K2 constituent of VDL tide. a. The observed K2 tide (represented by the black arrow) is the vectorial composition of the astronomical K2 tide (represented by the red arrow) and non-astronomical K2 tide (represented by the blue arrow) at Mald station. The green arrow represents the modeled K2 tidal vector (using the FES2014 tide model) in the CM frame. b. Similar distribution in the CF frame, but we use the EOT11a tide model to represent the modeled K2 tidal vector.
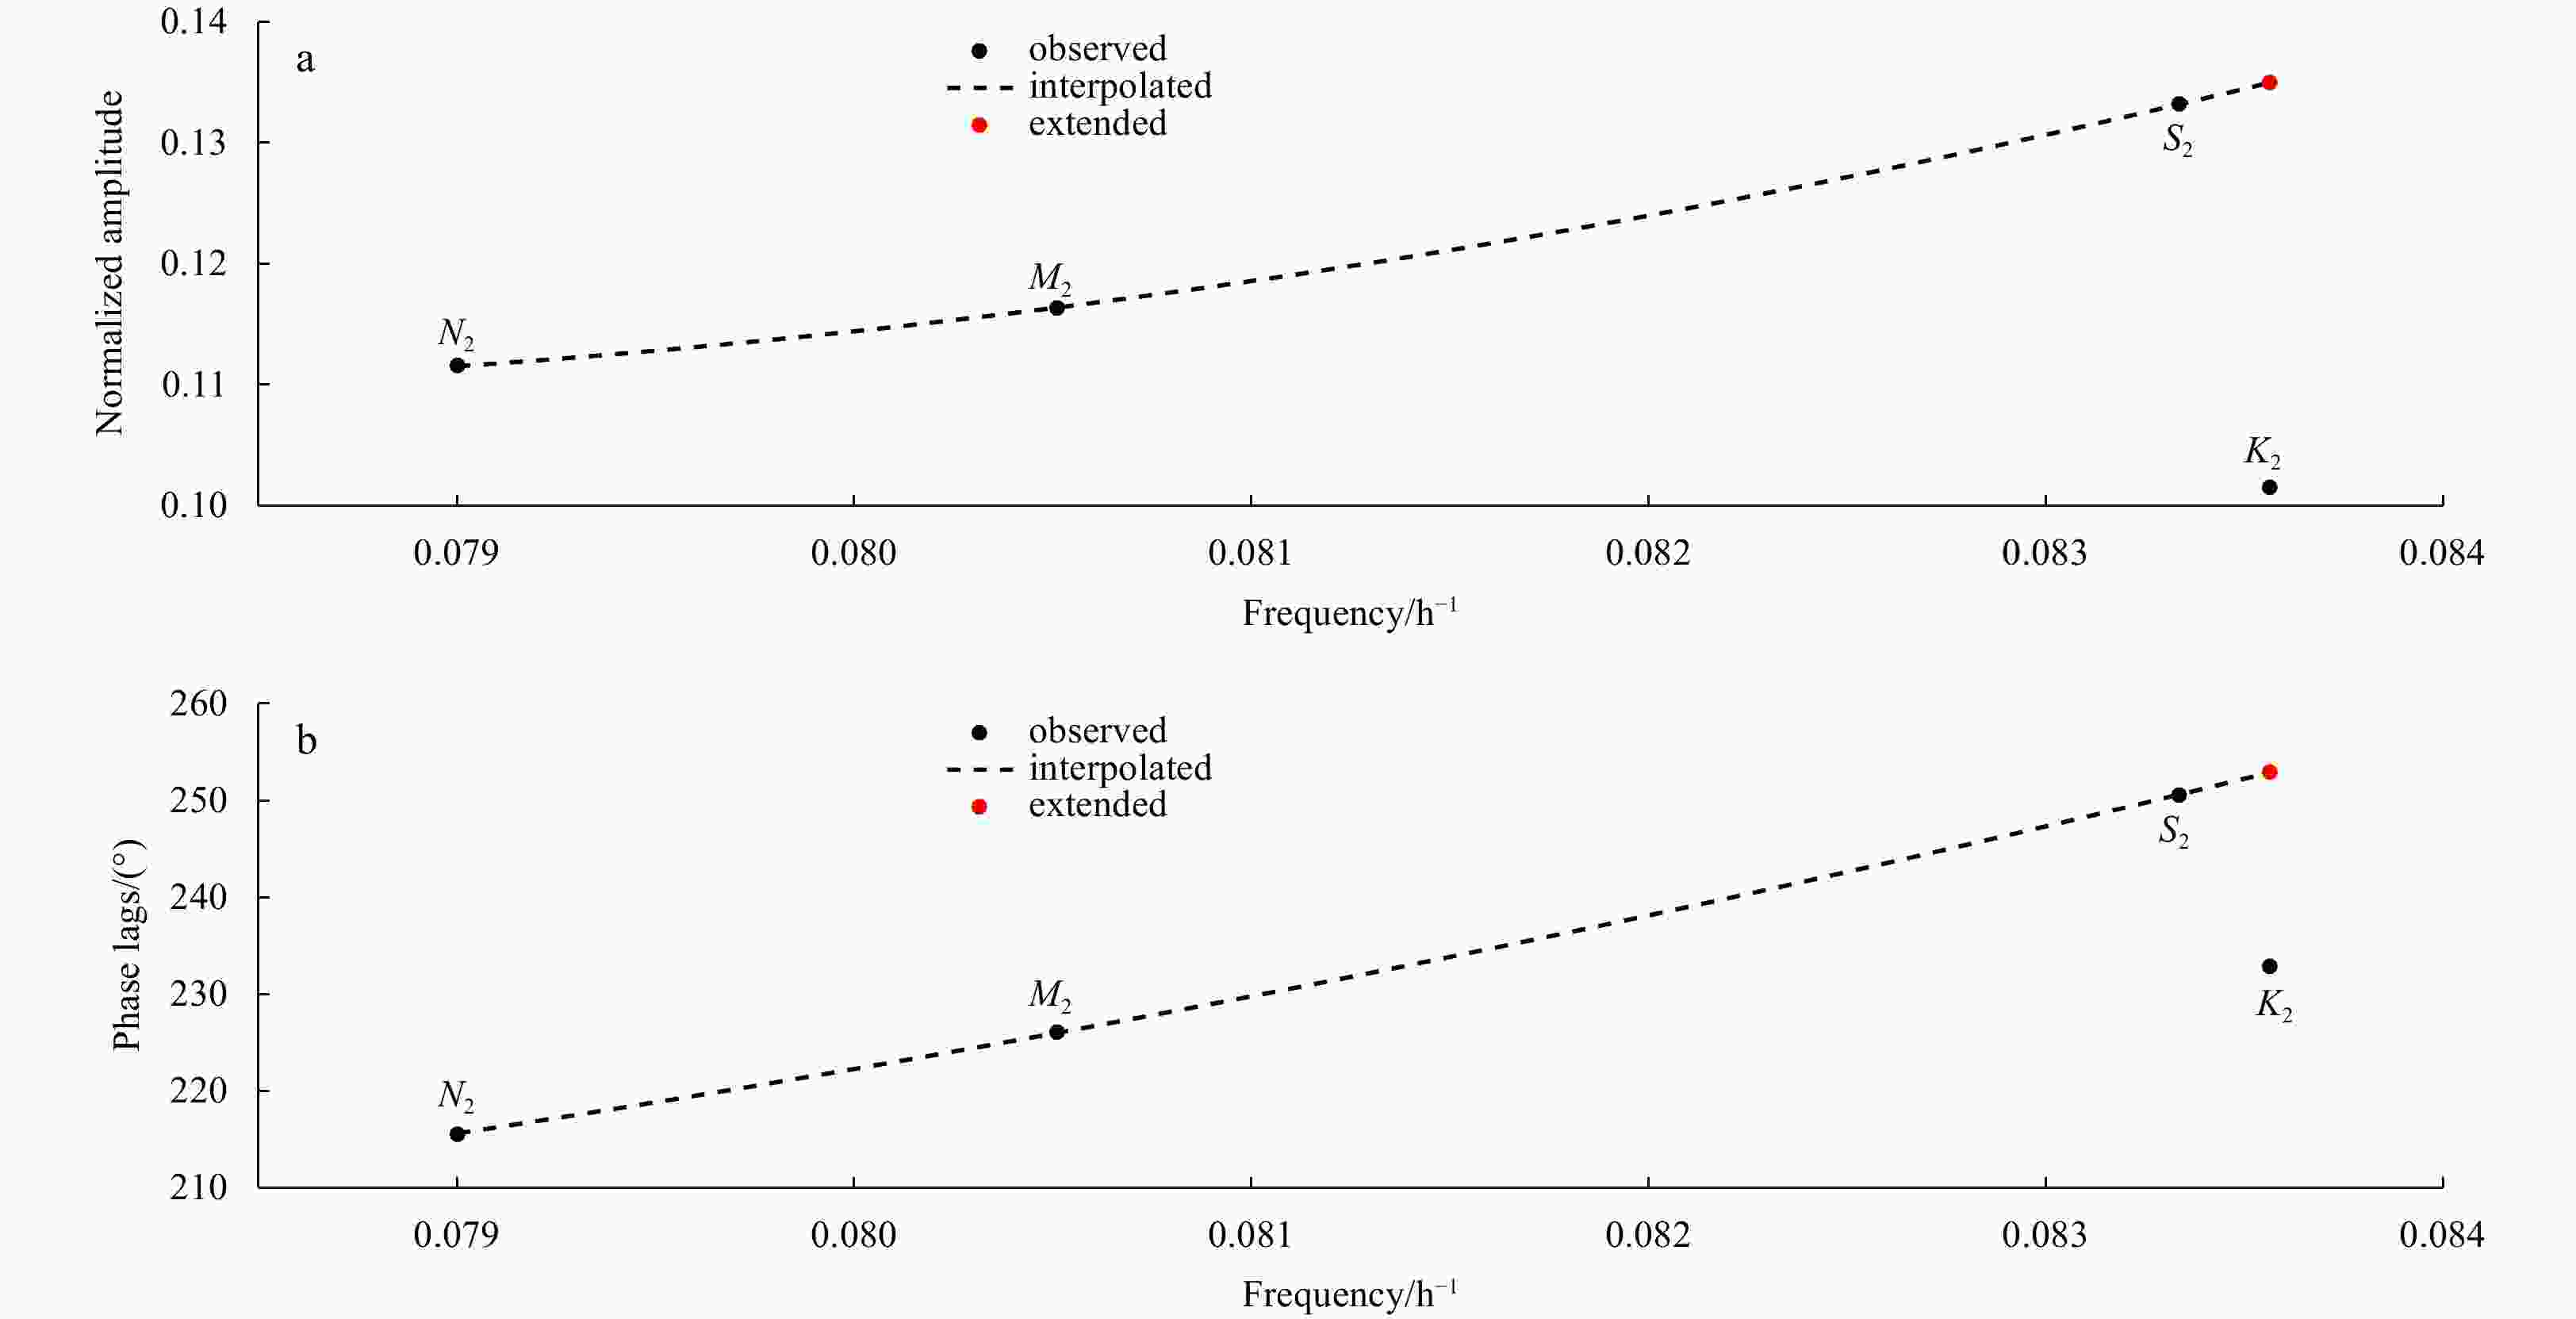
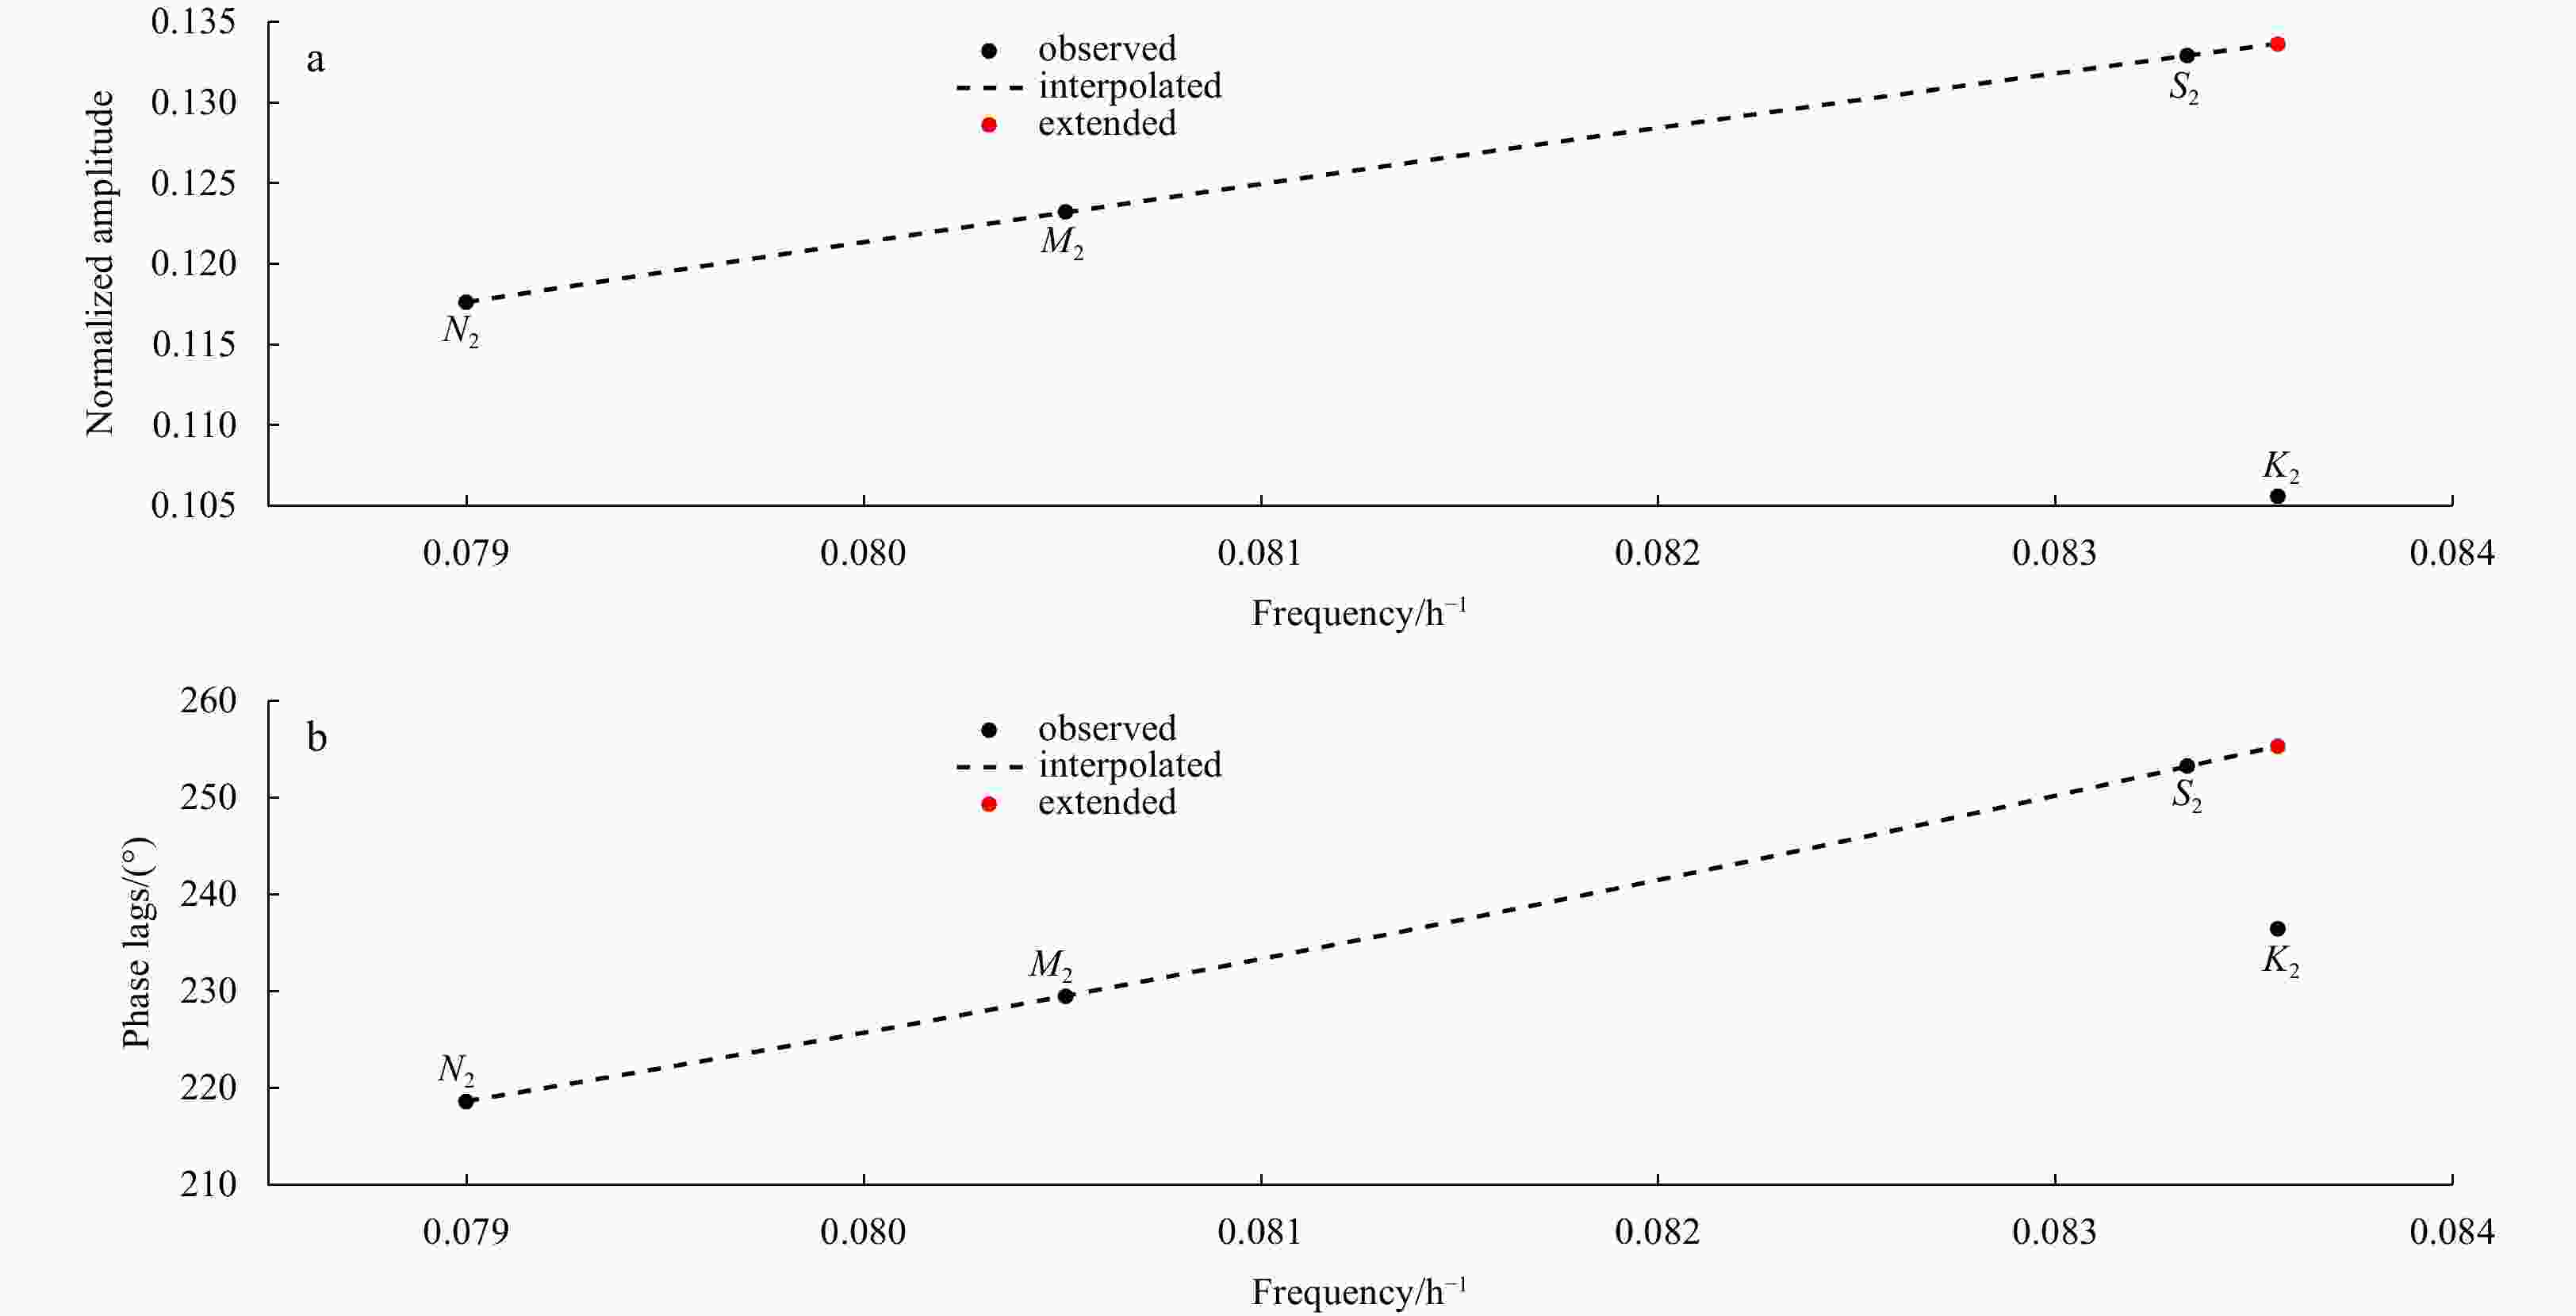
Figure 5. Tidal admittances of the Semi-diurnal VDL tide at Pre2 station in the CM frame. a. The distribution between normalized amplitudes and the frequency of semi-diurnal constituents. b. The distribution between Phase lags and the frequency of semi-diurnal constituents. Black dots signify the observed tidal admittances while the dashed lines indicate the interpolated curves. Red dots denote the extended K2 values based on the interpolated curves.
Figure 7. The vectorial composition of K2 constituent of VDL tide. a. The observed K2 tide (represented by the black arrow) is the vectorial composition of the astronomical K2 tide (represented by the red arrow) and non-astronomical K2 tide (represented by the blue arrow) at Pre2 station. The green arrow represents the modeled K2 tidal vector (using the FES2014 tide model) in the CM frame. b. Similar distribution in the CF frame, but we use the EOT11a tide model to represent the modeled K2 tidal vector.
Table 1. Harmonic constants of eight principal tidal constituents at 31 GPS stations under the CM frame for the equatorial and Indian Ocean
Name Latitude Longitude Data/d M2 S2 K1 O1 N2 K2 P1 Q1 Amp/mm Pha/(°) Amp/mm Pha/(°) Amp/mm Pha/(°) Amp/mm Pha/(°) Amp/mm Pha/(°) Amp/mm Pha/(°) Amp/mm Pha/(°) Amp/mm Pha/(°) ade1 34.73°S 138.65°E 4078 1.66 48.9 0.90 343.3 3.43 5.3 4.77 25.4 0.75 56.3 0.73 308.0 2.55 8.2 1.21 21.6 0.28 9.5 0.28 17.5 0.29 5.0 0.29 3.4 0.28 21.1 0.29 22.3 0.28 6.4 0.29 13.6 ade2 34.73°S 138.65°E 1787 1.71 47.1 0.63 308.7 3.00 347.3 4.80 25.3 0.80 56.4 1.96 221.0 2.56 17.3 1.19 20.6 0.41 13.7 0.41 37.1 0.45 7.9 0.42 5.0 0.41 29.4 0.42 12.4 0.42 9.4 0.42 20.3 bahr 26.21°N 50.61°E 4329 7.62 251.8 3.71 290.8 5.21 185.6 3.25 169.7 1.67 237.3 1.44 312.9 2.54 161.7 0.64 160.4 0.22 1.6 0.22 3.4 0.24 2.6 0.23 4.0 0.22 7.5 0.23 9.0 0.23 5.1 0.23 20.6 bhr1 26.21°N 50.61°E 3789 7.59 251.2 3.72 287.7 5.04 184.6 3.24 170.7 1.69 236.0 1.20 298.2 2.54 167.2 0.65 159.9 0.23 1.7 0.23 3.5 0.24 2.8 0.24 4.2 0.23 7.7 0.23 11.2 0.24 5.3 0.24 20.7 cedu 31.87°S 133.81°E 4719 0.12 152.2 2.40 284.7 4.81 23.6 4.90 13.8 0.90 37.1 1.18 281.4 1.99 10.0 1.23 12.6 0.17 80.5 0.17 4.1 0.19 2.2 0.18 2.1 0.17 11.1 0.18 8.7 0.18 5.2 0.18 8.6 coco 12.19°S 96.83°E 5046 21.36 116.4 9.21 143.8 12.52 326.4 7.78 326.9 4.67 106.1 3.49 145.3 4.21 335.9 1.61 312.6 0.26 0.7 0.26 1.6 0.28 1.3 0.27 2.0 0.26 3.2 0.27 4.4 0.27 3.7 0.27 9.7 dgar 7.27°S 72.37°E 3888 28.32 85.1 16.84 112.4 3.98 213.8 3.62 233.2 5.25 81.3 5.83 119.7 1.50 230.6 1.03 221.5 0.34 0.7 0.34 1.2 0.38 5.5 0.36 5.7 0.35 3.8 0.36 3.5 0.36 13.8 0.36 20.3 hrao 25.89°S 27.69°E 4882 15.79 226.1 7.97 258.0 2.28 214.5 2.07 186.3 2.96 213.2 2.31 227.3 0.84 205.7 0.43 152.4 0.21 0.8 0.21 1.5 0.24 6.1 0.23 6.4 0.21 4.2 0.22 5.5 0.23 15.7 0.23 31.1 iisc 13.02°N 77.57°E 4567 2.40 352.2 2.23 74.2 5.99 156.1 2.42 184.8 0.72 306.1 0.56 335.9 2.07 175.9 0.68 181.2 0.26 6.2 0.26 6.7 0.30 2.8 0.28 6.6 0.26 20.6 0.27 27.8 0.28 7.8 0.28 23.9 karr 20.98°S 117.10°E 5293 13.95 232.4 7.54 304.7 9.86 351.2 7.24 340.0 2.42 198.0 2.56 305.6 3.26 338.8 1.67 336.4 0.20 0.8 0.20 1.5 0.21 1.2 0.21 1.6 0.20 4.7 0.20 4.6 0.21 3.6 0.21 7.2 lhaz 29.66°N 91.10°E 3886 0.95 239.0 1.36 77.4 2.42 190.7 1.01 207.9 0.45 262.6 1.16 101.4 1.17 147.3 0.30 228.7 0.23 13.9 0.23 9.6 0.26 6.2 0.25 14.2 0.23 29.7 0.24 11.8 0.25 12.2 0.25 49.1 mal2 3.00°S 40.19°E 1208 28.61 207.1 13.63 241.4 10.36 197.5 5.46 182.0 5.11 185.7 4.03 252.7 2.90 189.0 1.24 181.2 0.52 1.0 0.52 2.2 0.55 3.1 0.54 5.7 0.52 5.8 0.54 7.7 0.54 10.6 0.54 25.0 mald 4.19°N 73.53°E 1284 13.16 59.3 9.30 101.4 8.89 169.8 4.46 191.5 2.06 33.1 2.41 52.0 3.04 168.0 1.57 196.2 0.82 3.6 0.81 5.0 0.97 6.3 0.90 11.6 0.82 22.8 0.86 20.7 0.90 16.8 0.91 33.1 mali 3.00°S 40.19°E 3846 28.16 207.4 16.77 238.5 10.02 180.1 5.11 183.3 5.33 189.8 3.61 253.0 2.01 162.6 1.01 175.0 0.39 0.8 0.40 1.3 0.49 2.9 0.46 5.1 0.40 4.3 0.42 6.6 0.46 12.9 0.46 26.0 nnor 31.05°S 116.19°E 3404 2.50 83.1 0.67 189.8 9.95 358.2 6.55 358.1 0.90 54.1 0.29 3.4 2.81 343.2 1.55 359.6 0.27 6.1 0.26 22.8 0.32 1.8 0.30 2.7 0.27 17.1 0.28 54.6 0.30 6.2 0.31 11.4 ntus 1.35°N 103.68°E 3801 4.21 191.0 1.35 200.5 2.23 342.8 1.98 351.2 1.09 181.1 1.22 112.3 1.05 24.2 0.66 10.7 0.33 4.6 0.34 14.2 0.36 9.3 0.35 10.0 0.34 17.6 0.35 16.3 0.35 19.0 0.35 30.3 pert 31.80°S 115.89°E 5436 2.74 79.0 0.62 132.3 9.55 354.2 7.12 358.5 0.95 44.5 0.17 357.6 3.00 351.9 1.51 358.6 0.20 4.3 0.20 18.9 0.23 1.4 0.23 1.8 0.21 12.3 0.21 72.1 0.22 4.3 0.23 8.6 pre1 25.75°S 28.22°E 4099 15.78 226.0 8.38 256.4 3.88 225.0 2.02 182.0 3.07 213.8 1.82 245.0 0.70 233.2 0.48 149.7 0.23 0.8 0.23 1.6 0.24 3.6 0.24 6.7 0.23 4.3 0.24 7.4 0.24 19.4 0.24 28.2 pre2 25.75°S 28.22°E 1859 15.87 226.0 8.43 250.6 4.03 226.7 1.99 180.0 2.96 215.6 1.78 232.9 1.03 207.2 0.43 157.4 0.32 1.1 0.32 2.2 0.34 4.8 0.33 9.4 0.32 6.1 0.33 10.4 0.32 18.1 0.33 43.3 rbay 28.80°S 32.08°E 2357 26.41 225.2 16.51 253.4 4.23 259.4 2.09 178.0 4.78 214.6 3.68 261.0 0.47 275.7 0.68 138.5 0.40 0.9 0.40 1.4 0.50 6.8 0.46 12.7 0.41 4.9 0.42 6.7 0.46 55.4 0.47 39.2 rcmn 1.22°S 36.89°E 1437 11.93 213.4 6.31 233.9 6.27 199.5 3.16 186.0 2.41 199.3 1.90 303.9 2.05 235.3 0.79 169.4 0.46 2.2 0.46 4.2 0.50 4.6 0.48 8.7 0.46 10.9 0.47 14.6 0.48 13.5 0.48 35.3 reun 21.21°S 55.57°E 3475 10.26 115.4 1.47 127.8 5.35 242.8 3.15 212.2 2.69 114.4 1.34 110.8 1.72 237.0 0.72 178.6 0.35 2.0 0.35 13.7 0.41 4.5 0.39 7.1 0.35 7.5 0.37 15.8 0.39 12.9 0.39 31.1 sey1 4.67°S 55.48°E 2647 20.59 186.5 9.55 223.2 14.24 189.0 7.96 187.6 4.50 168.7 2.91 194.9 3.72 182.8 1.88 180.5 0.35 2.0 0.35 13.7 0.41 4.5 0.39 7.1 0.35 7.5 0.37 15.8 0.39 12.9 0.39 31.1 suth 32.38°S 20.81°E 4524 20.25 223.6 8.97 247.5 3.99 233.5 2.00 181.5 4.18 212.7 2.88 248.4 0.89 221.3 0.38 159.5 0.19 0.5 0.19 1.2 0.20 2.9 0.20 5.6 0.19 2.6 0.19 3.8 0.20 12.5 0.20 29.5 sutm 32.38°S 20.81°E 3405 20.24 223.9 8.96 246.5 4.95 244.7 1.91 180.1 4.13 212.6 2.61 250.4 0.77 220.2 0.38 166.8 0.22 0.6 0.22 1.4 0.24 2.7 0.23 6.9 0.22 3.1 0.23 5.0 0.23 17.0 0.23 34.4 xmis 10.45°S 105.69°E 1822 16.33 168.1 5.38 217.5 11.90 338.8 9.10 331.2 3.99 142.7 1.09 234.5 4.66 345.4 2.10 324.5 0.49 1.7 0.49 5.2 0.53 2.5 0.51 3.2 0.49 7.1 0.51 26.6 0.51 6.2 0.51 14.0 yar1 29.05°S 115.35°E 2078 2.58 104.1 0.88 134.4 9.42 352.6 6.71 352.5 0.74 67.8 0.37 162.2 2.94 352.0 1.59 350.4 0.34 7.5 0.34 21.9 0.39 2.3 0.37 3.1 0.34 26.4 0.35 55.2 0.37 7.1 0.37 13.3 yar2 29.05°S 115.35°E 4688 2.46 105.6 0.78 190.1 9.39 354.7 6.66 353.1 0.77 69.0 0.30 0.1 3.21 350.2 1.52 351.1 0.19 4.4 0.19 14.0 0.20 1.3 0.20 1.7 0.19 14.2 0.20 36.9 0.20 3.5 0.20 7.6 yar3 29.05°S 115.35°E 1476 2.50 109.2 0.18 120.5 8.47 353.9 6.54 353.6 0.87 72.5 0.66 262.4 2.90 343.3 1.53 356.2 0.36 8.4 0.36 114.6 0.40 2.6 0.38 3.3 0.37 24.1 0.37 32.7 0.38 7.4 0.38 14.2 yarr 29.05°S 115.35°E 2216 2.41 105.0 0.80 145.4 10.13 353.9 6.64 353.0 0.84 70.2 1.24 248.8 2.68 336.5 1.53 350.7 0.27 6.5 0.27 19.5 0.29 1.7 0.29 2.5 0.27 18.6 0.28 13.2 0.28 6.1 0.29 10.8 yibl 22.19°N 56.11°E 1856 6.09 314.6 3.00 328.7 7.67 171.6 5.02 175.7 1.75 300.5 0.53 284.4 3.52 171.0 1.11 179.1 0.34 3.2 0.34 6.5 0.37 2.8 0.36 4.1 0.34 11.2 0.35 37.6 0.36 5.8 0.36 18.6 Note: Amp represents amplitude, Pha represents Greenwich phase-lag. Corresponding one-sigma formal errors are also listed on the next line. Table 2. Harmonic constants of eight principal tidal constituents at 31 GPS stations under the CF frame for the equatorial and Indian Ocean
Name Latitude Longitude Data/d M2 S2 K1 O1 N2 K2 P1 Q1 Amp/mm Pha/(°) Amp/mm Pha/(°) Amp/mm Pha/(°) Amp/mm Pha/(°) Amp/mm Pha/(°) Amp/mm Pha/(°) Amp/mm Pha/(°) Amp/mm Pha/(°) ade1 34.73°S 138.65°E 4078 1.33 144.5 1.02 294.2 3.87 55.9 5.46 45.1 0.66 93.5 0.85 291.5 2.47 31.6 1.32 32.6 0.28 9.5 0.28 17.5 0.29 5.0 0.29 3.4 0.28 21.1 0.29 22.3 0.28 6.4 0.29 13.6 ade2 34.73°S 138.65°E 1787 1.27 142.4 1.17 267.6 2.80 53.1 5.49 44.9 0.70 91.5 2.21 223.0 2.63 39.9 1.29 31.9 0.41 13.7 0.41 37.1 0.45 7.9 0.42 5.0 0.41 29.4 0.42 12.4 0.42 9.4 0.42 20.3 bahr 26.21°N 50.61°E 4329 7.48 256.0 3.66 298.8 3.14 192.9 1.74 183.3 1.54 237.9 1.53 316.5 1.85 156.4 0.34 170.2 0.22 1.6 0.22 3.4 0.24 2.6 0.23 4.0 0.22 7.5 0.23 9.0 0.23 5.1 0.23 20.6 bhr1 26.21°N 50.61°E 3789 7.44 255.4 3.64 295.6 2.95 191.6 1.75 185.2 1.55 236.4 1.26 303.5 1.83 163.9 0.36 168.9 0.23 1.7 0.23 3.5 0.24 2.8 0.24 4.2 0.23 7.7 0.23 11.2 0.24 5.3 0.24 20.7 cedu 31.87°S 133.81°E 4719 2.30 190.1 2.99 273.8 5.83 55.2 5.29 33.6 0.64 66.6 1.38 274.4 2.03 38.5 1.30 23.2 0.17 80.5 0.17 4.1 0.19 2.2 0.18 2.1 0.17 11.1 0.18 8.7 0.18 5.2 0.18 8.6 coco 12.19°S 96.83°E 5046 21.65 120.5 9.03 146.2 11.71 338.0 7.79 336.9 4.87 109.7 3.40 148.3 4.09 347.3 1.65 320.3 0.26 0.7 0.26 1.6 0.28 1.3 0.27 2.0 0.26 3.2 0.27 4.4 0.27 3.7 0.27 9.7 dgar 7.27°S 72.37°E 3888 27.58 86.5 16.56 112.1 2.08 172.1 2.09 242.8 5.25 83.6 5.67 120.2 0.63 212.6 0.76 229.4 0.34 0.7 0.34 1.2 0.38 5.5 0.36 5.7 0.35 3.8 0.36 3.5 0.36 13.8 0.36 20.3 hrao 25.89°S 27.69°E 4882 16.71 229.8 8.01 261.0 2.14 104.9 1.63 114.7 3.10 216.6 2.37 230.4 0.81 112.4 0.43 99.6 0.21 0.8 0.21 1.5 0.24 6.1 0.23 6.4 0.21 4.2 0.22 5.5 0.23 15.7 0.23 31.1 iisc 13.02°N 77.57°E 4567 1.93 346.9 2.25 68.9 5.19 140.3 1.27 188.5 0.52 303.9 0.66 330.7 1.63 164.5 0.45 188.9 0.26 6.2 0.26 6.7 0.30 2.8 0.28 6.6 0.26 20.6 0.27 27.8 0.28 7.8 0.28 23.9 karr 20.98°S 117.10°E 5293 15.53 227.6 7.86 300.7 9.40 7.0 6.97 351.5 2.81 193.4 2.69 301.5 2.91 353.5 1.68 343.3 0.20 0.8 0.20 1.5 0.21 1.2 0.21 1.6 0.20 4.7 0.20 4.6 0.21 3.6 0.21 7.2 lhaz 29.66°N 91.10°E 3886 0.96 199.9 1.45 73.5 1.54 225.1 1.34 266.6 0.24 228.6 1.11 98.4 0.69 143.1 0.41 263.4 0.23 13.9 0.23 9.6 0.26 6.2 0.25 14.2 0.23 29.7 0.24 11.8 0.25 12.2 0.25 49.1 mal2 3.00°S 40.19°E 1208 28.73 209.0 13.37 243.0 8.06 187.5 3.91 171.9 5.11 186.6 4.08 254.4 2.24 174.2 0.92 177.4 0.52 1.0 0.52 2.2 0.55 3.1 0.54 5.7 0.52 5.8 0.54 7.7 0.54 10.6 0.54 25.0 mald 4.19°N 73.53°E 1284 12.53 60.6 9.15 100.2 7.98 156.3 3.17 187.6 1.99 37.8 2.35 49.1 2.74 155.0 1.32 198.8 0.82 3.6 0.81 5.0 0.97 6.3 0.90 11.6 0.82 22.8 0.86 20.7 0.90 16.8 0.91 33.1 mali 3.00°S 40.19°E 3846 28.28 209.3 16.50 239.8 8.37 166.0 3.54 172.6 5.33 190.7 3.67 254.8 1.82 135.0 0.70 167.1 0.39 0.8 0.40 1.3 0.49 2.9 0.46 5.1 0.40 4.3 0.42 6.6 0.46 12.9 0.46 26.0 nnor 31.05°S 116.19°E 3404 2.51 133.1 1.20 218.0 9.84 17.5 6.82 14.1 0.76 83.5 0.29 311.2 2.50 5.6 1.66 8.4 0.27 6.1 0.26 22.8 0.32 1.8 0.30 2.7 0.27 17.1 0.28 54.6 0.30 6.2 0.31 11.4 ntus 1.35°N 103.68°E 3801 5.60 188.8 1.57 210.1 2.71 15.9 2.50 4.4 1.41 173.3 1.09 116.1 1.42 38.1 0.80 10.7 0.33 4.6 0.34 14.2 0.36 9.3 0.35 10.0 0.34 17.6 0.35 16.3 0.35 19.0 0.35 30.3 pert 31.80°S 115.89°E 5436 2.51 126.5 0.72 193.9 9.25 14.8 7.40 13.4 0.73 71.0 0.25 285.8 2.85 13.2 1.61 8.0 0.20 4.3 0.20 18.9 0.23 1.4 0.23 1.8 0.21 12.3 0.21 72.1 0.22 4.3 0.23 8.6 pre1 25.75°S 28.22°E 4099 16.69 229.7 8.41 259.2 1.54 156.0 1.76 111.4 3.22 217.0 1.92 248.1 0.55 87.0 0.49 103.3 0.23 0.8 0.23 1.6 0.24 3.6 0.24 6.7 0.23 4.3 0.24 7.4 0.24 19.4 0.24 28.2 pre2 25.75°S 28.22°E 1859 16.79 229.7 8.41 253.4 1.49 162.9 1.81 109.8 3.12 218.8 1.85 236.6 0.80 126.0 0.41 102.9 0.32 1.1 0.32 2.2 0.34 4.8 0.33 9.4 0.32 6.1 0.33 10.4 0.32 18.1 0.33 43.3 rbay 28.80°S 32.08°E 2357 27.44 227.3 16.57 254.7 0.72 309.0 2.07 111.3 4.96 216.4 3.82 262.0 0.85 57.4 0.73 106.4 0.40 0.9 0.40 1.4 0.50 6.8 0.46 12.7 0.41 4.9 0.42 6.7 0.46 55.4 0.47 39.2 rcmn 1.22°S 36.89°E 1437 12.05 218.0 5.96 237.2 3.97 183.2 1.57 168.6 2.40 201.7 2.01 305.2 1.18 244.3 0.49 156.3 0.46 2.2 0.46 4.2 0.50 4.6 0.48 8.7 0.46 10.9 0.47 14.6 0.48 13.5 0.48 35.3 reun 21.21°S 55.57°E 3475 9.48 121.2 1.11 124.3 1.81 228.2 1.34 181.0 2.67 118.6 1.17 112.3 0.61 211.7 0.48 151.9 0.35 2.0 0.35 13.7 0.41 4.5 0.39 7.1 0.35 7.5 0.37 15.8 0.39 12.9 0.39 31.1 sey1 4.67°S 55.48°E 2647 20.88 188.6 9.36 225.0 12.40 179.5 6.42 181.5 4.59 169.3 2.88 197.7 3.21 169.6 1.57 177.6 0.51 1.4 0.50 3.0 0.66 2.7 0.60 4.4 0.51 6.5 0.54 10.6 0.60 9.2 0.61 18.5 suth 32.38°S 20.81°E 4524 21.18 226.9 8.97 250.0 1.33 163.6 2.01 112.0 4.35 215.6 2.99 250.0 0.67 116.6 0.41 100.0 0.19 0.5 0.19 1.2 0.20 2.9 0.20 5.6 0.19 2.6 0.19 3.8 0.20 12.5 0.20 29.5 sutm 32.38°S 20.81°E 3405 21.18 227.1 8.95 249.1 1.35 221.4 2.02 109.1 4.30 215.5 2.72 252.1 0.72 107.8 0.37 104.0 0.22 0.6 0.22 1.4 0.24 2.7 0.23 6.9 0.22 3.1 0.23 5.0 0.23 17.0 0.23 34.4 xmis 10.45°S 105.69°E 1822 17.90 170.2 5.78 220.0 11.46 349.6 9.05 338.5 4.36 144.3 1.27 237.9 4.59 354.2 2.15 329.0 0.49 1.7 0.49 5.2 0.53 2.5 0.51 3.2 0.49 7.1 0.51 26.6 0.51 6.2 0.51 14.0 yar1 29.05°S 115.35°E 2078 3.23 144.4 0.89 179.0 9.07 12.5 6.82 7.8 0.74 102.4 0.46 195.2 2.81 12.6 1.66 359.2 0.34 7.5 0.34 21.9 0.39 2.3 0.37 3.1 0.34 26.4 0.35 55.2 0.37 7.1 0.37 13.3 yar2 29.05°S 115.35°E 4688 3.18 146.6 1.28 215.7 9.15 14.7 6.79 8.5 0.78 102.1 0.31 312.2 3.03 9.1 1.59 0.3 0.19 4.4 0.19 14.0 0.20 1.3 0.20 1.7 0.19 14.2 0.20 36.9 0.20 3.5 0.20 7.6 yar3 29.05°S 115.35°E 1476 3.31 148.3 0.58 231.1 8.25 16.0 6.69 9.2 0.89 101.6 0.91 258.4 2.61 4.2 1.62 5.0 0.36 8.4 0.36 114.6 0.40 2.6 0.38 3.3 0.37 24.1 0.37 32.7 0.38 7.4 0.38 14.2 yarr 29.05°S 115.35°E 2216 3.13 146.9 0.95 189.6 9.81 12.4 6.76 8.4 0.85 100.3 1.49 248.6 2.28 359.0 1.60 359.8 0.27 6.5 0.27 19.5 0.29 1.7 0.29 2.5 0.27 18.6 0.28 13.2 0.28 6.1 0.29 10.8 yibl 22.19°N 56.11°E 1856 6.39 316.2 3.26 335.2 5.70 166.9 3.58 181.4 1.68 303.4 0.60 294.8 2.86 167.7 0.85 187.1 0.34 3.2 0.34 6.5 0.37 2.8 0.36 4.1 0.34 11.2 0.35 37.6 0.36 5.8 0.36 18.6 Note: Amp represents amplitude, Pha represents Greenwich phase-lag. Corresponding one-sigma formal errors are also listed on the next line. Table 3. The main properties of the five VDL tide models adopted
Model Country Resolution Type Major constituents FES2014 France (1/16)° × (1/16)° H M2, S2, K1, O1, N2, P1, K2, Q1, J1, 2N2, L2, T2, R2, Mu2, Nu2, La2, MKS2, E2, M3, N4, S4, M4, MN4, MS4, M6, M8, Mf, Mm, MSf, Msqm, Mtm, Sa, Ssa (total: 33) EOT11a Germany (1/8)° × (1/8)° E M2, S2, N2, K2, K1, O1, P1, Q1, S1, 2N2, Mf, Mm, M4 (total: 13) GOT4.10c US (1/2)° × (1/2)° E M2, S2, K1, O1, N2, P1, K2, Q1, S1, M4 (total: 10) GOT4.8 US (1/2)° × (1/2)° E M2, S2, K1, O1, N2, P1, K2, Q1 (Total: 8) NAO.99b Japan (1/2)° × (1/2)° H M2, S2, K1, O1, N2, P1, K2, Q1, M1, J1, OO1, 2N2, Mu2, Nu2, L2, T2, Mf, Mm, MSf, Msm, Mtm, Sa, Ssa (total: 23) Note: E represents empirical model; H represents assimilation model. Table 4. Corrected harmonic constants of K2 tidal constituent at 31 GPS stations for the equatorial and Indian Ocean
Name Latitude Longitude CM Frame CF Frame Raw Amp/
mmRaw Pha/
(°)Corrected
Amp/mmCorrected
Pha/(°)Raw Amp/
mmRaw Pha/
(°)Corrected
Amp/mmCorrected
Pha/(°)ade1 34.73°S 138.65°E 0.73 308.0 0.28 335.1 0.85 291.5 0.33 309.4 ade2 34.73°S 138.65°E 1.96 221.0 0.20 345.7 2.21 223.0 0.38 317.7 bahr 26.21°N 50.61°E 1.44 312.9 1.05 294.6 1.53 316.5 1.03 302.8 bhr1 26.21°N 50.61°E 1.20 298.2 1.05 291.1 1.26 303.5 1.02 299.1 cedu 31.87°S 133.81°E 1.18 281.4 0.82 290.7 1.38 274.4 0.91 310.4 coco 12.19°S 96.83°E 3.49 145.3 2.56 146.5 3.40 148.3 2.51 148.6 dgar 7.27°S 72.37°E 5.83 119.7 4.79 115.8 5.67 120.2 4.72 115.3 hrao 25.89°S 27.69°E 2.31 227.3 2.22 261.0 2.37 230.4 2.22 263.9 iisc 13.02°N 77.57°E 0.56 335.9 0.68 80.6 0.66 330.7 0.68 75.6 karr 20.98°S 117.10°E 2.56 305.6 2.11 311.0 2.69 301.5 2.19 307.1 lhaz 29.66°N 91.10°E 1.16 101.4 0.43 107.2 1.11 98.4 0.44 59.1 mal2 3.00°S 40.19°E 4.03 252.7 3.76 243.9 4.08 254.4 3.67 245.3 mald 4.19°N 73.53°E 2.41 52.0 2.66 104.4 2.35 49.1 2.63 103.2 mali 3.00°S 40.19°E 3.61 253.0 4.77 240.9 3.67 254.8 4.69 242.0 nnor 31.05°S 116.19°E 0.29 3.4 0.20 201.4 0.29 311.2 0.35 224.4 ntus 1.35°N 103.68°E 1.22 112.3 0.37 200.8 1.09 116.1 0.42 211.4 pert 31.80°S 115.89°E 0.17 357.6 0.18 136.0 0.25 285.8 0.20 197.3 pre1 25.75°S 28.22°E 1.82 245.0 2.36 259.3 1.92 248.1 2.35 261.9 pre2 25.75°S 28.22°E 1.78 232.9 2.37 252.9 1.85 236.6 2.34 255.5 rbay 28.80°S 32.08°E 3.68 261.0 4.71 256.2 3.82 262.0 4.71 257.3 rcmn 1.22°S 36.89°E 1.90 303.9 1.78 235.2 2.01 305.2 1.67 238.1 reun 21.21°S 55.57°E 1.34 110.8 0.33 129.4 1.17 112.3 0.24 124.5 sey1 4.67°S 55.48°E 2.91 194.9 2.68 226.4 2.88 197.7 2.62 228.0 suth 32.38°S 20.81°E 2.88 248.4 2.48 249.6 2.99 250.0 2.47 252.0 sutm 32.38°S 20.81°E 2.61 250.4 2.48 248.4 2.72 252.1 2.46 250.9 xmis 10.45°S 105.69°E 1.09 234.5 1.46 221.6 1.27 237.9 1.57 224.1 yar1 29.05°S 115.35°E 0.37 162.2 0.25 134.7 0.46 195.2 0.23 179.3 yar2 29.05°S 115.35°E 0.30 0.1 0.22 197.9 0.31 312.2 0.36 220.5 yar3 29.05°S 115.35°E 0.66 262.4 0.04 118.2 0.91 258.4 0.14 237.5 yarr 29.05°S 115.35°E 1.24 248.8 0.24 147.3 1.49 248.6 0.26 190.5 yibl 22.19°N 56.11°E 0.53 284.4 0.88 329.1 0.60 294.8 0.94 336.5 Note: Amp represents amplitude, Pha represents Greenwich phase-lag. Table 5. Comparison of GPS observations and tide models for the equatorial and Indian Ocean
FES2014 EOT11a GOT4.10c GOT4.8 NAO.99b M2 ΔH/mm 0.38 0.66 0.52 0.51 0.77 Δg/° 4.14 3.10 5.80 6.22 20.21 RMS/mm 0.61 ± 0.34 0.90 ± 0.37 0.97 ± 0.21 0.95 ± 0.21 1.79 ± 0.21 r2/% 99.78 99.53 99.46 99.47 98.15 S2 ΔH/mm 1.01 0.80 0.98 1.08 0.88 Δg/° 32.35 14.70 13.20 27.80 33.36 RMS/mm 1.53 ± 0.15 1.33 ± 0.13 1.55 ± 0.15 1.67 ± 0.22 1.70 ± 0.10 r2/% 95.22 96.28 95.09 94.32 94.14 K1 ΔH/mm 0.77 0.76 0.76 0.77 1.79 Δg/° 8.49 20.23 8.25 8.81 42.79 RMS/mm 1.33 ± 0.14 1.34 ± 0.17 1.30 ± 0.13 1.35 ± 0.10 3.51 ± 0.22 r2/% 96.82 95.89 96.97 96.76 78.03 O1 ΔH/mm 0.24 0.26 0.26 0.26 0.71 Δg/° 6.44 3.38 6.29 5.73 26.86 RMS/mm 0.49 ± 0.25 0.39 ± 0.30 0.51 ± 0.25 0.47 ± 0.24 1.76 ± 0.23 r2/% 99.02 99.26 98.96 99.10 87.50 N2 ΔH/mm 0.13 0.15 0.14 0.15 0.25 Δg/° 3.61 2.88 3.14 3.83 16.75 RMS/mm 0.21 ± 0.40 0.24 ± 0.32 0.25 ± 0.40 0.26 ± 0.38 0.44 ± 0.18 r2/% 99.38 99.18 99.11 99.05 97.21 K2 ΔH/mm 0.28 0.23 0.29 0.35 0.28 Δg/° 19.37 9.78 16.14 40.51 39.36 RMS/mm 0.47 ± 0.72 0.39 ± 0.79 0.52 ± 0.67 0.56 ± 0.63 0.56 ± 0.61 r2/% 94.30 96.06 93.10 91.88 91.89 P1 ΔH/mm 0.41 0.40 0.43 0.43 0.59 Δg/° 11.48 16.76 12.02 12.19 42.94 RMS/mm 0.67 ± 0.26 0.69 ± 0.25 0.70 ± 0.22 0.71 ± 0.19 1.22 ± 0.25 r2/% 92.80 89.98 92.15 91.86 76.26 Q1 ΔH/mm 0.08 0.07 0.06 0.07 0.16 Δg/° 6.43 4.08 8.48 6.71 19.28 RMS/mm 0.15 ± 0.49 0.13 ± 0.49 0.15 ± 0.48 0.14 ± 0.49 0.35 ± 0.38 r2/% 98.36 98.56 98.36 98.56 91.16 RSS 2.34 2.29 2.48 2.58 4.86 -
Aleem A A. 1967. Concepts of currents, tides and winds among medieval Arab geographers in the Indian Ocean. Deep-Sea Research and Oceanographic Abstracts, 14(4): 459–463, doi: 10.1016/0011-7471(67)90052-6 Fang Guohong, Xu Xiaoqing, Wei Zexun, et al. 2013. Vertical displacement loading tides and self-attraction and loading tides in the Bohai, Yellow, and East China Seas. Science China Earth Sciences, 56(1): 63–70, doi: 10.1007/s11430-012-4518-9 Iliffe J C, Ziebart M K, Turner J F, et al. 2013. Accuracy of vertical datum surfaces in coastal and offshore zones. Survey Review, 45(331): 254–262, doi: 10.1179/1752270613Y.0000000040 Ito T, Okubo M, Sagiya T. 2009. High resolution mapping of Earth tide response based on GPS data in Japan. Journal of Geodynamics, 48(3-5): 253–259, doi: 10.1016/j.jog.2009.09.012 Le Provost C L, Lyard F. 1993. Towards a detailed knowledge of the world ocean tides: the example of the Kerguelen Plateau. Geophysical Research Letters, 20(14): 1519–1522, doi: 10.1029/93GL01308 Liu Jingdong, Zhang Wenjing, Liu Chunxiao, et al. 2019. An assessment of tidal prediction by global ocean tide models in the North Indian Ocean. Marine Science Bulletin (in Chinese), 38(2): 159–166, doi: 10.11840/j.issn.1001-6392.2019.02.005 Lyard F H, Allain D J, Cancet M, et al. 2021. FES2014 global ocean tide atlas: design and performance. Ocean Science, 17(3): 615–649, doi: 10.5194/os-17-615-2021 Maraldi C, Galton-Fenzi B, Lyard F, et al. 2007. Barotropic tides of the southern Indian Ocean and the Amery Ice Shelf Cavity. Geophysical Research Letters, 34(18): L18602, doi: 10.1029/2007GL030900 Matsumoto K, Takanezawa T, Ooe M. 2000. Ocean tide models developed by assimilating TOPEX/POSEIDON altimetry data into hydrodynamical model: a global model and a regional model around Japan. Journal of Oceanography, 56(5): 567–581, doi: 10.1023/A:1011157212596 Munk W H, Cartwright D E. 1966. Tidal spectroscopy and prediction. Philosophical Transactions of the Royal Society A: Mathematical, Physical and Sciences, 259(1105): 533–581, doi: 10.1098/rsta.1966.0024 Pan Haidong, Xu Xiaoqing, Zhang Huayi, et al. 2023. A novel method to improve the estimation of ocean tide loading displacements for K1 and K2 components with GPS observations. Remote Sensing, 15(11): 2846, doi: 10.3390/rs15112846 Pugh D. 1979. Sea levels at Aldabra Atoll, Mombasa and Mahé, western equatorial Indian Ocean, related to tides, meteorology and ocean circulation. Deep-Sea Research Part A. Oceanographic Research Papers, 26(3): 237–258, doi: 10.1016/0198-0149(79)90022-0 Ray R D. 2013. Precise comparisons of bottom-pressure and altimetric ocean tides. Journal of Geophysical Research: Oceans, 118(9): 4570–4584, doi: 10.1002/jgrc.20336 Savcenko R, Bosch W. 2012. EOT11A-empirical ocean tide model from multi-mission satellite altimetry. München: Deutsches Geodätisches Forschungsinstitut, 49 Seifi F, Deng X L, Baltazar Andersen O. 2019. Assessment of the accuracy of recent empirical and assimilated tidal models for the Great Barrier Reef, Australia, using satellite and coastal data. Remote Sensing, 11(10): 1211, doi: 10.3390/rs11101211 Shum C K, Woodworth P L, Andersen O B, et al. 1997. Accuracy assessment of recent ocean tide models. Journal of Geophysical Research: Oceans, 102(C11): 25173–25194, doi: 10.1029/97JC00445 Visser P N A M, Sneeuw N, Reubelt T, et al. 2010. Space-borne gravimetric satellite constellations and ocean tides: aliasing effects. Geophysical Journal International, 181(2): 789–805, doi: 10.1111/j.1365-246X.2010.04557.x Wan Rongqiang, Wei Zexun, Gao Xiumin, et al. 2020. Numerical simulation of semi-diurnal tidal waves in the northern Indian ocean. Advances in Marine Science (in Chinese), 38(4): 562–573, doi: 10.3969/j.issn.1671-6647.2020.04.002 Wei Guoguang, Chen Kejie, Ji Run. 2022. Improving estimates of ocean tide loading displacements with multi-GNSS: a case study of Hong Kong. GPS Solutions, 26(1): 25, doi: 10.1007/s10291-021-01212-0 Wei Guoguang, Wang Qijie, Peng Wei. 2019. Accurate evaluation of vertical tidal displacement determined by GPS kinematic precise point positioning: a case study of Hong Kong. Sensors, 19(11): 2559, doi: 10.3390/s19112559 Xu Xiaoqing, Wei Zexun, Teng Fei, et al. 2022. Vertical displacement loading tides and self-attraction and loading tides in the South China Sea and adjacent straits. Haiyang Xuebao (in Chinese), 44(7): 17–24, doi: 10.12284/hyxb2022112 Yuan Linguo, Chao B F, Ding Xiaoli, et al. 2013. The tidal displacement field at earth’s surface determined using global GPS observations. Journal of Geophysical Research: Solid Earth, 118(5): 2618–2632, doi: 10.1002/jgrb.50159 Zetler B D. 1971. Radiational ocean tides along the coasts of the United States. Journal of Physical Oceanography, 1(1): 34–38, doi: 10.1175/1520-0485(1971)001<0032:ROTATC>2.0.CO;2 -

 点击查看大图
计量
- 文章访问数: 99
- HTML全文浏览量: 41
- 被引次数: 0


 下载:
下载:

