Contribution of the winter salinity barrier layer to summer ocean-atmosphere variability in the Bay of Bengal
-
Abstract: It is found that the winter (December–February) barrier layer (BL) in the Bay of Bengal (BoB) acts as a dynamical thermostat, modulating the subsequent summer BoB sea surface temperature (SST) variability and potentially affecting the Indian summer monsoon (ISM) onset and associated rainfall variability. In the years when the prior winter BL is anomalously thick, anomalous sea surface cooling caused by intensified latent heat flux loss appears in the BoB starting in October and persists into the following year by positive cloud-SST feedback. During January–March, the vertical entrainment of warmer subsurface water induced by the anomalously thick BL acts to damp excessive cooling of the sea surface caused by atmospheric forcing and favors the development of deep atmospheric convection over the BoB. During March–May, the thinner mixed layer linked to the anomalously thick BL allows more shortwave radiation to penetrate below the mixed layer. This tends to maintain existing cold SST anomalies, advancing the onset of ISM and enhancing June ISM precipitation through an increase in the land-sea tropospheric thermal contrast. We also find that most of the coupled model intercomparison project phase 5 (CMIP5) models fail to reproduce the observed relationship between June ISM rainfall and the prior winter BL thickness. This may be attributable to their difficulties in realistically simulating the winter BL in the BoB and ISM precipitation. The present results indicate that it is important to realistically capture the winter BL of the BoB in climate models for improving the simulation and prediction of ISM.
-
Key words:
- Bay of Bengal /
- barrier layer /
- Indian summer monsoon /
- rainfall /
- CMIP5
-
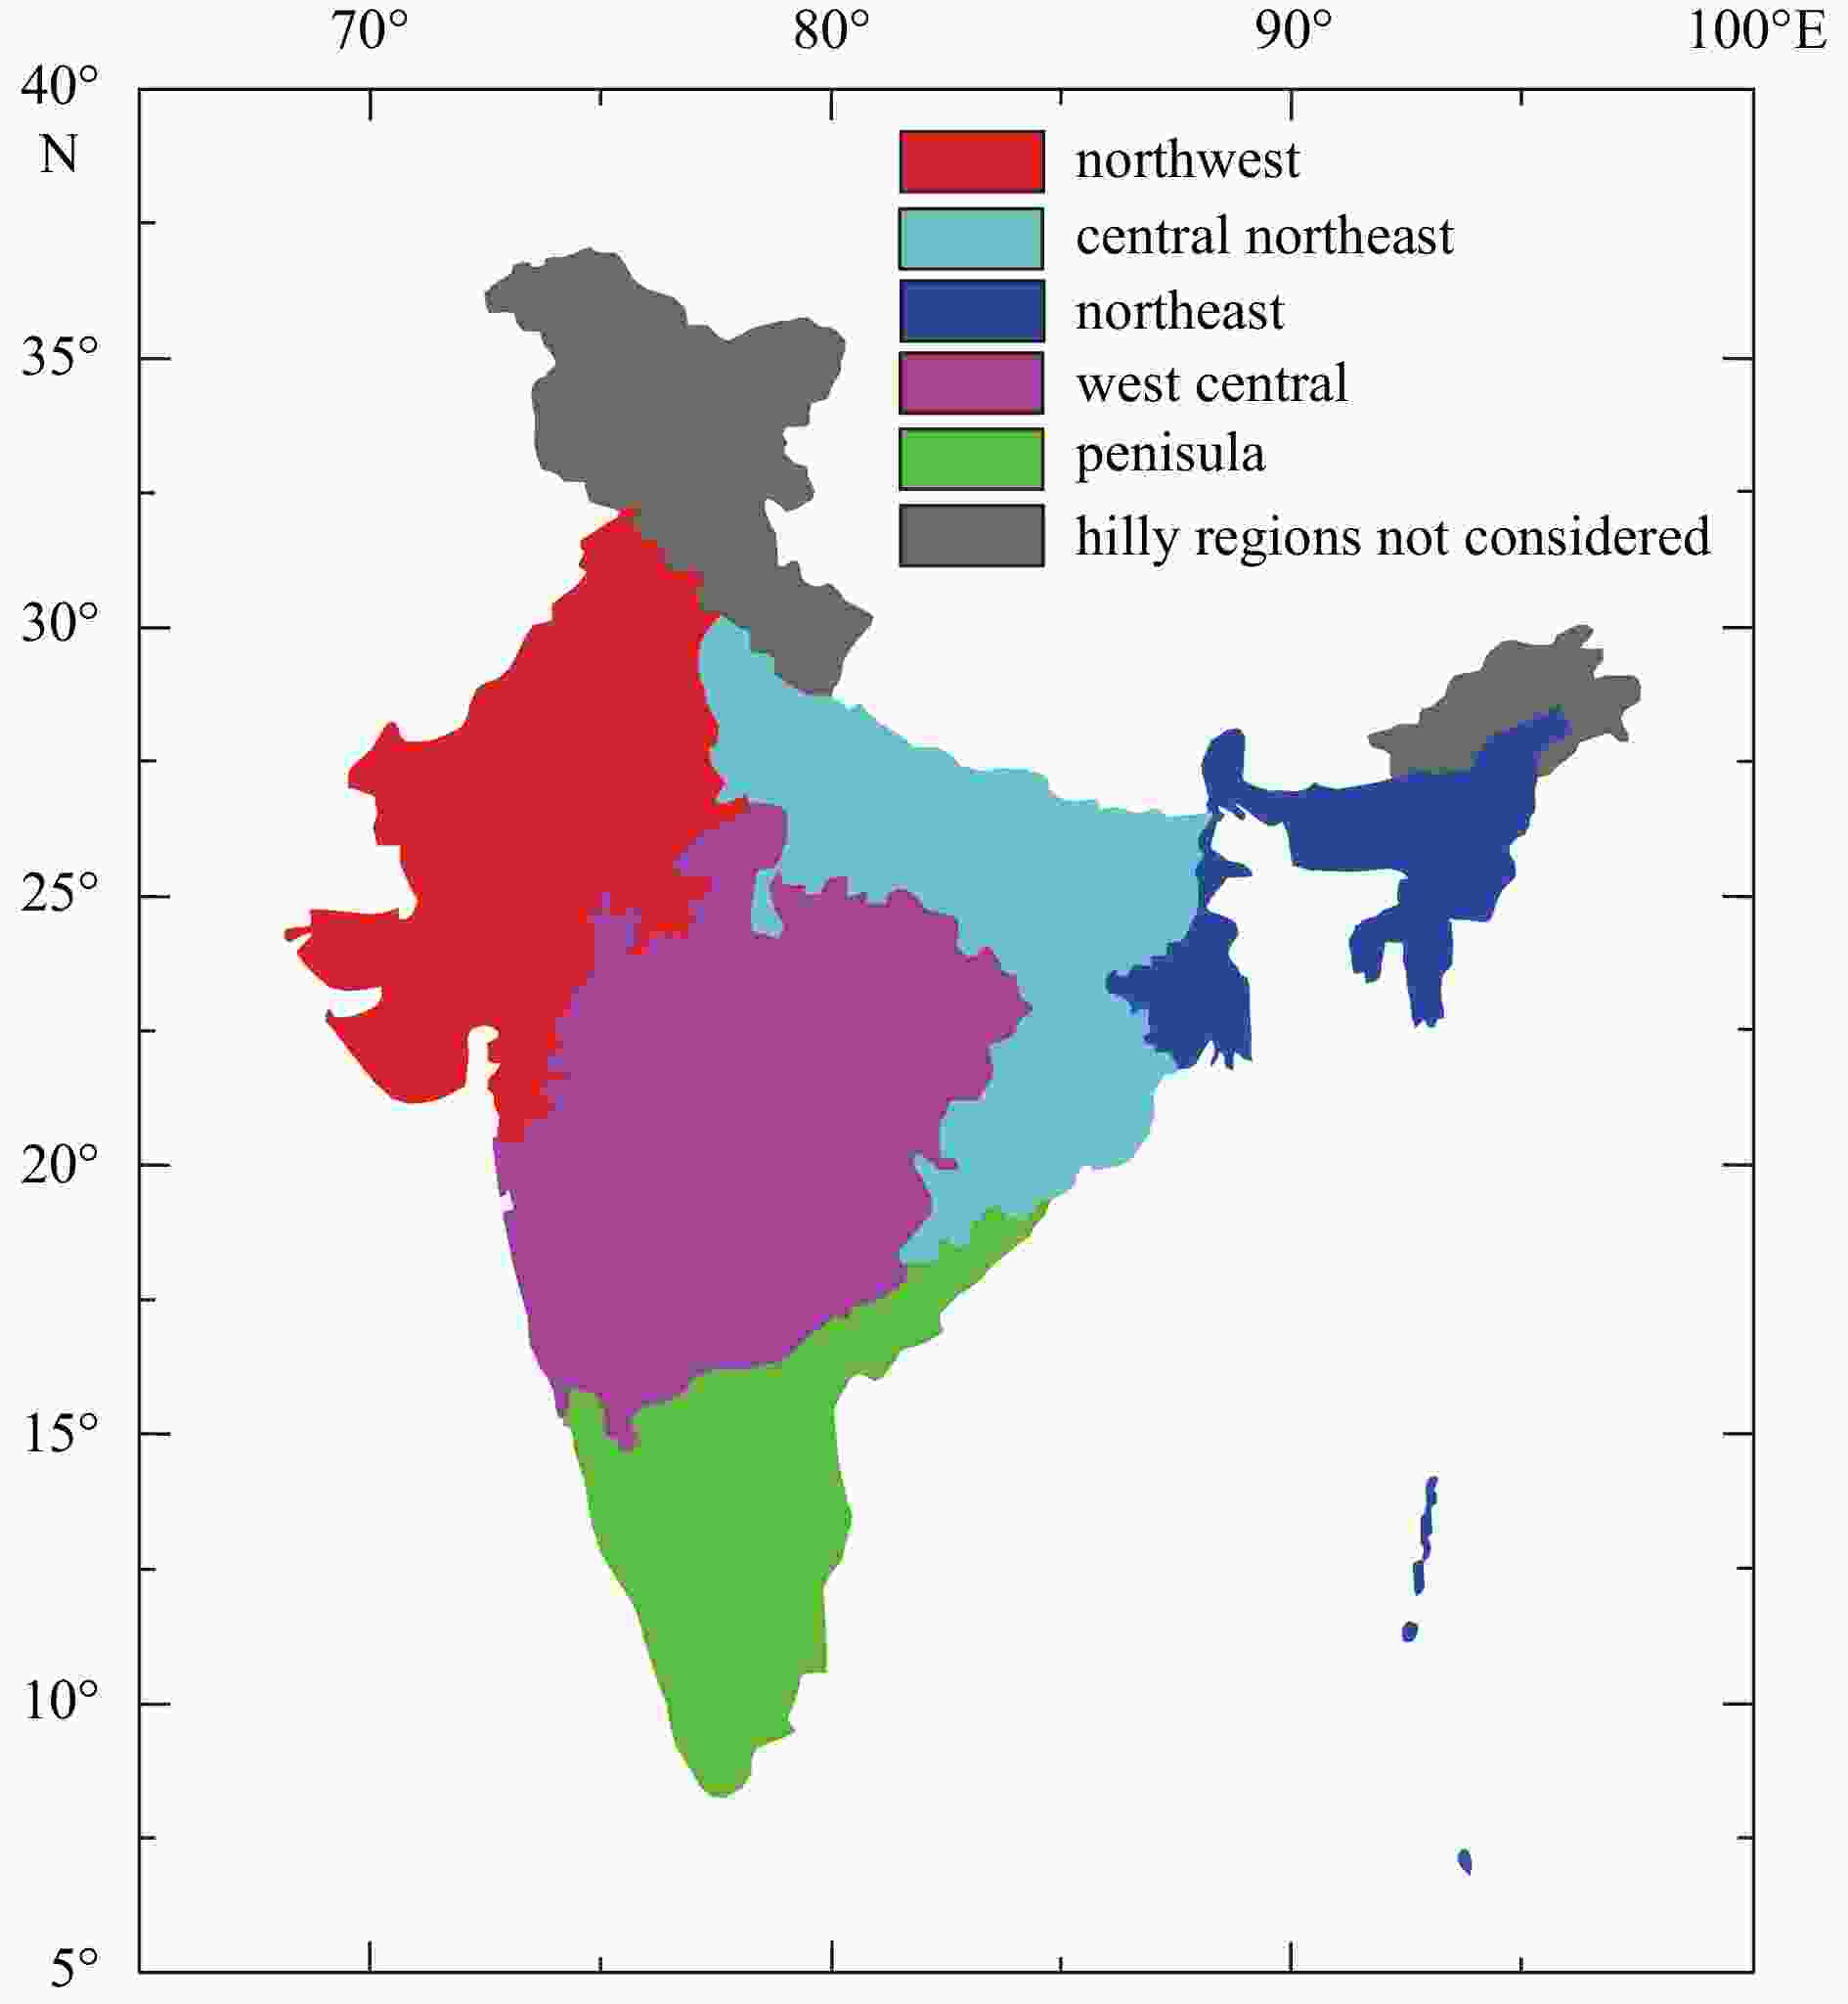
Figure 2. Different regions of India. The map is modified after reference (Kothawale and Rajeevan, 1995).
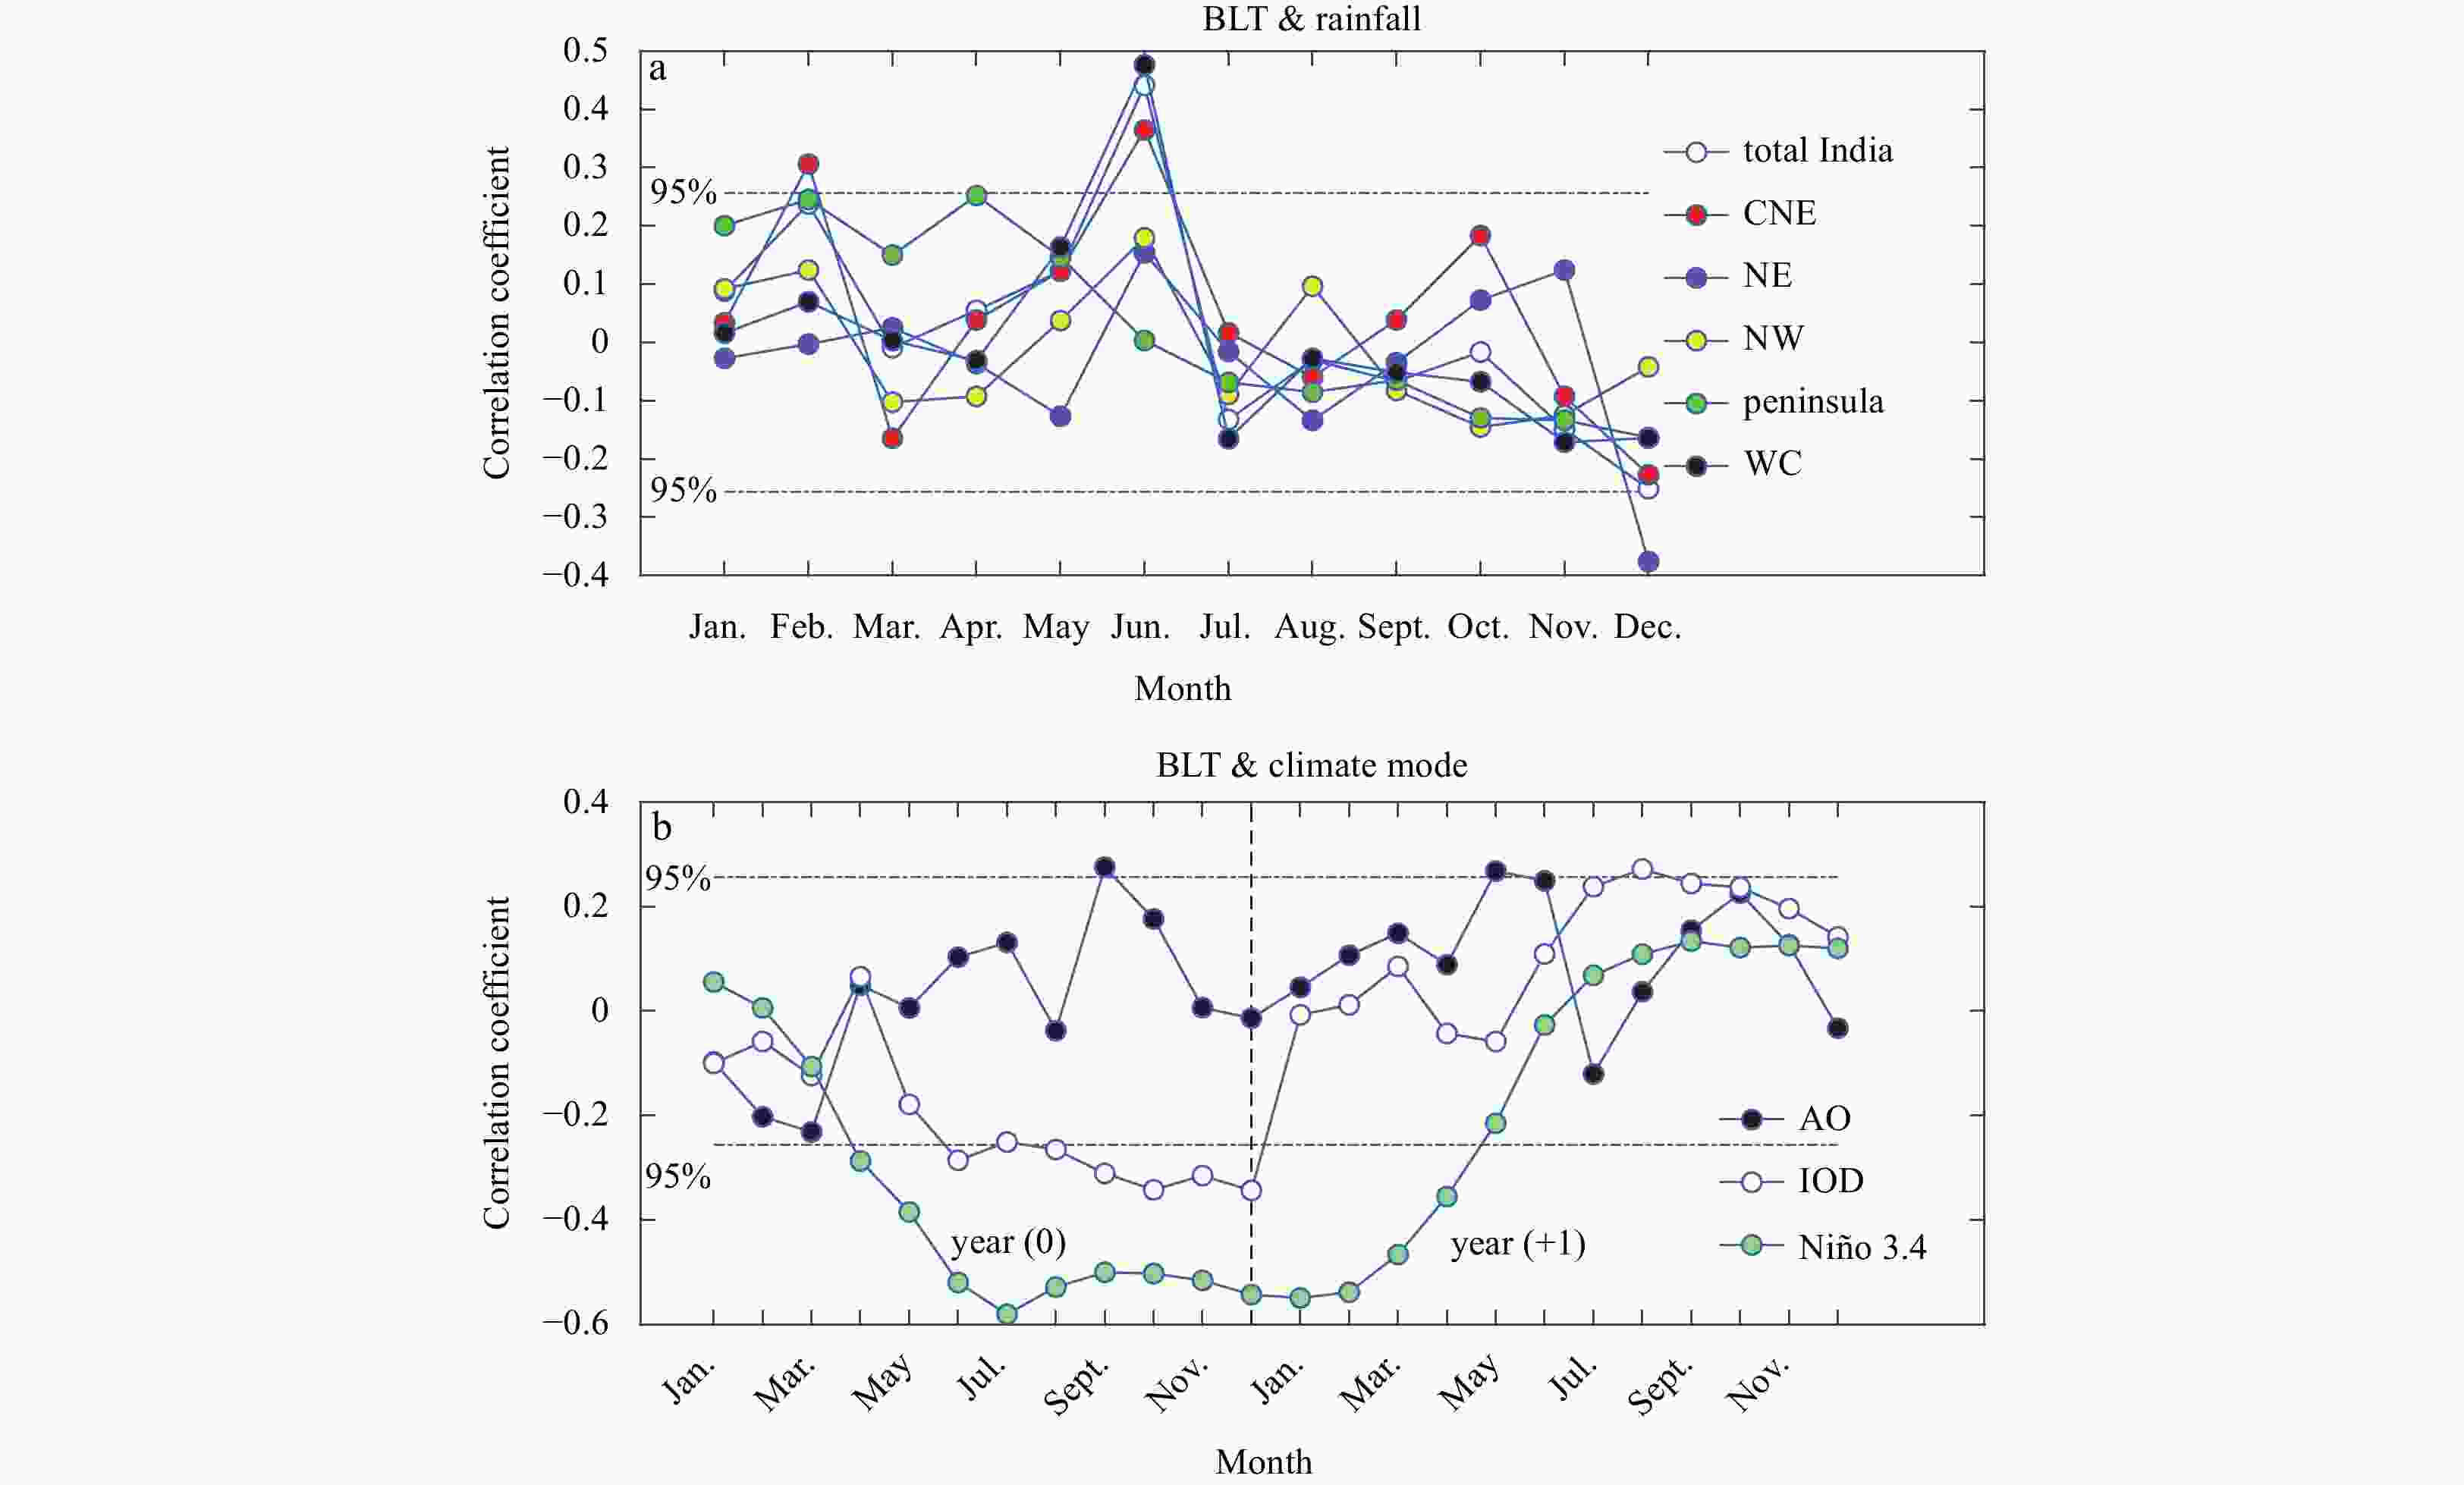
Figure 3. Pearson’s correlation coefficients between DJF BLT averaged over BoB and subsequent rainfall in total India (white dots), central northeast India (CNE, red dots), northeast India (NE, purple dots), northwest India (NW, yellow dots), peninsular India (cyan dots), and west central India (WC, black dots) (a) and Pearson’s correlation coefficients between DJF BLT and each month’s AO index (black dots), IOD index (white dots), and Niño 3.4 index (cyan dots) in the year (0) and year (+1) (b). The current period is from 1952 to 2010, and the earlier period is from 1951 to 2009. The black lines (chain dotted) denote 95% confidence level.
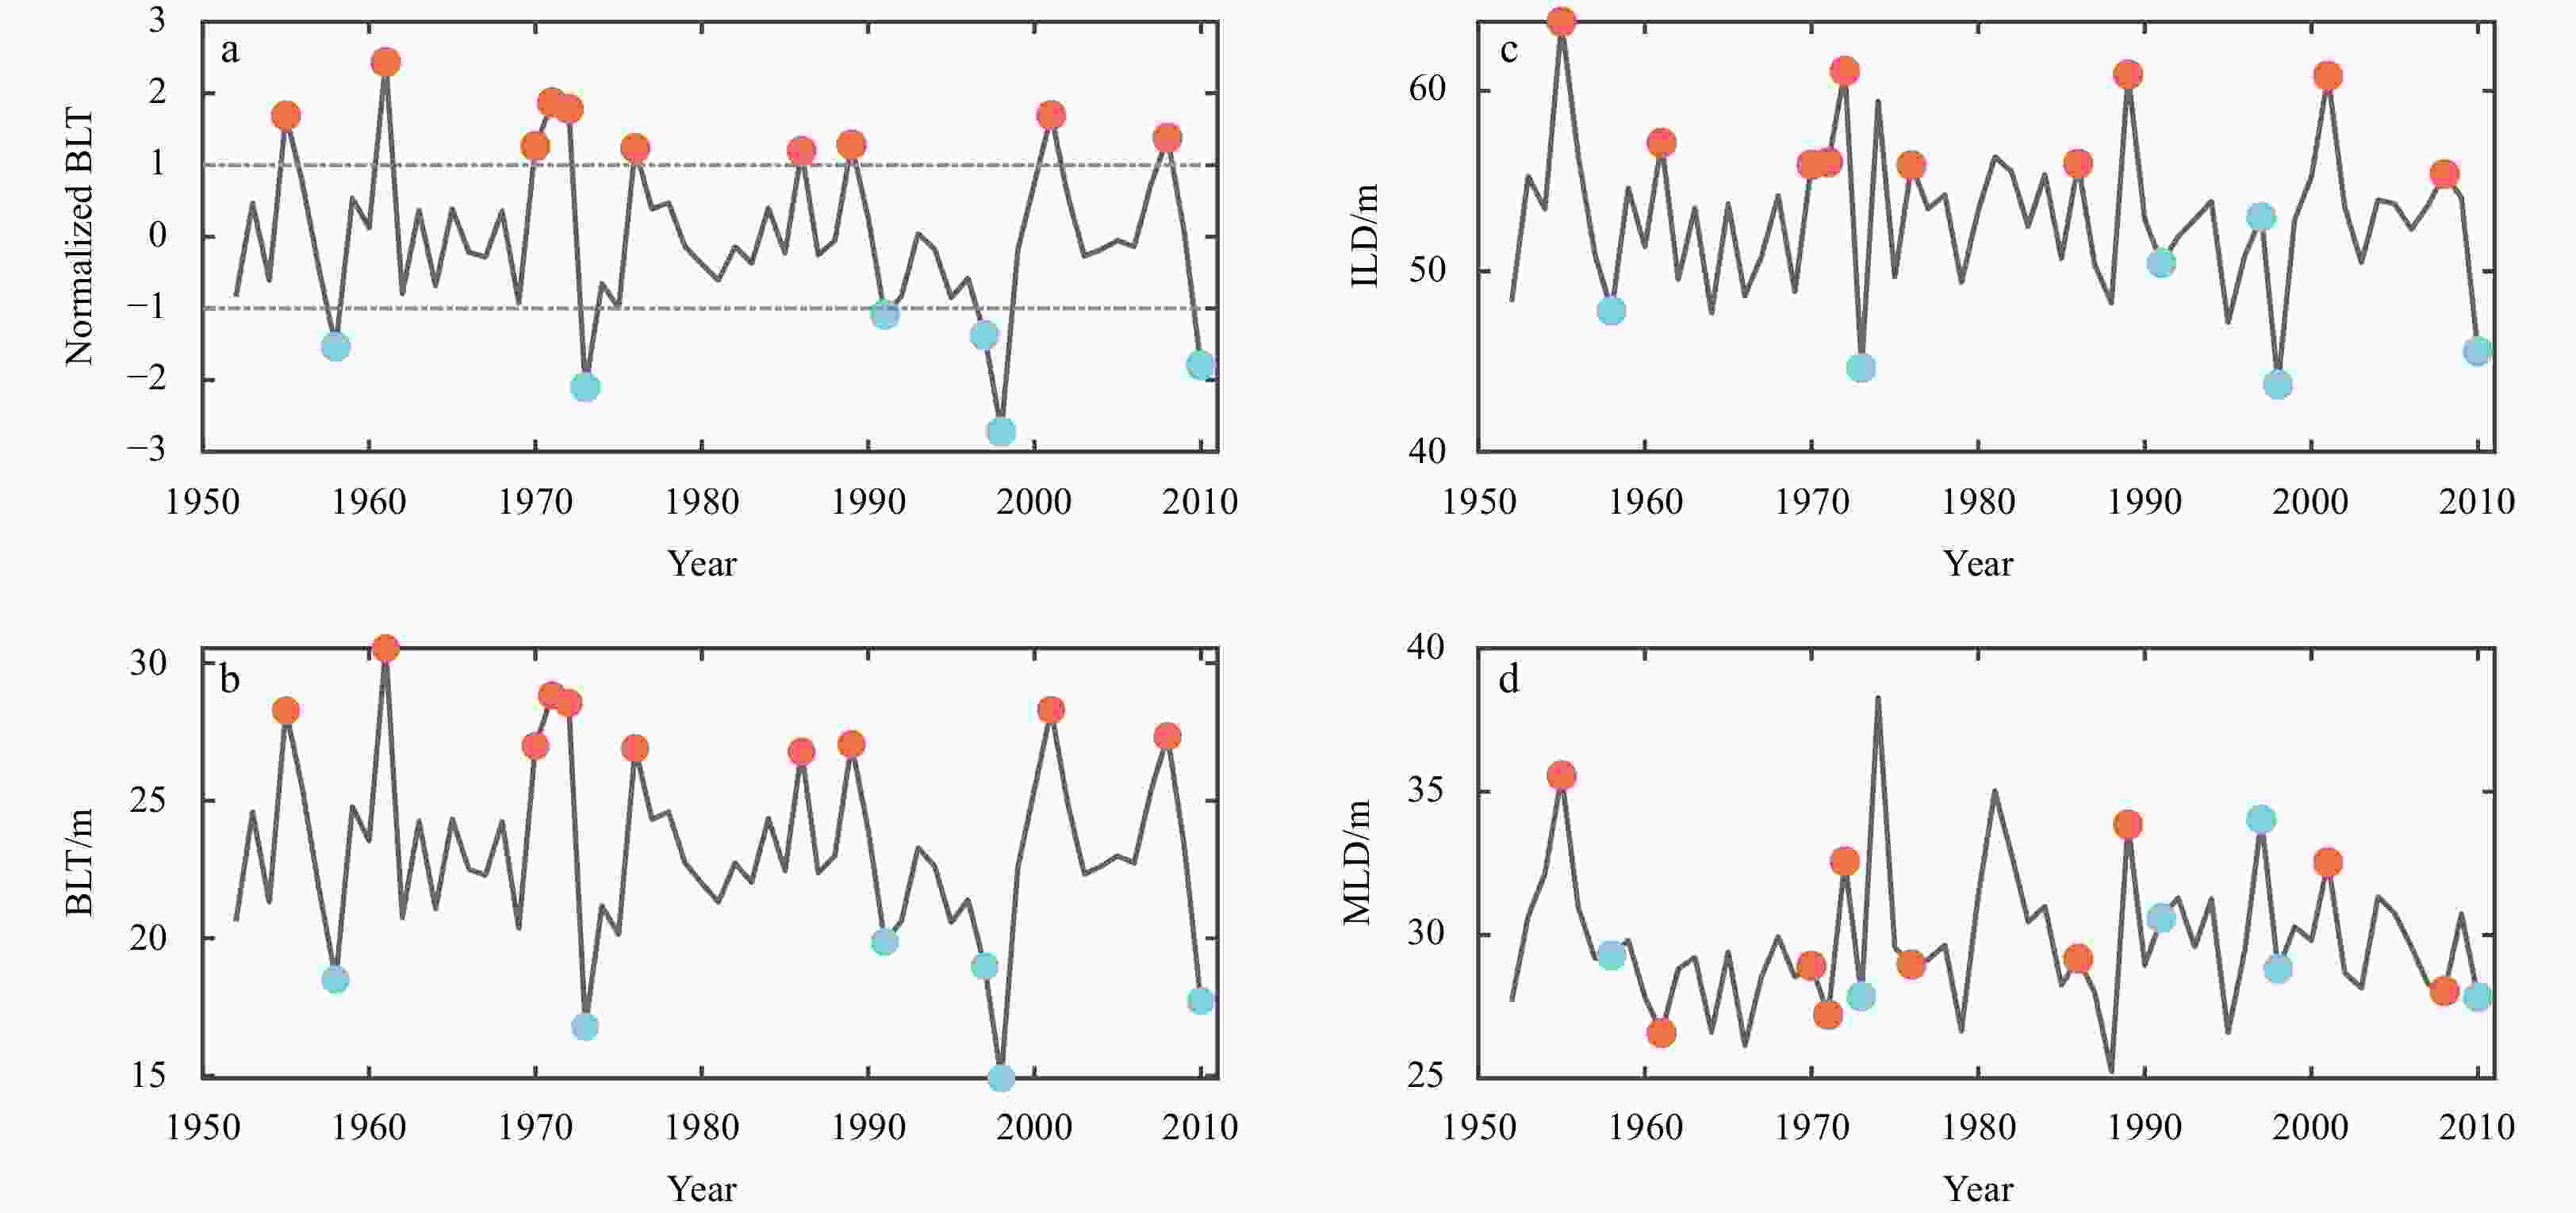
Figure 5. BLT normalized by its mean and standard deviation (a), and BLT (b), ILD (c), and MLD (d) averaged over the BoB (5°–25°N, 75°–95°E) in December–February from 1951 to 2010. When the BLT averaged over December–February is higher (lower) than one standard deviation, it is defined as a thick (thin) BL year. The grey chain dotted lines denote one standard deviation. The red (cyan) dots denote the thick (thin) BL years.
Figure 6. Seasonal evolution of meridional gradient of the daily tropospheric air temperature (℃) in 200–500 hPa over the region of (10°–20°N, 90°–110°E) (a), and meridional difference of the daily tropospheric air temperature (℃) in 200–500 hPa between a northern box (5°–35°N, 30°–110°E) and a southern box (15°S–5°N, 30°–110°E) (b) from April to July, for climatology (black dashed lines), year (+1) of prior winter thick BL years (red lines) and thin BL years (blue lines) (b).
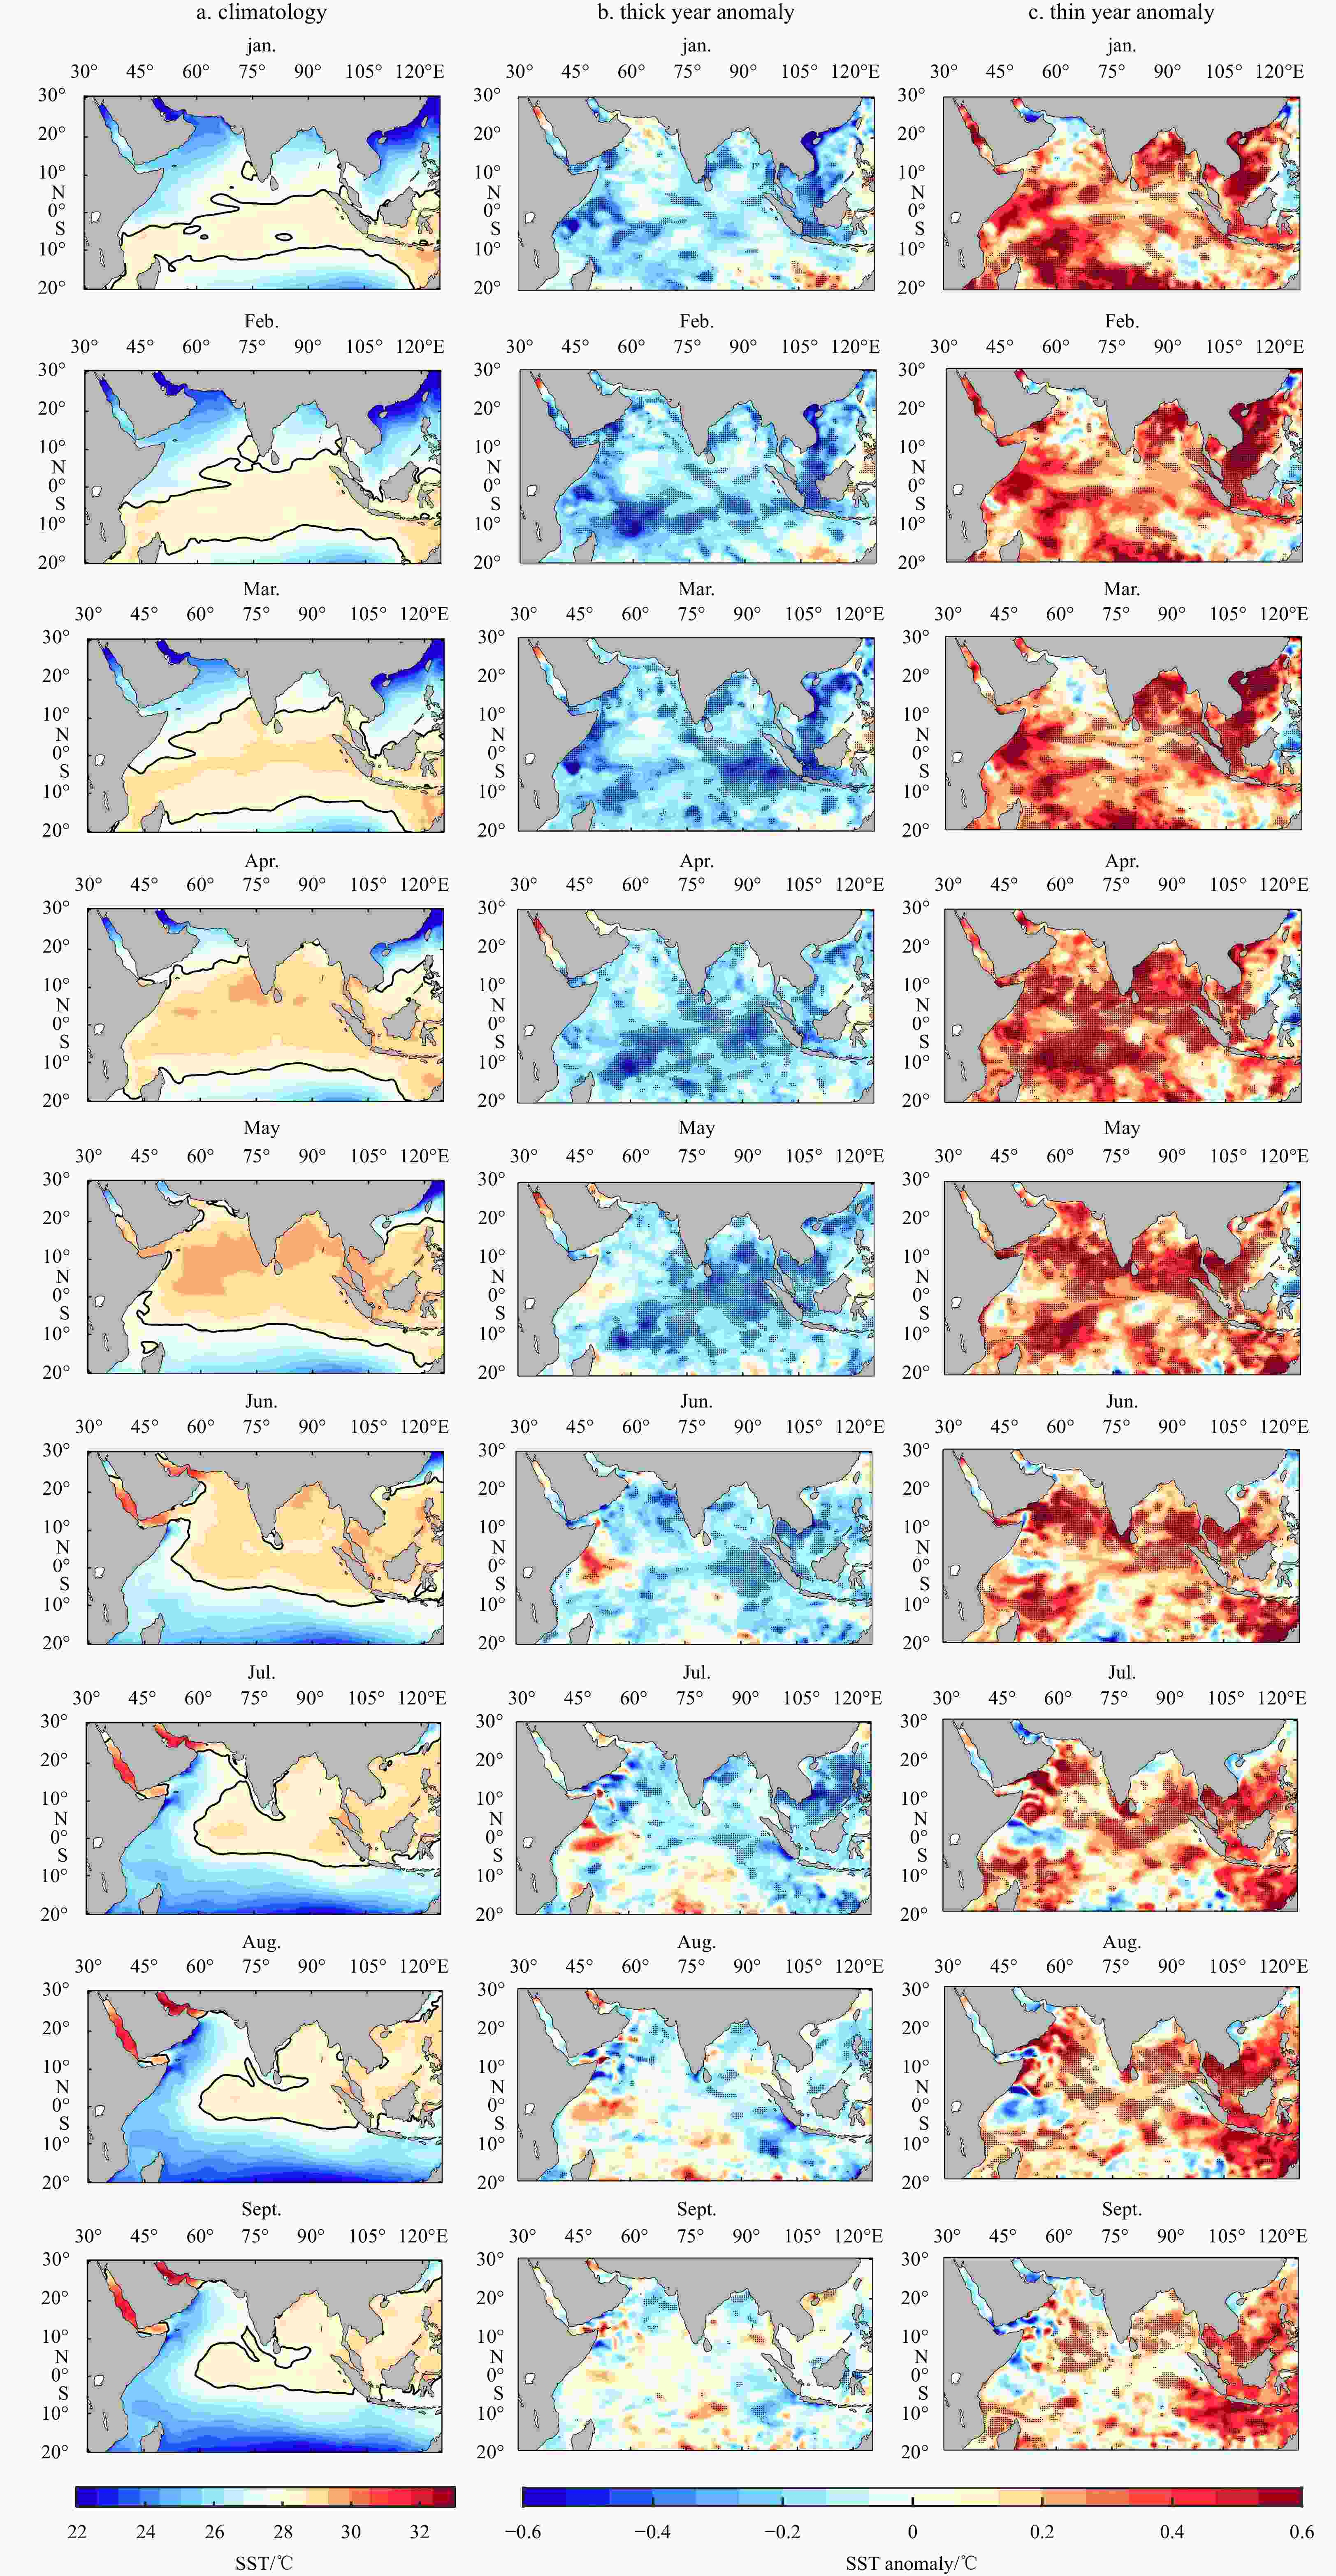
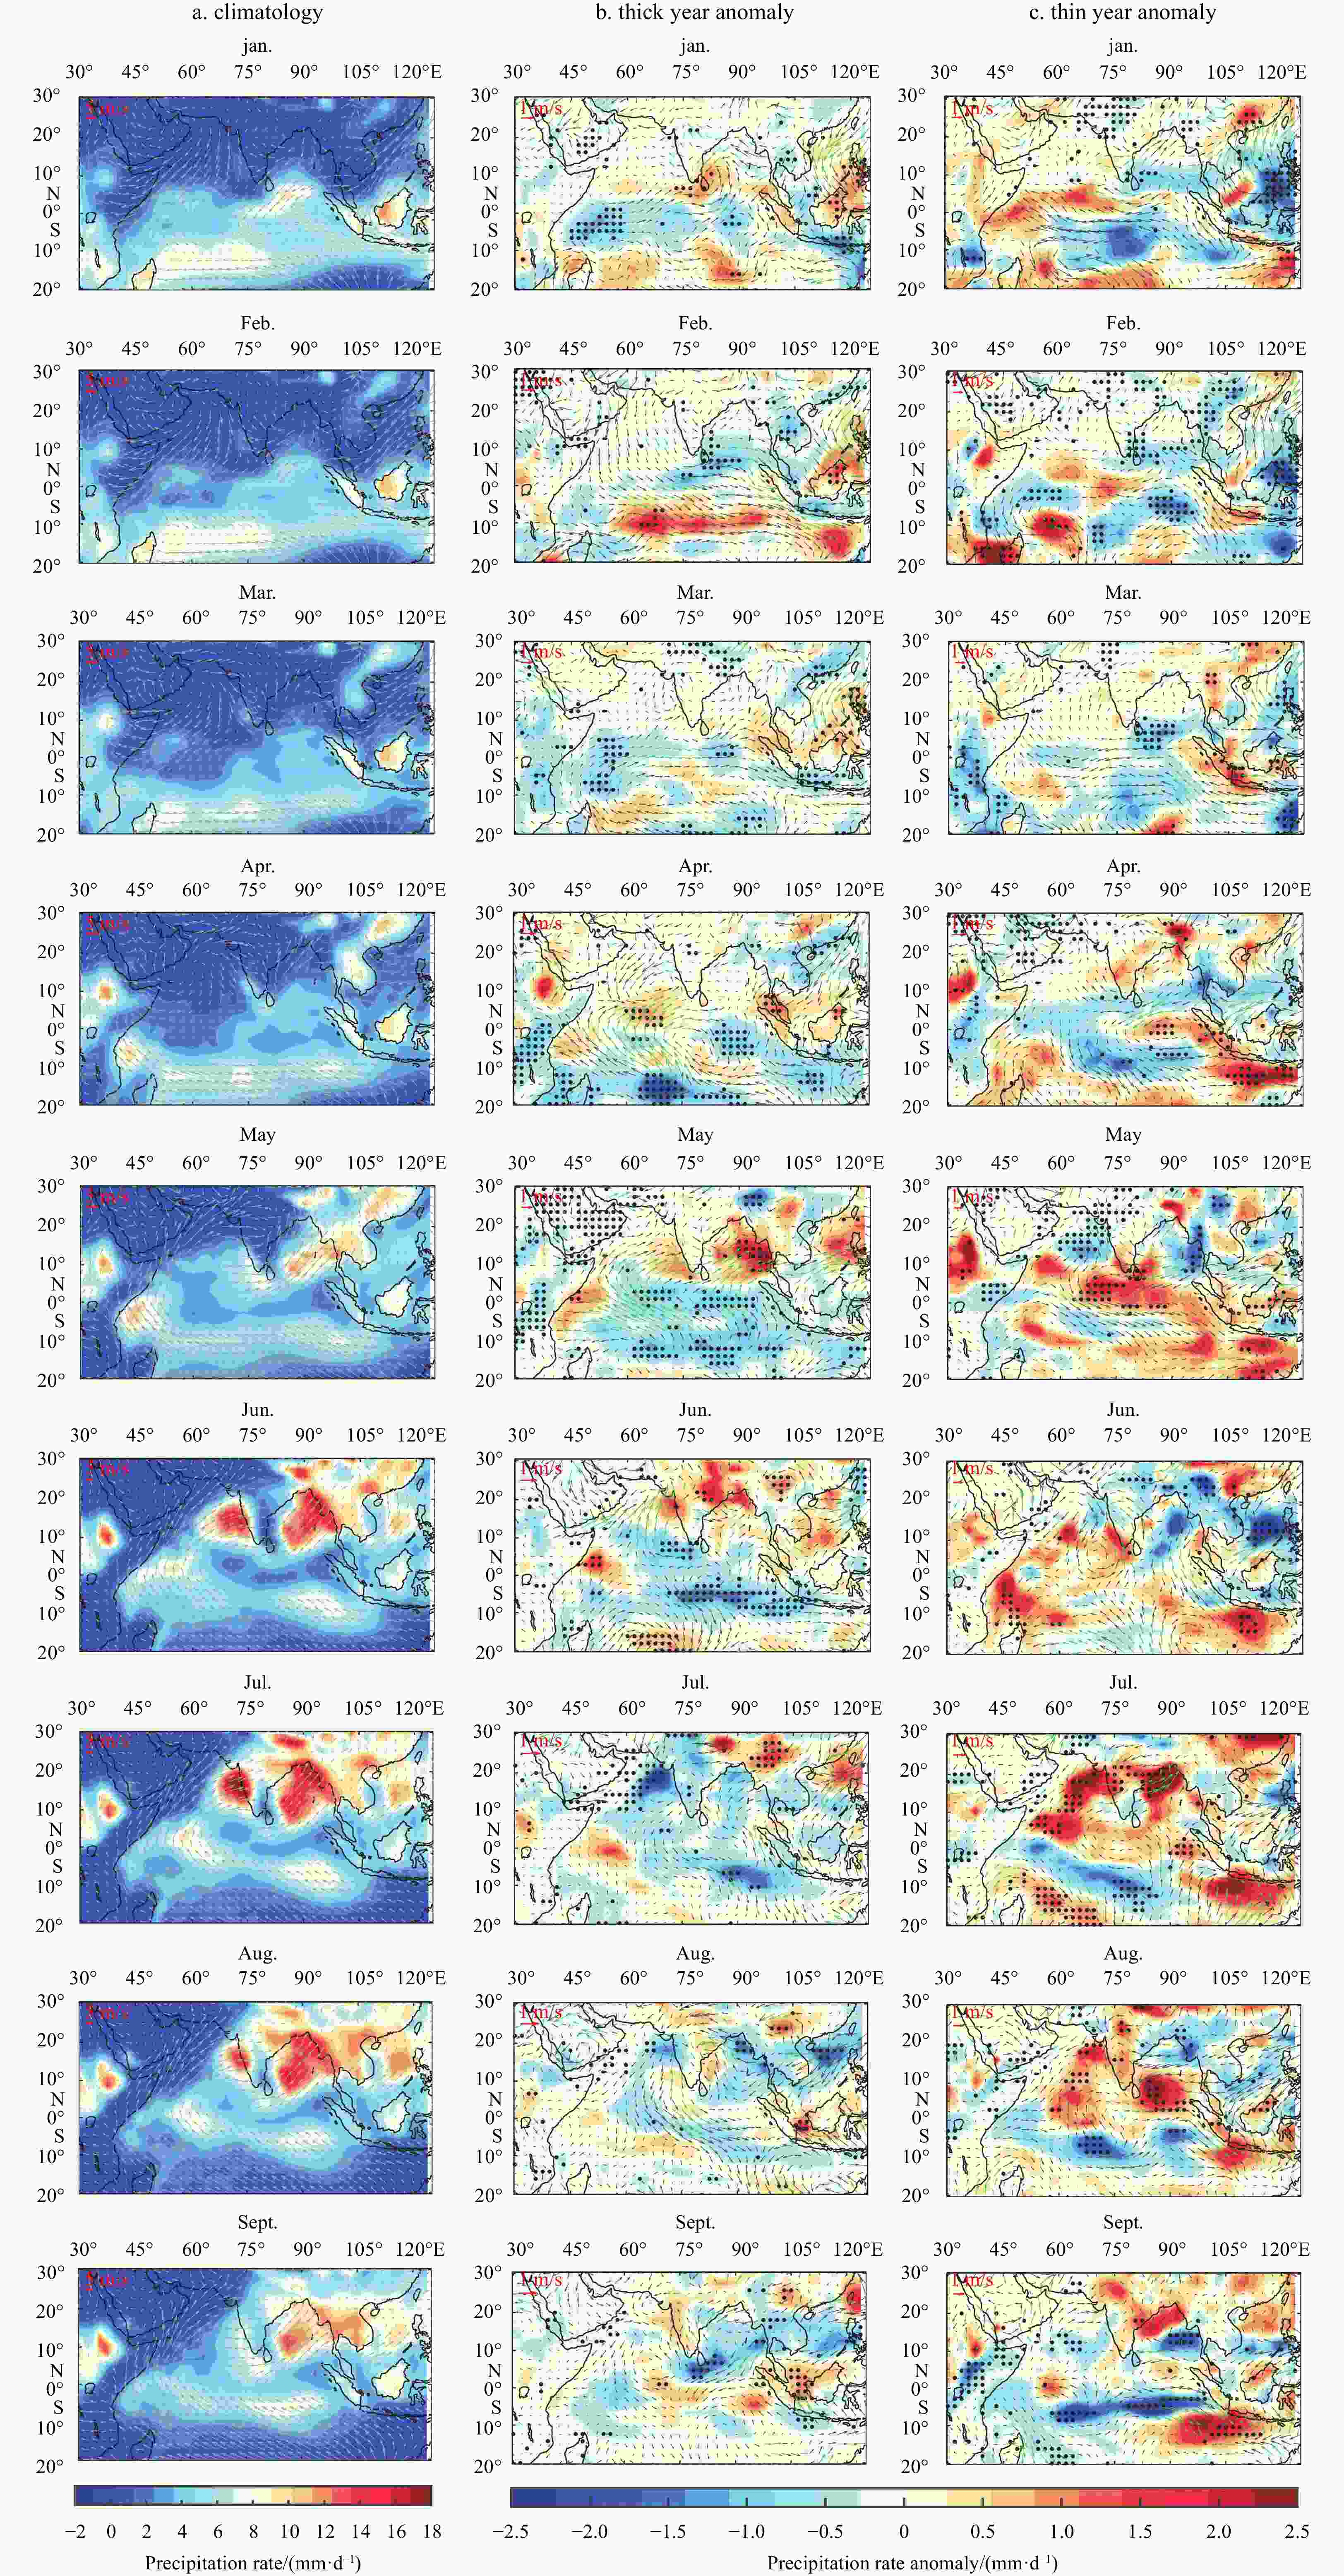
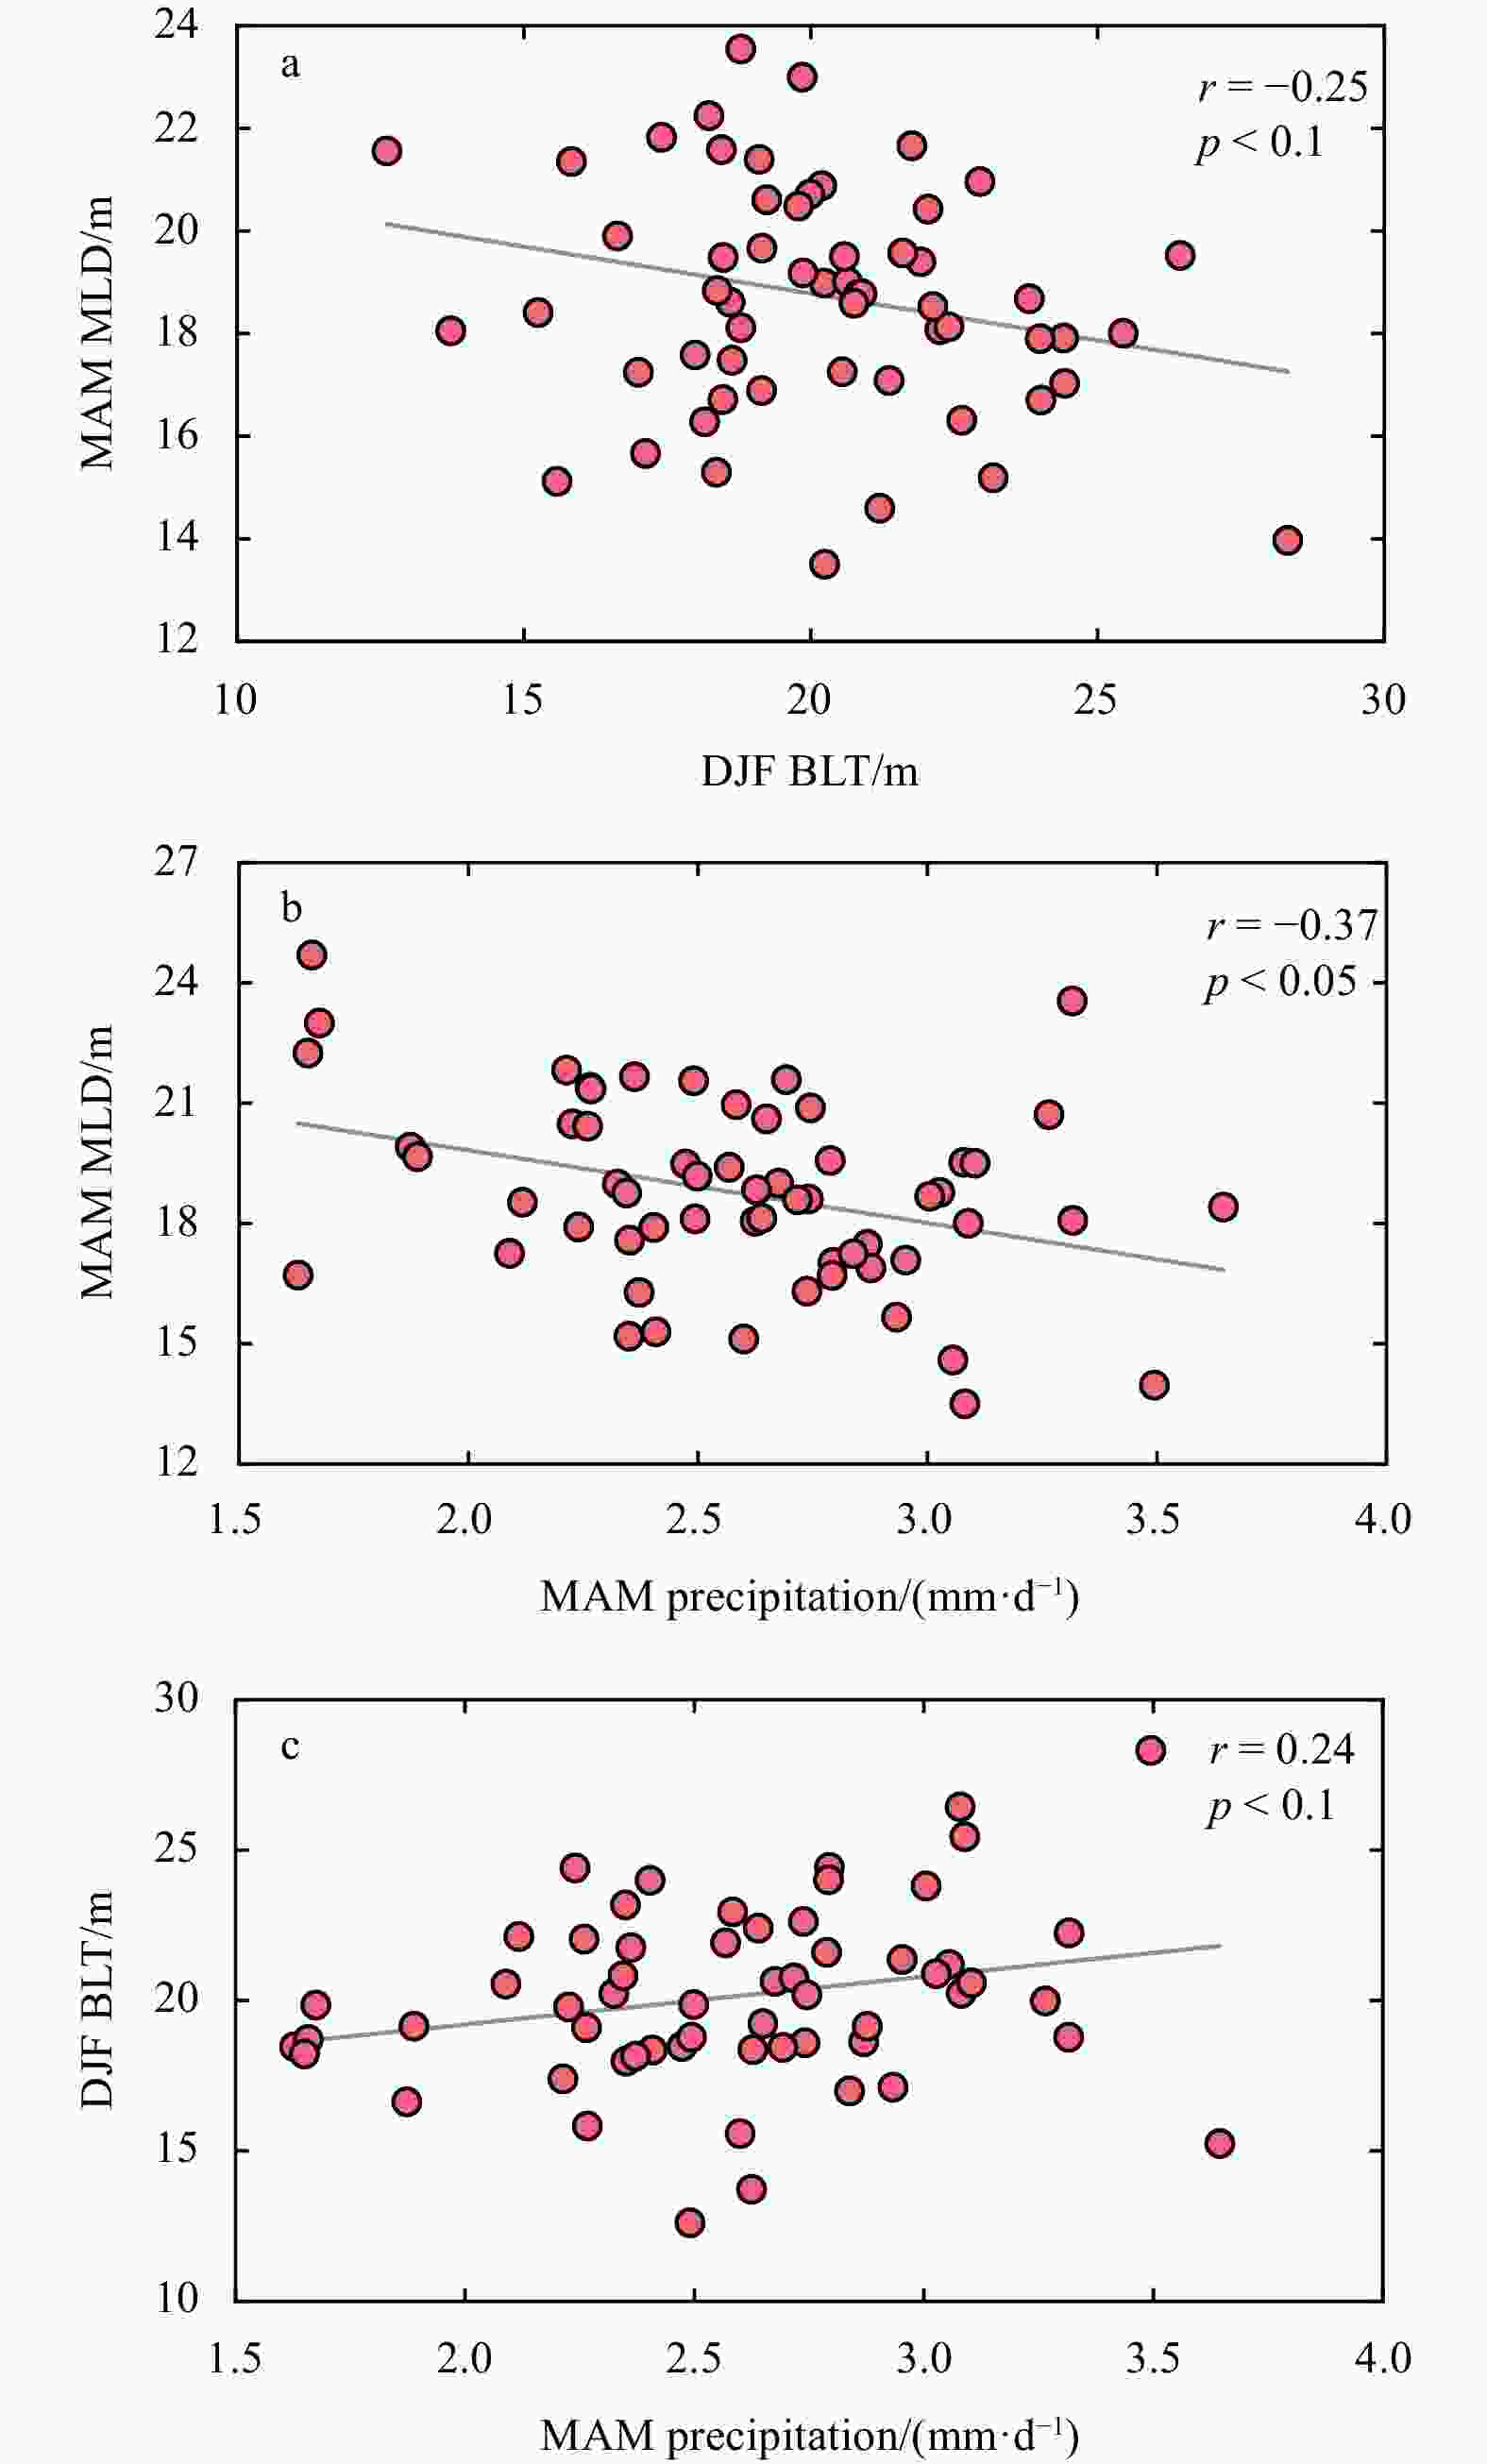
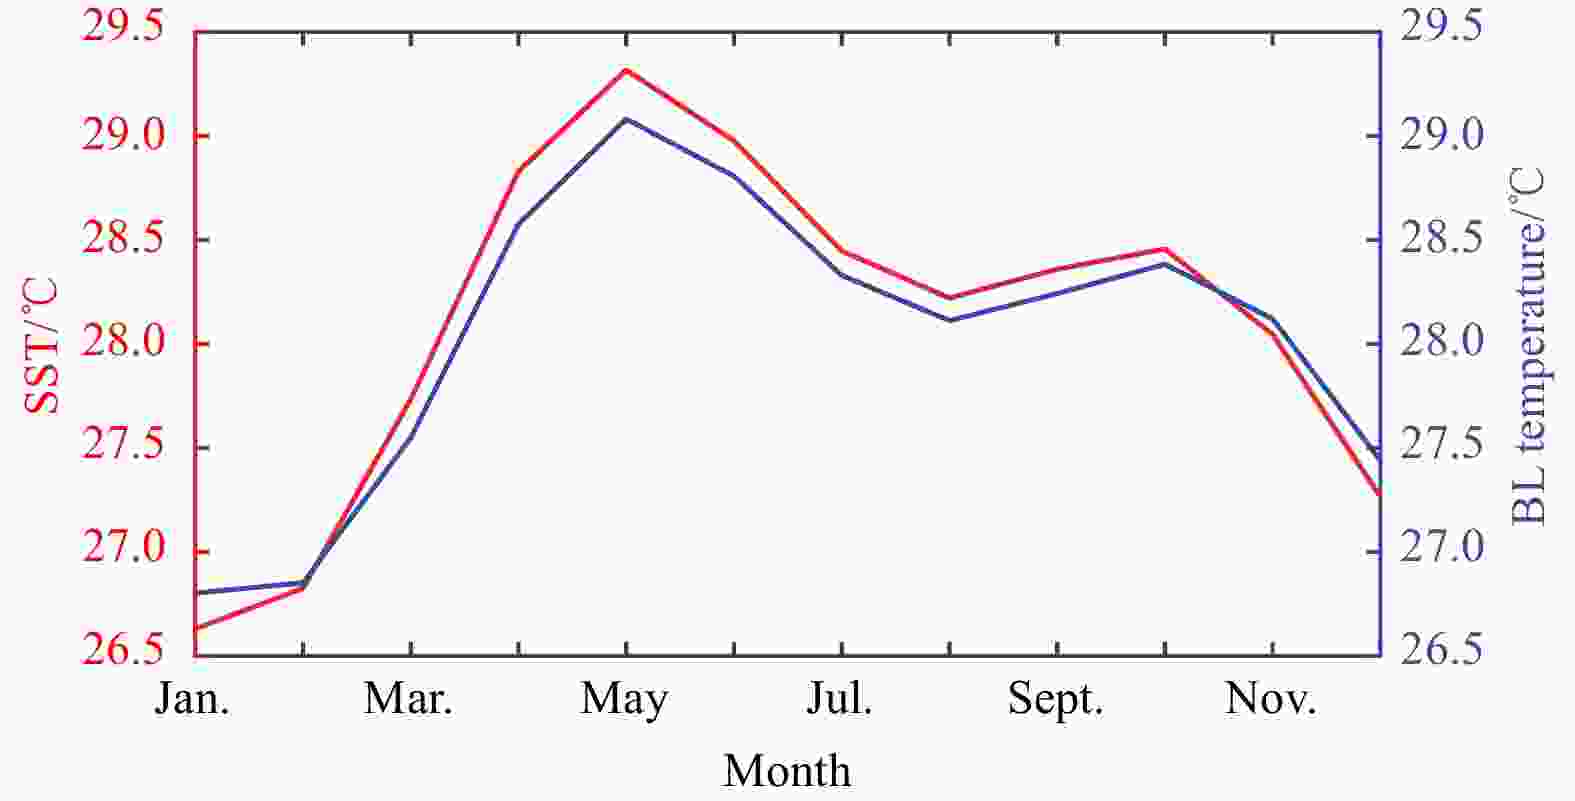
Figure 8. Seasonal evolution of SST (℃) averaged over BoB (a) and land-sea thermal contrast in the tropospheric (200–500 hPa average) temperature (b) from January to December, for climatology (black solid lines), year (+1) of prior winter thick BL years (red lines) and thin BL years (blue lines); and composite of moisture flux [kg/(m·s)] anomalies averaged over April (+1)–June (+1) for prior winter thick BL years (c) and thin BL years (d); and scatterplots between June (+1) moisture flux convergence [×105 kg/(m2·s)] averaged over India (10°–30°N, 70°–90°E) and DJF BLT (m) averaged over the BoB (e) and June (+1) precipitation (mm) averaged over India (f). In a and b, the land-sea thermal contrast in the troposphere (200–500 hPa) is estimated as the difference in the values between the boxes over the South Tibetan Plateau (25°–40°N, 65°–95°E) and the BoB (5°–25°N, 75°–95°E). The definition of land-sea thermal contrast follows Li and Xiao (2021). The black chain dotted line denotes the temperature of 28℃. The triangles denote statistical significance at the 90% confidence level by two-tailed Student’s t test. In b and c, the red arrows denote statistical significance at the 90% confidence level by two–tailed Student’s t test. In e and f, the gray lines indicate the least-squared fits and the correlation coefficients (r) are statistically significant at the 95% confidence level.
Figure 10. Anomalous evolution of net heat flux (a), net shortwave radiation flux (b), penetrative shortwave radiation flux (c), longwave radiation flux (d), sensible heat flux (e), latent heat flux (f), SST (g), mixed layer depth (MLD, h), total cloud cover (TCDC, i), and wind speed (j), averaged over the BoB from September (0) to September (+1), for prior winter thick BL years (blue bars) and thin BL years (red bars). Note that Y-axis ranges in a–f are inconsistent. The red asterisks (*) denote statistical significance at the 90% confidence level by two-tailed Student’s t test.
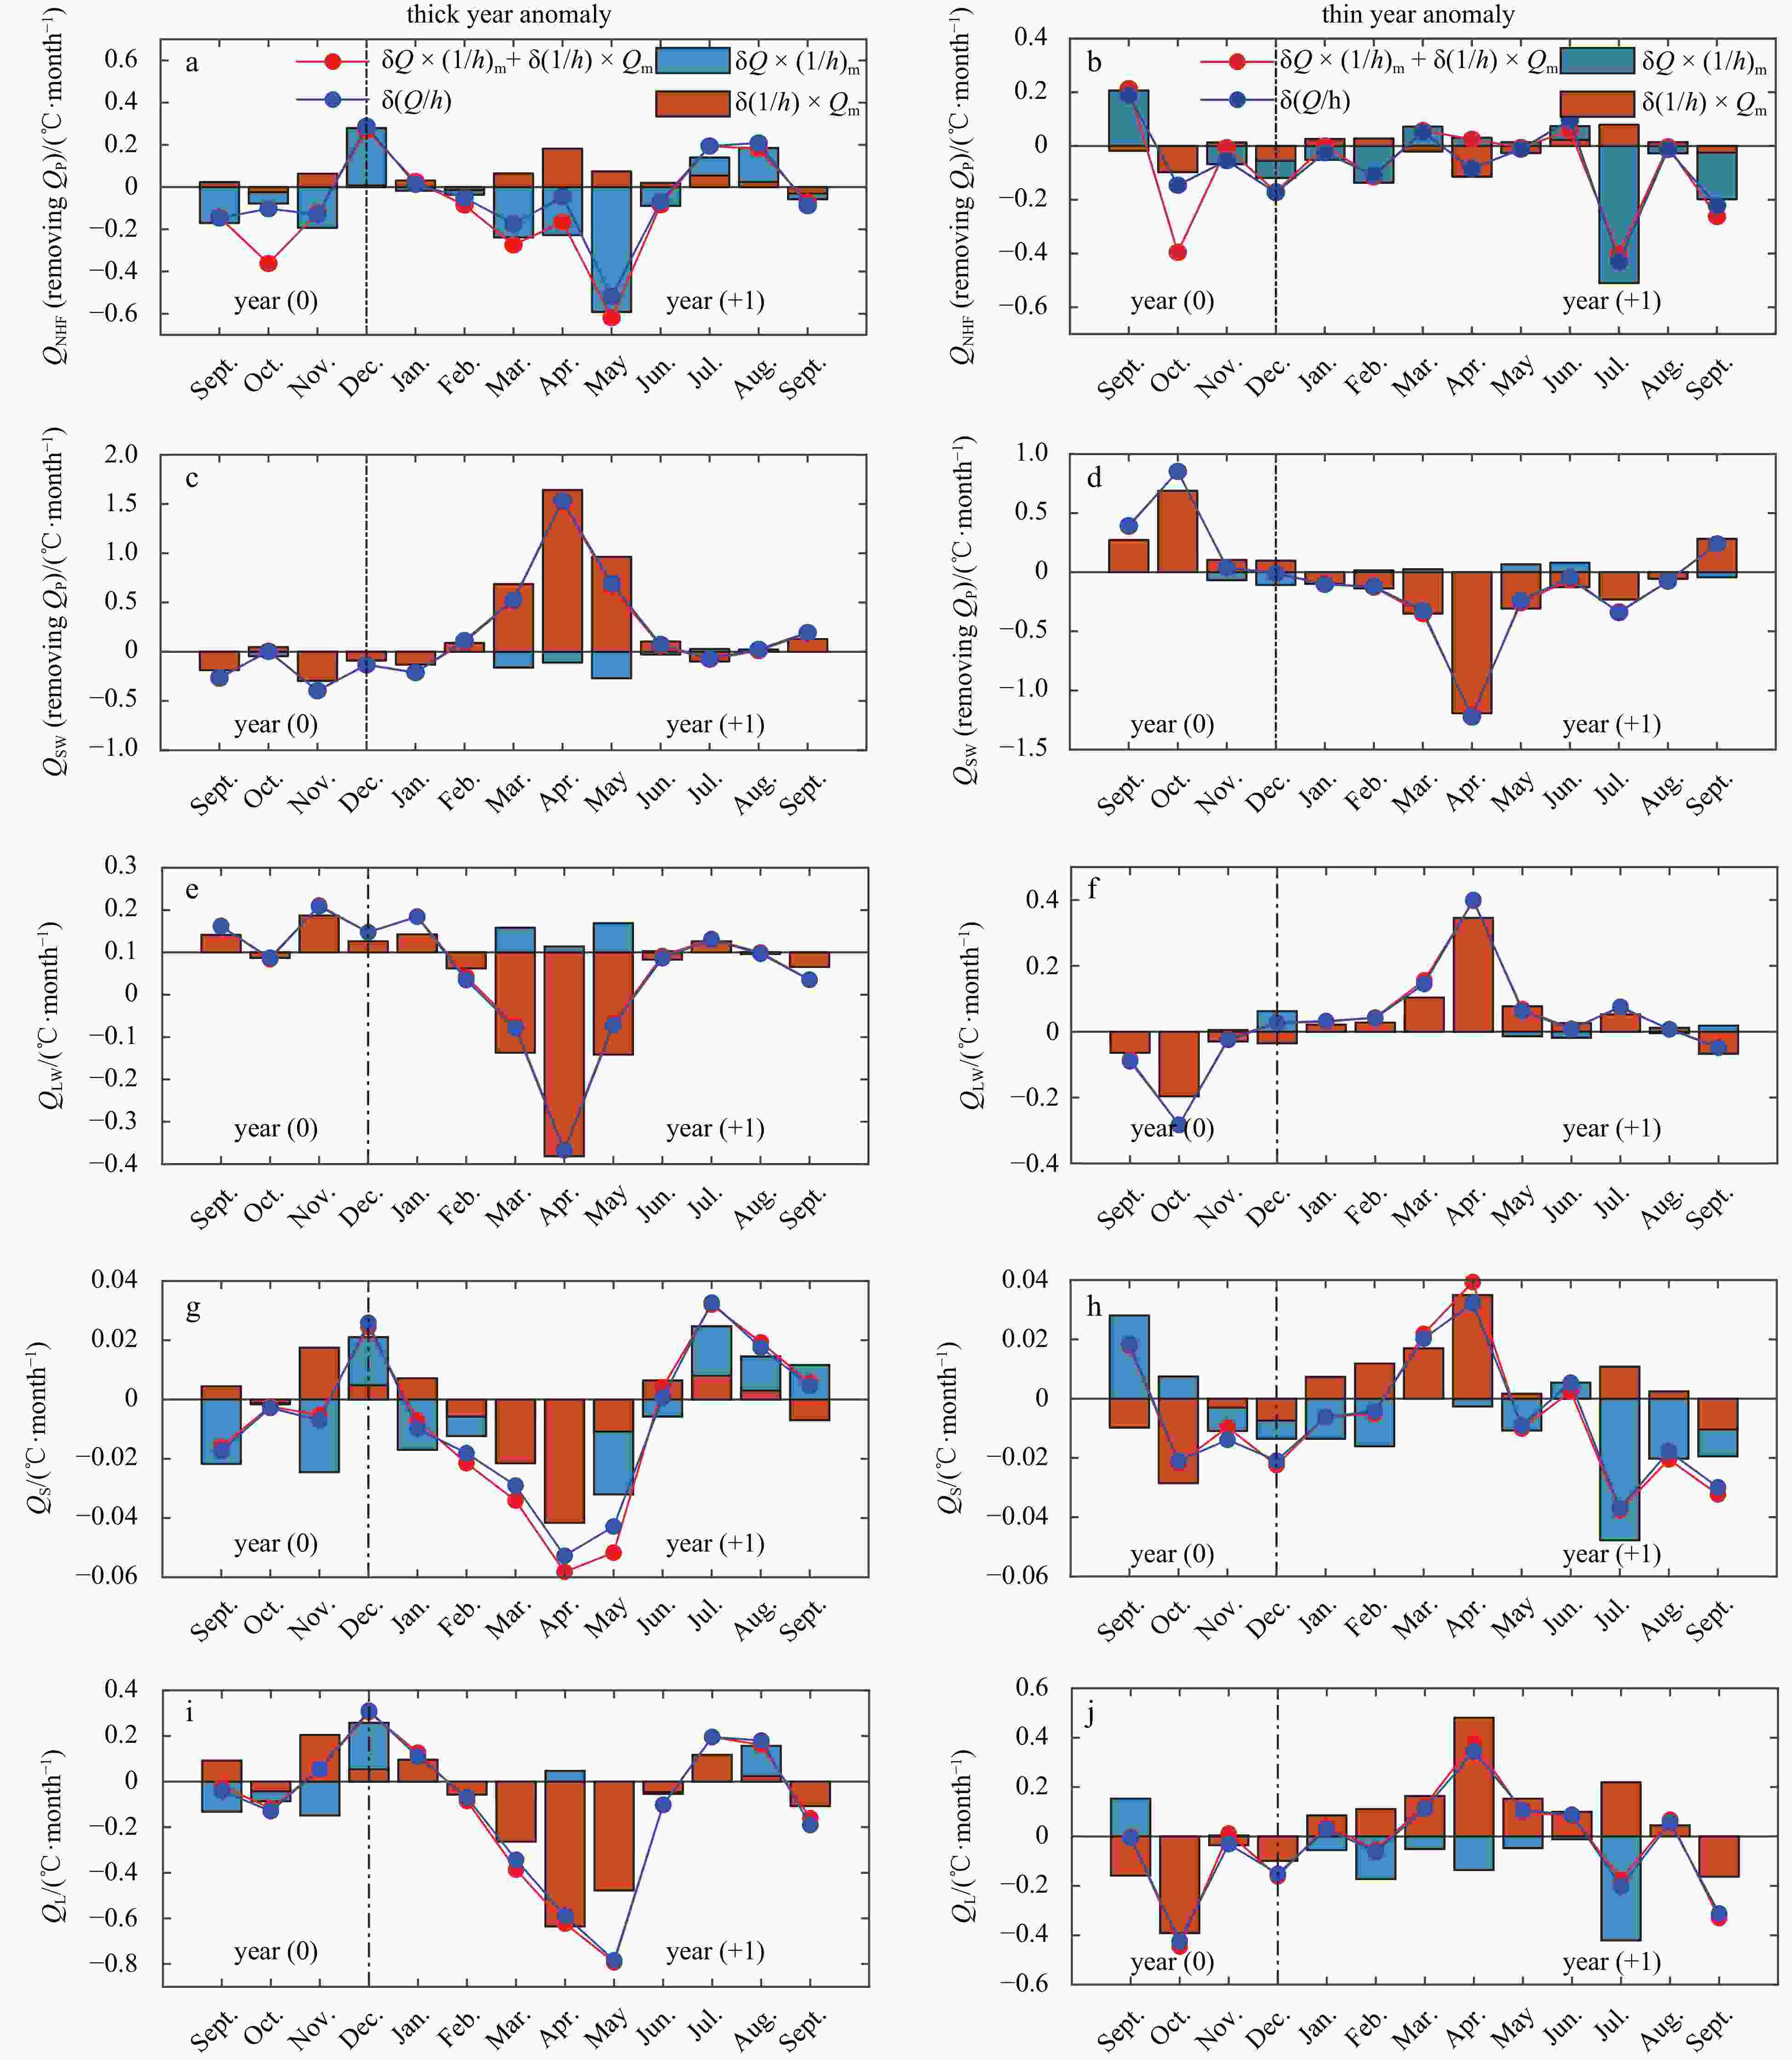
Figure 11. Seasonal evolution of anomalous SST tendency induced by surface heat flux and ML. Anomalous evolution of net surface heat flux term (a, f), net shortwave radiation flux term (b, g), longwave radiation flux term (c, h), sensible heat flux term (d, i), and latent heat flux term (e, j) in Eq. (5) averaged over the BoB from September (0) to September (+1), for prior winter thick BL years (the first column) and thin BL years (the second column). The blue bars denote the anomalous surface heat flux component
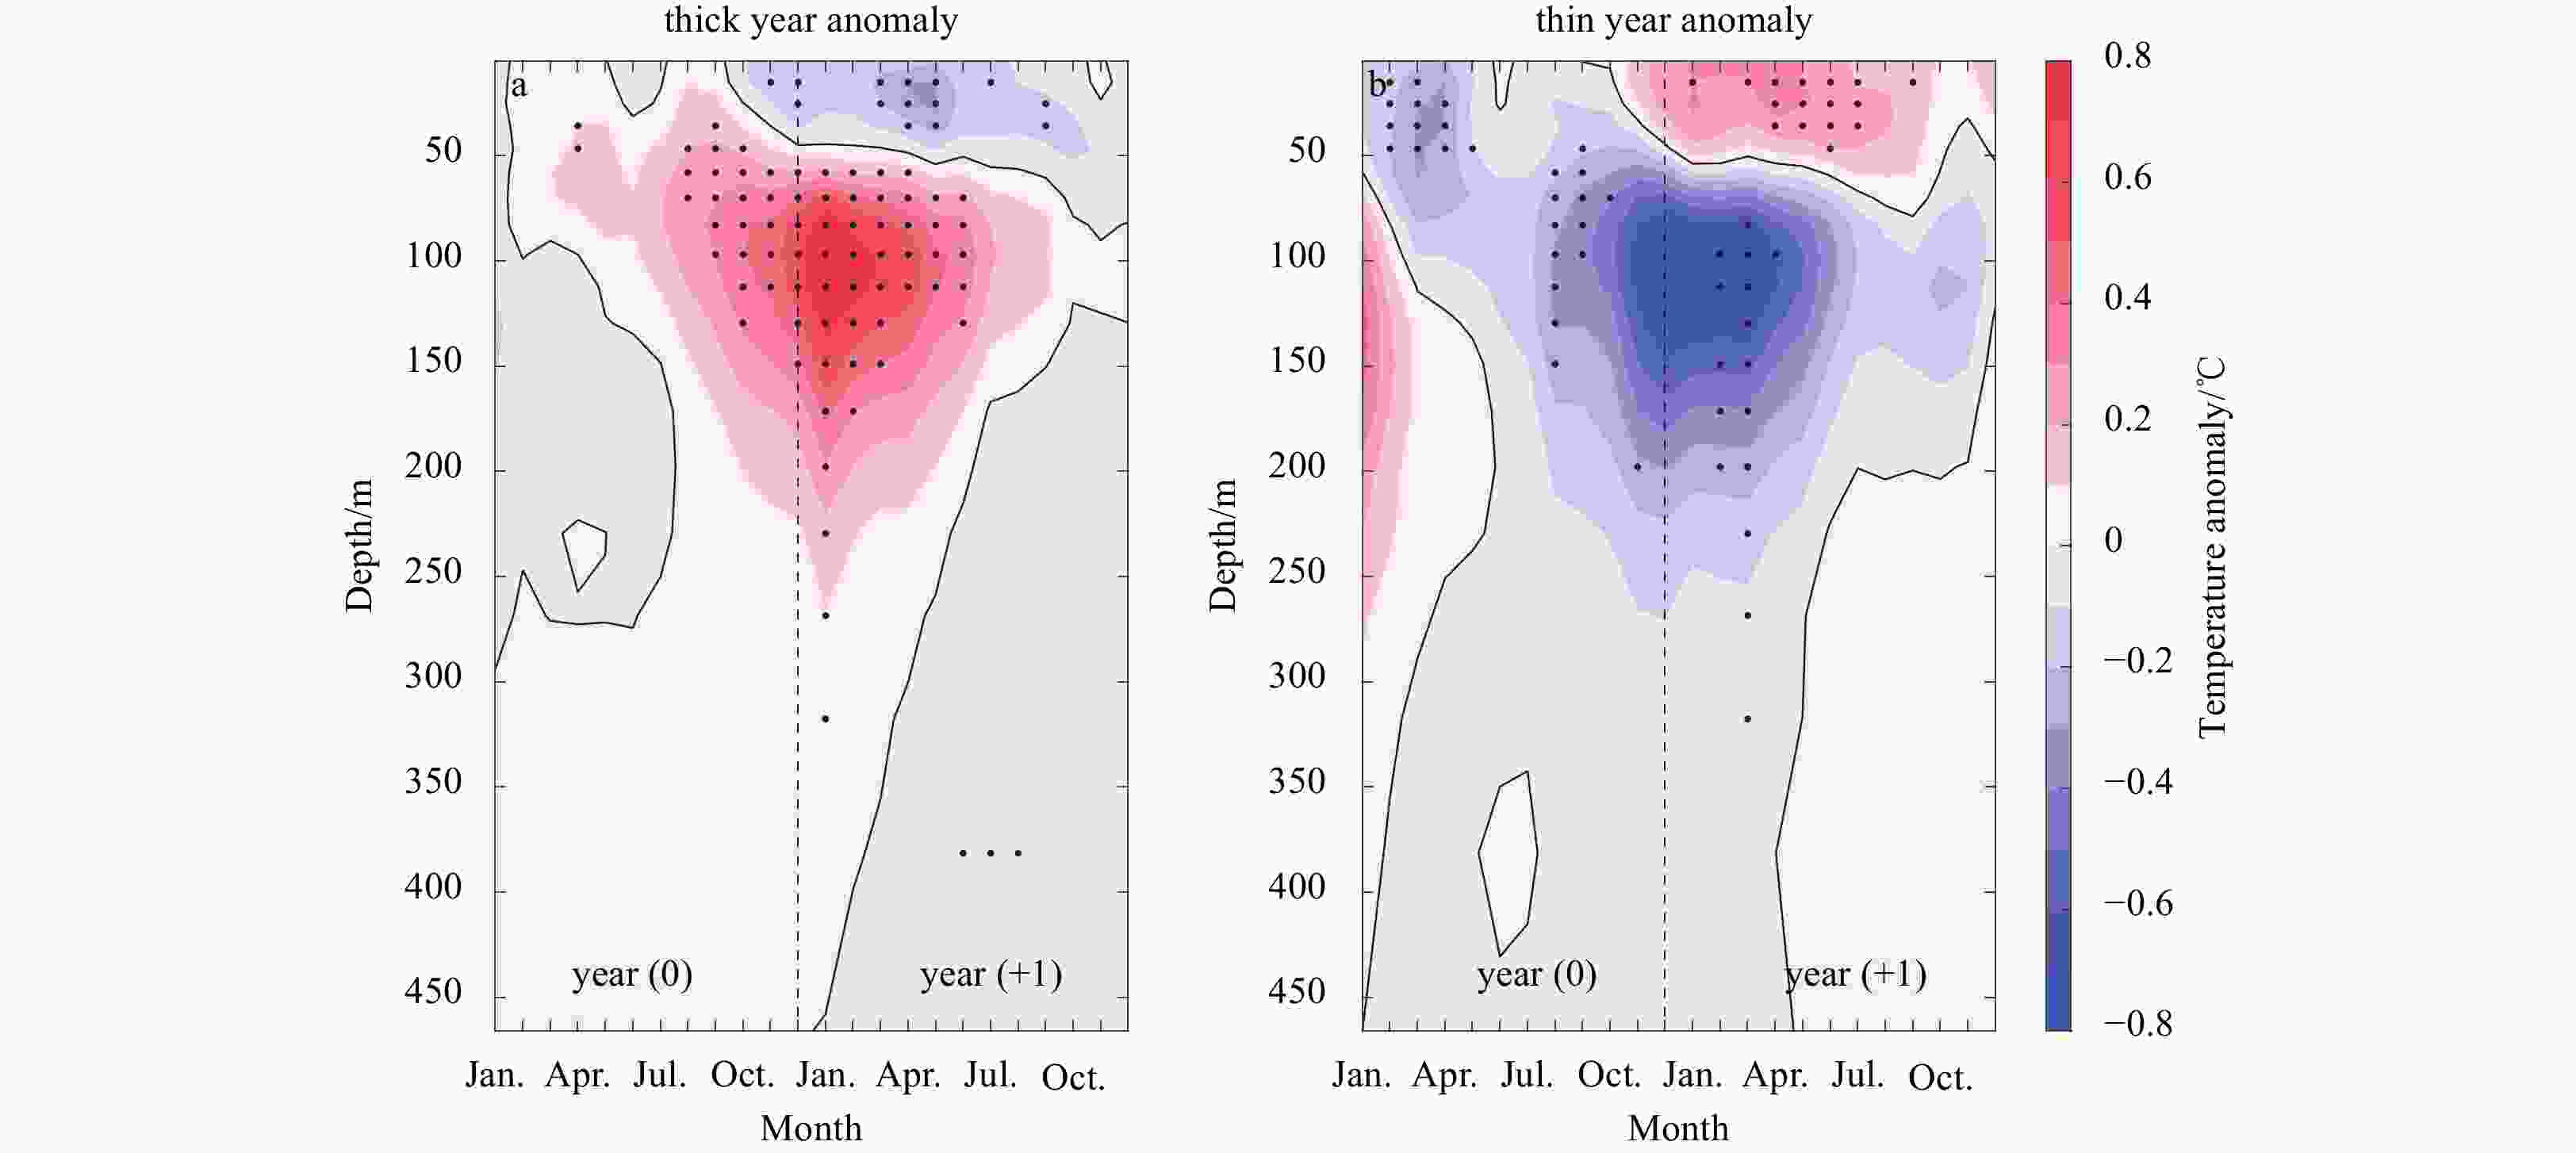
$\delta \dfrac{{{Q_{\mathrm{net}}}}}{{\rho {C_{\mathrm{p}}}}} \times \left(\overline {\dfrac{1}{h}}\right)$ , and the red bars denote the anomalous MLD component$ \dfrac{{ {{\overline Q_{\mathrm{net}}}} }}{{\rho {C_{\mathrm{p}}}}} \times \delta \dfrac{1}{h} $ . The red lines denote the sum of the anomalous surface heat flux component and anomalous MLD component. The blue lines denote the anomalies simultaneously considering surface heat flux and MLD.Figure 12. Anomalous evolution of temperature averaged over BoB from January (0) to December (+1), for prior winter thick BL years (a) and thin BL years (b). The black lines denote the zero contour. The black spots denote statistical significance at the 90% confidence level by two-tailed Student’s t test.
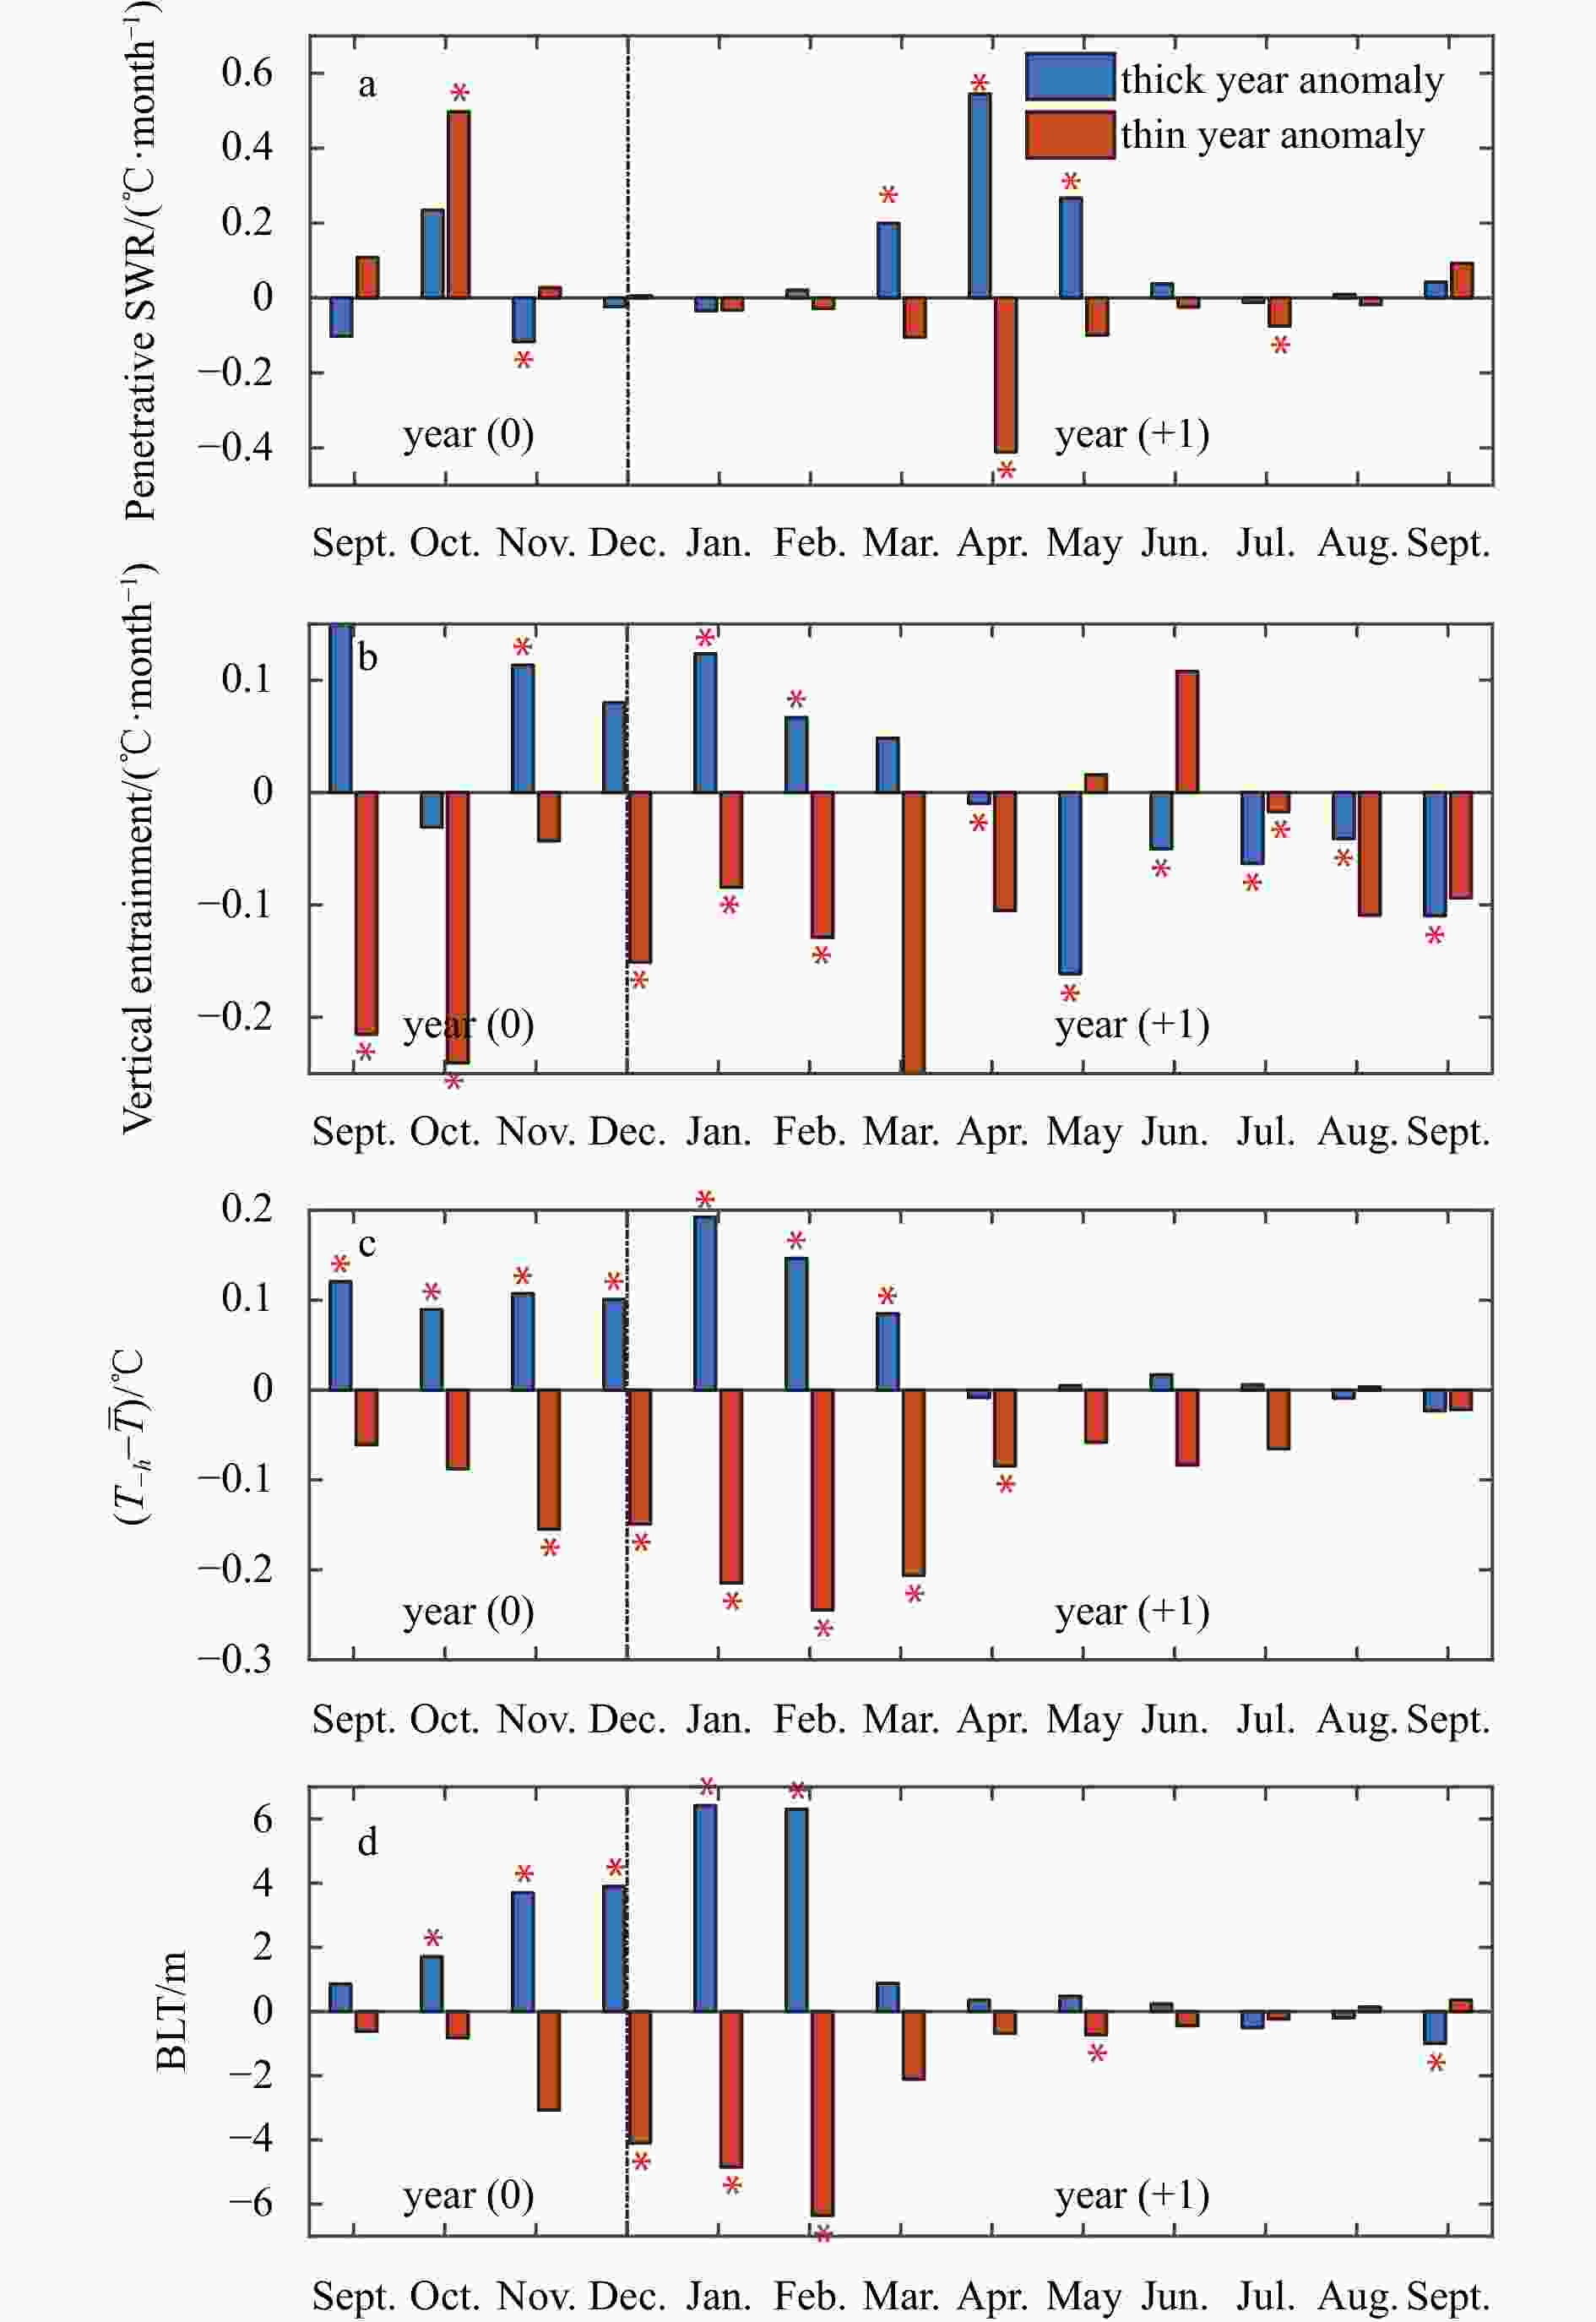
Figure 13. Anomalous evolution of penetrative shortwave radiation (a), vertical entrainment (b),
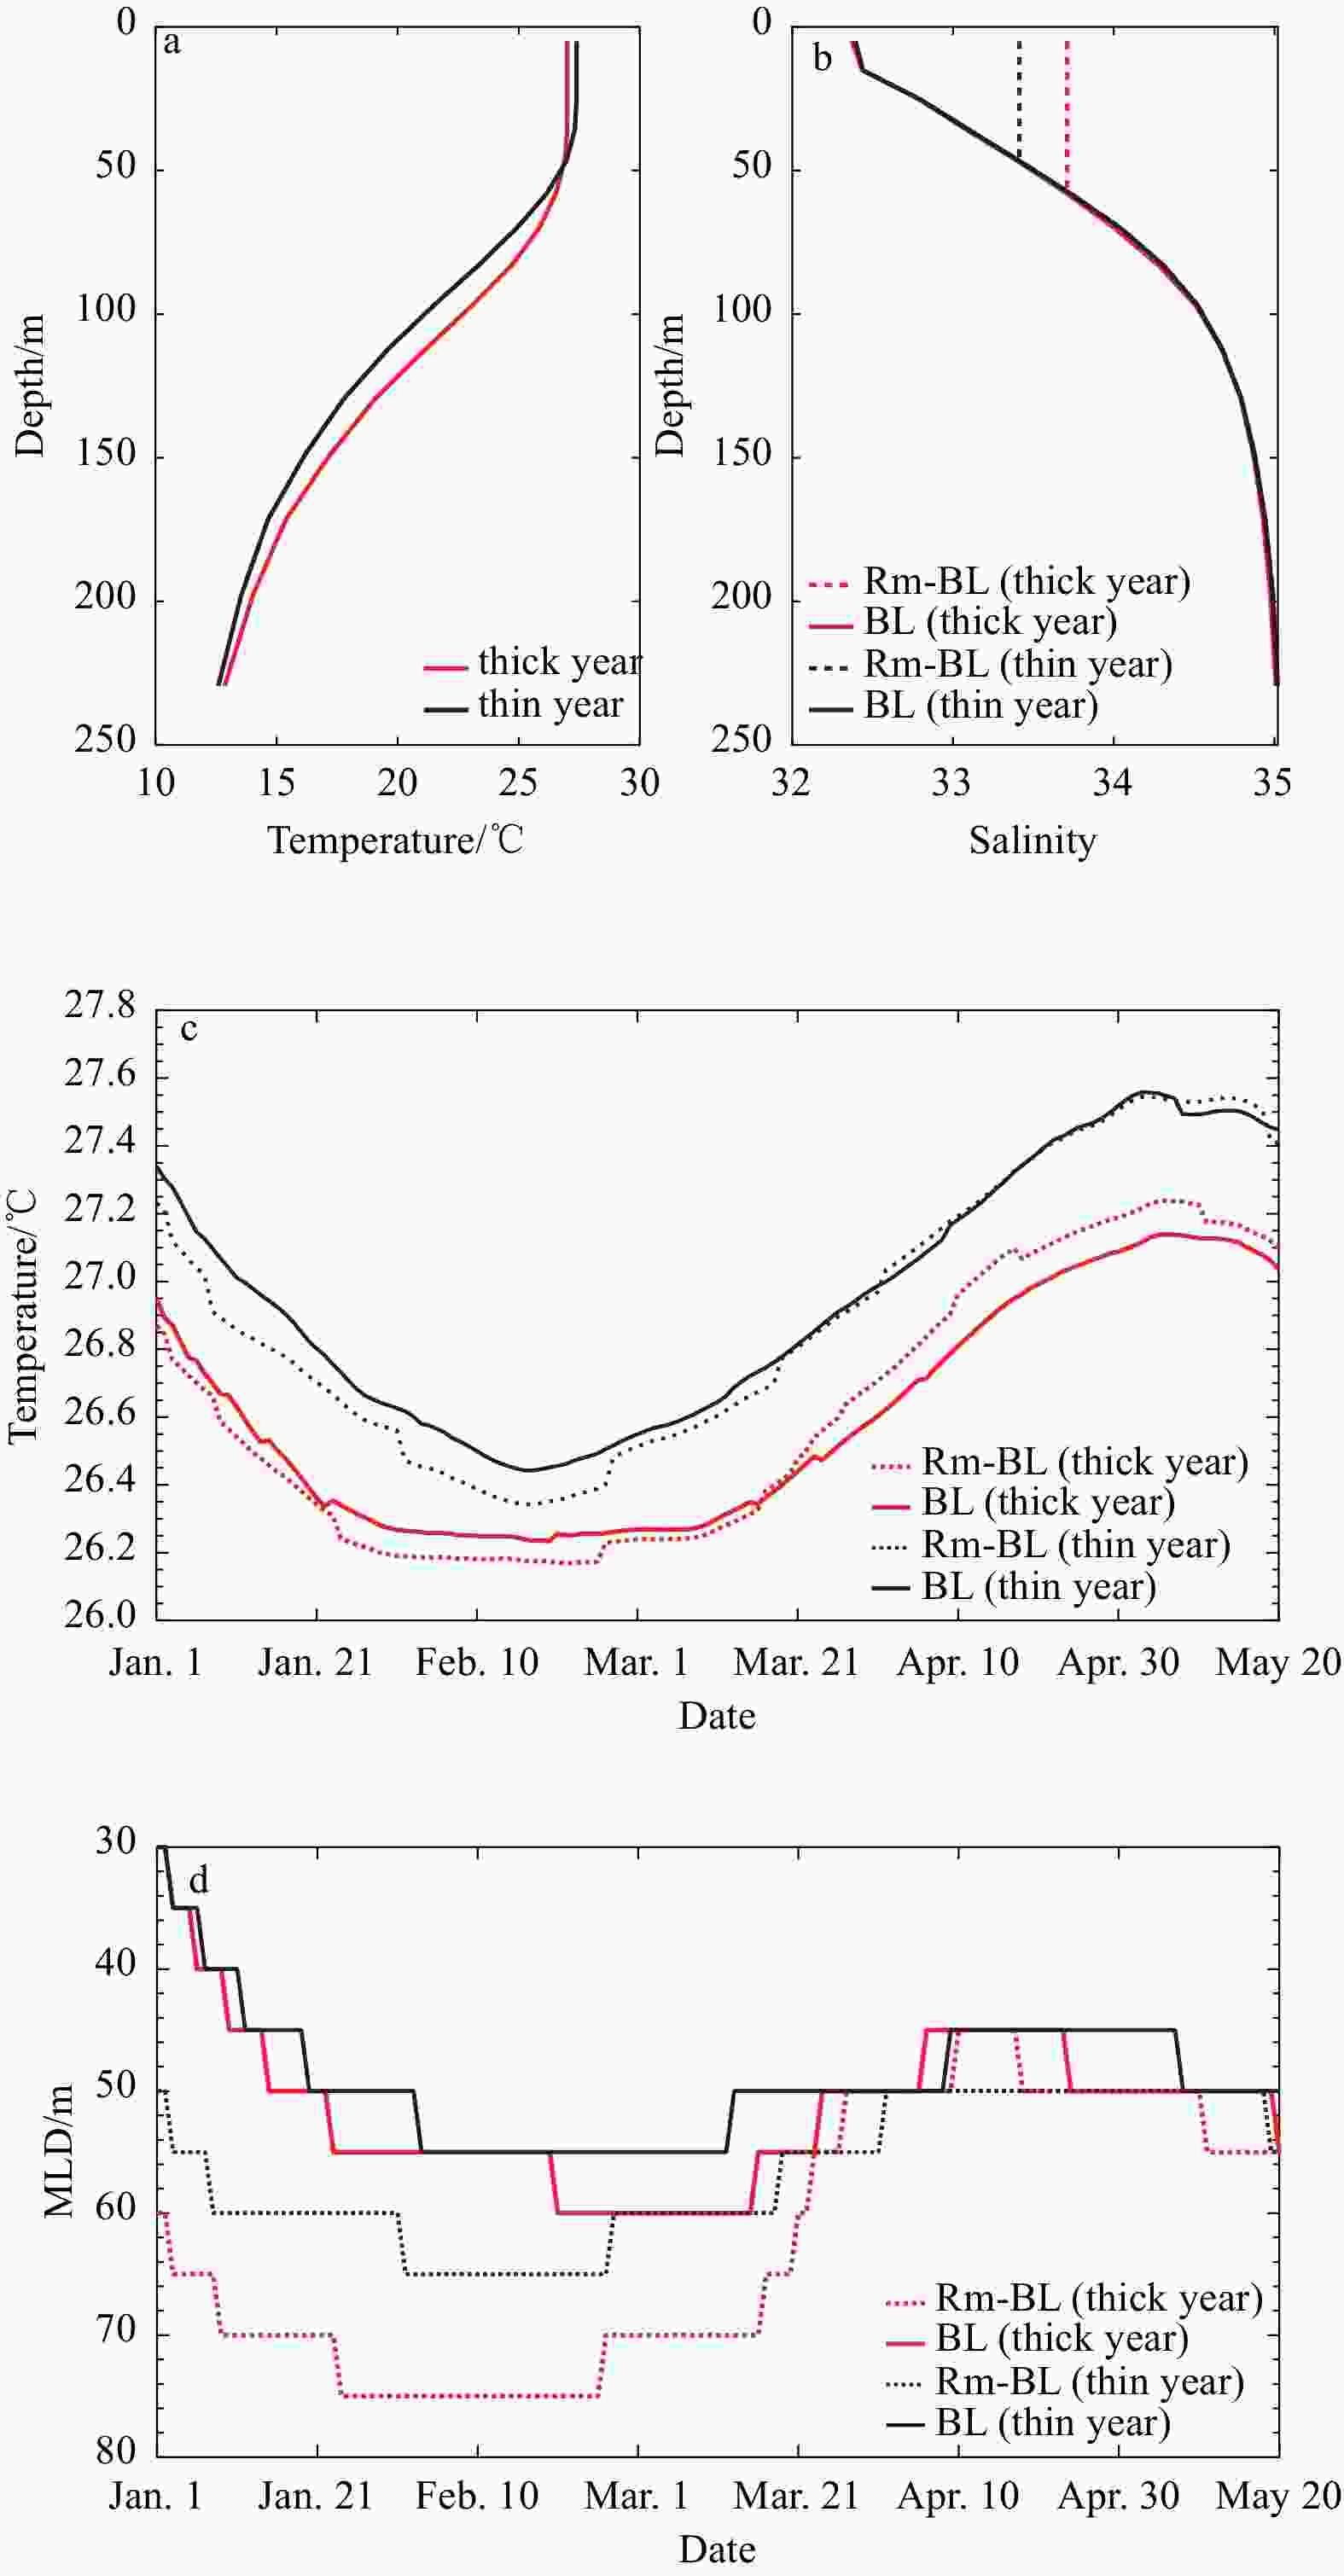
${T_{ - h}} - \overline {T\;} $ (℃; the temperature at the base of mixed layer minus the temperature of mixed layer average) (c), and BLT (d), averaged over the BoB from September (0) to September (+1), for prior winter thick BL years (blue bars) and thin BL years (red bars). The red asterisks (*) denote statistical significance at the 90% confidence level by two-tailed Student’s t test.Figure 15. Initial fields in the experiments are the composited temperature (a) and salinity (b) profiles averaged over BoB (5°–25°N, 75°–95°E) from December (0) to February (+1), for the selected prior winter thick (thin) BL years, and the evolution of averaged temperature of the ML (c) and MLD (d) simulated by the Price-Weller-Pinkel mixed layer model. For a and b, the model is driven by the composited atmospheric forcings averaged over the BoB, for prior winter thick (thin) BL years. The solid (dot) black and solid (dot) red lines represent the BL and removed BL (Rm-BL) conditions.
Figure 16. Schematic of the mechanisms of the prior winter’s anomalously thick BL modulating the June rainfall over India. The meridional section is the average temperature anomalies from 75°E to 95°E over the BoB. The zonal section is the average temperature anomalies from 5°N to 25°N over the BoB. The horizontal section is the sea surface temperature anomalies in the BoB. The solid (dashed) black lines indicate MLD (ILD). The little pink (light blue) arrows indicate an increase (decrease) of the atmospheric and oceanic factors. In December–February, the vertical entrainment of the subsurface warm water associated with prior winter thick BL anomalies damps the sea surface cooling to maintain the deep atmospheric convection. In March–May, sufficient near-surface humidity increases rainfall, enhancing salinity stratification and reducing MLD. More shortwave radiation penetrates the ML, maintaining surface cooling and increasing the land-sea thermal gradient. In June, more moisture is transported into the South Asian subcontinent, which therefore results in the increase of rainfall over India.
Table 1. Impact of different factors on June rainfall over India
No. Region Variable Correlation coefficient Partial correlation coefficient Removing IOD (SON) Removing ENSO (DJF) Removing BLT (DJF) 1 Total India IOD –0.12 – –0.01 0.05 ENSO –0.21 –0.17 – 0.06 BLT 0.46* 0.45* 0.42* – 2 Central northeast India IOD –0.02 – 0.19 0.14 ENSO –0.32* –0.37* – –0.14 BLT 0.40* 0.42* 0.28* – 3 Northeast India IOD 0.05 – 0.12 0.12 ENSO –0.09 –0.14 – 0.10 BLT 0.16 0.19 0.14 – 4 Northwest India IOD –0.10 – –0.11 –0.03 ENSO –0.01 0.05 – 0.12 BLT 0.20 0.18 0.23* – 5 Peninsular India IOD –0.18 – –0.26 –0.19 ENSO 0.07 0.21 – 0.08 BLT –0.01 –0.08 0.04 – 6 West-central India IOD –0.12 – –0.04 0.05 ENSO –0.17 –0.12 – 0.13 BLT 0.48* 0.47* 0.47* – Note: This table shows Pearson’s correlation coefficients and partial correlation coefficients between SON (0) IOD, DJF ENSO indices, and DJF BLT with respect to June (+1) ISM rainfall over different regions of India. The asterisks (*) indicate statistical significance at the 95% level using Student’s t test. The dash (−) indicates no available data. -
Akhil V P, Durand F, Lengaigne M, et al. 2014. A modeling study of the processes of surface salinity seasonal cycle in the Bay of Bengal. Journal of Geophysical Research: Oceans, 119: 3926–3947, doi: 10.1002/2013jc009632 Anderson S P, Weller R A, Lukas R B. 1996. Surface buoyancy forcing and the mixed layer of the western Pacific warm pool: Observations and 1D model results. Journal of Climate, 9: 3056–3085, doi: 10.1175/1520-0442(1996)009<3056:Sbfatm>2.0.Co;2 Ando K, McPhaden M J. 1997. Variability of surface layer hydrography in the tropical Pacific Ocean. Journal of Geophysical Research: Oceans, 102: 23063–23078, doi: 10.1029/97jc01443 Ashok K, Guan Zhaoyong, Saji N H, et al. 2004. Individual and combined influences of ENSO and the Indian Ocean Dipole on the Indian summer monsoon. Journal of Climate, 17: 3141–3155, doi: 10.1175/1520-0442(2004)017<3141:Iacioe>2.0.Co;2 Ashok K, Guan Zhaoyong, Yamagata T. 2001. Impact of the Indian Ocean dipole on the relationship between the Indian monsoon rainfall and ENSO. Geophysical Research Letters, 28: 4499–4502, doi: 10.1029/2001gl013294 Asoka A, Gleeson T, Wada Y, et al. 2017. Relative contribution of monsoon precipitation and pumping to changes in groundwater storage in India. Nature Geoscience, 10: 109, doi: 10.1038/ngeo2869 Bjerknes J. 1969. Atmospheric teleconnections from the equatorial pacific. Monthly Weather Review, 97(3): 163–172. doi: 10.1175/1520-0493(1969)097<0163:ATFTEP>2.3.CO;2 Balaguru K, Chang Ping, Saravanan R, et al. 2012. Ocean barrier layers’ effect on tropical cyclone intensification. Proceedings of the National Academy of Sciences of the United States of America, 109: 14343–14347, doi: 10.1073/pnas.1201364109 Barnett T P, Adam J C, Lettenmaier D P. 2005. Potential impacts of a warming climate on water availability in snow-dominated regions. Nature, 438: 303–309, doi: 10.1038/nature04141 Breugem W P, Chang Ping, Jang C J, et al. 2008. Barrier layers and tropical Atlantic SST biases in coupled GCMs. Tellus Series A-Dynamic Meteorology and Oceanography, 60: 885–897, doi: 10.1111/j.1600-0870.2008.00343.x Cai Wenju, Pan Aijun, Roemmich D, et al. 2009. Argo profiles a rare occurrence of three consecutive positive Indian Ocean Dipole events, 2006-2008. Geophysical Research Letters, 36: L08701, doi: 10.1029/2008gl037038 Chakravorty S, Gnanaseelan C, Pillai P A. 2016. Combined influence of remote and local SST forcing on Indian summer monsoon rainfall variability. Climate Dynamics, 47: 2817–2831, doi: 10.1007/s00382-016-2999-5 Cherchi A, Navarra A. 2012. Influence of ENSO and of the Indian Ocean Dipole on the Indian summer monsoon variability. Climate Dynamics, 41: 81–103, doi: 10.1007/s00382-012-1602-y Chou C. 2003. Land-sea heating contrast in an idealized Asian summer monsoon. Climate Dynamics, 21: 11–25, doi: 10.1007/s00382-003-0315-7 de Boyer Montégut C, Mignot J, Lazar A, et al. 2007. Control of salinity on the mixed layer depth in the world ocean: 1. General description. Journal of Geophysical Research: Oceans, 112. doi: 10.1029/2006jc003953 De U S, Dube R K, Prakasa Rao G S. 2005. Extreme weather events over India in the last 100 years. Journal of Indian Geophysical Union, 9: 173–187 Deser C, Alexander M A, Xie Shangping, et al. 2010. Sea surface temperature variability: Patterns and mechanisms. Annual Review of Marine Science, 2: 115–143, doi: 10.1146/annurev-marine-120408-151453 Dewar W K. 2001. Density coordinate mixed layer models. Monthly Weather Review, 129(2): 237–253, doi: 10.1175/1520-0493(2001)129<0237:DCMLM>2.0.CO;2 Ding Yihui, Chan J C. 2005. The East Asian summer monsoon: An overview. Meteorology and Atmospheric Physics, 89: 117–142, doi: 10.1007/s00703-005-0125-z Drushka K, Sprintall J, Gille S T. 2014. Subseasonal variations in salinity and barrier-layer thickness in the eastern equatorial Indian Ocean. Journal of Geophysical Research: Oceans, 119: 805–823, doi: 10.1002/2013jc009422 Foltz G R, McPhaden M J. 2009. Impact of barrier layer thickness on SST in the central tropical North Atlantic. Journal of Climate, 22: 285–299, doi: 10.1175/2008jcli2308.1 Francis P A, Gadgil S. 2010. Towards understanding the unusual Indian monsoon in 2009. Journal of Earth System Science, 119: 397–415, doi: 10.1007/s12040-010-0033-6 Gadgil S. 2003. The Indian monsoon and its variability. Annual Review of Earth and Planetary Sciences, 31: 429–467, doi: 10.1146/annurev.earth.31.100901.141251 Gadgil S, Gadgil S. 2006. The Indian monsoon, GDP and agriculture. Economic and Political Weekly, 4887–4895. doi: 10.2307/4418949 Gadgil S, Joshi N V, Joseph P V. 1984. Ocean-atmosphere coupling over monsoon regions. Nature, 312: 141–143, doi: 10.1038/312141a0 Girishkumar M S, Ravichandran M, McPhaden M J. 2013. Temperature inversions and their influence on the mixed layer heat budget during the winters of 2006–2007 and 2007–2008 in the Bay of Bengal. Journal of Geophysical Research: Oceans, 118: 2426–2437, doi: 10.1002/jgrc.20192 Girishkumar M S, Ravichandran M, McPhaden M J, et al. 2011. Intraseasonal variability in barrier layer thickness in the south central Bay of Bengal. Journal of Geophysical Research: Oceans, 116: C03009, doi: 10.1029/2010JC006657 Goswami B N. 2005. South Asian Monsoon. Berlin, Heidelberg, Germany: Springer Press Goswami B N, Xavier P K. 2005. ENSO control on the south Asian monsoon through the length of the rainy season. Geophysical Research Letters, 32: L18717, doi: 10.1029/2005gl023216 Goswami B N, Chakravorty S. 2017. Dynamics of the Indian summer monsoon climate. Oxford Research Encyclopedia of Climate Science. doi: 10.1093/acrefore/9780190228620.013.613 Graham N, Barnett T. 1987. Sea surface temperature, surface wind divergence, and convection over tropical oceans. Science, 238: 657, doi: 10.1126/science.238.4827.657 Han Weiqing, McCreary J P, Kohler K E. 2001. Influence of precipitation minus evaporation and Bay of Bengal rivers on dynamics, thermodynamics, and mixed layer physics in the upper Indian Ocean. Journal of Geophysical Research: Oceans, 106: 6895–6916, doi: 10.1029/2000jc000403 Harenduprakash L, Mitra A K. 1988. Vertical turbulenet mass flux below the sea surface and air-sea interaction: Monsoon region of the Indian Ocean. Deep-Sea Research Part A, Oceanographic Research Papers, 35: 333–346, doi: 10.1016/0198-0149(88)90014-3 Kalnay E, Kanamitsu M, Kistler R, et al. 1996. The NCEP/NCAR 40-year reanalysis project. Bulletin of the American Meteorological Society, 77: 437–471, doi: 10.1175/1520-0477(1996)077<0437:TNYRP>2.0.CO;2 Kamae Y, Watanabe M, Kimoto M, et al. 2014. Summertime land–sea thermal contrast and atmospheric circulation over East Asia in a warming climate—Part II: Importance of CO2-induced continental warming. Climate Dynamics, 43: 2569–2583, doi: 10.1007/s00382-014-2146-0 Kothawale D R, Rajeevan M. 1995. Monthly, seasonal and annual rainfall time series for all-India, homogeneous regions and meteorological subdivisions: 1871–2016. Research Report No. RR-138. Pune, India: Indian Institute of Tropical Meteorology Kraus E B. 1972. Atmosphere-Ocean Interaction. New York, NY, USA: Oxford University Press, 275 Kraus E B, Turner J S. 1967. A one-dimensional model of the seasonal thermocline II: The general theory and its consequences. Tellus, 19: 98–106, doi: 10.1111/j.2153-3490.1967.tb01462.x Krishnamurthy V, Goswami B N. 2000. Indian monsoon-ENSO relationship on interdecadal timescale. Journal of Climate, 13: 579–595, doi: 10.1175/1520-0442(2000)013<0579:Imeroi>2.0.Co;2 Krishnamurthy L, Krishnamurthy V. 2013. Influence of PDO on South Asian summer monsoon and monsoon-ENSO relation. Climate Dynamics, 42: 2397–2410, doi: 10.1007/s00382-013-1856-z Krishnan R, Sugi M. 2003. Pacific decadal oscillation and variability of the Indian summer monsoon rainfall. Climate Dynamics, 21: 233–242, doi: 10.1007/s00382-003-0330-8 Li Chengfeng, Yanai M. 1996. The onset and interannual variability of the Asian summer monsoon in relation to land sea thermal contrast. Journal of Climate, 9: 358–375, doi: 10.1175/1520-0442(1996)009<0358:Toaivo>2.0.Co;2 Li Zhangqun, Xiao Ziniu. 2021. Thermal contrast between the Tibetan Plateau and tropical Indian Ocean and its relationship to the South Asian summer monsoon. Atmospheric and Oceanic Science Letters, 14: 100002, doi: 10.1016/j.aosl.2020.100002 Liao Huaxia, Wang Chunzai. 2021. Sea surface temperature anomalies in the western Indian Ocean as a trigger for Atlantic Niño events. Geophysical Research Letters, 48: e2021GL092489, doi: 10.1029/2021GL092489 Lotliker A A, Omand M M, Lucas A J, et al. 2016. Penetrative radiative flux in the Bay of Bengal. Oceanography, 29: 214–221, doi: 10.5670/oceanog.2016.53 Maes C, Picaut J, Kentaro A, et al. 2004. Characteristics of the convergence zone at the eastern edge of the Pacific warm pool. Geophysical Research Letters, 31: L11304, doi: 10.1029/2004GL019867 Masson S, Luo Jingjia, Madec G, et al. 2005. Impact of barrier layer on winter-spring variability of the southeastern Arabian Sea. Geophysical Research Letters, 32: L07703, doi: 10.1029/2004gl021980 Mishra S K, Sahany S, Salunke P. 2016. Linkages between MJO and summer monsoon rainfall over India and surrounding region. Meteorology and Atmospheric Physics, 129: 283–296, doi: 10.1007/s00703-016-0470-0 Morel A, Antoine D. 1994. Heating rate within the upper ocean in relation to its bio-optical state. Journal of Physical Oceanography, 24: 1652–1665, doi: 10.1175/1520-0485(1994)024<1652:HRWTUO>2.0.CO;2 Pai D S, Bhate J, Sreejith O P, et al. 2009. Impact of MJO on the intraseasonal variation of summer monsoon rainfall over India. Climate Dynamics, 36: 41–55, doi: 10.1007/s00382-009-0634-4 Parthasarathy B, Munot A A, Kothawale D R. 1995. Monthly and seasonal rainfall series for all-India homogeneous regions and meteorological subdivisions: 1871–1994. Research Report No. RR-065. Pune, India: Indian Institute of Tropical Meteorology Paulson C A, Simpson J J. 1977. Irradiance measurements in the upper ocean. Journal of Physical Oceanography, 7(6): 952–956, doi: 10.1175/1520-0485(1977)007<0952:IMITUO>2.0.CO;2 Pradhan M, Rao A S, Srivastava A, et al. 2017. Prediction of Indian summer-monsoon onset variability: A season in advance. Scientific Reports, 7: 14229, doi: 10.1038/s41598-017-12594-y Prasad T G. 1997. Annual and seasonal mean buoyancy fluxes for the tropical Indian Ocean. Current Science, 73: 667–674 Price J F, Sanford T B, Forristall G Z. 1994. Forced stage response to a moving hurricane. Journal of Physical Oceanography, 24: 233–260, doi: 10.1175/1520-0485(1994)024<0233:FSRTAM>2.0.CO;2 Price J F, Weller R A, Pinkel R. 1986. Diurnal cycling: Observations and models of the upper ocean response to diurnal heating, cooling, and wind mixing. Journal of Geophysical Research: Oceans, 91(C7): 8411–8427, doi: 10.1029/JC091iC07p08411 Qiu Yun, Han Weiqing, Lin Xinyu, et al. 2019. Upper-ocean response to the super tropical cyclone Phailin (2013) over the freshwater region of the Bay of Bengal. Journal of Physical Oceanography, 49: 1201–1228, doi: 10.1175/jpo-d-18-0228.1 Rajeevan M, Unnikrishnan C K, Preethi B. 2011. Evaluation of the ensembles multi-model seasonal forecasts of Indian summer monsoon variability. Climate Dynamics, 38: 2257–2274, doi: 10.1007/s00382-011-1061-x Ramage C S. 1971. Monsoon Meteorology. New York NY, USA, London, UK: Academic Press, 15: 1–296 Rao R R, Sivakumar R. 2003. Seasonal variability of sea surface salinity and salt budget of the mixed layer of the north Indian Ocean. Journal of Geophysical Research: Oceans, 108(C1): 3009, doi: 10.1029/2001jc000907 Rao Y P. 1976. Southwest Monsoon: Meteorological Monograph. New Delhi, India: India Meteorological Department Press, 366 Roxy M. 2013. Sensitivity of precipitation to sea surface temperature over the tropical summer monsoon region—and its quantification. Climate Dynamics, 43: 1159–1169, doi: 10.1007/s00382-013-1881-y Russo T A, Lall U. 2017. Depletion and response of deep groundwater to climate-induced pumping variability. Nature Geoscience, 10: 105, doi: 10.1038/ngeo2883 Sabin T, Babu C, Joseph P. 2012. SST-convection relation over tropical oceans. International Journal of Climatology, 33: 1424–1435, doi: 10.1002/joc.3522 Senan R, Orsolini Y J, Weisheimer A, et al. 2016. Impact of springtime Himalayan–Tibetan Plateau snowpack on the onset of the Indian summer monsoon in coupled seasonal forecast. Climate Dynamics, 47: 2709–2725, doi: 10.1007/s00382-016-2993-y Seo H, Xie Shangping, Murtugudde R, et al. 2009. Seasonal effects of Indian Ocean freshwater forcing in a regional coupled model. Journal of Climate, 22: 6577–6596, doi: 10.1175/2009jcli2990.1 Shenoi S S C, Shankar D, Shetye S R. 2002. Differences in heat budgets of the near-surface Arabian Sea and Bay of Bengal: Implications for the summer monsoon. Journal of Geophysical Research, 107(C6). doi: 10.1029/2000jc000679 Shetye S R, Gouveia A D, Shankar D, et al. 1996. Hydrography and circulation in the western Bay of Bengal during the northeast monsoon. Journal of Geophysical Research: Oceans, 101: 14011–14025, doi: 10.1029/95jc03307 Simpson G. 1921. The south-west monsoon. Quarterly Journal of the Royal Meteorological Society, 47: 151–171, doi: 10.1002/qj.49704719901 Sprintall J, Tomczak M. 1992. Evidence of the barrier layer in the surface layer of the tropics. Journal of Geophysical Research: Oceans, 97: 7305, doi: 10.1029/92jc00407 Stevenson J W, Niiler P P. 1983. Upper ocean heat budget during the Hawaii-to-Tahiti shuttle experiment. Journal of Physical Oceanography, 13: 1894–1907, doi: 10.1175/1520-0485(1983)013<1894:UOHBDT>2.0.CO;2 Su Hui, Neelin J D, Meyerson J E. 2003. Sensitivity of tropical tropospheric temperature to sea surface temperature forcing. Journal of Climate, 16: 1283–1301, doi: 10.1175/1520-0442(2003)16<1283:SOTTTT>2.0.CO;2 Sutton R T, Dong Buwen, Gregory J M. 2007. Land/sea warming ratio in response to climate change: IPCC AR4 model results and comparison with observations, Geophysical Research Letters, 34: L02701. doi: 10.1029/2006GL028164 Tanimoto Y, Xie Shangping. 2002. Inter-hemispheric decadal variations in SST, surface wind, heat flux and cloud cover over the Atlantic Ocean. Journal of the Meteorological Society of Japan, 80: 1199–1219, doi: 10.2151/jmsj.80.1199 Taylor K E, Stouffer R J, Meehl G A. 2012. An overview of CMIP5 and the experiment design. Bulletin of the American Meteorological Society, 93(4): 485–498, doi: 10.1175/BAMS-D-11-00094.1 Thadathil P, Gopalakrishna V V, Muraleedharan P M, et al. 2002. Surface layer temperature inversion in the Bay of Bengal. Deep-Sea Research Part I-Oceanographic Research Papers, 49: 1801–1818, doi: 10.1016/S0967-0637(02)00044-4 Thadathil P, Muraleedharan P M, Rao R R, et al. 2007. Observed seasonal variability of barrier layer in the Bay of Bengal. Journal of Geophysical Research: Oceans, 112: C02009, doi: 10.1029/2006jc003651 Thangaprakash V P, Girishkumar M S, Suprit K, et al. 2016. What controls seasonal evolution of sea surface temperature in the Bay of Bengal? Mixed layer heat budget analysis using moored buoy observations along 90°E. Oceanography, 29: 202–213, doi: 10.5670/oceanog.2016.52 Tian Feng, Zhang Ronghua. 2023. Increasing shortwave penetration through the bottom of the oceanic mixed layer in a warmer climate. Journal of Geophysical Research: Oceans, 128: e2022JC019587, doi: 10.1029/2022JC019587 Trenberth K E, Branstator G W, Karoly D, et al. 1998. Progress during TOGA in understanding and modeling global teleconnections associated with tropical sea surface temperatures. Journal of Geophysical Research: Oceans, 103(C7): 14291–14324, doi: 10.1029/97JC01444 Trenberth K E, Hurrell J W, Stepaniak D P. 2006. The Asian Monsoon: Global Perspectives. Berlin, Heidelberg, Germany: Springer Press Varkey M J, Murty V S N, Suryanarayana A. 1996. Physical oceanography of the Bay of Bengal and Andaman Sea. Oceanography and Marine Biology: An Annual Review, 34: 1–70 Vialard J, Delecluse P. 1998a. An OGCM study for the TOGA decade. Part I: Role of salinity in the physics of the western Pacific fresh pool. Journal of Physical Oceanography, 28: 1071–1088, doi: 10.1175/1520-0485(1998)028<1071:Aosftt>2.0.Co;2 Vialard J, Delecluse P. 1998b. An OGCM study for the TOGA decade. Part II: Barrier-layer formation and variability. Journal of Physical Oceanography, 28: 1089–1106, doi: 10.1175/1520-0485(1998)028<1089:Aosftt>2.0.Co;2 Vinayachandran P N, Murty V S N, Ramesh Babu V. 2002. Observations of barrier layer formation in the Bay of Bengal during summer monsoon. Journal of Geophysical Research: Oceans, 107: SRF 19-1–SRF 19-9. doi: 10.1029/2001jc000831 Waliser D E, Graham N E, Gautier C. 1993. Comparison of the highly reflective cloud and outgoing longwave radiation datasets for use in estimating tropical deep convection. Journal of Climate, 6: 331–353, doi: 10.1175/1520-0442(1993)006<0331:COTHRC>2.0.CO;2 Wang J W, Han Weiqing. 2014. The Bay of Bengal upper-ocean response to tropical cyclone forcing during 1999. Journal of Geophysical Research: Oceans, 119: 98–120, doi: 10.1002/2013jc008965 Wang Tongmei, Wu Guoxiong, Yu Jingjing. 2009. The influence of anomalous diabatic heating over Tibetan Plateau in spring on the Asian tropical circulation and monsoon onset. Journal of Tropical Meteorology (in Chinese), 25: 92–101 Wang Xidong, Han Guijun, Qi Yiquan, et al. 2011. Impact of barrier layer on typhoon-induced sea surface cooling. Dynamics of Atmospheres and Oceans, 52: 367–385, doi: 10.1016/j.dynatmoce.2011.05.002 Webster P J, Magana V O, Palmer T N, et al. 1998. Monsoons: Processes, predictability, and the prospects for prediction. Journal of Geophysical Research: Oceans, 103: 14451–14510, doi: 10.1029/97jc02719 Wu Guoxiong, Liu Yimin, He Bian, et al. 2012. Thermal controls on the Asian summer monsoon. Scientific Reports, 2: 404, doi: 10.1038/srep00404 Yang Jianling, Liu Qinyu, Xie Shangping, et al. 2007. Impact of the Indian Ocean SST basin mode on the Asian summer monsoon. Geophysical Research Letters, 34: L02708, doi: 10.1029/2006GL028571 Zeng Gang, Zhang Guwei, Wu Yingjiao, et al. 2016. Numerical simulation of sea surface temperature anomaly effect on the interdecadal variation of the South Asian High. Journal of the Meteorological Sciences (in Chinese), 2016, 36: 436–446, doi: 10.3969/2015jms.0031 Zhang Chidong. 1993. Large-scale variability of atmospheric deep convection in relation to sea surface temperature in the tropics. Journal of Climate, 6: 1898–1913, doi: 10.1175/1520-0442(1993)006<1898:LSVOAD>2.0.CO;2 -


 下载:
下载:
