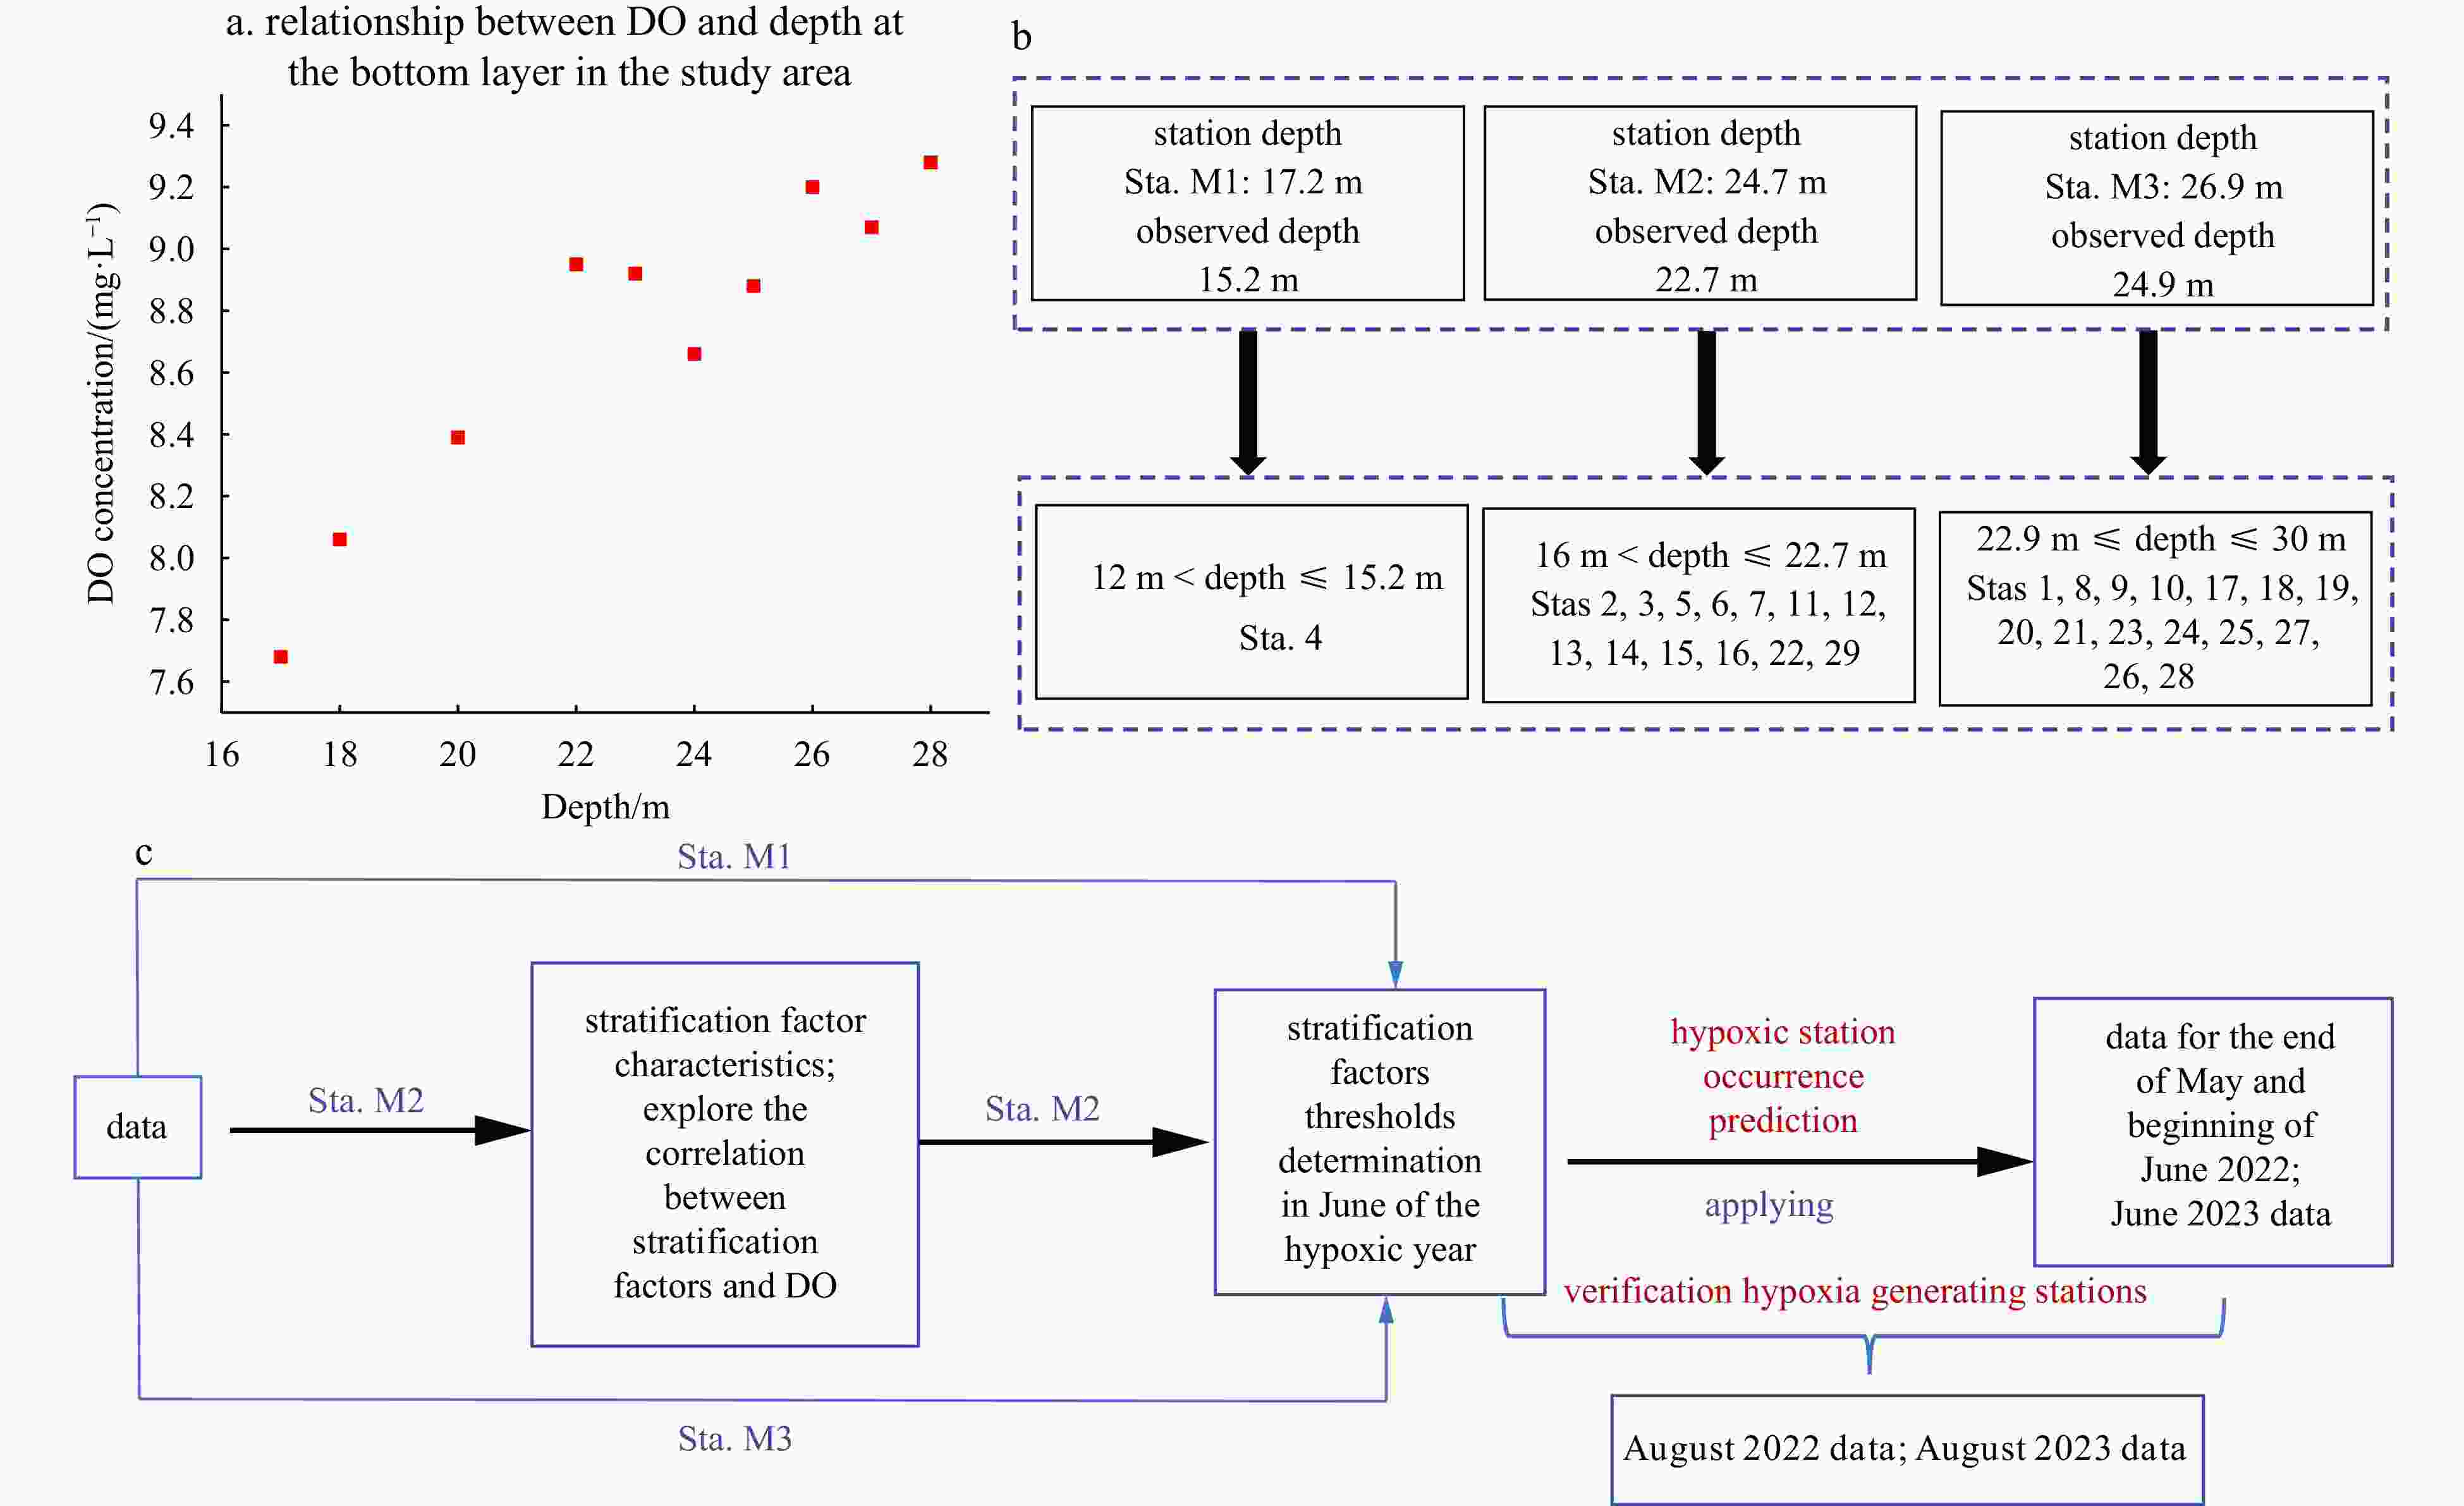
-
Abstract: In the last 10 years (2012–2021), five hypoxic events have been observed in summer in the central Bohai Sea (CBS). Frequent and persistent hypoxia will have an impact on the ecosystem of the CBS. In this paper, historical sea temperature (ST), salinity (SAL), density (Den), and dissolved oxygen (DO) concentration data from three stations in the CBS are analyzed via the linear regression method, and the correlations between the stratification factors (ST, SAL, and Den) and DO concentration are determined. The thresholds of the stratification factors at the three stations in June in the year in which hypoxia occurred were determined and applied to survey data from 29 stations in late May to early June in 2022 in the CBS; this assessment found that the data from 19 stations indicated that hypoxia was about to occur. In August, the survey data showed that 14 out of the 29 stations indicated hypoxic conditions, of which 12 were from the predicted 19 stations, meaning that the estimation accuracy reached 63%. The same approach was applied to data from June 2023. The data for August from a bottom-type online monitoring system in the CBS verified the occurrence of hypoxic events around Sta. M2. The results show that the strength of the seawater stratification plays a leading role in hypoxic events in the summer in the CBS, and the thresholds of the stratification factors can be used to predict the occurrence of hypoxic events.
-
Key words:
- hypoxia /
- central Bohai Sea /
- sea temperature /
- salinity /
- sea-water density /
- stratification
-
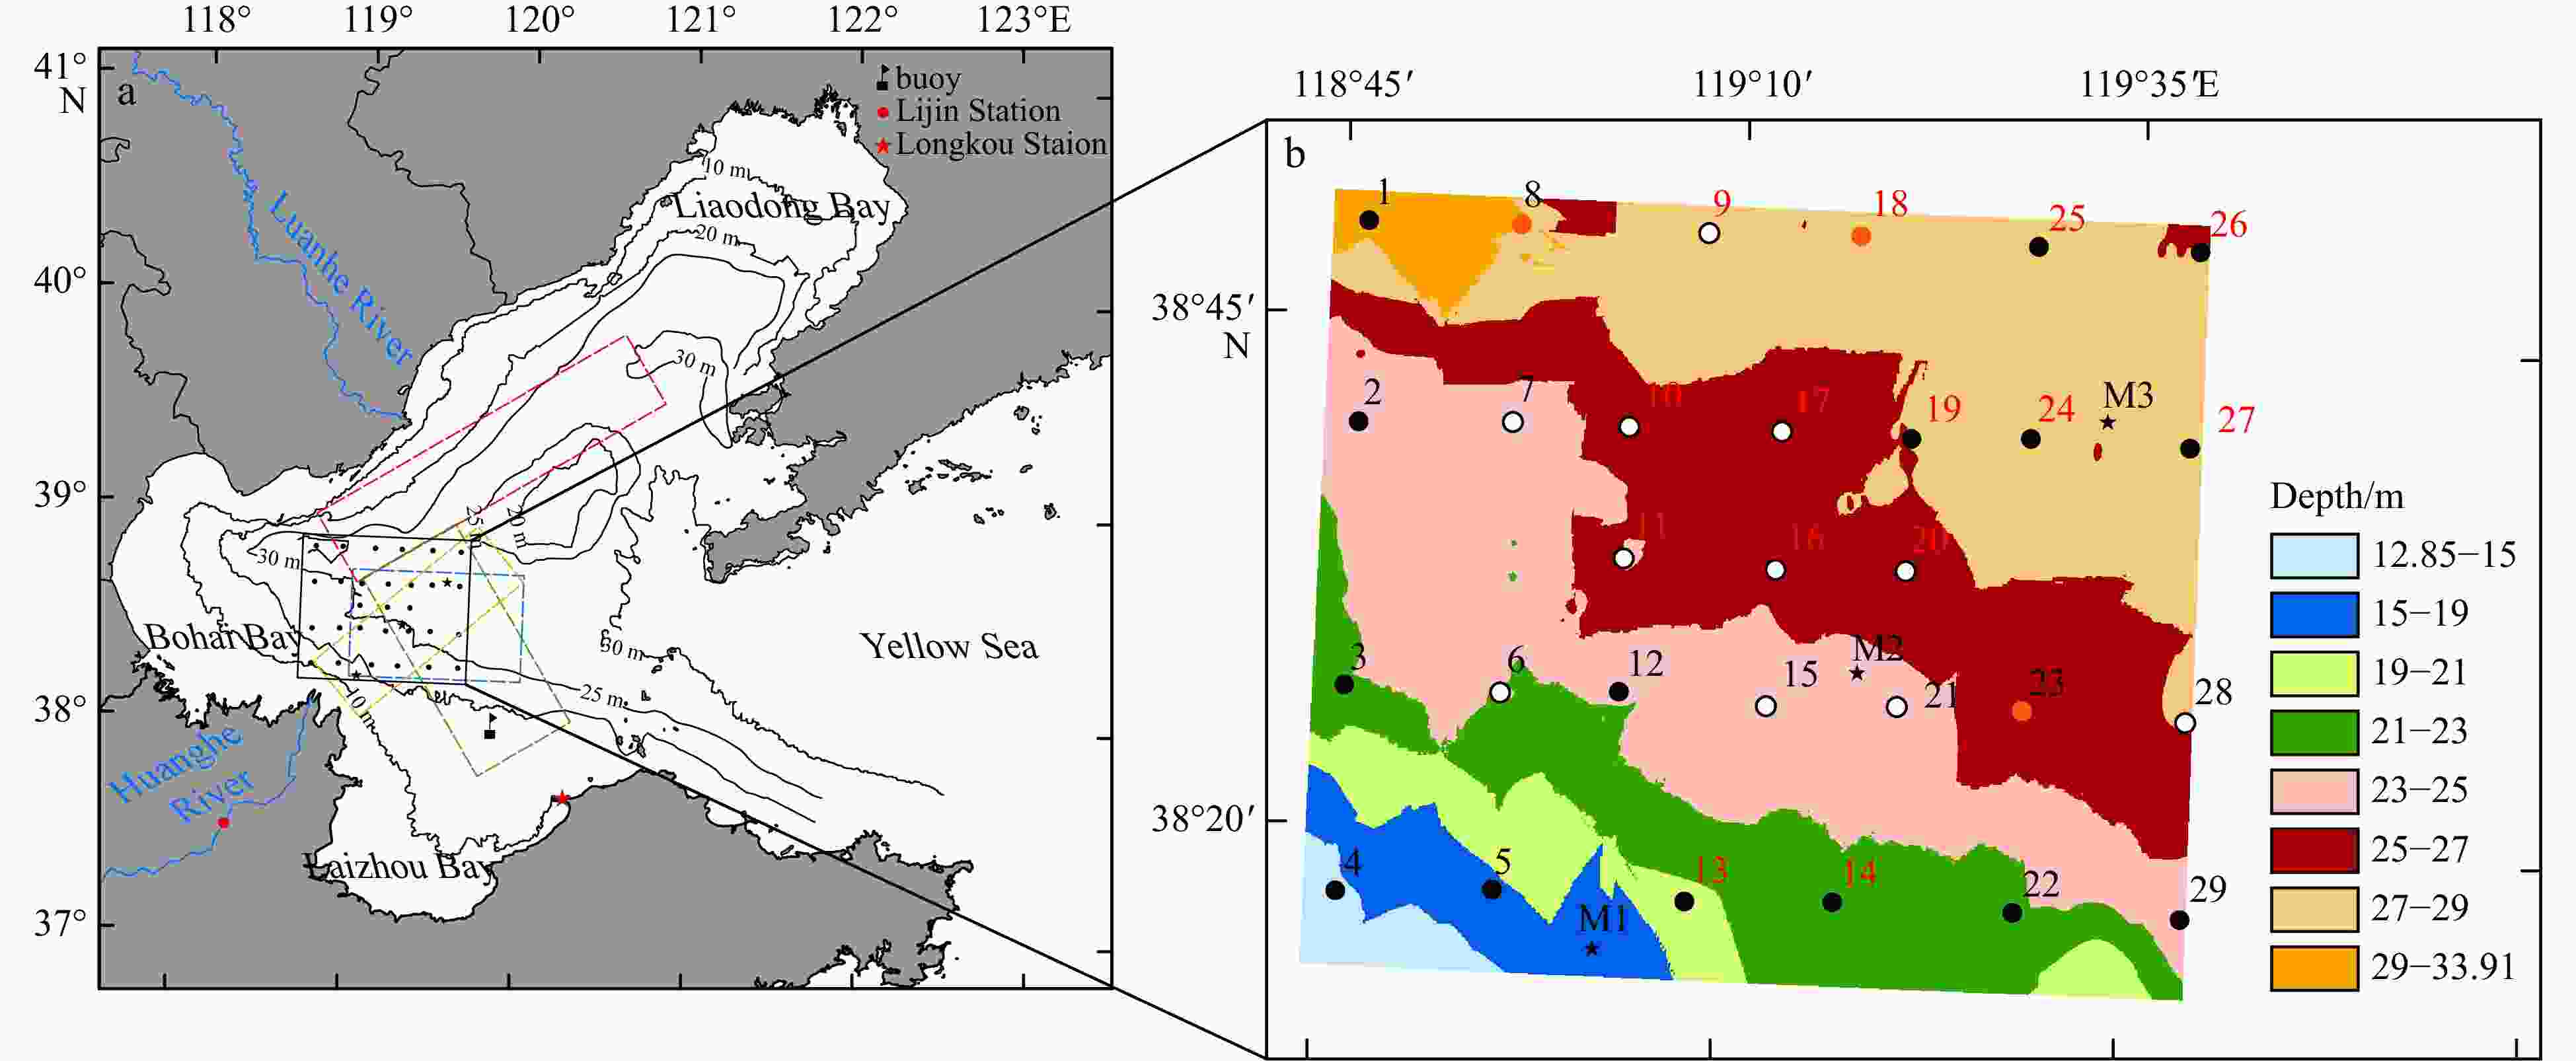
Figure 1. Locations of survey stations in the CBS (Stas M1, M2, and M3). a. The black box is the study area; b. twenty-nine stations were distributed in the study area. In a, the yellow, blue, red, and green dashed boxes denote the hypoxic zones investigated by Zhang et al. (2016), Jiang et al. (2016), Zhai et al. (2012), and Li et al. (2021), respectively. The black contours and values indicate the water depth (in unit of m). In b, the black dots indicate DO concentration values of ≥4 mg/L, the white dots indicate DO concentration values of 3–4 mg/L, and the red dots indicate DO concentration values of <3 mg/L in summer in 2022; the black numbers indicate before strong winds, and the red numbers indicate after strong winds during the summer in 2022.
Figure 3. Variations in the ST, SAL, Den, and DO concentration with depth in different seasons at Sta. M2 in the CBS from 2013 to 2022. a. ST from winter and spring, b. ST from summer and autumn, c. SAL from winter and spring, d. SAL from summer and autumn, e. density from winter and spring, f. density from summer and autumn, g. DO concentration from winter and spring, and h. DO concentration from summer and autumn. To achieve a better comparison, the data for December, February (dotted line), and April–June (*line) are plotted in Figs 3a, c, e, and g, and the data for August (line) and November (○line) are plotted in Figs 3b, d, f, and h.
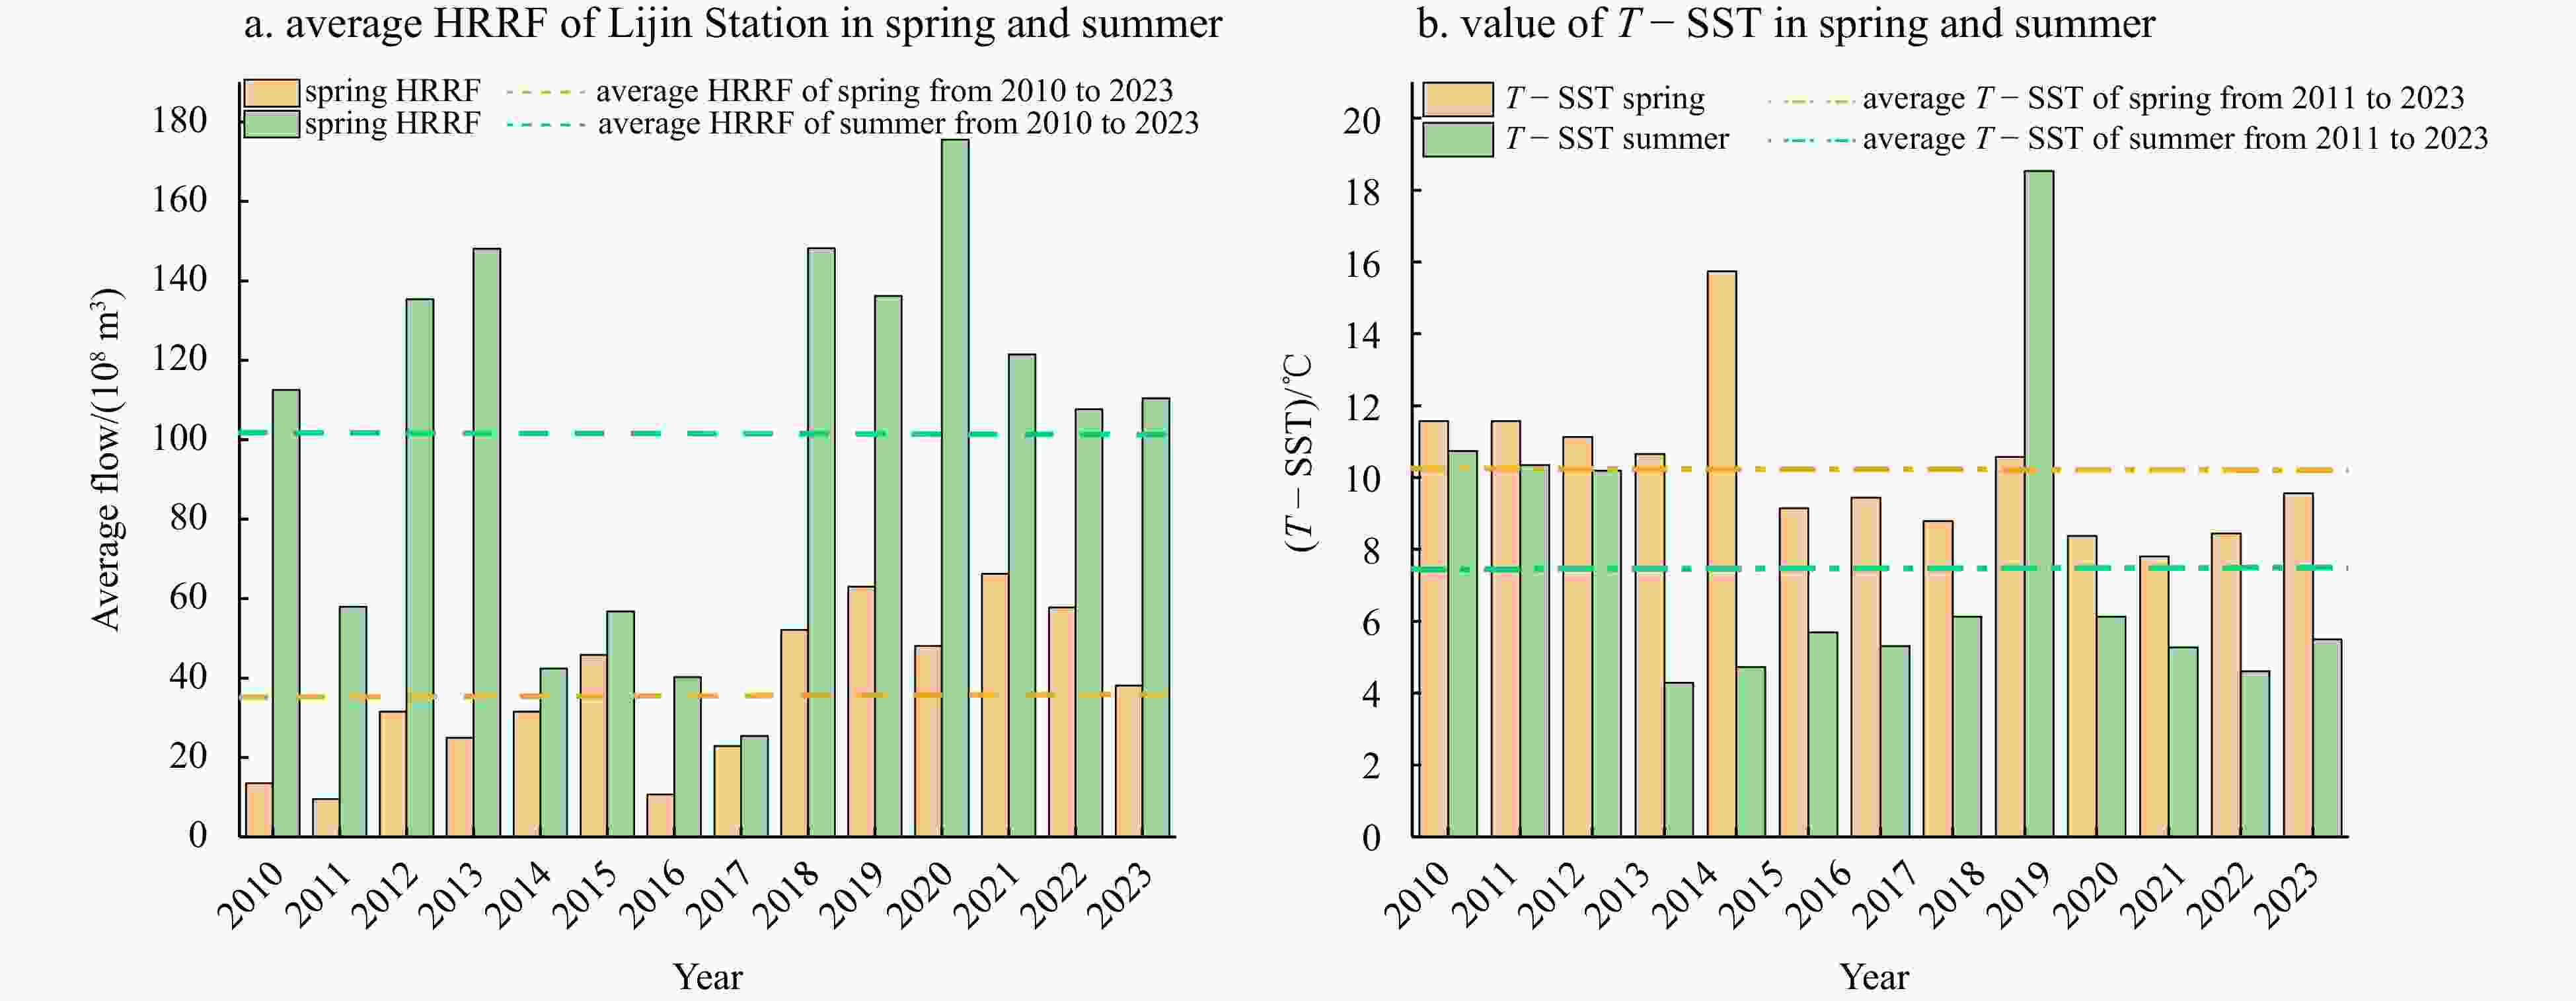
Figure 4. HRRF at Lijin Station and the air temperature T at Longkou Station minus the SST at the buoy statistics: a. the HRRF of spring and summer at the Lijin Station from 2010 to 2023, and b. the difference between T at Longkou Station and the SST at the buoy in the CBS in spring and summer from 2011 to 2022.
Figure 5. Information about the stratification factors and DO concentration at Stas M1 and M3 and distribution of flow field in the CBS. a. ST distribution with depth in May and June in 2015, 2017, and 2019; b. ST distribution with depth in August in 2014, 2015, and 2017; c. SAL distribution with depth in May and June in 2015, 2017, and 2019; d. SAL distribution with depth in August in 2014, 2015, and 2017; e. Den distribution with depth in May and June in 2015, 2017, and 2019; f. Den distribution with depth in August in 2014, 2015, and 2017; g. DO concentration distribution with depth in August in 2014, 2015, and 2017; and h. the maximum tidal current velocity in May 2022. In h, red dots: stations; red star: Stas M1, M2 and M3; contour lines and numbers represent the velocity (m/s) of the flow.
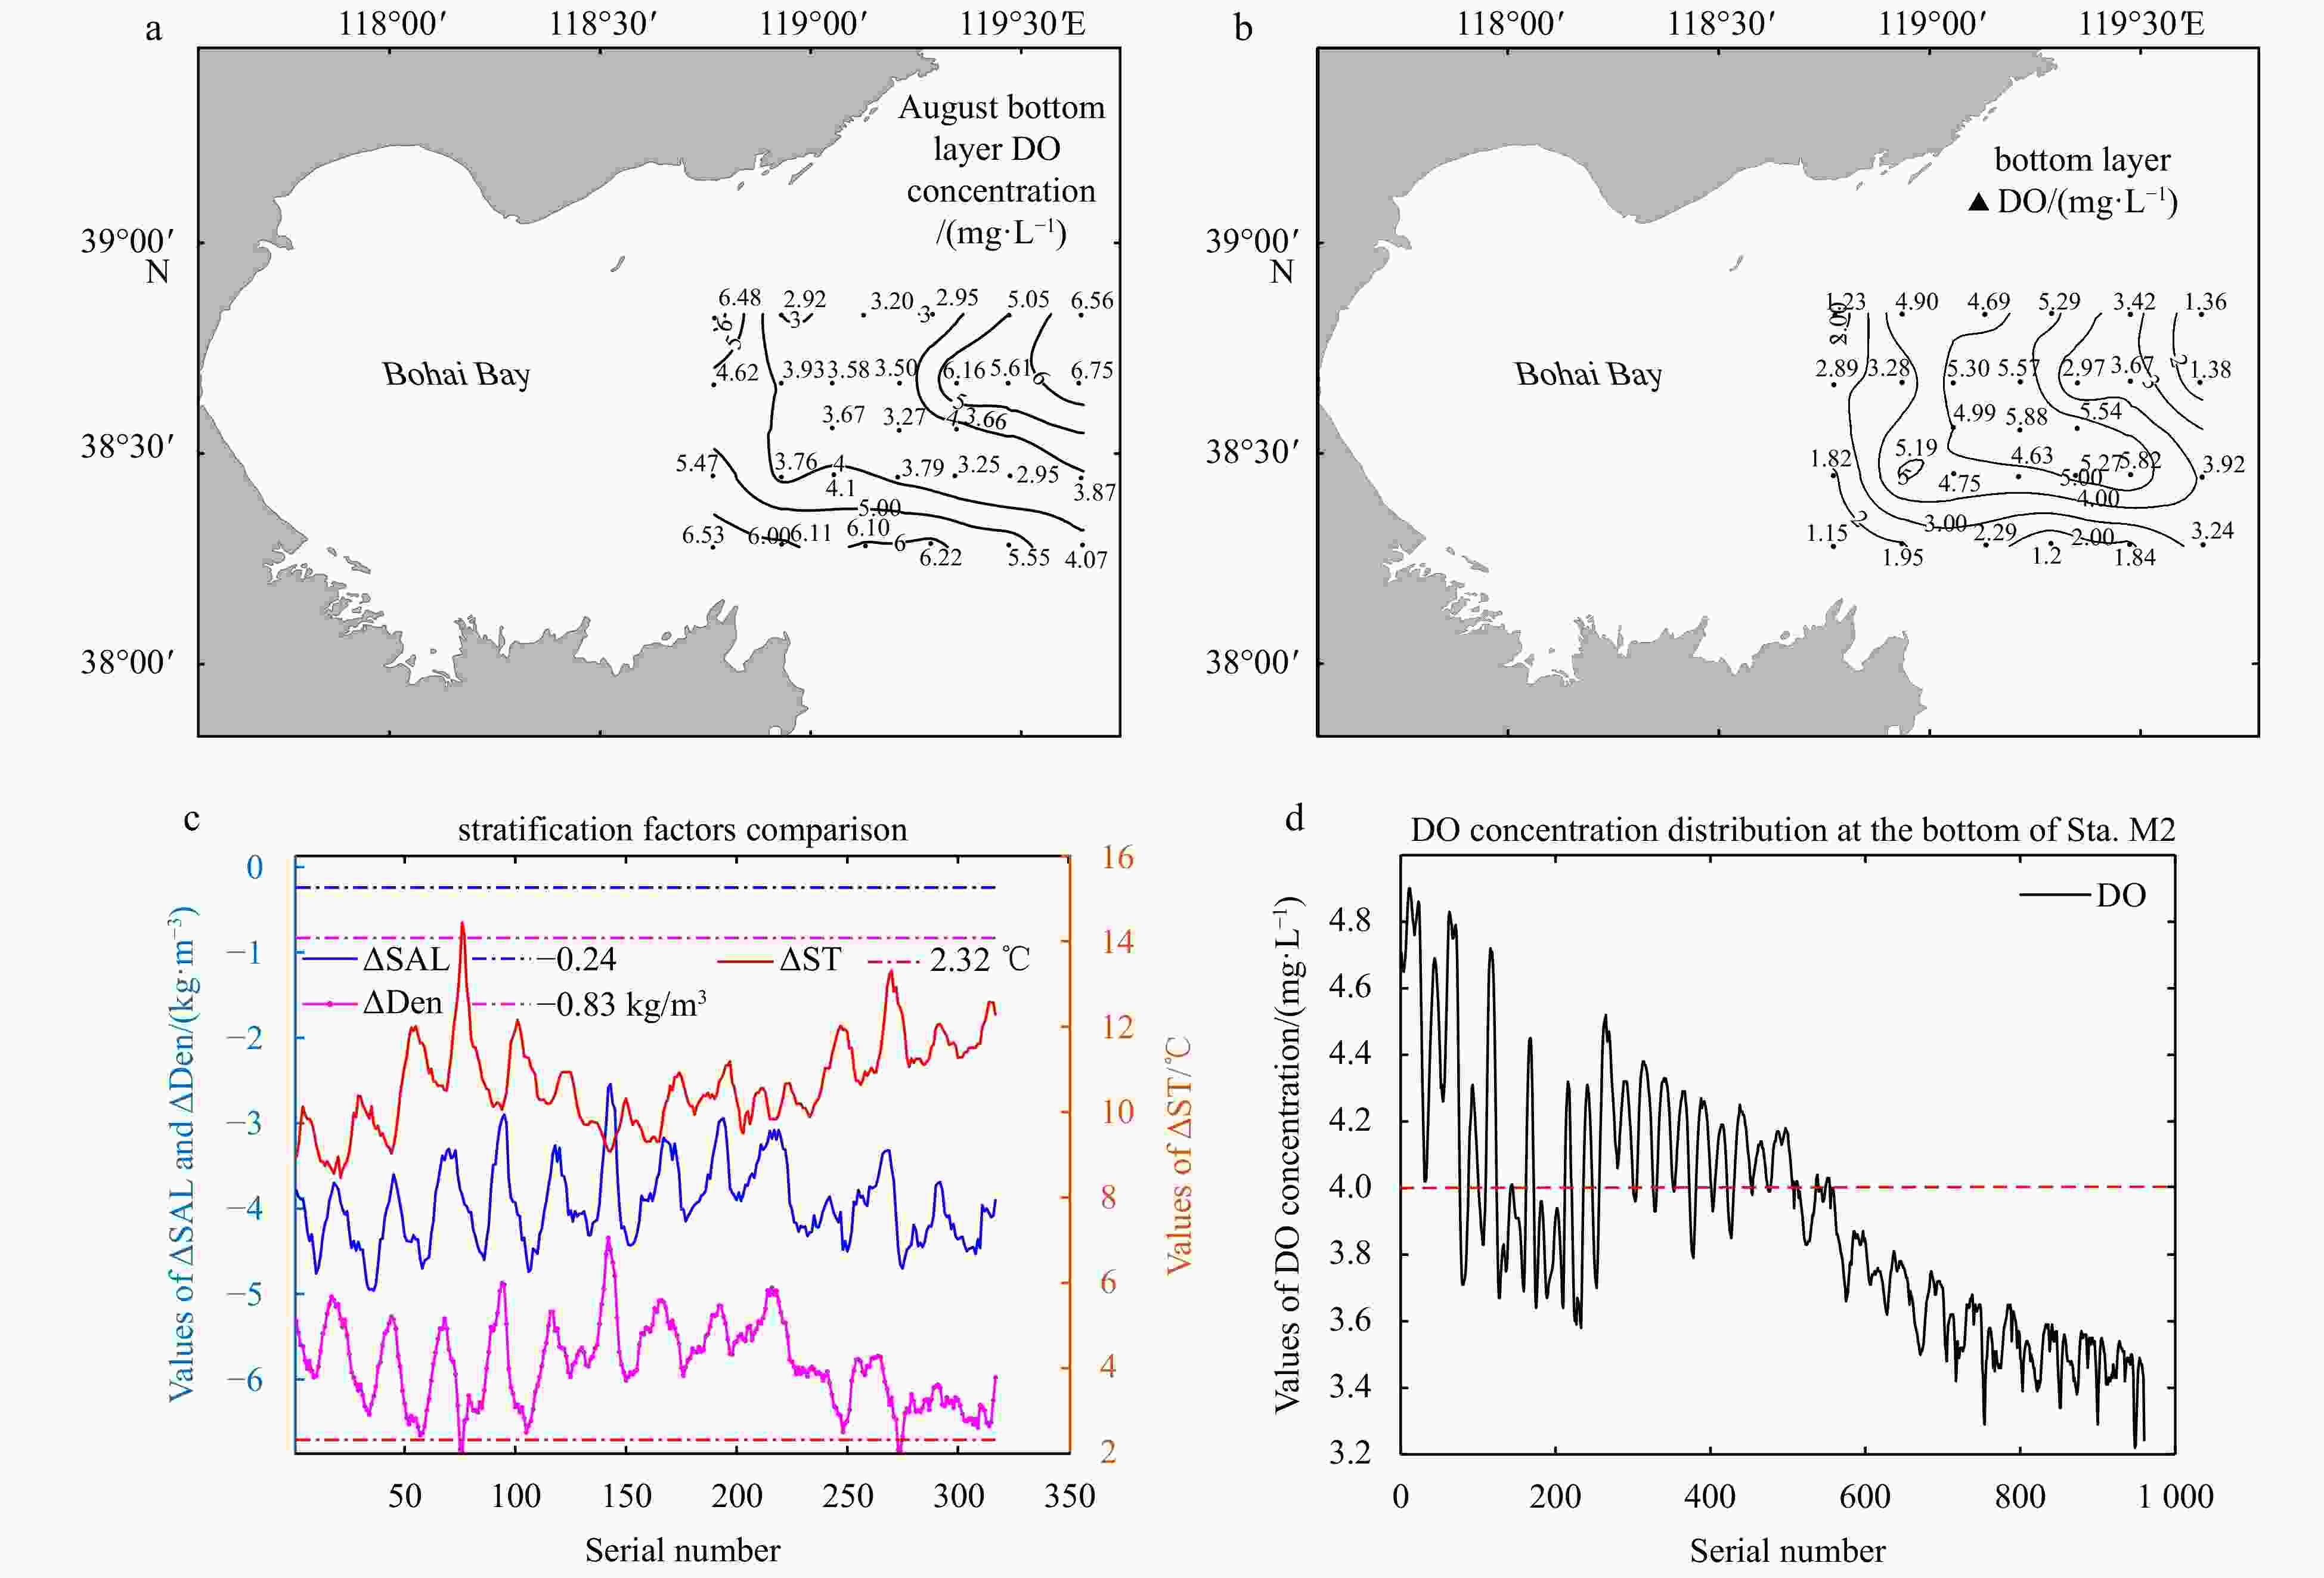
Figure 6. Hypoxic validation of the August 2022 and 2023 data in the CBS. a. DO concentration distribution in the bottom layers at the 29 stations in August 2022 (black numbers: DO concentration values); b. distribution of bottom DO concentration values in June 2022 minus bottom DO concentration values (▲DO) in August at the 29 stations (black numbers:▲DO concentration values); c. comparison of ▲stratification factors (surface value minus bottom value) and SFTs (dotted line) in June 2023; and d. DO concentration distribution (the dash line is DO concentration = 4 mg/L) at the bottom at Sta. M2 during August 1–20, 2023.
Table 1. Data sources of historical and real-time
Data classification Time Station Data Historical data 2013–2022 M1, M2, M3 ST, SAL, Den, DO concentration 2011–2022 Longkou Station T 2010–2022 Lijin Station Huanghe River runoff Real-time data June and August in 2022 Stas 1–29 ST, SAL, Den, DO concentration June–August in 2023 M2 ST, SAL, Den, DO concentration June–August in 2023 buoy SST, SAL Table 2. Simulation results of the correlations between the stratification factors and DO concentration
Correlation ST/℃ and DO
concentration/(mg·L–1)SAL and DO
concentration/(mg·L–1)Density/(kg·m–3) and
DO concentration/(mg·L–1)y DO concentration DO concentration DO concentration x ST SAL Density Formula Y = 10.482 − 0.002x2.5 + 4.42 × exp(x) Y = 10.08 − 3.6/{1 + [(x − 31.54)/0.14]2} y = 5.7 × 10⁶ − 1.67 × 10⁴x + 16.27 × x2 − 5.3 × 10−3x3 R 0.91 0.45 0.81 RMSE/
(mg·L–1)0.97 2.06 1.34 SSE 74.62 335.06 141.52 R-squared 0.84 0.20 0.66 DC 0.82 0.20 0.66 Correlation ΔST/℃ and ΔDO
concentration/(mg·L–1)ΔSAL and ΔDO
concentration/(mg·L–1)ΔDen/(kg·m–3) and ΔDO
concentration/(mg·L–1)y ΔDO concentration ΔDO concentration ΔDO concentration x ΔST ΔSAL ΔDen Formula y = 3.36 × exp[−exp(110.06 – 47.53 x)] y = exp[−25.74 + 82.61x3+21.82exp(−x)] y = (0.69 + x)/(8.04 + 7.84x) − 1.05x R 0.82 0.78 0.81 RMSE/
(mg·L–1)0.96 1.05 0.97 SSE 17.64 20.77 17.99 R-squared 0.66 0.61 0.67 DC 0.66 0.60 0.66 Table 3. SFTs for Stas M1, M2, and M3 in June during a hypoxia year
Item Value Sta. M1 Sta. M2 Sta. M3 ΔST/°C (assessment SFTs of hypoxia in June ) − ≥2.32 ≥3.54 ΔSAL (assessment SFTs of hypoxia in June) − ≤−0.24 ≤−0.17 ΔDen/(kg·m–3) (assessment SFTs of hypoxia in June) − ≤−0.83 ≤−1.04 Note:− indicates that there is no threshold. Table 4. Assessment of the stratification factors for June, 2022
Station Sta. M2 Station Sta. M3 ΔST ≥ 2.32 ℃ ΔSAL ≤ −0.24 ΔDen ≤ −0.83 kg/m3 ΔST > 3.5 ℃ SAL ≤ −0.17 ΔDen ≤ −1.04 kg/m3 2, 3 √ × √ 1 √ × √ 5 × × × 8, 26 × × × 6, 29 √ × √ 9, 10, 17 √ √ √ 7, 11, 12 √ √ √ 18, 19, 20 √ √ √ 13 √ × × 21, 23, 24, √ √ √ 14, 15 √ √ √ 25, 27, 28 √ √ √ 16, 22 √ √ √ 29 √ × × Note: √ indicates that the stratification factor thresholds are satisfied. × indicates that the stratification factor thresholds are not satisfied. -
Bao Xianwen, Wan Xiuquan, Wu Dexing, et al. 2004. Hydrologic characteristics of the end summertime in 2000 and early wintertime in the Bohai Sea. Haiyang Xuebao (in Chinese), 26(1): 14–24 Bulletin of the State of the Marine Environment of China, 2010. http://cn.chinagate.cn/reports/ 2011-06/08/content_22736793.htm Chen Chung-Chi, Gong Gwo-Ching, Shiah Fuh-Kwo. 2007. Hypoxia in the East China Sea: one of the largest coastal low-oxygen areas in the world. Marine Environmental Research, 64(4): 399–408, doi: 10.1016/j.marenvres.2007.01.007 Conley D J, Humborg C, Rahm L, et al. 2002. Hypoxia in the Baltic Sea and basin-scale changes in phosphorus biogeochemistry. Environmental Science & Technology, 36(24): 5315–5320, doi: 10.1021/es025763w Diaz R J. 2001. Overview of hypoxia around the World. Journal of Environmental Quality, 30(2): 275–281, doi: 10.2134/jeq2001.302275x Ding Yang, Bao Xianwen, Yao Zhigang, et al. 2019. Observational and model studies of synoptic current fluctuations in the Bohai Strait on the Chinese continental shelf. Ocean Dynamics, 69(3): 323–351, doi: 10.1007/s10236-019-01247-5 Hagy J D, Boynton W R, Keefe C W, et al. 2004. Hypoxia in Chesapeake Bay, 1950–2001: long-term change in relation to nutrient loading and river flow. Estuaries, 27(4): 634–658, doi: 10.1007/BF02907650 Hetland R D, Dimarco S F. 2008. How does the character of oxygen demand control the structure of hypoxia on the Texas-Louisiana continental shelf? Journal of Marine Systems, 70(1/2): 49–62 Huang D J, Su J L, Backhaus J O. 1999. Modelling the seasonal thermal stratification and baroclinic circulation in the Bohai Sea. Continental Shelf Research, 19(11): 1485–1505, doi: 10.1016/S0278-4343(99)00026-6 Jiang Tao, Xu Yong, Liu Chuanxia, et al. 2016. Report on the occurrence of hypoxia in the central Bohai Sea. Progress in Fishery Sciences (in Chinese), 37(4): 1–6 Li Zhicheng, Wei Hao, Zhang Haiyan, et al. 2021. The interannual difference in summer bottom oxygen deficiency in Bohai Sea. Oceanologia et Limnologia Sinica (in Chinese), 52(3): 601–613 Li Daoji, Zhang Jing, Huang Daji, et al. 2002. Oxygen depletion off the Changjiang (Yangtze River) Estuary. Science in China Series D: Earth Sciences, 45(12): 1137–1146, doi: 10.1360/02yd9110 Lin Jing, Xie Lian, Pietrafesa L J, et al. 2006. Dissolved oxygen stratification in two micro-tidal partially-mixed estuaries. Estuarine, Coastal and Shelf Science, 70(3): 423–437 Lin Jing, Xu Hongzhou, Cudaback C, et al. 2008. Inter-annual variability of hypoxic conditions in a shallow estuary. Journal of Marine Systems, 73(1/2): 169–184, doi: 10.1016/j.jmarsys.2007.10.011 Locarnini R A, Mishonov A V, Baranova O K, et al. 2018. World Ocean Atlas 2018, Volume 1: Temperature (Technical report). NOAA Atlas NESDIS 81, https://www.researchgate.net/publication/335057554_World_Ocean_Atlas_2018_Volume_1_Temperature Luo Lin, Li Shiyu, Li Hongmei. 2005. Characteristics of dissolved oxygen and its affecting factors in the Pearl River estuary in summer. Acta Scientiarum Naturalium Universitatis Sunyatseni (in Chinese), 44(6): 118–122 Rabalais N N, Díaz RJ, Levin L A, et al. 2010. Dynamics and distribution of natural and human-caused hypoxia. Biogeosciences, 7(2): 585–619, doi: 10.5194/bg-7-585-2010 Rabalais N N, Turner R E, Sen Gupta B K, et al. 2007. Hypoxia in the northern Gulf of Mexico: Does the science support the plan to reduce, mitigate, and control hypoxia? Estuaries and Coasts, 30(5): 753–772. Rabalais N N, Turner R E, Wiseman Jr W J. 2002. Gulf of Mexico Hypoxia, A. K. A. “The Dead Zone”. Annual Review of Ecology, Evolution, and Systematics, 33: 235–263 Taft J L, Taylor W R. , Hartwig E O. et al. 1980. Seasonal oxygen depletion in Chesapeake Bay. Estuaries 3: 242–247. https://doi.org/10.2307/1352079 Turner R E, Schroeder W W, Wiseman W J. 1987. The role of stratification in the deoxygenation of Mobile Bay and adjacent shelf bottom waters. Estuaries, 10(1): 13–19, doi: 10.2307/1352020 Vaquer-Sunyer R, Duarte C M. 2008. Thresholds of hypoxia for marine biodiversity. Proceedings of the National Academy of Sciences of the United States of America, 105(40): 15452–15457 Wang Jinhua, Shen Yongming, Guo Yakun. 2010. Seasonal circulation and influence factors of the Bohai Sea: a numerical study based on Lagrangian particle tracking method. Ocean dynamics, 60(6): 1581–1596, doi: 10.1007/s10236-010-0346-7 Wei Hao, He Yunchang, Li Qingji, et al. 2007. Summer hypoxia adjacent to the Changjiang Estuary. Journal of Marine Systems, 67(3-4): 292–303, doi: 10.1016/j.jmarsys.2006.04.014 Wei Qinsheng, Wang Baodong, Yao Qingzhen, et al. 2019. Spatiotemporal variations in the summer hypoxia in the Bohai Sea (China) and controlling mechanisms. Marine Pollution Bulletin, 138: 125–134, doi: 10.1016/j.marpolbul.2018.11.041 Wei Hao, Zhao Liang, Zhang Haiyan, et al. 2021. Summer hypoxia in Bohai Sea caused by changes in phytoplankton community. Anthropocene Coasts, 4(1): 77–86, doi: 10.1139/anc-2020-0017 Wu R S S. 2002. Hypoxia: from molecular responses to ecosystem responses. Marine Pollution Bulletin, 45(1–12): 35–45, doi: 10.1016/S0025-326X(02)00061-9 Wu Xiao, Wu Hui, Wang Houjie, et al. 2019. Novel, repeated surveys reveal new insights on sediment flux through a narrow strait, Bohai, China. Journal of Geophysical Research: Oceans, 124(10): 6927–6941, doi: 10.1029/2019JC015293 Zhai Weidong, Zhao Huade, Zheng Nan, et al. 2012. Oxygen consumption and acidification of the bottom layer in the northwestern and northern coastal waters of the Bohai Sea in summer 2011. Chinese Science Bulletin (in Chinese), 57(9): 753–758, doi: 10.1360/csb2012-57-9-753 Zhang J, Gilbert D, Gooday A J, et al. 2010. Natural and human-induced hypoxia and consequences for coastal areas: synthesis and future development. Biogeosciences, 7(5): 1443–1467, doi: 10.5194/bg-7-1443-2010 Zhang Hua, Li Yanfang, Tang Cheng, et al. 2016. Spatial characteristics and formation mechanisms of bottom hypoxia zone in the Bohai Sea during summer. Chinese Science Bulletin, 61(14): 1612–1620, doi: 10.1360/N972015-00915 Zhang Yingying, Zhang Jing, Wu Ying, et al. 2007. Characteristics of dissolved oxygen and its affecting factors in the Yangtze Estuary. Environmental Science (in Chinese), 28(8): 1649–1654 Zheng Xiangyang, Zhang Hua, Li Yanfang, et al. 2021. The features and mechanisms of the North Shandong Coastal Current: a case study in 2014. Journal of Oceanography, 77(4): 631–646, doi: 10.1007/s10872-021-00597-3 Zhou Feng, Huang Daji, Xue Huijie, et al. 2017. Circulations associated with cold pools in the Bohai Sea on the Chinese continental shelf. Continental Shelf Research, 137: 25–38, doi: 10.1016/j.csr.2017.02.005 Zu Tingting, Bao Xianwen, Xie Jun, et al. 2005. Distribution and variation trends of the environmental factors in the central section of the Bohai Sea. Periodical of Ocean University of China (in Chinese), 35(6): 889–894 -


 下载:
下载:


