

Population structure and genetic diversity of hairfin anchovy (Setipinna tenuifilis) revealed by microsatellite markers
-
Abstract: Microsatellite markers with polymorphic advantages are widely used in the exploration and utilization of marine fishery resources. In this study, 16 polymorphic microsatellite markers were used to evaluate the diversity and population structure of Setipinna tenuifilis, a nearshore fish of economic and ecological value in the western Pacific and Indian Oceans. The genetic diversity of S. tenuifilis showed a high level (mean Na=23.25, mean Ho=0.639, mean Ra=11.625, and PIC=0.844) similar to other Clupeiformes fish species. The nine wild S. tenuifilis populations showed significant differentiation (FST ranging from
0.00384 to0.19346 ) and were generally divided into southern and northern populations based on genetic structure, except for the Zhoushan population, which exhibited genetic mixture. Our results provide fundamental but significant genetic insights for the management and conservation of S. tenuifilis fishery resources.-
Key words:
- microsatellite /
- population structure /
- genetic diversity /
- Setipinna tenuifilis
-

Figure 1. Schematic map of sampling locations along the coastal waters of China. A total of 180 individuals of S. tenuifilis from nine geographic locations (DL, QH, QD, LY, NT, ZZ, PX, GS, and ZJ) were collected for population analysis.

Figure 2. Plots of results of outlier tests. a. The hierarchical island model test for selection completed using the program Arlequin. The genetic differentiation (FST) is plotted against expected heterozygosity (He). b. The Bayesian test for selection completed using the program BayeScan. The dots on the right side of the vertical line are above a 0.99 probability of being candidates of selection.

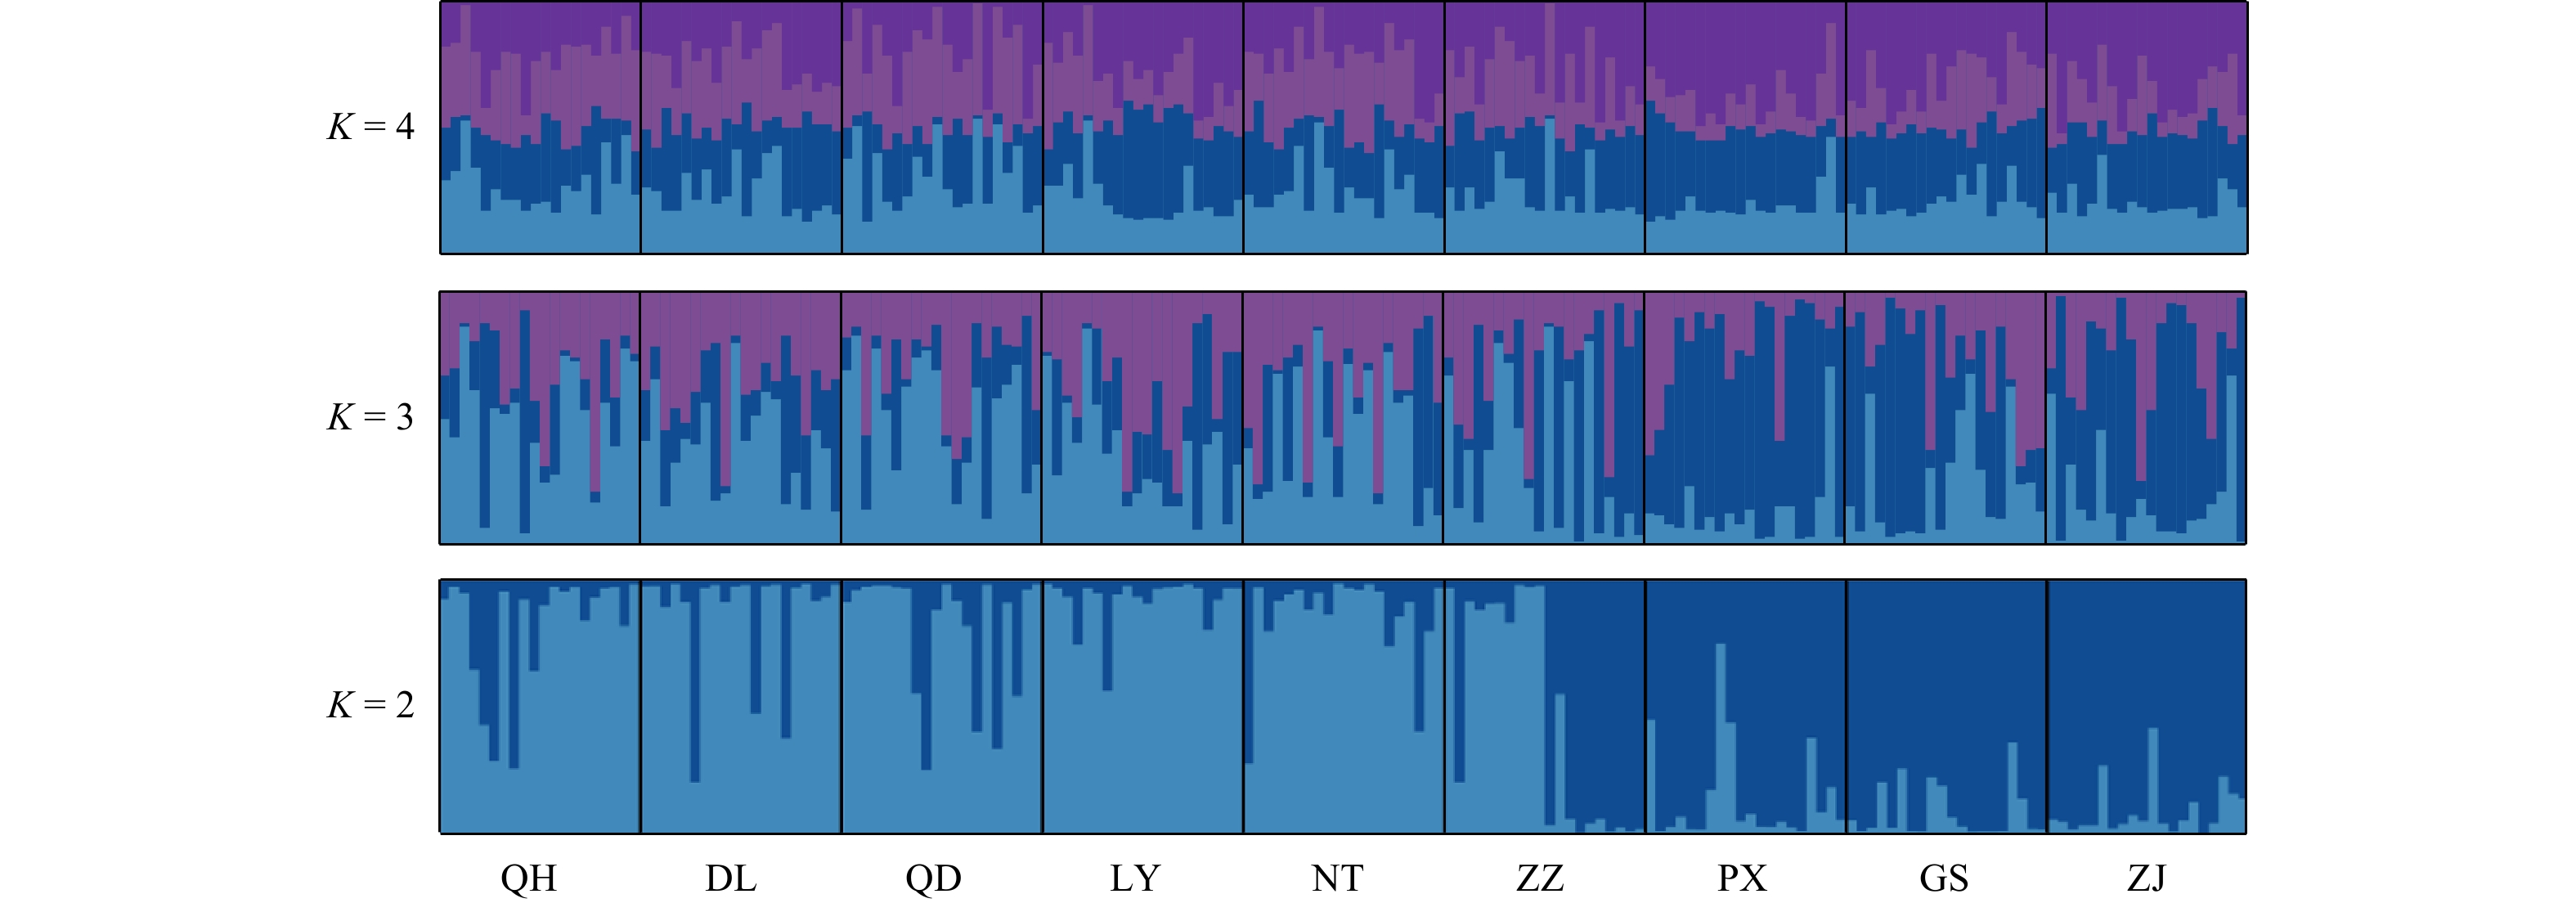
Figure 3. Population structure obtained from the STRUCTURE analysis (K=2, 3, 4). Individuals are represented by vertical bars. Different colours in the same individual indicate the percentage of the genome shared with each cluster according to the admixture proportions. The Y-axis represents the probability of belonging to a certain cluster, while the X-axis represents each population delimited by a black solid vertical line.

Figure 5. Mean sea surface temperature (a) and mean sea surface salinity (b) in the coastal region of China.
Table 1. The genetic diversity of 16 polymorphic microsatellite markers for S. tenuifilis
Locus Na Ho He PIC HWE Fnull Sten01 20 0.794 0.869 0.899 NS 0.0664 Sten02 31 0.750 0.899 0.923 *** 0.1080 Sten03 21 0.756 0.887 0.918 *** 0.1013 Sten04 32 0.572 0.914 0.951 *** 0.2498 Sten05 17 0.867 0.861 0.887 NS 0.0163 Sten06 18 0.394 0.680 0.677 *** 0.2921 Sten07 27 0.611 0.770 0.792 *** 0.1190 Sten08 22 0.544 0.877 0.906 *** 0.2517 Sten09 45 0.467 0.914 0.956 *** 0.3455 Sten10 28 0.450 0.889 0.936 *** 0.3531 Sten11 17 0.700 0.808 0.818 *** 0.0879 Sten12 21 0.817 0.880 0.904 NS 0.0551 Sten13 12 0.572 0.668 0.714 *** 0.1288 Sten14 17 0.606 0.809 0.845 *** 0.1739 Sten15 29 0.911 0.892 0.925 NS 0.0086 Sten16 15 0.411 0.418 0.445 NS 0.0645 Mean 23.25 0.639 0.815 0.844 0.1514 Notes: Na represents number of alleles, Ho observed heterozygosity, He expected heterozygosity, PIC polymorphic information content, HWE deviation from the Hardy-Weinberg equilibrium (NS meaning non-significant and *** less than 0.0001 ), and Fnull null allele frequency. 下载: 导出CSV
Table 2. Genetic diversity of nine S. tenuifilis populations
Population Ra Na Ho He QH 12.125 12.125 0.616 0.805 DL 11.688 11.688 0.578 0.787 QD 12.188 12.188 0.638 0.798 LY 11.813 11.813 0.659 0.814 NT 11.688 11.688 0.625 0.805 ZZ 11.188 11.188 0.625 0.838 PX 11.188 11.188 0.663 0.816 GS 10.938 10.938 0.678 0.822 ZJ 11.813 11.813 0.669 0.847 Mean 11.625 11.625 0.639 0.815 Notes: Ra represents allelic richness, Na number of alleles, Ho observed heterozygosity, and He expected heterozygosity.
下载: 导出CSV
Table 3. Pairwise genetic differentiation (FST) for nine S. tenuifilis populations using microsatellites
QH DL QD LY NT ZZ PX GS ZJ QH DL 0.0327 QD 0.0240 0.0229 LY 0.0190 0.0265 0.0174 NT 0.0120 0.0295 0.0147 0.0198 ZZ 0.0158 0.0345 0.0249 0.0249 0.0182 PX 0.0370 0.0504 0.0381 0.0312 0.0281 0.0220 GS 0.0373 0.0515 0.0443 0.0364 0.0329 0.0165 0.0076 ZJ 0.0368 0.0479 0.0466 0.0366 0.0423 0.0115 0.0227 0.0093 Notes: Extremely significant difference probability values (p<0.01) following correction for multiple tests are indicated in bold.
下载: 导出CSV
Table 4. Analysis of molecular variance (AMOVA) of S. tenuifilis populations using microsatellites
Sources of variations df Sum of squares Variance components Percentage of variation Fixation indices Total (QH, DL, QD, LY, NT, PX, GS, ZJ) Among all populations 7 105.728 0.21106 Va3.07 FST = 0.03071 *Within populations 312 2078.400 6.66154 Vb96.93 Two groups (QH, DL, QD, LY, NT) (PX, GS, ZJ) Among groups 1 34.978 0.15458 Va2.23 FCT = 0.02226 *Among populations within group 6 70.750 0.12825 Vb1.85 FSC = 0.01889 *Within populations 312 2078.400 6.66154 Vc95.93 FST = 0.04073 *
下载: 导出CSV
Table 5. Bottleneck analysis of S. tenuifilis populations under the two-phase mutation model (TPM) and stepwise mutation model (SMM)
Population Wilcoxon test Mode-shift test TPM SMM One tail for
H deficiencyOne tail for
H excessOne tail for
H deficiencyOne tail for
H excessQH 0.21660 0.79813 0.10571 0.90360 normal L-shaped DL 0.01932 0.98323 0.00459 0.99619 normal L-shaped QD 0.00912 0.99225 0.00775 0.99345 normal L-shaped LY 0.37178 0.64714 0.23187 0.78340 normal L-shaped NT 0.20187 0.81227 0.14893 0.86278 normal L-shaped ZZ 0.62822 0.39098 0.44997 0.56987 normal L-shaped PX 0.03696 0.96730 0.01677 0.98550 normal L-shaped GS 0.21660 0.79813 0.09641 0.91232 normal L-shaped ZJ 0.53006 0.48998 0.31609 0.70171 normal L-shaped
下载: 导出CSV
-
Arranz J J, Bayón Y, San Primitivo F. 2001. Genetic variation at microsatellite loci in Spanish sheep. Small Ruminant Research, 39(1): 3–10, doi: 10.1016/s0921-4488(00)00164-4 Beaumont M A. 2008. Selection and sticklebacks. Molecular Ecology, 17(15): 3425–3427, doi: 10.1111/j.1365-294x.2008.03863.x Beaumont M A, Balding D J. 2004. Identifying adaptive genetic divergence among populations from genome scans. Molecular Ecology, 13(4): 969–980, doi: 10.1111/j.1365-294x.2004.02125.x Cornuet J M, Luikart G. 1996. Description and power analysis of two tests for detecting recent population bottlenecks from allele frequency data. Genetics, 144(4): 2001–2014, doi: 10.1093/genetics/144.4.2001 Earl D A, VonHoldt B M. 2012. STRUCTURE HARVESTER: a website and program for visualizing STRUCTURE output and implementing the Evanno method. Conservation Genetics Resources, 4(2): 359–361, doi: 10.1007/s12686-011-9548-7 Evanno G, Regnaut S, Goudet J. 2005. Detecting the number of clusters of individuals using the software STRUCTURE: a simulation study. Molecular Ecology, 14(8): 2611–2620., doi: 10.1111/j.1365-294X.2005.02553.x Excoffier L, Hofer T, Foll M. 2009. Detecting loci under selection in a hierarchically structured population. Heredity, 103(4): 285–298, doi: 10.1038/hdy.2009.74 Excoffier L, Lischer H E L. 2010. Arlequin suite ver 3.5: a new series of programs to perform population genetics analyses under Linux and Windows. Molecular Ecology Resources, 10(3): 564–567, doi: 10.1111/j.1755-0998.2010.02847.x Ferrada-Fuentes S, Galleguillos R, Canales-Aguirre C B, et al. 2018. Development and characterization of thirty-two microsatellite markers for the anchovy, Engraulis ringens Jenyns, 1842 (Clupeiformes, Engraulidae) via 454 pyrosequencing. Latin American Journal of Aquatic Research, 46(2): 452–456, doi: 10.3856/vol46-issue2-fulltext-19 Foll M, Gaggiotti O. 2008. A genome-scan method to identify selected loci appropriate for both dominant and codominant markers: a Bayesian perspective. Genetics, 180(2): 977–993, doi: 10.1534/genetics.108.092221 Goudet J. 2001. FSTAT, a program to estimate and test gene diversities and fixation (version 2.9. 3.2). https://www.scienceopen.com/document?vid=188bd209-47c8-4e90-8a28-4f744b22cf85[2011-06-18/2023-11-01] Han Zhiqiang, Guo Xinyu, Liu Qun, et al. 2021. Whole-genome resequencing of Japanese whiting (Sillago japonica) provide insights into local adaptations. Zoological Research, 42(5): 548–561, doi: 10.24272/j.issn.2095-8137.2021.116 Hedrick P W. 2005. A standardized genetic differentiation measure. Evolution, 59(8): 1633–1638, doi: 10.1554/05-076.1 Hulce D, Li X, Snyder-Leiby T, et al. 2011. GeneMarker® genotyping software: Tools to increase the statistical power of DNA fragment analysis. Journal of Biomolecular Techniques, 22(S): S35–S36 Jakobsson M, Rosenberg N A. 2007. CLUMPP: a cluster matching and permutation program for dealing with label switching and multimodality in analysis of population structure. Bioinformatics, 23(14): 1801–1806, doi: 10.1093/bioinformatics/btm233 Kalinowski S T, Taper M L, Marshall T C. 2007. Revising how the computer program CERVUS accommodates genotyping error increases success in paternity assignment. Molecular Ecology, 16(5): 1099–1106, doi: 10.1111/j.1365-294X.2007.03089.x Larmuseau M H D, Van Houdt J K J, Guelinckx J, et al. 2009. Distributional and demographic consequences of Pleistocene climate fluctuations for a marine demersal fish in the north-eastern Atlantic. Journal of Biogeography, 36(6): 1138–1151, doi: 10.1111/j.1365-2699.2008.02072.x Li Jiasheng, Liu Bingjian, Chen Shiyi, et al. 2022. Development and characterization of seventeen novel microsatellite markers in common hairfin anchovy (Setipinna tenuifilis) using third-generation sequencing technology. Journal of Applied Ichthyology, 38(4): 462–467, doi: 10.1111/jai.14335 Liu Yong, Cheng Jiahua, Li Shengfa. 2004. A study on the distribution of Setipinna taty in the East China Sea. Marine Fisheries (in Chinese), 26(4): 255–260, doi: 10.3969/j.issn.1004-2490.2004.04.002 Liu Bingjian, Li Jiasheng, Peng Ying, et al. 2024. Chromosome-level genome assembly and population genomic analysis reveal evolution and local adaptation in common hairfin anchovy (Setipinna tenuifilis). Molecular Ecology, 33(10): e17067, doi: 10.1111/mec.17067 Maggs C A, Castilho R, Foltz D, et al. 2008. Evaluating signatures of glacial refugia for North Atlantic benthic marine taxa. Ecology, 89(sp11): S108–S122, doi: 10.1890/08-0257.1 Mu Jinglong, Zhang Shanshan, Liang Cui, et al. 2020. Temporal and spatial distribution and mixing behavior of nutrients in the Changjiang River Estuary. Marine Sciences (in Chinese), 44(1): 19–35 Narum S R, Hess J E. 2011. Comparison of FST outlier tests for SNP loci under selection. Molecular Ecology Resources, 11(s1): 184–194, doi: 10.1111/j.1755-0998.2011.02987.x Peakall R O D, Smouse P E. 2006. GENALEX 6: genetic analysis in Excel. Population genetic software for teaching and research. Molecular Ecology Notes, 6(1): 288–295, doi: 10.1111/j.1471-8286.2005.01155.x Piry S, Luikart G, Cornuet J M. 1999. Computer note. BOTTLENECK: a computer program for detecting recent reductions in the effective size using allele frequency data. Journal of Heredity, 90(4): 502–503, doi: 10.1093/jhered/90.4.502 Pritchard J K, Stephens M, Donnelly P. 2000. Inference of population structure using multilocus genotype data. Genetics, 155(2): 945–959, doi: 10.1093/genetics/155.2.945 Rosenberg N A. 2004. DISTRUCT: a program for the graphical display of population structure. Molecular Ecology Notes, 4(1): 137–138, doi: 10.1046/j.1471-8286.2003.00566.x Rousset F. 2008. genepop’007: a complete re-implementation of the genepop software for Windows and Linux. Molecular Ecology Resources, 8(1): 103–106, doi: 10.1111/j.1471-8286.2007.01931.x Semenova A V, Stroganov A N, Afanasiev K I, et al. 2015. Population structure and variability of Pacific herring (Clupea pallasii) in the White Sea, Barents and Kara Seas revealed by microsatellite DNA analyses. Polar Biology, 38(7): 951–965, doi: 10.1007/s00300-015-1653-8 Sheng Yan, Zheng Weihong, Pei Kequan, et al. 2002. Applications of microsatellites in population biology. Acta Plytoecologica Sinica (in Chinese), 26(S1): 119–126 Song Na, Yin Lina, Sun Dianrong, et al. 2019. Fine-scale population structure of Collichtys lucidus populations inferred from microsatellite markers. Journal of Applied Ichthyology, 35(3): 709–718, doi: 10.1111/jai.13902 Tamaki K, Honza E. 1991. Global tectionics and formation of marginal basins: role of the western Pacific. Episodes Journal of International Geoscience, 14(3): 224–230, doi: 10.18814/EPIIUGS/1991/V14I3/005 Vicente A A, Carolino M I, Sousa M C O, et al. 2008. Genetic diversity in native and commercial breeds of pigs in Portugal assessed by microsatellites. Journal of Animal Science, 86(10): 2496–2507, doi: 10.2527/jas.2007-0691 Wachowiak W, Balk P A, Savolainen O. 2009. Search for nucleotide diversity patterns of local adaptation in dehydrins and other cold-related candidate genes in Scots pine (Pinus sylvestris L.). Tree Genetics & Genomes, 5(1): 117–132, doi: 10.1007/s11295-008-0188-3 Wang Wei, Ma Chunyan, Ouyang Longling, et al. 2021. Genetic diversity and population structure analysis of Lateolabrax maculatus from Chinese coastal waters using polymorphic microsatellite markers. Scientific Reports, 11(1): 15260, doi: 10.1038/s41598-021-93000-6 Wright S. 2010. Variability Within and Among Natural Populations. Illinois: University of Chicago Press (查阅网上资料, 未找到出版地信息, 请确认) Xu Shengyong. 2014. Morphology and genetics of Setipinna tenuifilis (in Chinese)[dissertation]. Qingdao: Ocean University of China Xu Shengyong, Song Na, Lu Zhichuang, et al. 2014. Genetic variation in scaly hair-fin anchovy Setipinna tenuifilis (Engraulididae) based on the mitochondrial DNA control region. Mitochondrial DNA, 25(3): 223–230, doi: 10.3109/19401736.2013.845754 Yang Qiaoli, Gao Tianxiang, Liu Jinxian. 2014. Development and characterization of 17 microsatellite loci in an anadromous fish Coilia nasus. Conservation Genetics Resources, 6(2): 357–359, doi: 10.1007/s12686-013-0093-4 Zhang Bo. 2013. Molecular marker development and genetic diversity analysis of Setipinna tenuifilis (in Chinese) [dissertation]. Zhoushan: Zhejiang Ocean University Zhao Shenglong, Xu Hanxiang, Zhong Junsheng, et al. 2016. Zhejiang Marine Fish Records (in Chinese). Hangzhou: Zhejiang Science and Technology Press Zuccaro A, Bordonaro S, Criscione A, et al. 2008. Genetic diversity and admixture analysis of Sanfratellano and three other Italian horse breeds assessed by microsatellite markers. Animal, 2(7): 991–998, doi: 10.1017/S1751731108002255 -


 点击查看大图
计量
- 文章访问数: 33
- HTML全文浏览量: 13
- 被引次数: 0

