

-
Abstract: Melt ponds are significant physical features on the ice surface throughout the Arctic summer, and the scarcity of observational data has resulted in a vague understanding about it. This study employs satellite data and multi-model averaged outputs from CMIP6 to analyze the spatiotemporal evolution characteristics of Arctic melt ponds and their relationship with sea ice thickness (SIT) and atmospheric energy flux. The ponds first emerge at lower latitudes and gradually extend to cover central ice areas as the season progresses, then persisting longer and covering larger total areas in the central region, with peak areas exceeding 0.6 million km2, which is 4 to 5 times that of other marginal areas. Over the past two decades, pond coverage has exhibited markedly different trends with slight decreases in the marginal seas but significant increases in the central area. Both CMIP6 and satellite data indicate that the sea ice carrying capacity, related to thickness, plays a crucial role in creating these differences. There is a marked increasing pond in areas with thicker ice. When the SIT falls below a certain threshold, however, sea ice melting results in decreased pond coverage. Additionally, the energy balance on the ice surface also dramatically impacts pond changes. For instance, the overall pond changes in central area are influenced by net longwave radiation (NLR) and latent heat (LH), with anomalies in these fluxes correlating highly (up to 0.8) with pond anomalies. Meanwhile, net shortwave radiation (NSR) primarily causes local pond anomalies through the pond-shortwave feedback only under the clear weather conditions.
-
Key words:
- Ice-atmosphere interaction /
- Melt ponds /
- Sea ice thickness /
- Energy flux
-

Figure 1. The evolution of melt ponds in the Arctic region from 2002 to 2022. (a) The RMPF and MPA change with SIT, the gray shaded is the standard deviation of RMPF. The dashed line and spatial map show the RMPF evolution in 2007. (b) the variation of RMPF and MPA with latitude.
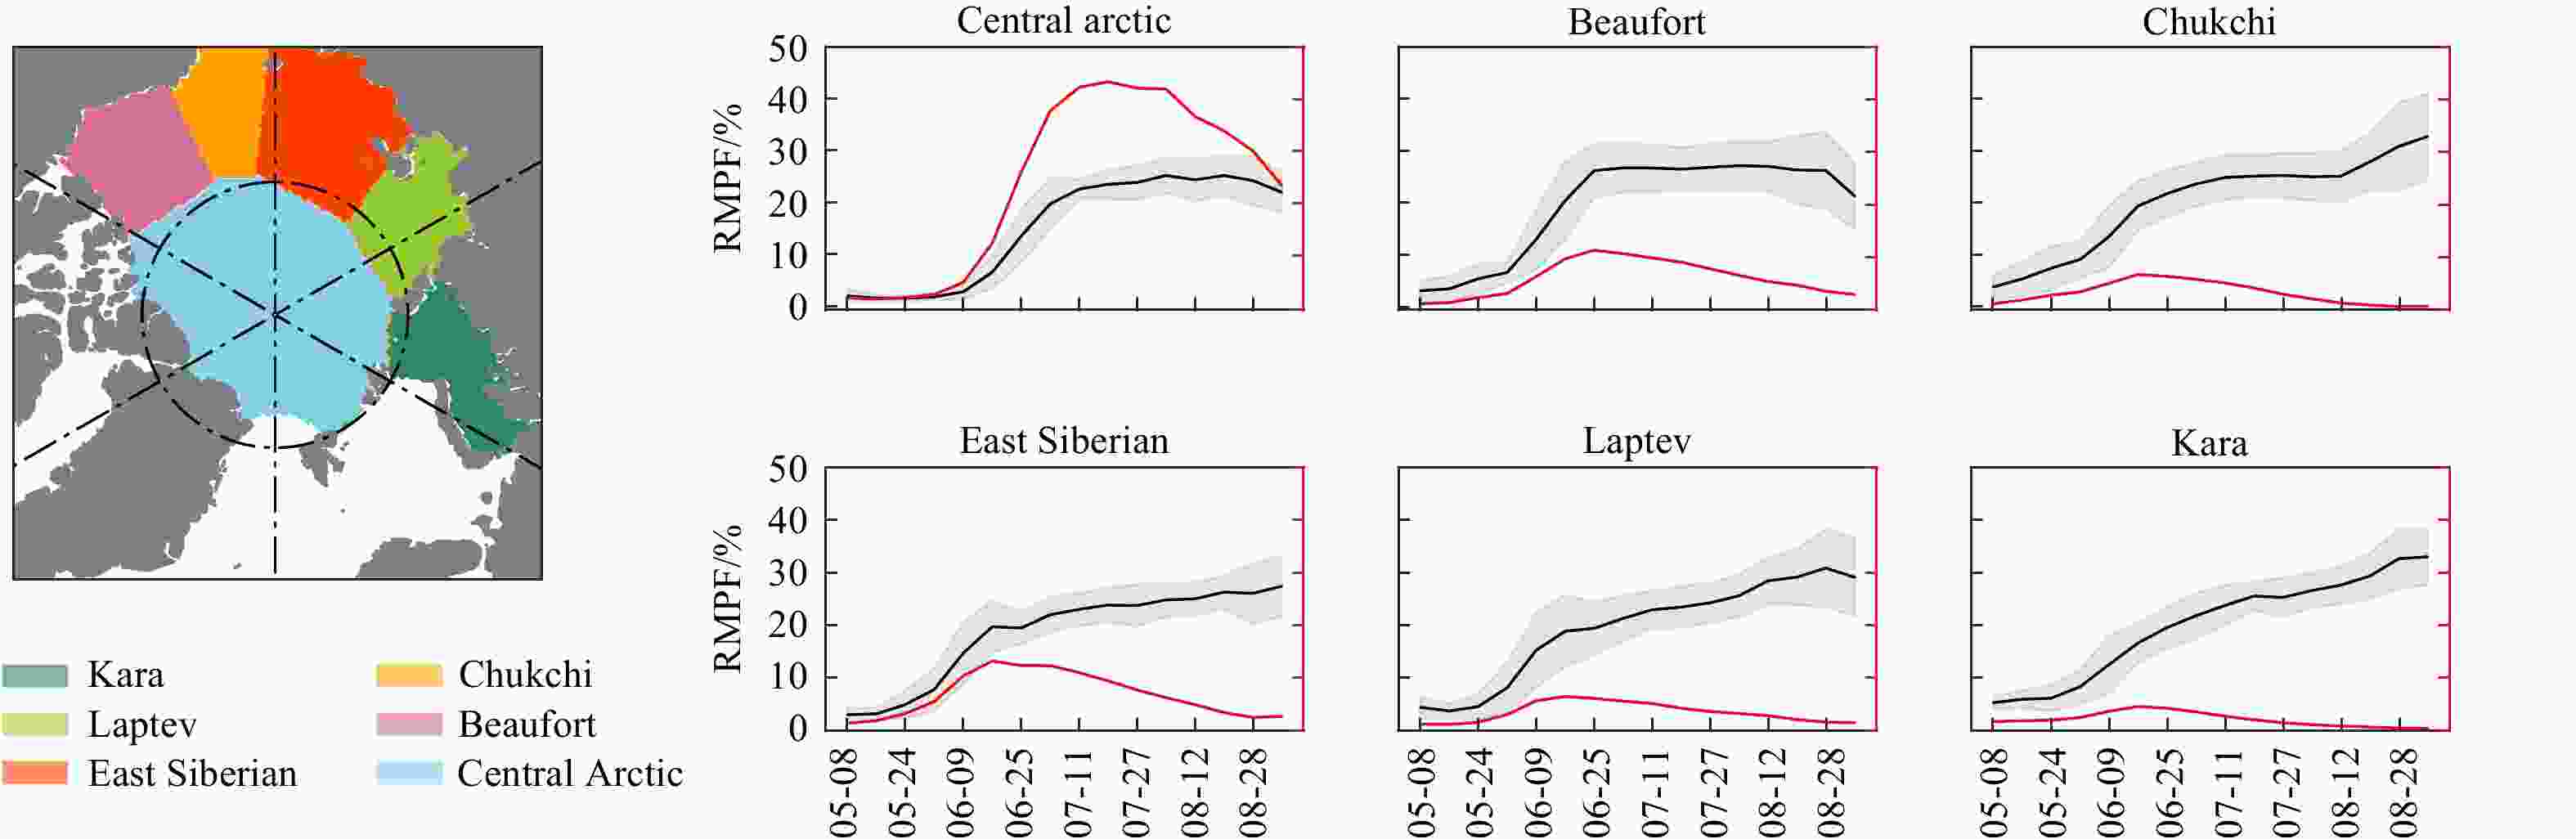
Figure 2. The variation of melt ponds in various Arctic seas from 2002 to 2022.The black and red solid line represents RMPF and total MPA respectively, the gray shaded is the standard deviation of RMPF.

Figure 3. Inter-annual variation of melt ponds in the Arctic from 2002 to 2022. (a) the black and red solid line represents RMPF and total MPA respectively. The red dashed line indicates the linear trend, which passes the 95% significance test. The blue bar is SIT. (b) the inter-annual variation of RMPF and MPA with latitude, * indicates passing the 95% significance test.
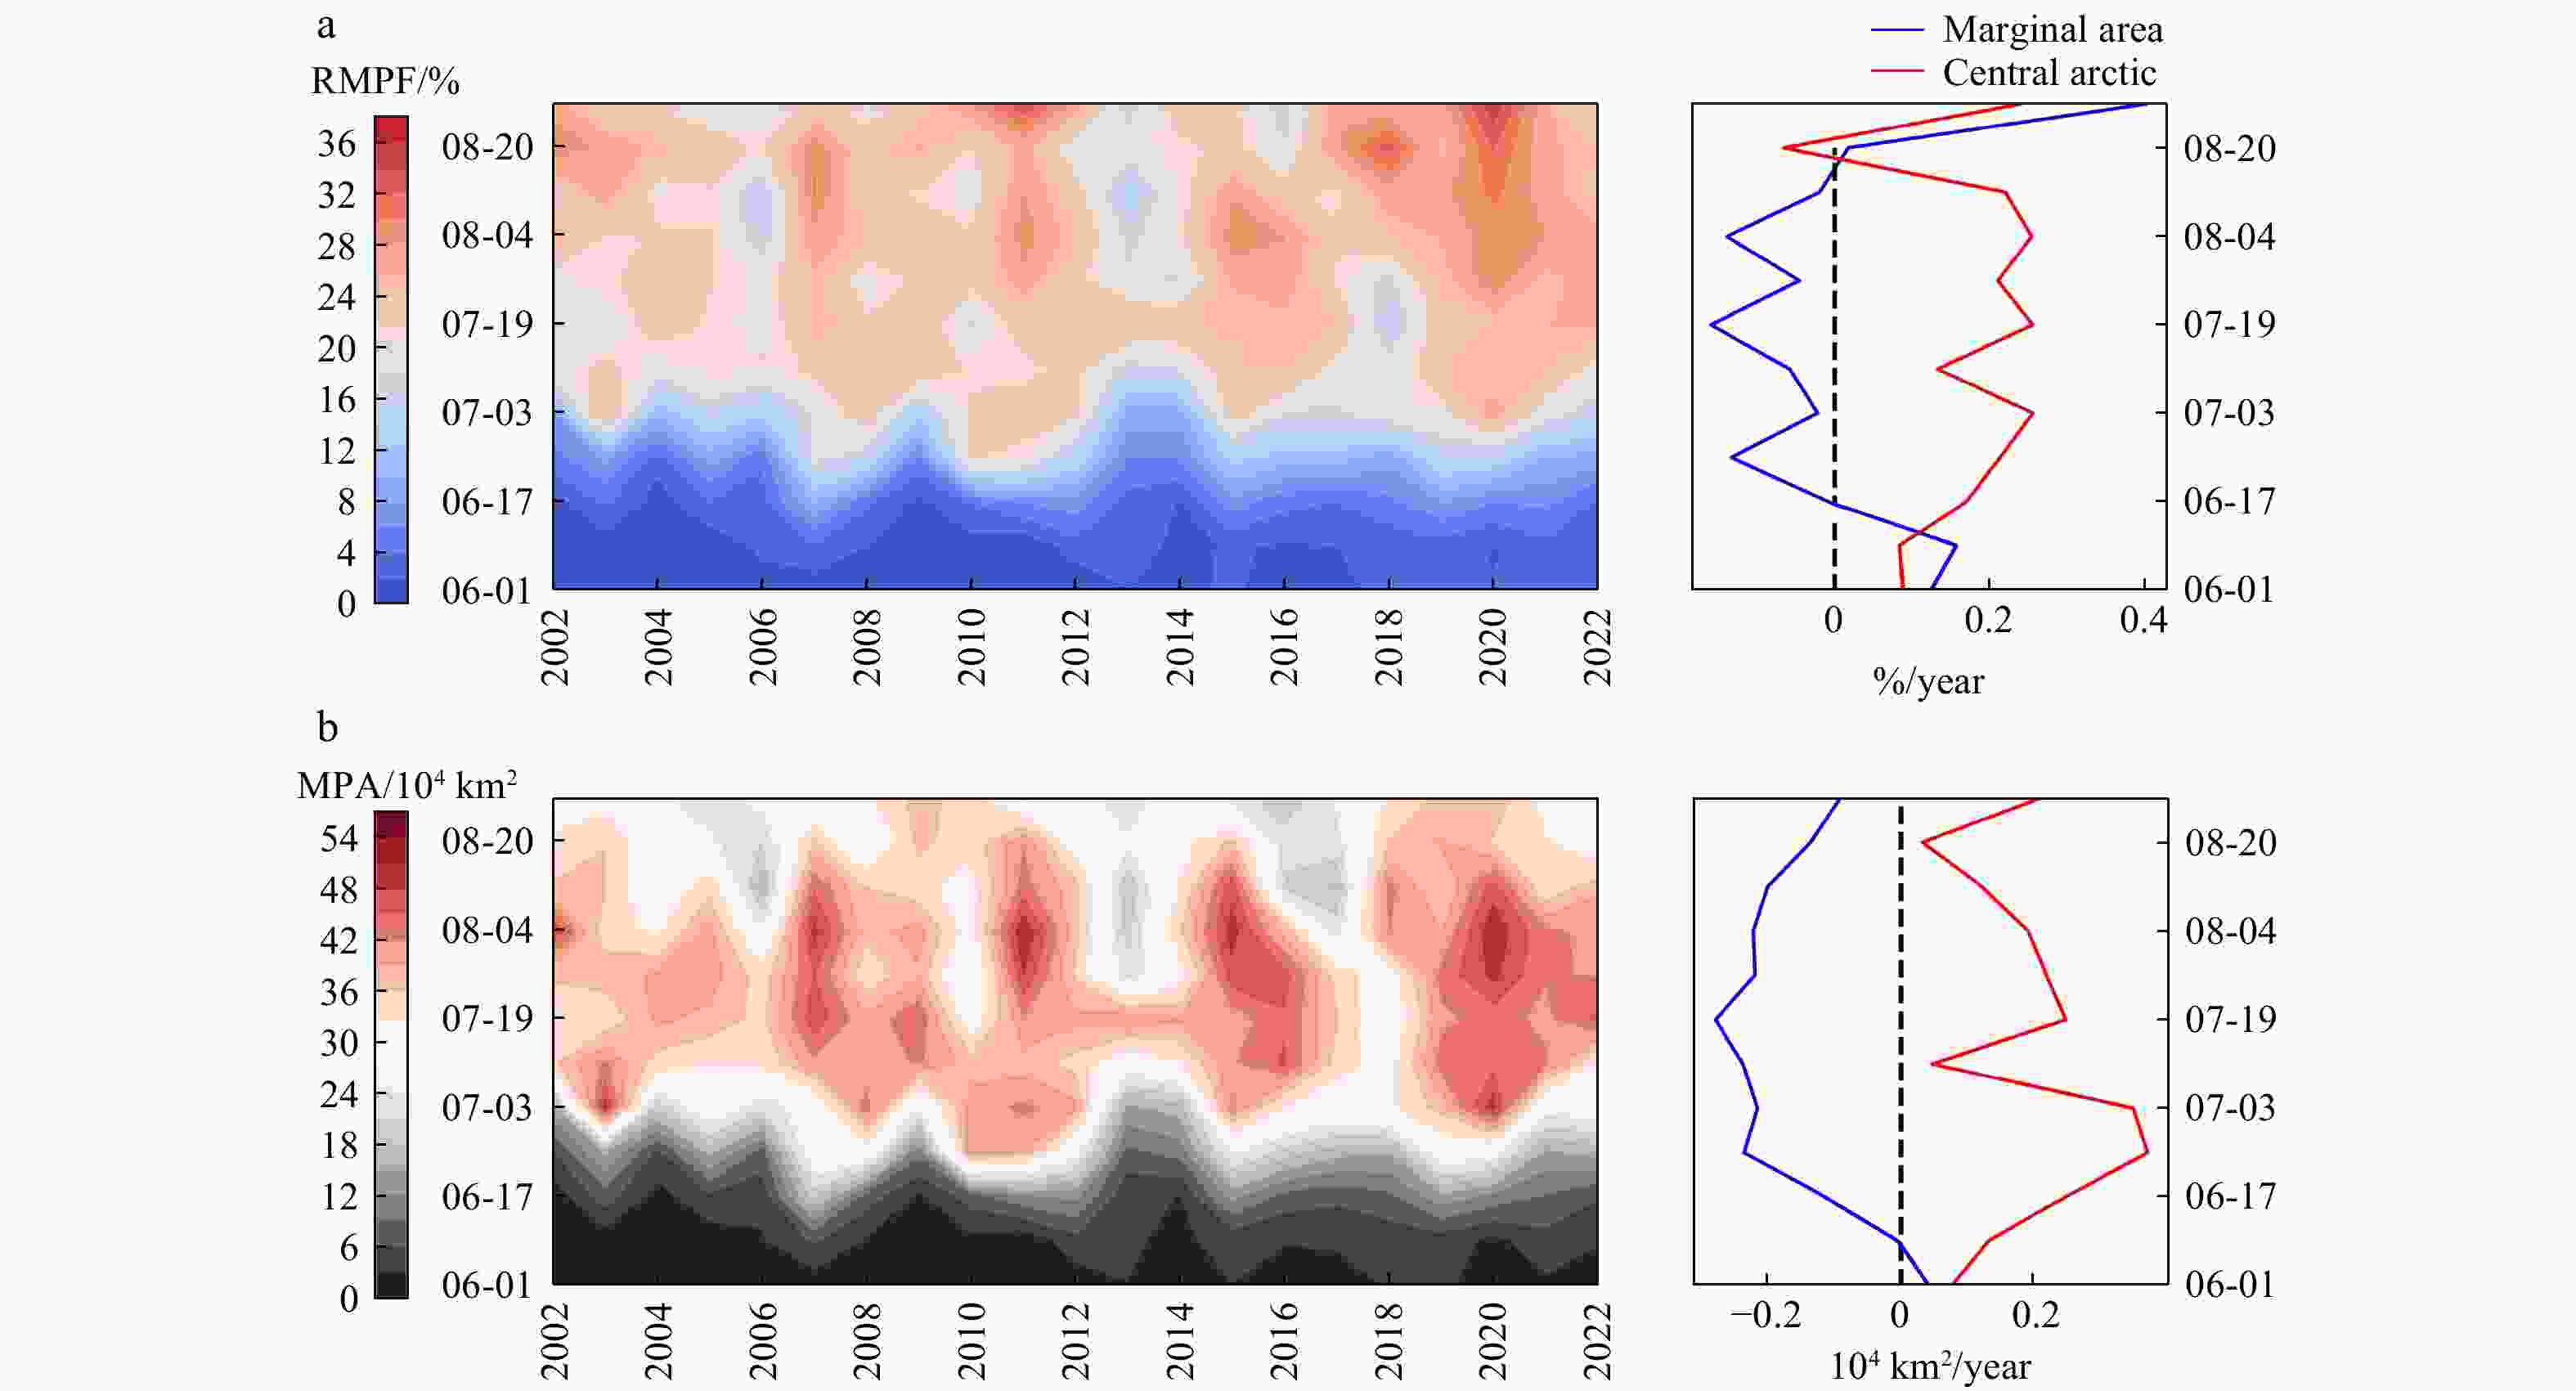
Figure 4. Distribution of summer ponds in the central Arctic from 2002 to 2022. (a) and (b) represent the distribution of RMPF and total MPA, respectively. The small graph on the right shows the trend of pond in the central arctic and marginal seas

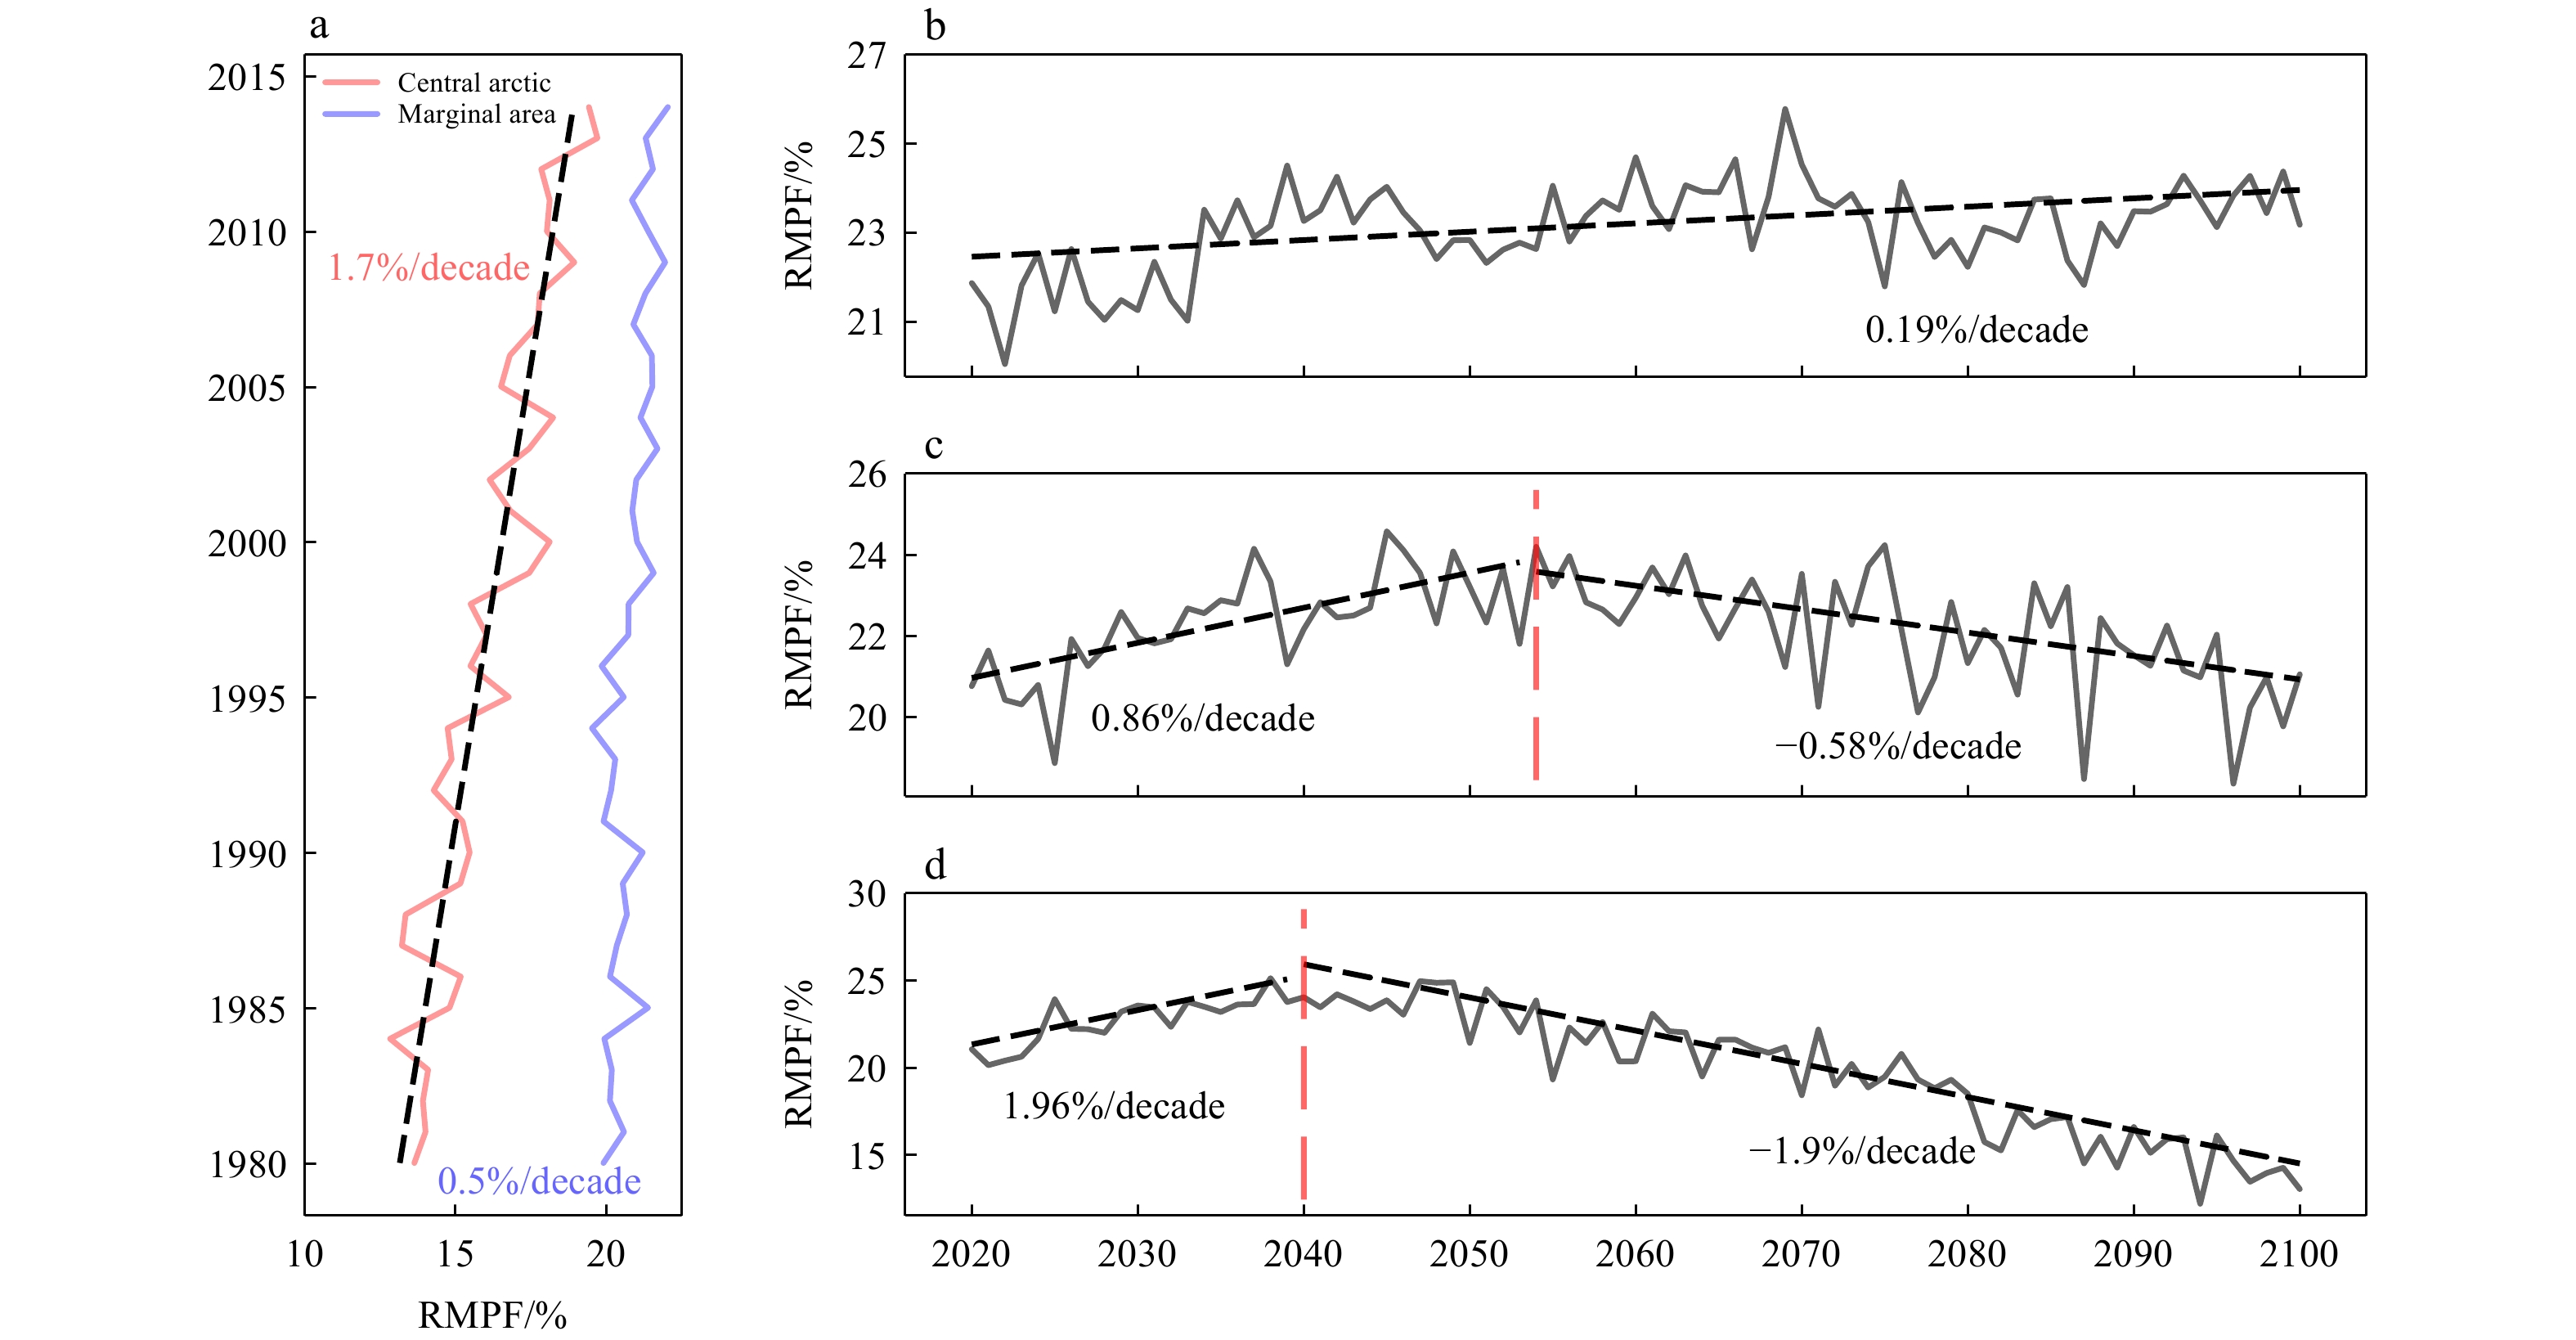
Figure 5. Average RMPF in the central Arctic under different CMIP6 emission scenarios (a) the SSP1-2.6 scenario, with the black solid line representing the change in RMPF and the black dashed line representing the linear trend that passes the 95% significance test. (b) and (c) are similar to (a) but correspond to the SSP2-4.5 and SSP5-8.5 scenarios, respectively.
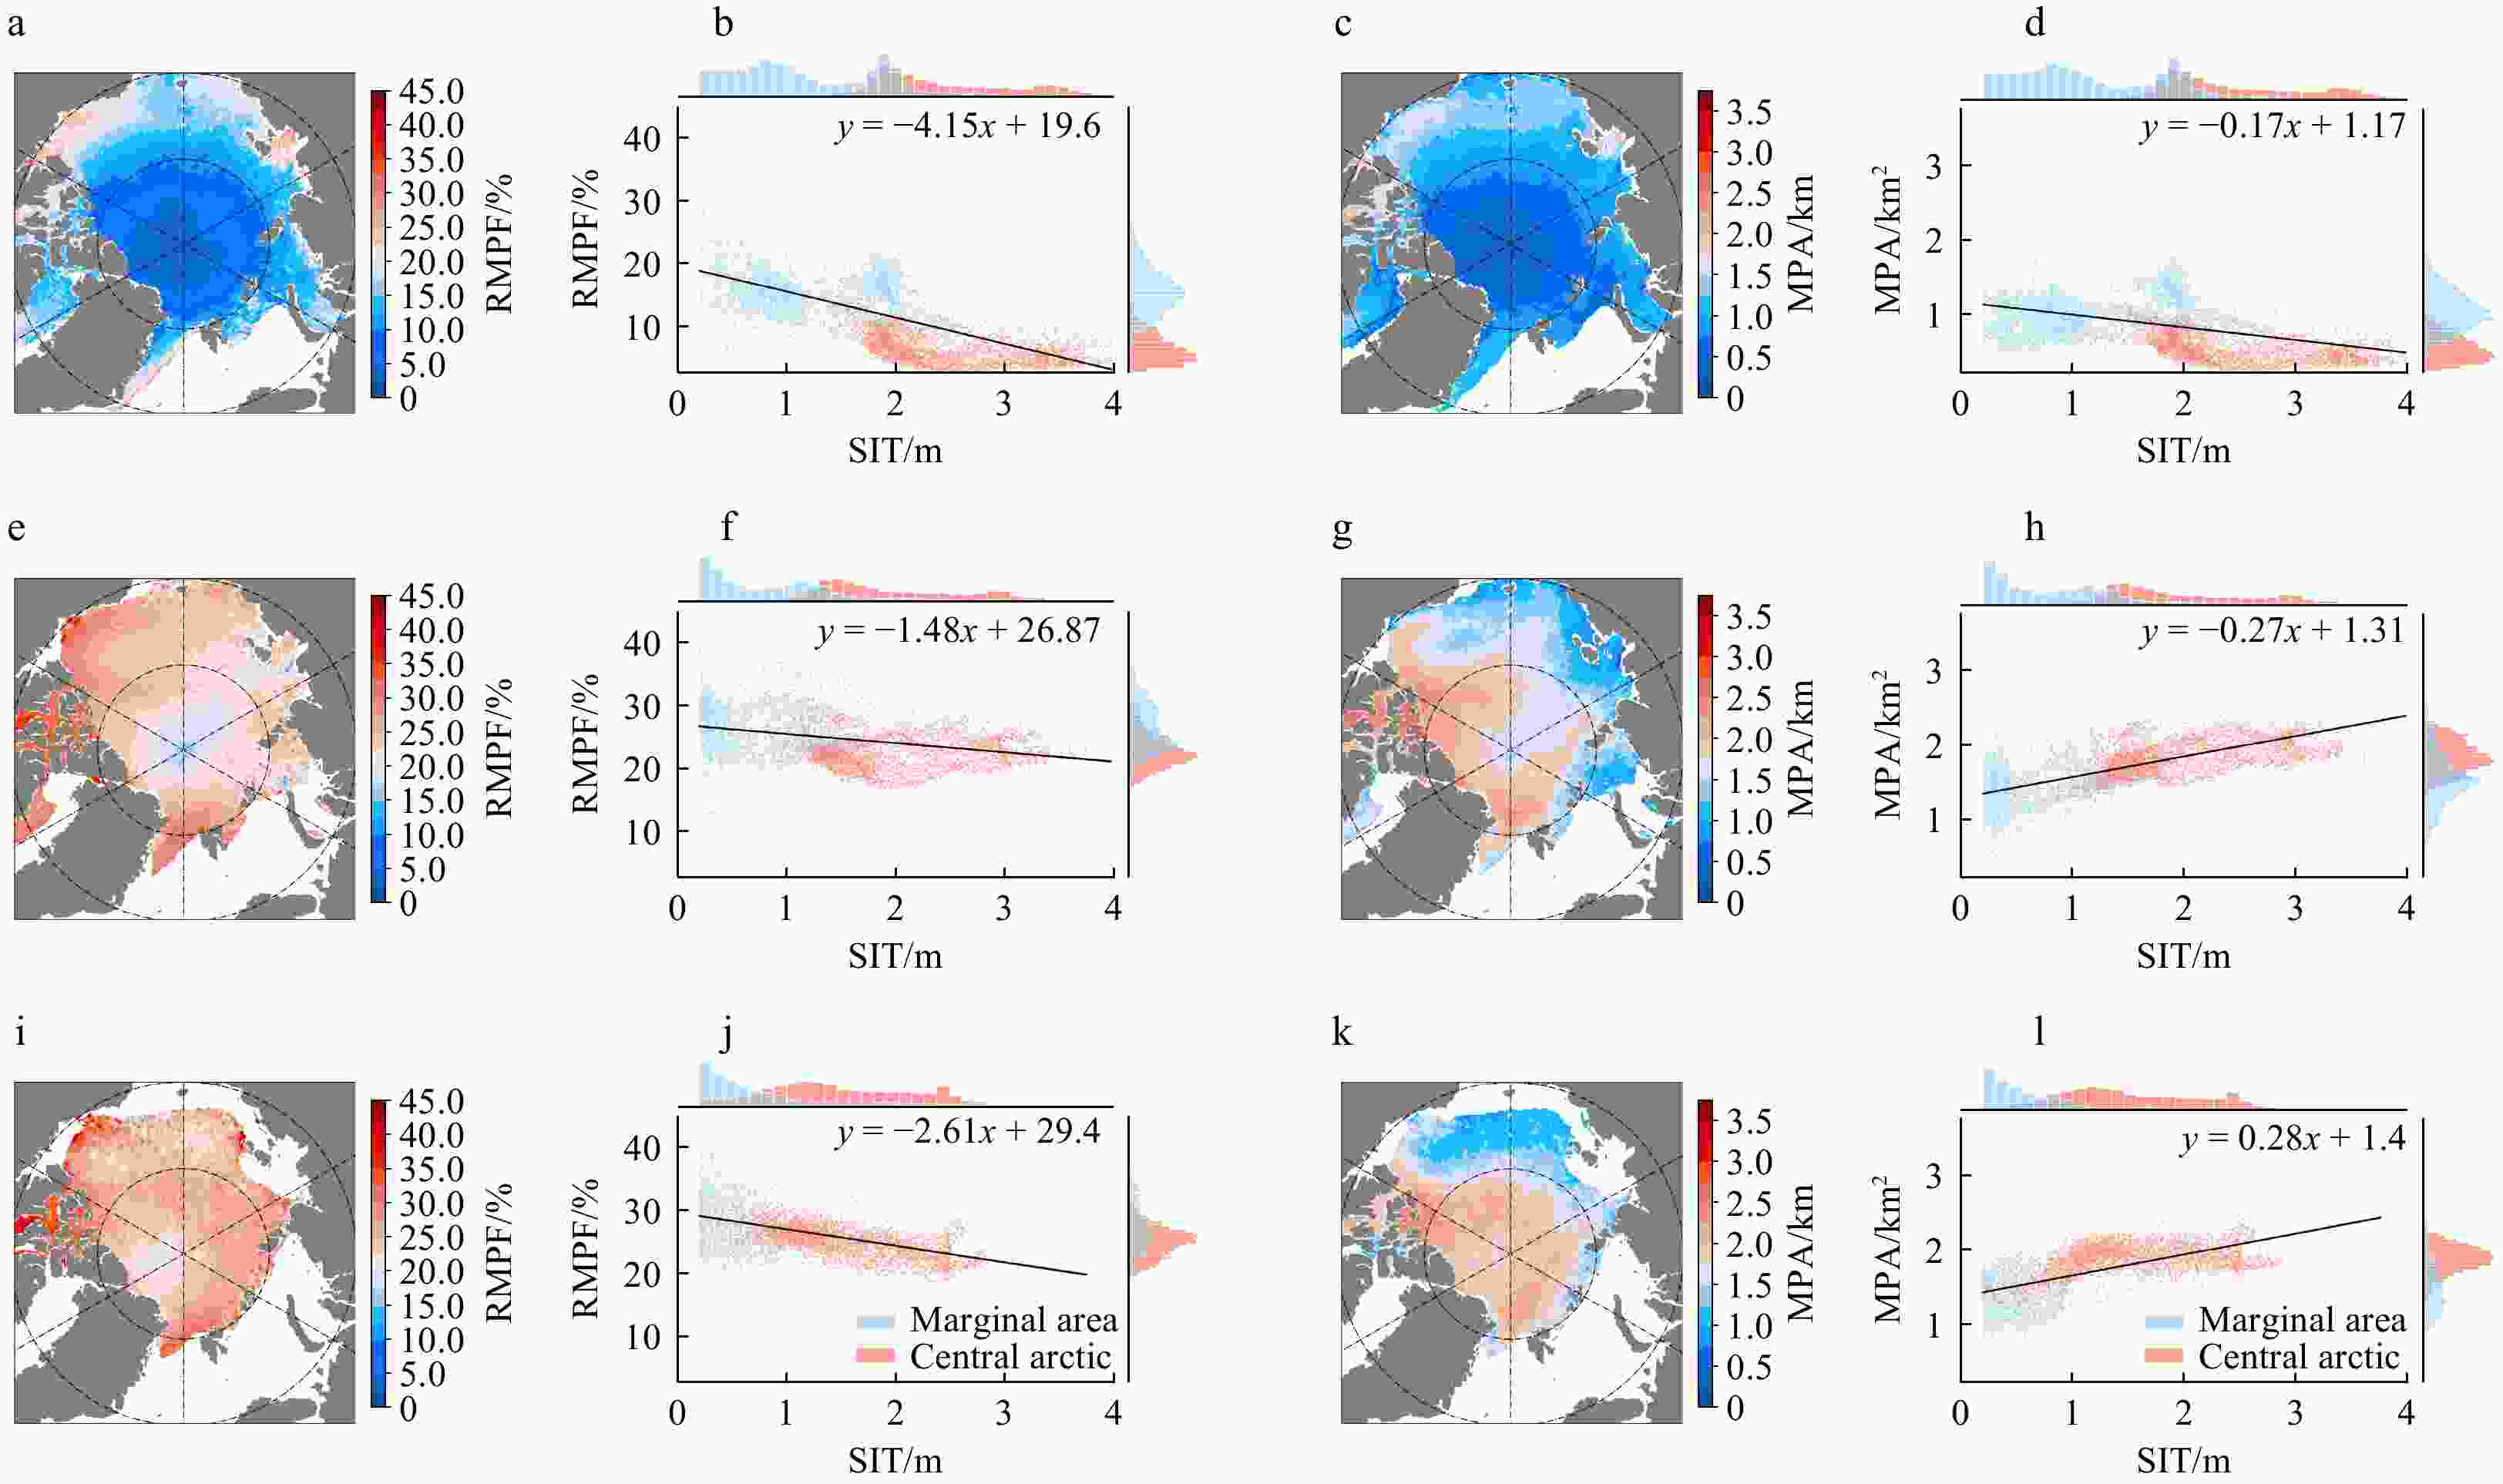
Figure 6. Distribution of summer RMPF and MPA and their relationship with SIT. (a)(b) represent the average RMPF distribution and their relationship with SIT for June, the marginal bar showing the density distribution of SIT and RMPF in different areas. (c)(d) follow the same format but for MPA. e, f, g, h; i, j, k, l is similar to a, b, c, d but for July and Aug respectively.

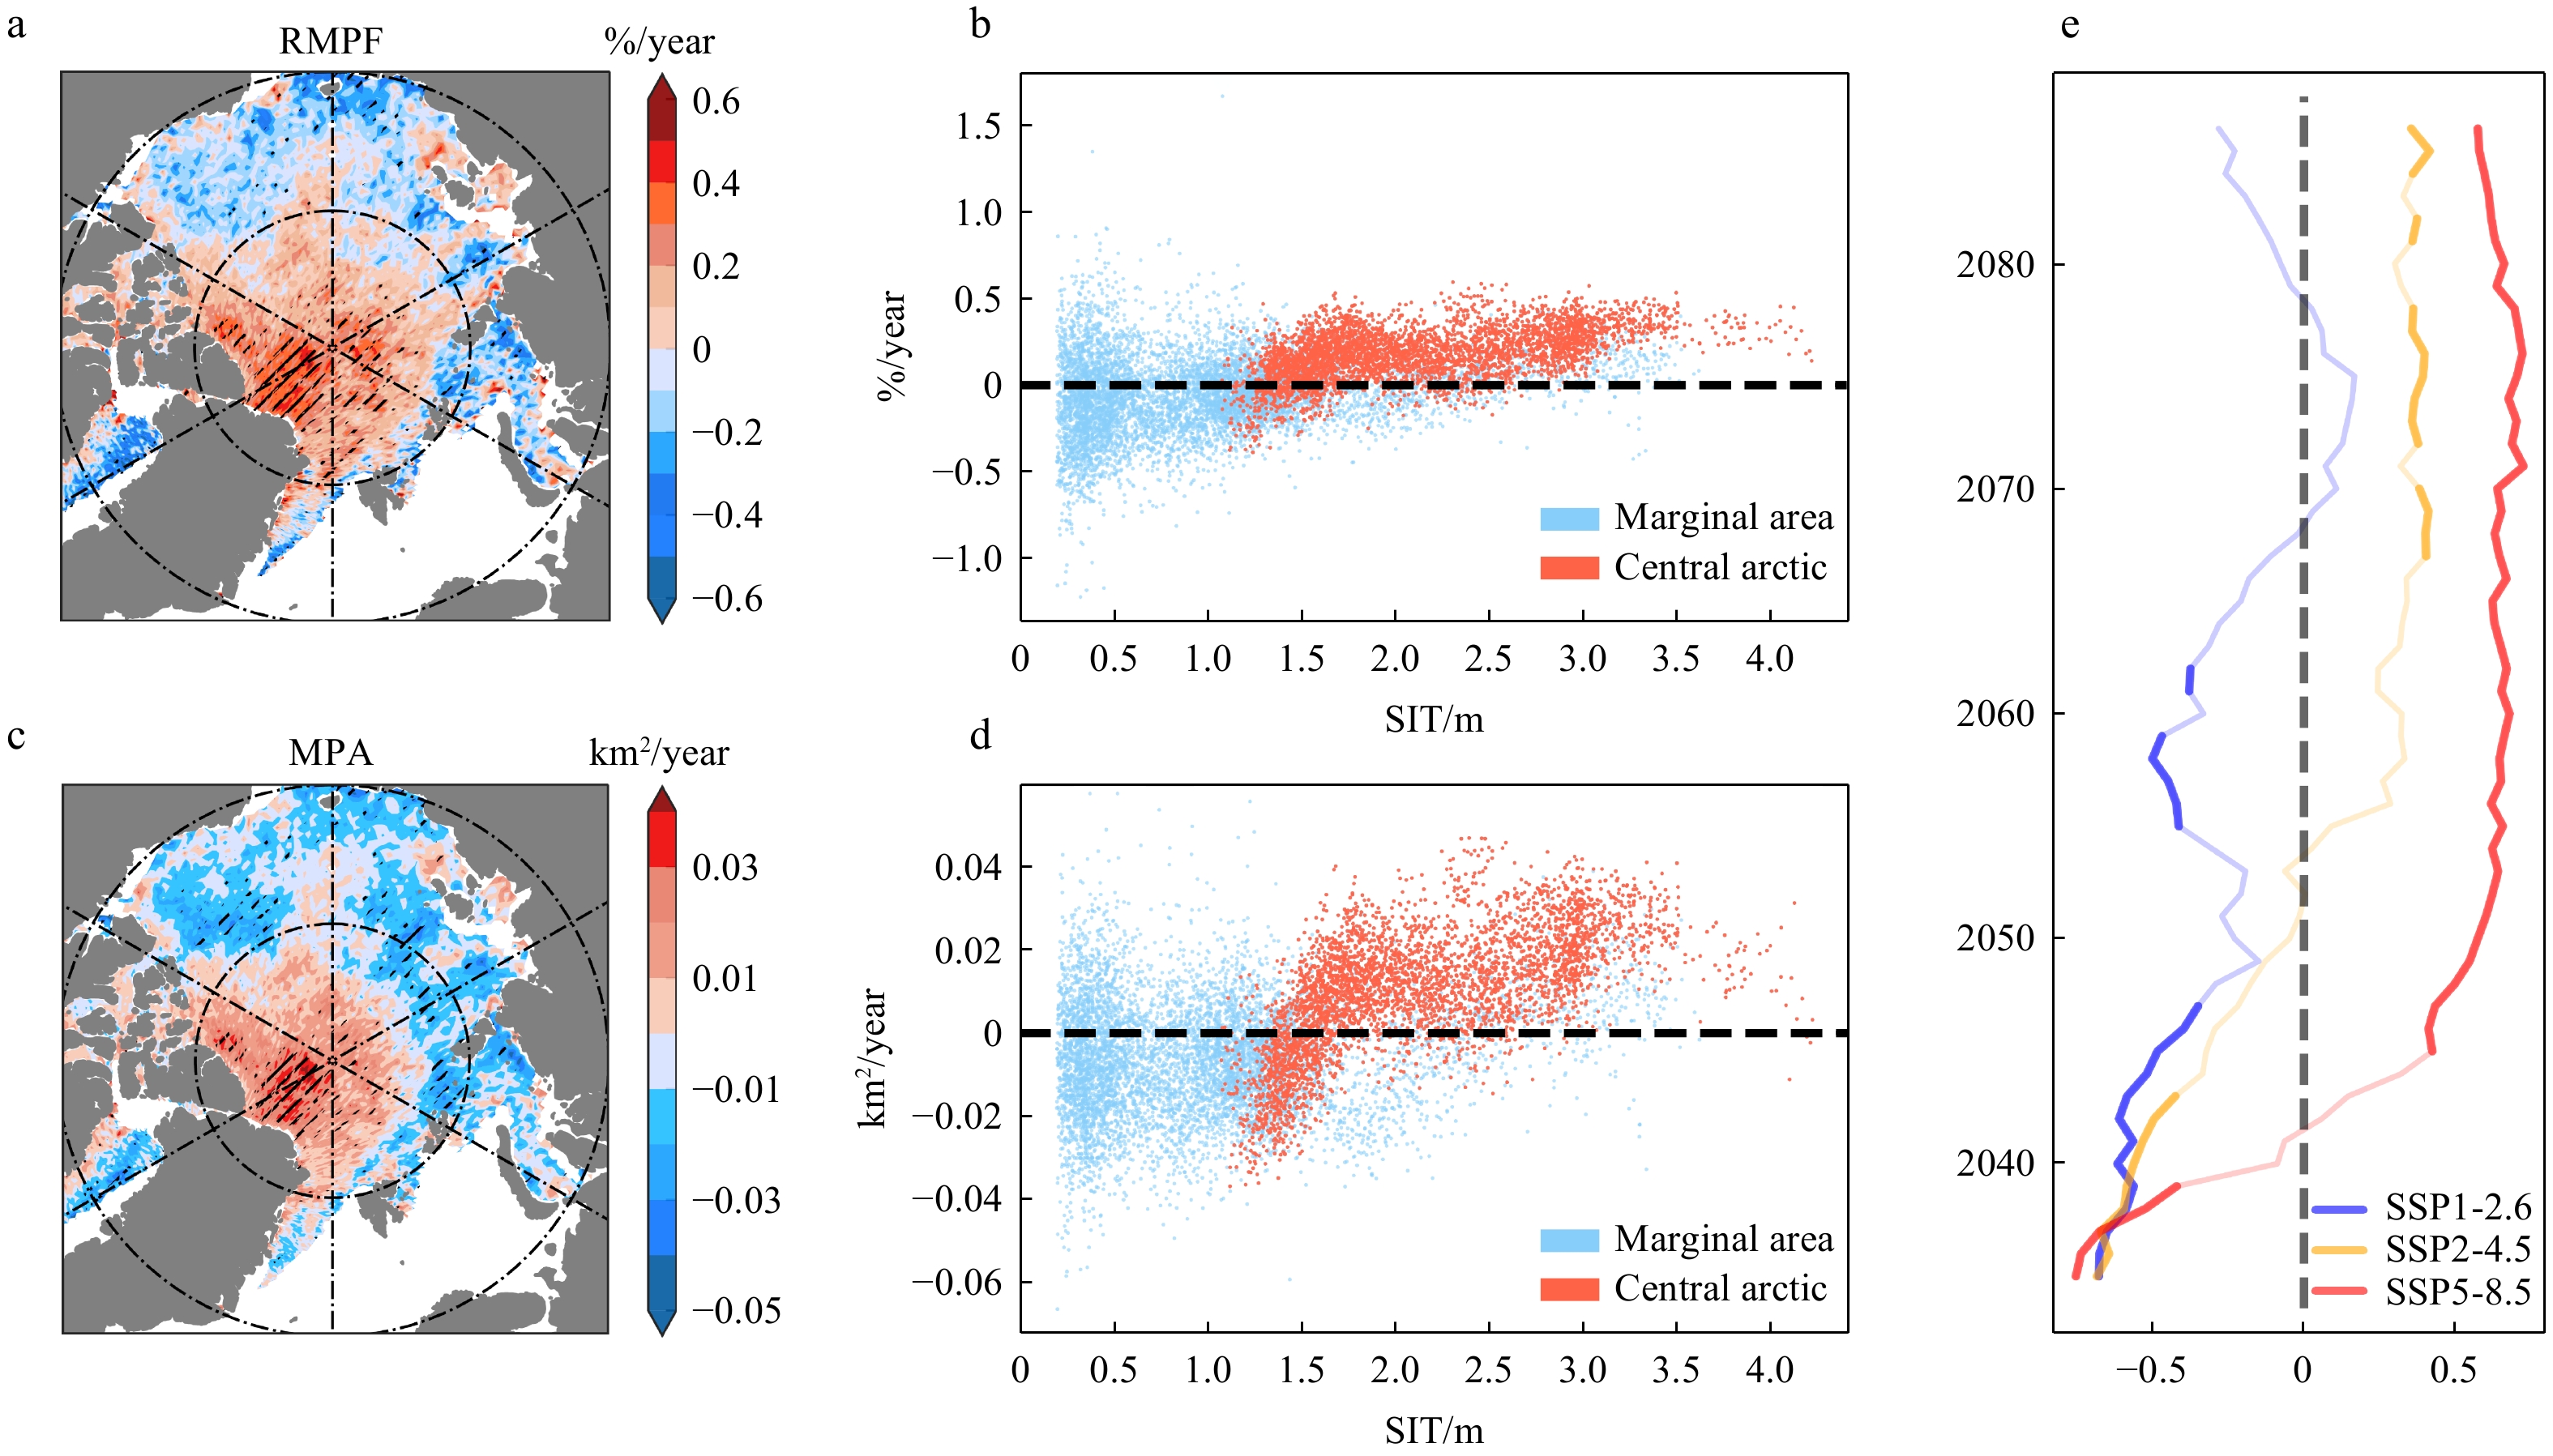
Figure 7. Spatial distribution of summer pond trends and their relationship with sea ice thickness including the period spanning 2002-2022. (a) The spatial distribution of the RMPF trends. (b) The relationship between RMPF and SIT. The red and blue dots represent central arctic and marginal area, respectively. (c) and (d) are similar to (a) and (b) but for MPA. (e)The 30-year moving-correlation between RMPF and SIT in the central region under different future emission scenarios, with the bold solid line indicating parts that pass the 95% significance test.

Figure 8. The connection between summer ponds and energy flux anomalies in the central Arctic from 2002 to 2022 (a) the inter-annual anomalies of RMPF, LH, NLR and NSR. The grey dashed line represents the standard deviation of RMPF. (b) The composite distribution of RMPF, NLR, LH, NSR anomalies.
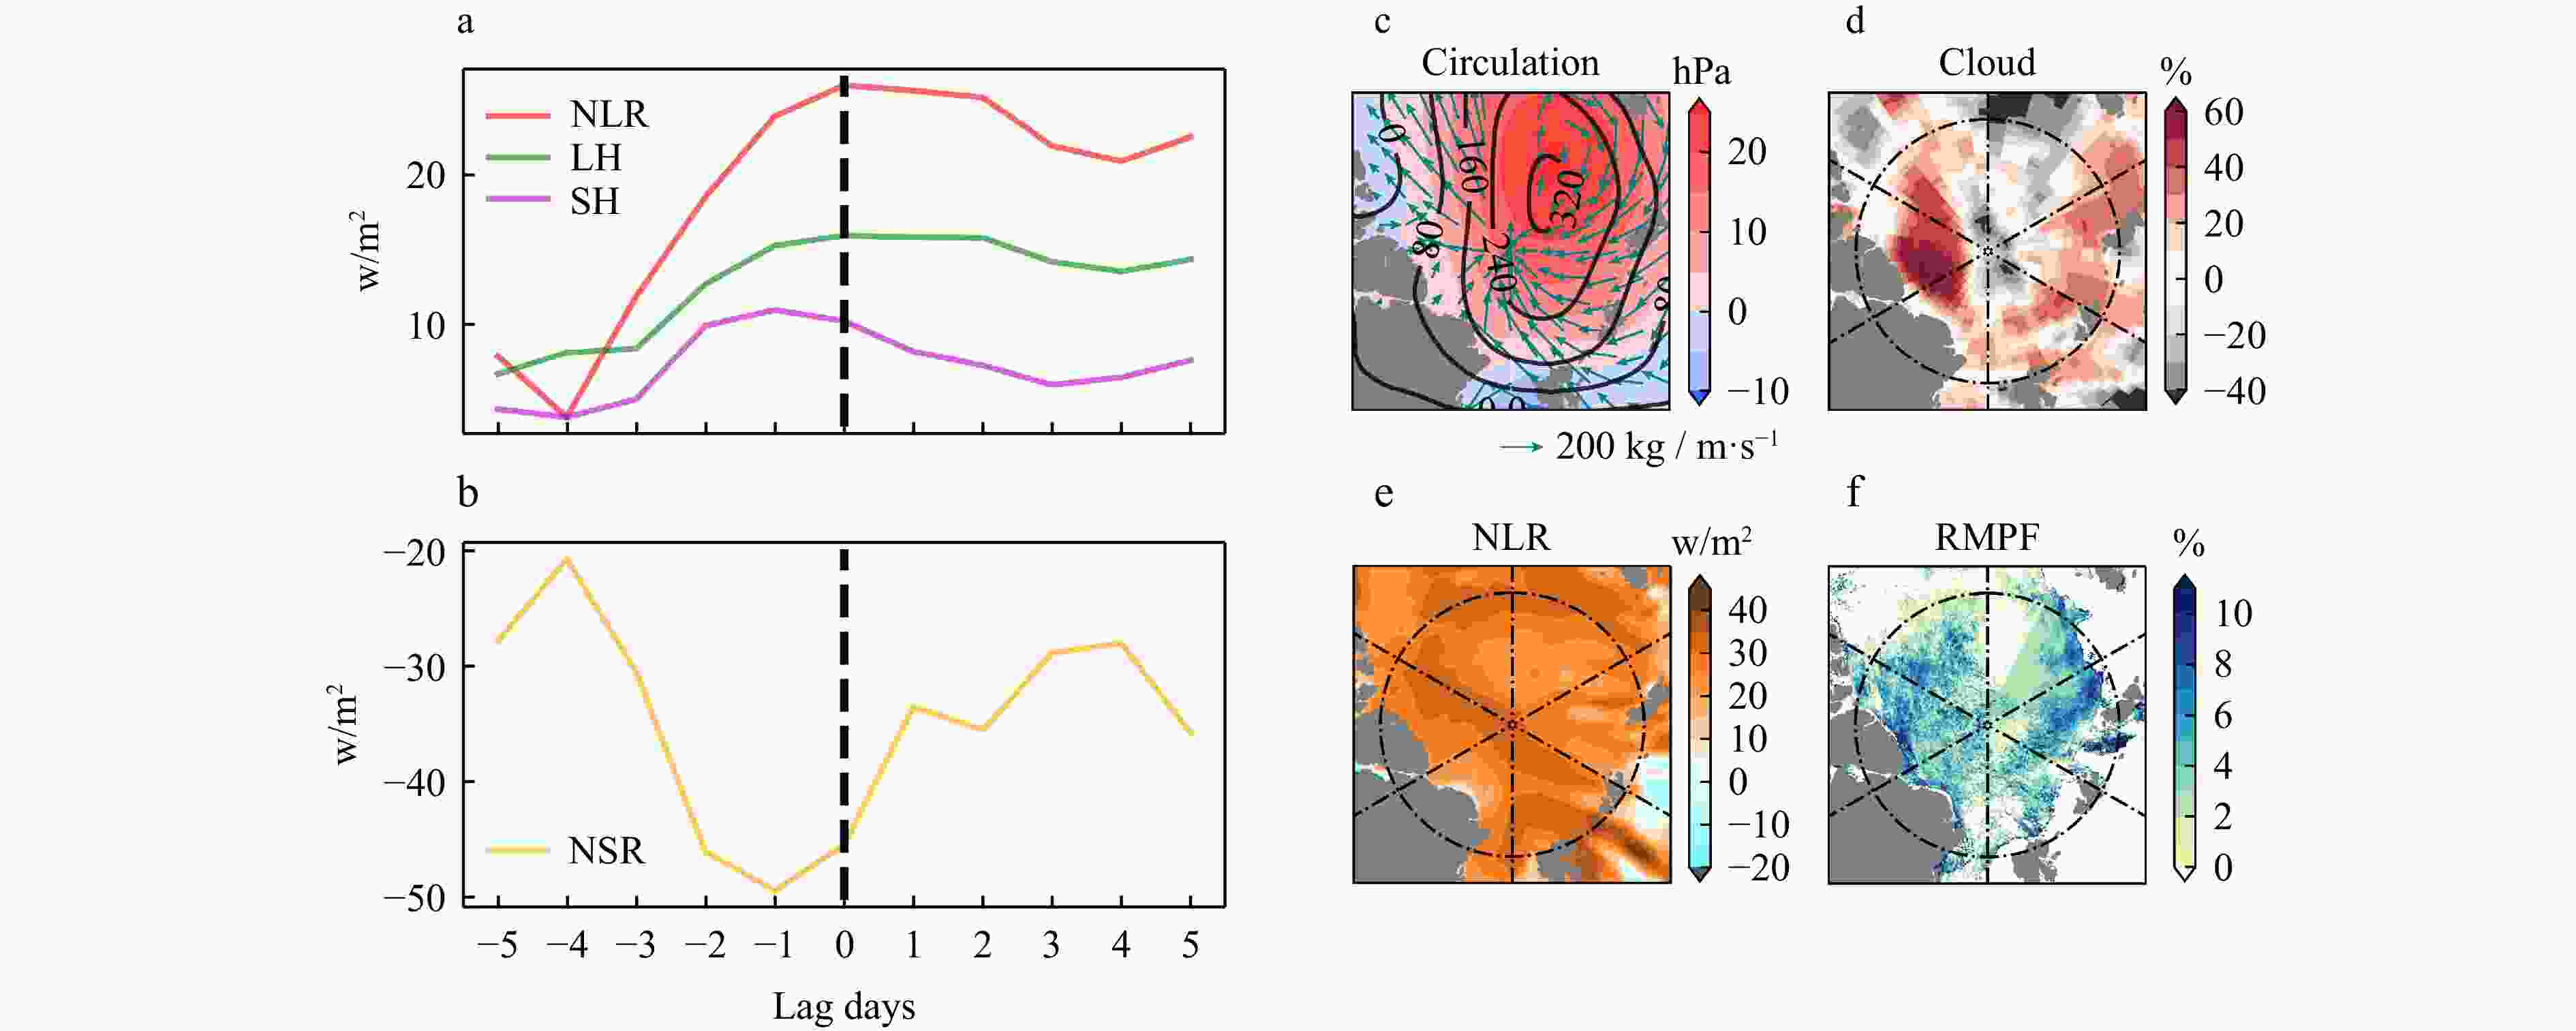
Figure 9. Changes in atmospheric variable anomalies during the positive melt pond event on July 11, 2020. (a)(b) The energy flux anomaly of the lag days. (c) The shade and black line indicates the SLP anomaly and 500hPa geopotential height anomaly, respectively. The vector indicates that the integrated moisture transport. (d−f) The low cloud cover anomaly, the NLR anomaly and RMPF anomaly respectively.
Table 1. The models that output melt ponds in CMIP6
Num Model Country Group Grid 1 HadGEM3-GC31-LL UK Hadley Center 330×360 2 GISS-E2-1-G US NASA 90×144 3 GISS-E2-1-H US NASA 90×144 4 GISS-E2-2-G US NASA 90×144 5 ACCESS-CM2 Australian CSIRO 300×360 6 UKESM1-0-L UK NCAS & Hadley Center 330×360 7 NorESM2-MM Norway NCC 384×360 8 NorESM2-LM Norway NCC 384×360  下载: 导出CSV
Table 2. Correlation between melt ponds and various influencing factors anomalies in the central Arctic from 2002 to 2022. Bold and * indicate passing the 95% significance test.
SIT NLR NSR LH SH RMPF −0.16 0.81* −0.66* 0.83* 0.55* MPA 0.21 0.58* −0.42 0.69* 0.33
下载: 导出CSV
-
Arrigo K R, Perovich D K, Pickart R S, et al. 2012. Massive phytoplankton blooms under arctic sea ice. Science, 336(6087): 1408, doi: 10.1126/science.1215065 Brandt R E, Warren S G, Worby A P, et al. 2005. Surface albedo of the Antarctic sea ice zone. Journal of Climate, 18(17): 3606–3622, doi: 10.1175/JCLI3489.1 Ding Yifan, Cheng Xiao, Liu Jiping, et al. 2020. Retrieval of melt pond fraction over arctic sea ice during 2000-2019 using an ensemble-based deep neural network. Remote Sensing, 12(17): 2746, doi: 10.3390/rs12172746 Ding Qinghua, Schweiger A, L’Heureux M, et al. 2017. Influence of high-latitude atmospheric circulation changes on summertime Arctic sea ice. Nature Climate Change, 7(4): 289–295, doi: 10.1038/nclimate3241 Eicken H, Grenfell T C, Perovich D K, et al. 2004. Hydraulic controls of summer Arctic pack ice albedo. Journal of Geophysical Research: Oceans, 109(C8): C08007, doi: 10.1029/2003JC001989 Eyring V, Bony S, Meehl G A, et al. 2016. Overview of the Coupled Model Intercomparison Project Phase 6 (CMIP6) experimental design and organization. Geoscientific Model Development, 9(5): 1937–1958, doi: 10.5194/gmd-9-1937-2016 Fearon M G, Doyle J D, Ryglicki D R, et al. 2021. The role of cyclones in moisture transport into the Arctic. Geophysical Research Letters, 48(4): e2020GL090353, doi: 10.1029/2020GL090353 Feng Jiajun, Zhang Yuanzhi, Cheng Qiuming, et al. 2022. Pan-Arctic melt pond fraction trend, variability, and contribution to sea ice changes. Global and Planetary Change, 217: 103932, doi: 10.1016/j.gloplacha.2022.103932 Flocco D, Feltham D L. 2007. A continuum model of melt pond evolution on Arctic sea ice. Journal of Geophysical Research: Oceans, 112(C8): C08016, doi: 10.1029/2006JC003836 Flocco D, Feltham D L, Bailey E, et al. 2015. The refreezing of melt ponds on Arctic sea ice. Journal of Geophysical Research: Oceans, 120(2): 647–659, doi: 10.1002/2014JC010140 Flocco D, Schroeder D, Feltham D L, et al. 2012. Impact of melt ponds on Arctic sea ice simulations from 1990 to 2007. Journal of Geophysical Research: Oceans, 117(C9): C09032, doi: 10.1029/2012JC008195 Halfar J, Adey W H, Kronz A, et al. 2013. Arctic sea-ice decline archived by multicentury annual-resolution record from crustose coralline algal proxy. Proceedings of the National Academy of Sciences of the United States of America, 110(49): 19737–19741 Henderson G R, Barrett B S, Wachowicz L J, et al. 2021. Local and remote atmospheric circulation drivers of arctic change: a review. Frontiers in Earth Science, 9: 709896, doi: 10.3389/feart.2021.709896 Hersbach H, Bell B, Berrisford P, et al. The ERA5 global reanalysis. Q J R Meteorol Soc. 2020; 146: 1999–2049. https://doi.org/10.1002/qj.3803 Kapsch M L, Graversen R G, Tjernström M. 2013. Springtime atmospheric energy transport and the control of Arctic summer sea-ice extent. Nature Climate Change, 3(8): 744–748, doi: 10.1038/nclimate1884 Kinnard C, Zdanowicz C M, Fisher D A, et al. 2011. Reconstructed changes in Arctic sea ice over the past 1, 450 years. Nature, 479(7374): 509–512, doi: 10.1038/nature10581 Kwok R. 2011. Observational assessment of Arctic Ocean sea ice motion, export, and thickness in CMIP3 climate simulations. Journal of Geophysical Research: Oceans, 116(C8): C00D05, doi: 10.1029/2011JC007004 Kwok R, Cunningham G F, Wensnahan M, et al. 2009. Thinning and volume loss of the Arctic Ocean sea ice cover: 2003-2008. Journal of Geophysical Research: Ocenas, 114(C7): C07005, doi: 10.1029/2009JC005312 Kwok R, Rothrock D A. 2009. Decline in Arctic sea ice thickness from submarine and ICESat records: 1958-2008. Geophysical Research Letters, 36(15): L15501, doi: 10.1029/2009GL039035 Kato S, Fred G Rose, David A Rutan, et al. 2018. Surface Irradiances of Edition 4.0 Clouds and the Earth’s Radiant Energy System (CERES) Energy Balanced and Filled (EBAF) Data Product. Journal Of Climate, 31: 4501–4527, doi: 10.1175/JCLI-D-17-0523.1 Li Qing, Zhou Chunxia, Zheng Lei, et al. 2020. Monitoring evolution of melt ponds on first-year and multiyear sea ice in the Canadian Arctic Archipelago with optical satellite data. Annals of Glaciology, 61(82): 154–163, doi: 10.1017/aog.2020.24 Liu Jiping, Song Mirong, Horton R M, et al. 2015. Revisiting the potential of melt pond fraction as a predictor for the seasonal Arctic sea ice extent minimum. Environmental Research Letters, 10(5): 054017, doi: 10.1088/1748-9326/10/5/054017 Meier W N, Hovelsrud G K, van Oort B E H, et al. 2014. Arctic sea ice in transformation: a review of recent observed changes and impacts on biology and human activity. Reviews of Geophysics, 52(3): 185–217, doi: 10.1002/2013RG000431 Perovich D K, Tucker III W B. 1997. Arctic sea-ice conditions and the distribution of solar radiation during summer. Annals of Glaciology, 25: 445–450, doi: 10.3189/S0260305500014439 Polashenski C, Perovich D, Courville Z. 2012. The mechanisms of sea ice melt pond formation and evolution. Journal of Geophysical Research: Oceans, 117(C1): C01001, doi: 10.1029/2011JC007231 Qin Yuqing, Su Jie, Wang Mingfeng. 2021. Melt pond retrieval based on the LinearPolar algorithm using Landsat data. Remote Sensing, 13(22): 4674, doi: 10.3390/rs13224674 Roeckner E, Mauritsen T, Esch M, et al. 2012. Impact of melt ponds on Arctic sea ice in past and future climates as simulated by MPI-ESM. Journal of Advances in Modeling Earth Systems, 4(3): M00A02, doi: 10.1029/2012MS000157 Rösel A, Kaleschke L. 2012. Exceptional melt pond occurrence in the years 2007 and 2011 on the Arctic sea ice revealed from MODIS satellite data. Journal of Geophysical Research: Oceans, 117(C5): C05018, doi: 10.1029/2011JC007869 Schröder D, Feltham D L, Flocco D, et al. 2014. September Arctic sea-ice minimum predicted by spring melt-pond fraction. Nature Climate Change, 4(5): 353–357, doi: 10.1038/nclimate2203 Schweiger A, Lindsay R, Zhang Jinlun, et al. 2011. Uncertainty in modeled Arctic sea ice volume. Journal of Geophysical Research: Oceans, 116(C8): C00D06, doi: 10.1029/2011JC007084 Scott F, Feltham D L. 2010. A model of the three‐dimensional evolution of Arctic melt ponds on first‐year and multiyear sea ice. Journal of Geophysical Research: Oceans, 115(C12): C12064, doi: 10.1029/2010JC006156 Skyllingstad E D, Paulson C A, Perovich D K. 2009. Simulation of melt pond evolution on level ice. Journal of Geophysical Research: Oceans, 114(C12): C12019, doi: 10.1029/2009JC005363 Stroeve J C, Markus T, Boisvert L, et al. 2014. Changes in Arctic melt season and implications for sea ice loss. Geophysical Research Letters, 41(4): 1216–1225, doi: 10.1002/2013GL058951 Wang Zhuo, Walsh J, Szymborski S, et al. 2020. Rapid arctic sea ice loss on the synoptic time scale and related atmospheric circulation anomalies. Journal of Climate, 33(5): 1597–1617, doi: 10.1175/JCLI-D-19-0528.1 Webster M A, Holland M, Wright N C, et al. 2022. Spatiotemporal evolution of melt ponds on Arctic sea ice: MOSAiC observations and model results. Elementa: Science of the Anthropocene, 10(1): 000072, doi: 10.1525/elementa.2021.000072 Webster M A, Rigor I G, Perovich D K, et al. 2015. Seasonal evolution of melt ponds on Arctic sea ice. Journal of Geophysical Research: Oceans, 120(9): 5968–5982, doi: 10.1002/2015JC011030 Woods C, Caballero R. 2016. The role of moist intrusions in winter Arctic warming and sea ice decline. Journal of Climate, 29(12): 4473–4485, doi: 10.1175/JCLI-D-15-0773.1 Wright N C, Polashenski C M. 2020. How machine learning and high‐resolution imagery can improve melt pond retrieval from MODIS over current spectral unmixing techniques. Journal of Geophysical Research: Oceans, 125(2): e2019JC015569, doi: 10.1029/2019JC015569 Xiong Chuan, Ren Yan. 2023. Arctic sea ice melt pond fraction in 2000-2021 derived by dynamic pixel spectral unmixing of MODIS images. ISPRS Journal of Photogrammetry and Remote Sensing, 197: 181–198, doi: 10.1016/j.isprsjprs.2023.01.023 Yang Xiaoye, Zeng Gang, Wang W C, et al. 2022. Asymmetry variations in Arctic summer onset and ending: role of sea-ice melting. Environmental Research Letters, 17(11): 114039, doi: 10.1088/1748-9326/ac9dad Zhang Jinlun, Rothrock D A. 2003. Modeling global sea ice with a thickness and enthalpy distribution model in generalized curvilinear coordinates. Monthly Weather Review, 131(5): 845–861, doi: 10.1175/1520-0493(2003)131<0845:MGSIWA>2.0.CO;2 Zhang J, Schweiger A, Webster M, et al. 2018. Melt pond conditions on declining Arctic sea ice over 1979–2016: Model development, validation, and results. Journal of Geophysical Research: Oceans, 123: 7983–8003., doi: 10.1029/2018JC014298 -


 点击查看大图
计量
- 文章访问数: 18
- HTML全文浏览量: 6
- 被引次数: 0

