Jianyin Zhou, Jie Xiang, Huadong Du, Suhong Ma. Forecasting the western Pacific subtropical high index during typhoon activity using a hybrid deep learning model[J]. Acta Oceanologica Sinica.
Citation:
Jianyin Zhou, Jie Xiang, Huadong Du, Suhong Ma. Forecasting the western Pacific subtropical high index during typhoon activity using a hybrid deep learning model[J]. Acta Oceanologica Sinica.
Jianyin Zhou, Jie Xiang, Huadong Du, Suhong Ma. Forecasting the western Pacific subtropical high index during typhoon activity using a hybrid deep learning model[J]. Acta Oceanologica Sinica.
Citation:
Jianyin Zhou, Jie Xiang, Huadong Du, Suhong Ma. Forecasting the western Pacific subtropical high index during typhoon activity using a hybrid deep learning model[J]. Acta Oceanologica Sinica.
Seasonal location and intensity changes in the western Pacific subtropical high (WPSH) are important factors dominating the synoptic weather and the distribution and magnitude of precipitation in the rain belt over East Asia. Therefore, this article delves into the forecast of the western Pacific subtropical high index during typhoon activity by adopting a hybrid deep learning model. Firstly, the predictors, which are the inputs of the model, are analysed based on three characteristics: the first is the statistical discipline of the WPSH index anomalies corresponding to the three types of typhoon paths; the second is the correspondence of distributions between sea surface temperature (SST), 850 hPa zonal wind (u), meridional wind (v), and 500 hPa potential height field; and the third is the numerical sensitivity experiment, which reflects the evident impact of variations in the physical field around the typhoon to the WPSH index. Secondly, the model is repeatedly trained through the backward propagation algorithm to predict the WPSH index using 2011-2018 atmospheric variables as the input of the training set. The model predicts the WPSH index after 6 h, 24 h, 48 h, and 72 h. The validation set using independent data in 2019 is utilized to illustrate the performance. Finally, the model is improved by changing the CNN2D module to the DeCNN module to enhance its ability to predict images. Taking the 2019 Typhoon Lekima as an example, it shows the promising performance of this model to predict the 500 hPa potential height field.
The western Pacific subtropical high (WPSH) is an anticyclone circulation system over the West Pacific that is stronger and more stable in the lower- and mid-troposphere, and its variabilities are usually depicted by the 500 hPa or 850 hPa geopotential height fields (Dao and Chu, 1964). Intraseasonal changes in the location and intensity of the WPSH can significantly influence the distribution and intensity of the persistent heavy rainfall (PHR) events over eastern China by affecting low-level moisture transport (Wang et al., 2000; Mao and Wu, 2006; Liu et al., 2008; Mao et al., 2010; Guan et al., 2019; Gao et al., 2019, 2020). Therefore, the accurate forecast of the WPSH can help authorities take precautions and protect people's lives and property. Typhoon is a powerful and deep low-pressure vortex that occurs in the western North Pacific (WNP), in which there occurs an important air-sea interaction process that transports massive amounts of heat and moisture (McBride, 1981; Subrahmanyam, 2015). The present study demonstrates that tropical cyclone (TC) activities over the WNP can strongly modulate the movement and intensity of the WPSH. The increment in scale and intensity of an initial TC will coerce a WPSH that tends eastward to withdraw, which makes the typhoon turn northward earlier (Wang et al., 2017; Sun et al., 2015b). Wang et al. (2019) maintains that TCs can affect the WPSH meridional movement by stimulating abnormal perturbations that disperse and propagate outwards. Sun et al. (2015a) used the Advanced Research version of the Weather Research and Forecasting (WRF-ARW) Model to conduct a sensitivity experiment on the impact of the microphysical parameterization scheme in a typhoon simulation on the WPSH. The result show that the overestimated convection in the TC eyewall will result in the simulated WPSH’s weakened intensity and that the TC track will turn northward earlier than observations. However, in previous studies, the quantitative impact of typhoon activities on WPSH changes have not been sufficiently studied and are still in an ambiguous state. To quantify the changes in the location and intensity of the WPSH, the WPSH index is introduced, including the area index (Ai), intensity index (Ii), ridge line (Rl), and west ridge point (WRp). The definition of the index in this article comes from National Climate Center (NCC) monitoring service (https://cmdp.ncc-cma.net/download/precipitation/diagnosis/wpsh.doc).
In recent years, research on the prediction of the western Pacific subtropical high index has generally focused on climate prediction. Zhang et al. (2000) used the backpropagation (BP) model of artificial neural networks to establish the mapping relationship between the equatorial sea temperature and the area index of the WPSH. Dong and Zhang (2004) improved the prediction precision of the western Pacific subtropical high ridge line based on wavelet decomposition and an adaptive network-based fuzzy inference system (ANFIS). Jia et al. (2015) proposed a statistical forecasting model based on optimal predictors to predict the interannual forecast of the WPSH index in summer. However, there are relatively few studies on the intraseasonal forecast of WPSH index. Liu et al. (2009) used EOF decomposition, wavelet decomposition, and support vector machine technology to reconstruct the 500 hPa geopotential height field to obtain the prediction of the geopotential height field. Hong et al. (2013) adopted a genetic algorithm to optimize the parameters of the nonlinear dynamic model and used this model to predict the 500 hPa potential field.
The two main research directions can be summarized from the above methods of predicting the WPSH index. (1) Statistical model. The advantage is that the main spatial and temporal patterns can be found from historical data, and the results have climate significance as well as low computational costs. (2) Atmospheric numerical model. The advantage lies in the use of atmospheric kinematics equations and thermodynamic equations to predict the atmospheric physical field, which combines the thermal relationship between various physical fields, and has high accuracy in short-term forecasts. The current studies about the forecast of the WPSH index are mostly on the seasonal and inter-annual scale, whereas forecasts of the WPSH index during typhoon activity are still scarce. At present, mature forecasting systems such as ECMWF, NCEP, and GRAPES are outstanding in short-term forecasting, but the accuracy of forecasting is related to the parameters debugging in the microphysical parameter scheme and the precision of the initial field. This article proposes a new method to train a WPSH index forecasting model by applying state-of-the-art deep learning technology with atmospheric field data during historical typhoon activities. This method considers the technical advantages and atmospheric physical meaning and also improves the calculation efficiency.
Predecessors’ predictions of the subtropical high are mostly concentrated on seasonal and interannual time spans; by contrast, the study on the prediction of WPSH index during typhoon activity is still scarce. Theoretical research for the short-term effects of high-frequency typhoons on low-frequency WPSHs are pivotal frontier topics, so we preliminarily studied the corresponding statistical relationship between the two in Section 3; then, we conduct a sensitivity experiment on the influence of physical field around the typhoon on the WPSH index. This analysis reconfirms the predictors affecting the WPSH index. In Section 4, the physical field of the predictor is input into the hybrid deep learning model, and the model parameters are updated through the BP algorithm, which effectively predicts the WPSH index in the next few moments. Section 5 shows the potential of the model in predicting the two-dimensional field of the WPSH.
2.
Data
The atmospheric reanalysis data sets used in this study include the 500 hPa geopotential field, the 850 hPa vorticity (relative) and wind, and the sea surface temperature field in coverage of (10°S-65°N, 99°E-167°E) with a 0.25°×0.25° horizontal resolution from the European Centre for Medium-Range Weather Forecasts (ECMWF). The raw typhoon data collected at the National Institute of Informatics of Japan covers time, coordinates, and maximum wind speed of central bottom layer. The time corresponding to typhoon activities from 2011 to 2019 are analysed in this study. To test the effect of prediction, the data are divided into two parts. The data from 2011-2018 are used as the training set to train the model, and the data from 2019 are used as the verification set. The WPSH index corresponding to the date of the typhoon activity is provided by the National Climate Center (NCC) monitoring service.
Anomalies are defined as the deviations from the climatological mean over the entire period. A composite analysis is performed in this study for the three types of typhoon tracks. Based on the three track types identified by Elsner and Liu (2003), fifteen of the 45 typhoon paths of each type (as listed in Table 1) are selected for analysis.
Table
1.
Information from fifteen typhoons for each of three types of typhoons
The disturbance of the ocean temperature and mid-troposphere wind field caused by a typhoon will affect the atmospheric circulation and feedback to the WPSH (Emanuel, 2001; Sun et al., 2015a; Wang et al., 2017). Therefore, we chose the predictors fed in model as follows: (1) One-dimensional data: the coordinates of the typhoon and the movement direction; and (2) Two-dimensional data: the sea surface temperature (SST), the u and v wind speed on 850 hPa, and the geopotential height of 500 hPa. To study the relationship between typhoon activity and the WPSH index, the anomalies of the four WPSH indices corresponding to the three typhoon paths are analysed, and the anomalies of the 500 hPa geopotential height corresponding to the three types of typhoon paths, the SST, the u, v wind field and vorticity field of the 850 hPa are studied separately. We then carried out the sensitivity experiment on the change of the WPSH’s physical field during the typhoon activity.
Figure1 shows the anomalies of the WPSH index corresponding to the three types of typhoons. It can be seen that when the typhoon’s path is westward, the area index and intensity index of the WPSH are the highest, the westward ridge point is closest to inland, and the latitude of the ridge line is near the historical average. When the typhoon’s path belongs to the northwest type, the ridge line of the WPSH reaches the highest latitude, the area index is slightly lower than the historical level, the strength index is higher than the average level, and the longitude of west ridge point extends between the westward and the steering type. When the typhoon’s path belongs to the turning type, the area index and intensity index of the WPSH are the smallest, which is lower than the historical average level, the anomaly of ridge line is negative, its location is at the southernmost latitude among three typhoon types, and the west ridge point extends the most eastward. It can be inferred that there are obvious differences in the three corresponding relationships between the WPSH index and the three types of typhoon paths, which are characterized by their coordinates and movement angle. Therefore, it is reasonable that the predictive factors contain coordinates and the angle of movement.
Figure
1.
The anomalies of the WPSH index corresponding to the three types of typhoon paths. The data used in the statistics are the WPSH index corresponding to the typhoon in Table 1.
Figure 2 shows the distribution of the 500 hPa geopotential height field anomalies corresponding to the three typhoon paths. Most typhoons have paths between the positive and negative geopotential height anomalies and are close to the negative anomalies. It can be seen that when the path of the typhoon is westward, the geopotential anomaly of Southeast Asia and the northeastern Eurasian continent is negative, while the geopotential anomaly of the East China Sea is positive, indicating that the WPSH tends to extend westward. In the middle of the two negative anomalies, the position of the ridge line does not change much. When the typhoon's path is northwest, the WPSH tends to move northward and extend westward. When the typhoon's path is turning, the east side has weak positive anomalies and the north side has strong negative anomalies, indicating that the WPSH tends to move southward and extend eastward. The anomalies of the SST, 850 hPa wind field, and the vorticity field SST corresponding to the three types of typhoons are shown in Fig.3. It can be seen that the negative SST anomaly of the westbound typhoon is located in the South China Sea, and the positive SST anomaly is located in the north of 30°N. The negative SST anomaly of the northwest bound typhoon is located in the southern waters of the South China Sea, and its intensity and range have decreased compared to the westward typhoon. To the north of 20°N, there is a positive SST anomaly with a northeast-southwest direction, which is stronger than the westward typhoon, while the SST anomaly decreases to the east of 165°E. The SST anomaly of the steering typhoon is significantly lower than that of the previous two types of typhoons, with a decrease of more than 1°C in the north of 25°N, while the SST anomaly in the southern South China Sea is significantly increased. The centre of the maximum wind speed anomaly of the three types of typhoons is between the WPSH positive anomalies and negative anomalies. The negative (positive) vorticity centre corresponds to the positive (negative) geopotential height anomaly, and vice versa.
Figure
2.
The distribution of west bound, northwest bound, and steering typhoon paths and intensity with corresponding 500 hPa pressure field anomalies.
To verify the influence of the SST, 850 hPa wind speed, and vorticity on the WPSH around the typhoon, we conducted sensitivity experiments based on the WRF model. The sensitivity coefficient of the WPSH index $ p $ is defined as follows:
$$ p(A i)=\frac{\Delta(A i)}{\sigma(A i)} $$
(1)
$$ p(f)=\frac{\Delta(f)}{\sigma(\hbar)} $$
(2)
$$ p(R l)=\frac{\Delta(R l)}{\sigma(R l)} $$
(3)
$$ p(W R p)=\frac{\Delta(W R p)}{\sigma(W R p)} $$
(4)
where $ \sigma(A i) $=38.15, $ \sigma(I i) $=167.22, $ \sigma(R l) $=5.74, and $ \sigma(W R p) $=16.66; $ \Delta $ is the difference between the WPSH index obtained by the WRF and the actual WPSH index.
In the experiment, we take the 2016 northwest Typhoon Nibert as an example and use the controlled variable method to increase or decrease the 850 hPa wind speed, the vorticity, and the SST by 20% around $ 15^{\circ} \times 15^{\circ} $ of the typhoon as the initial numerical integration field. The sensitivity coefficients for 24 h, 48 h, and 72 h are obtained, and the specific results are shown in Table 2. It can be seen that when the sea temperature increases by 20% and the wind speed of 850 hPa u, v (same as vorticity) decreases, the sensitivity coefficients of the area index and the intensity index will decrease, and the position of the ridge line will move to the north, and the west extension point will tend eastward, and vice versa. Based on the above results, we believe that it is reasonable to use the above physical fields as factors when predicting the WPSH index.
Table
2.
Comparison results of sensitivity coefficient of the WPSH index in sensitivity experiment.
+20%SST/°C
−20%SST/°C
+20%u/(m·s−1)
−20% u/(m·s−1)
+20%v/(m·s−1)
−20%v/(m·s−1)
p(Ai)
−0.14/−0.21/−0.22
0.07/0.11/0.12
0.06/0.07/0.10
−0.03/−0.01/−0.01
0.01/0.02/0.01
−0.02/−0.02/−0.01
p(Ii)
−0.05/−0.14/−0.13
0.02/0.12/0.19
0.09/0.13/0.11
−0.02/−0.04/−0.04
0.05/0.09/0.11
−0.02/−0.01/−0.01
p(RI)
0.12/0.19/0.16
−0.01/− 0.01/−0.05
−0.02/−0.01/0.01
0.03/0.05/0.01
0.08/0.09/0.08
−0.05/−0.06/−0.01
p(WRp)
0.09/0.12/0.18
−0.26/−0.22/−0.10
−0.11/−0.03/−0.02
0.21/0.14/0.04
−0.06/−0.05/−0.02
0.07/0.02/0.02
Note: The content in the table is the sensitivity coefficient after 24 h, 48 h, and 72 h of WRF integration.
From the above analysis, it can be seen that the coordinate, maximum wind speed, and movement angle of the typhoon as well as the distribution of the SST, 850 hPa wind field, and 500 hPa geopotential height field all affect the WPSH index. Accordingly, this section will take the above variables as the predictor fed in the hybrid deep learning model.
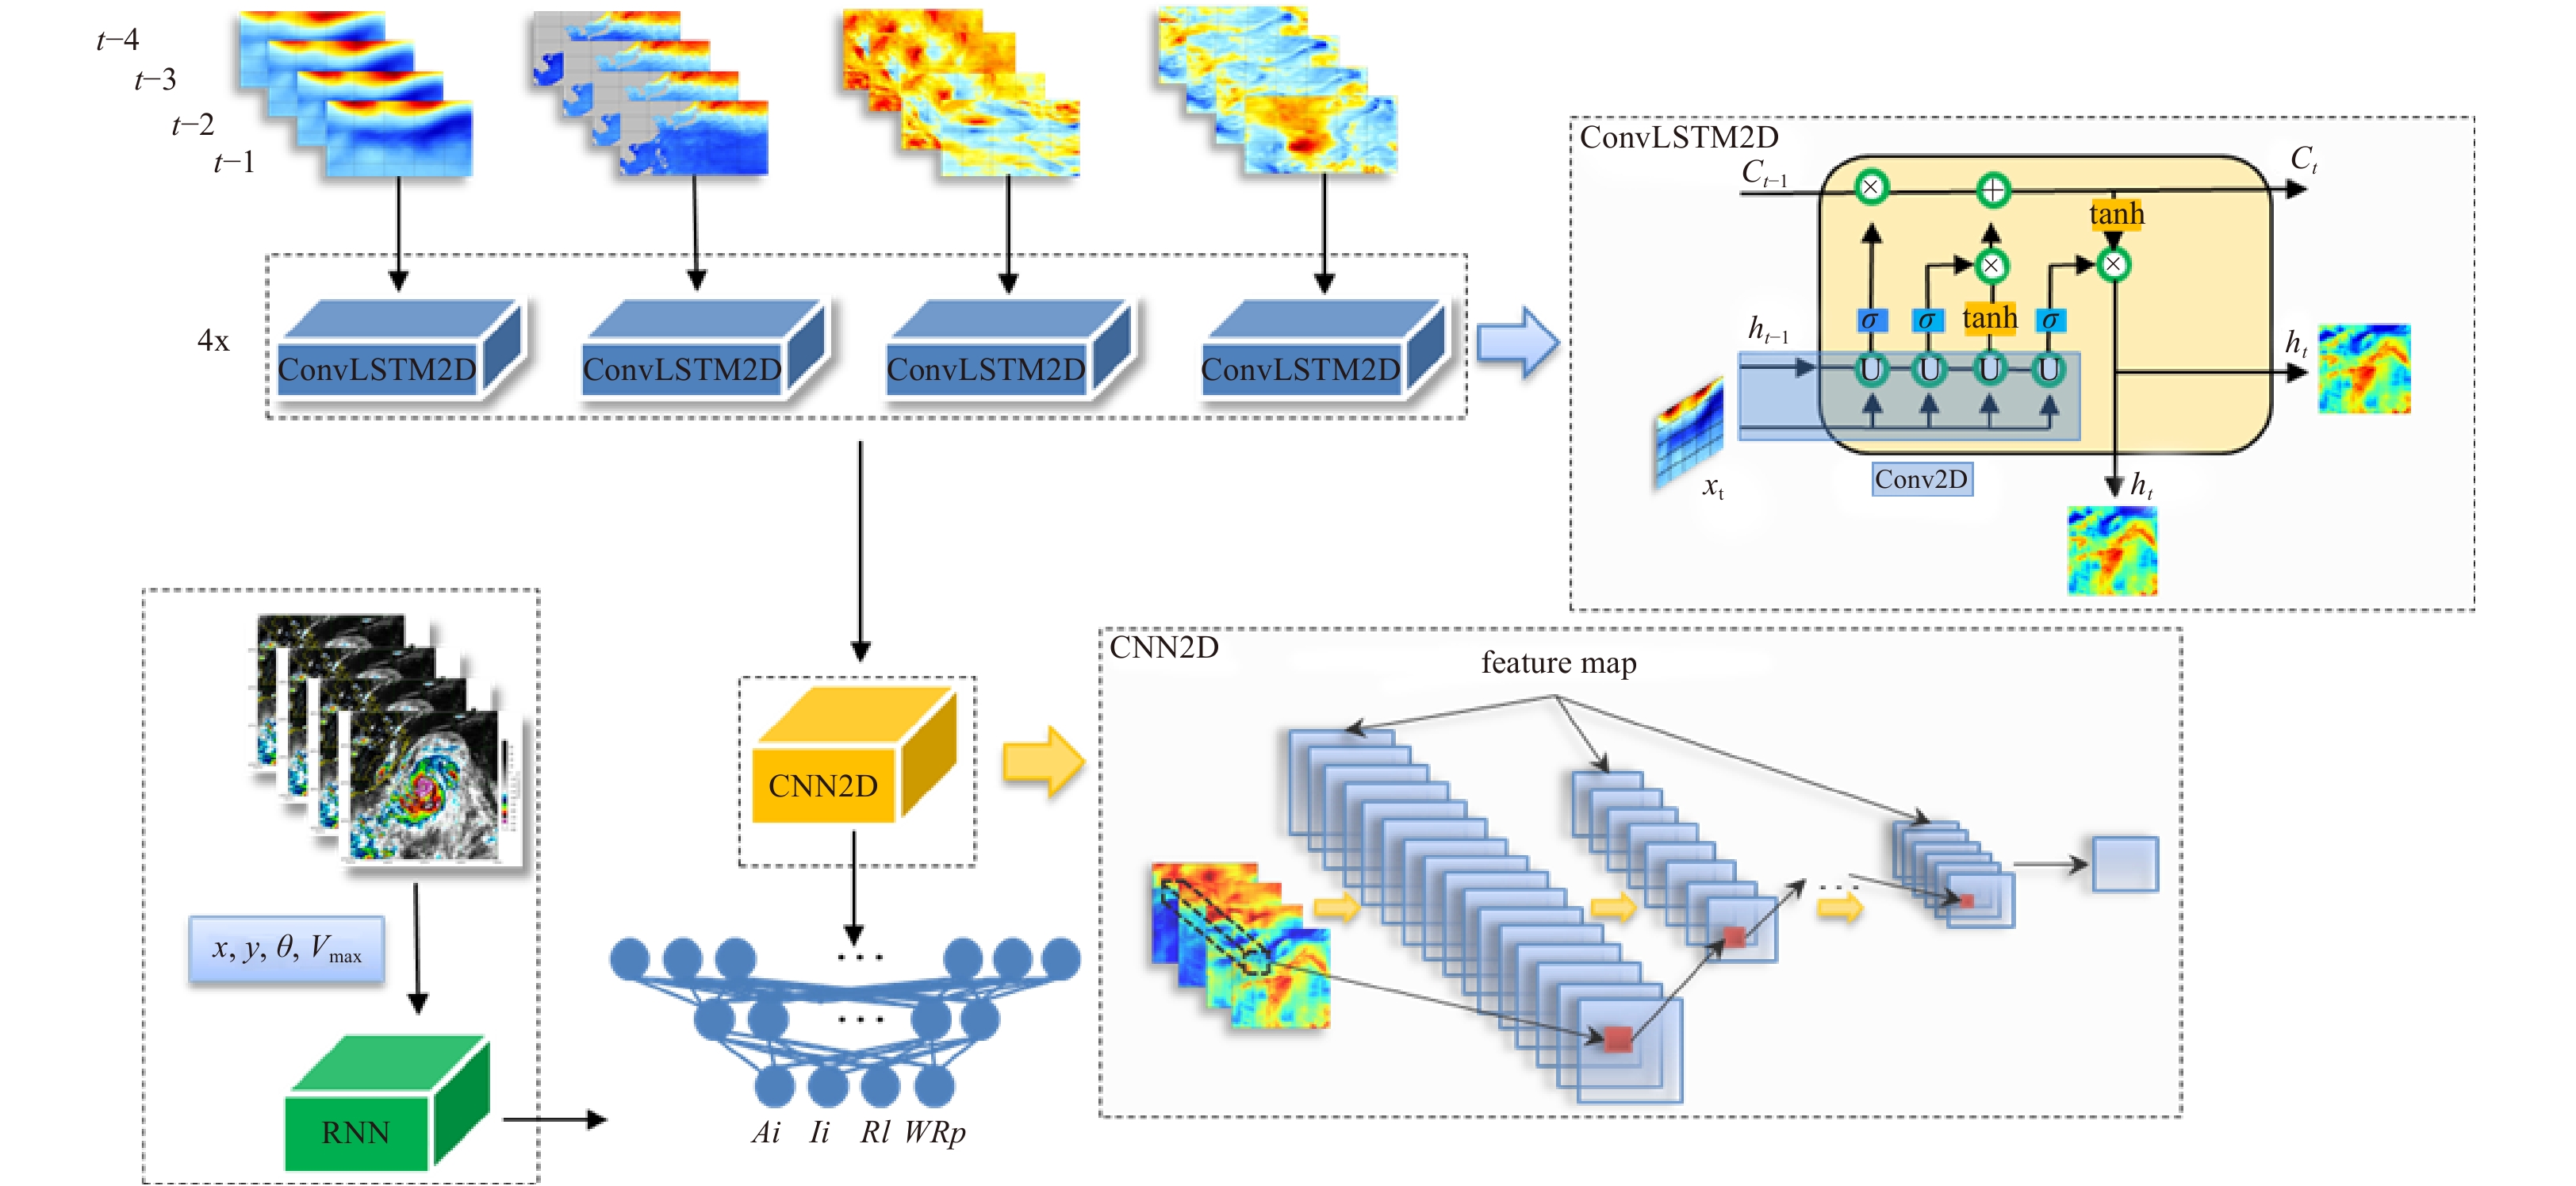
Figure 4 illustrates the overall architecture of the hybrid WPSH index model. There are four main modules: (1) Input layer. The input of the convolutional long short-term memory network (ConvLSTM2D) layer are the 500 hPa geopotential height, the SST, and the u and v wind fields of 850 hPa at the first four moments, each shown as a $ 4 \times 301 \times 273 \times 1 $ grid dataset. After passing through the RNN module, the coordinates, movement direction and maximum wind speed information of the typhoon are merged with the first layer of the full connection layer. (2) ConvLSTM2D. There is a total of 4 paratactic ConvLSTM2D layers, which extract features of 2D pictures through the convolutional neural network (CNN) layer instead of fully connected layer in the long short-term memory (LSTM) network. (3) CNN. The operations performed on this layer include kernel convolution, max pooling and tanh activation. (4) Fully connected layer. The two-dimensional array output by the upper layer is flattened and merged with the typhoon's latitude, longitude, maximum wind speed and direction, and the predicted WPSH index is obtained through the fully connected layer. More details of each module and specific parameters are shown in https://github.com/Happiyin/WPSH-index. The model uses the backward propagation method to calculate the weight gradient of the loss function, which is fed back to the optimization method to update the weight to minimize the loss function. Here, we select MSE for the loss function and select adaptive moment estimation (Adam) as the optimization algorithm.
Figure
4.
The architecture of hybrid deep learning model used for forecasting the WPSH index.
The data from 2011 to 2018 were taken as the training set, and the data from 2019 (245 input data in total) were taken as the validation set. The following scoring metrics, including mean absolute error (MAE) and Pearson correlation coefficient (CORR), are computed for quantitative assessment of the models:
where $ \hat{y}_{i} $ denotes the values of the four indices predicted by the model, $ y_{i} $ denotes the real value of the four indices, $ \left\langle\hat{y}_{i}\right\rangle $ denotes the average of the predicted values, and $ \left\langle y_{i}\right\rangle $ denotes the average of the real values.
Table 3 shows the comparison of the 6 h, 24 h, 48 h, and 72 h prediction results between the proposed hybrid model and the ground value. It can be found that the results of the four WPSH index scoring metrics are proportional to the variance of the index. Ri has the largest MAE and the lowest CORR. Rl has the smallest MAE and the highest CORR. The greater the variance, the greater the MAE, and the smaller the CORR, and vice versa. As the forecast time increases, the MAE increases and the CORR decreases. This finding shows that the results of the model are closely related to the variance of the target and steadily weaken over time. At the same time, since there will inevitably be errors in the reanalysis data and the typhoon data, the results of the model are still acceptable. Figure 5 visualizes the MAE of the WPSH index in a series of box plots, which show the measurement indicators: median, average, maximum and minimum values, and the outliers. We can see that as the forecast time increases, the above indictors increase. The longer the forecast time is, the weaker the correlation between the forecast time and the initial time. At the same time, the interference factors during the period will increase (such as the typhoon path and intensity changes), which makes the model more unstable. Therefore, the most effective way to train the model to learn how physical variables change over time is to increase the time length of the input data.
Table
3.
The scoring metrics of the four indices obtained by the hybrid deep learning model
Deep learning models have powerful predictive capabilities and have now played an important role in the field of image prediction. Compared with various numerical models in the field of atmospheric science, such as WRF, the advantage of deep learning models is that they can potentially learn the physical laws within data through repeatedly training in the form of linear weights and convolution kernel weights through shallow physical laws. The prediction of the WPSH index during typhoon activity is a process on a sub-seasonal scale. This article first analyses the predictors and conducts a sensitivity experiment, which shows that the SST and 850 hPa u, v wind field are predictors of the WPSH index. The hybrid deep learning model combines ConvLSTM2D, Conv2D, RNN and an FC layer. The model updates the parameters through the backward propagation algorithm and the Adam optimization algorithm.
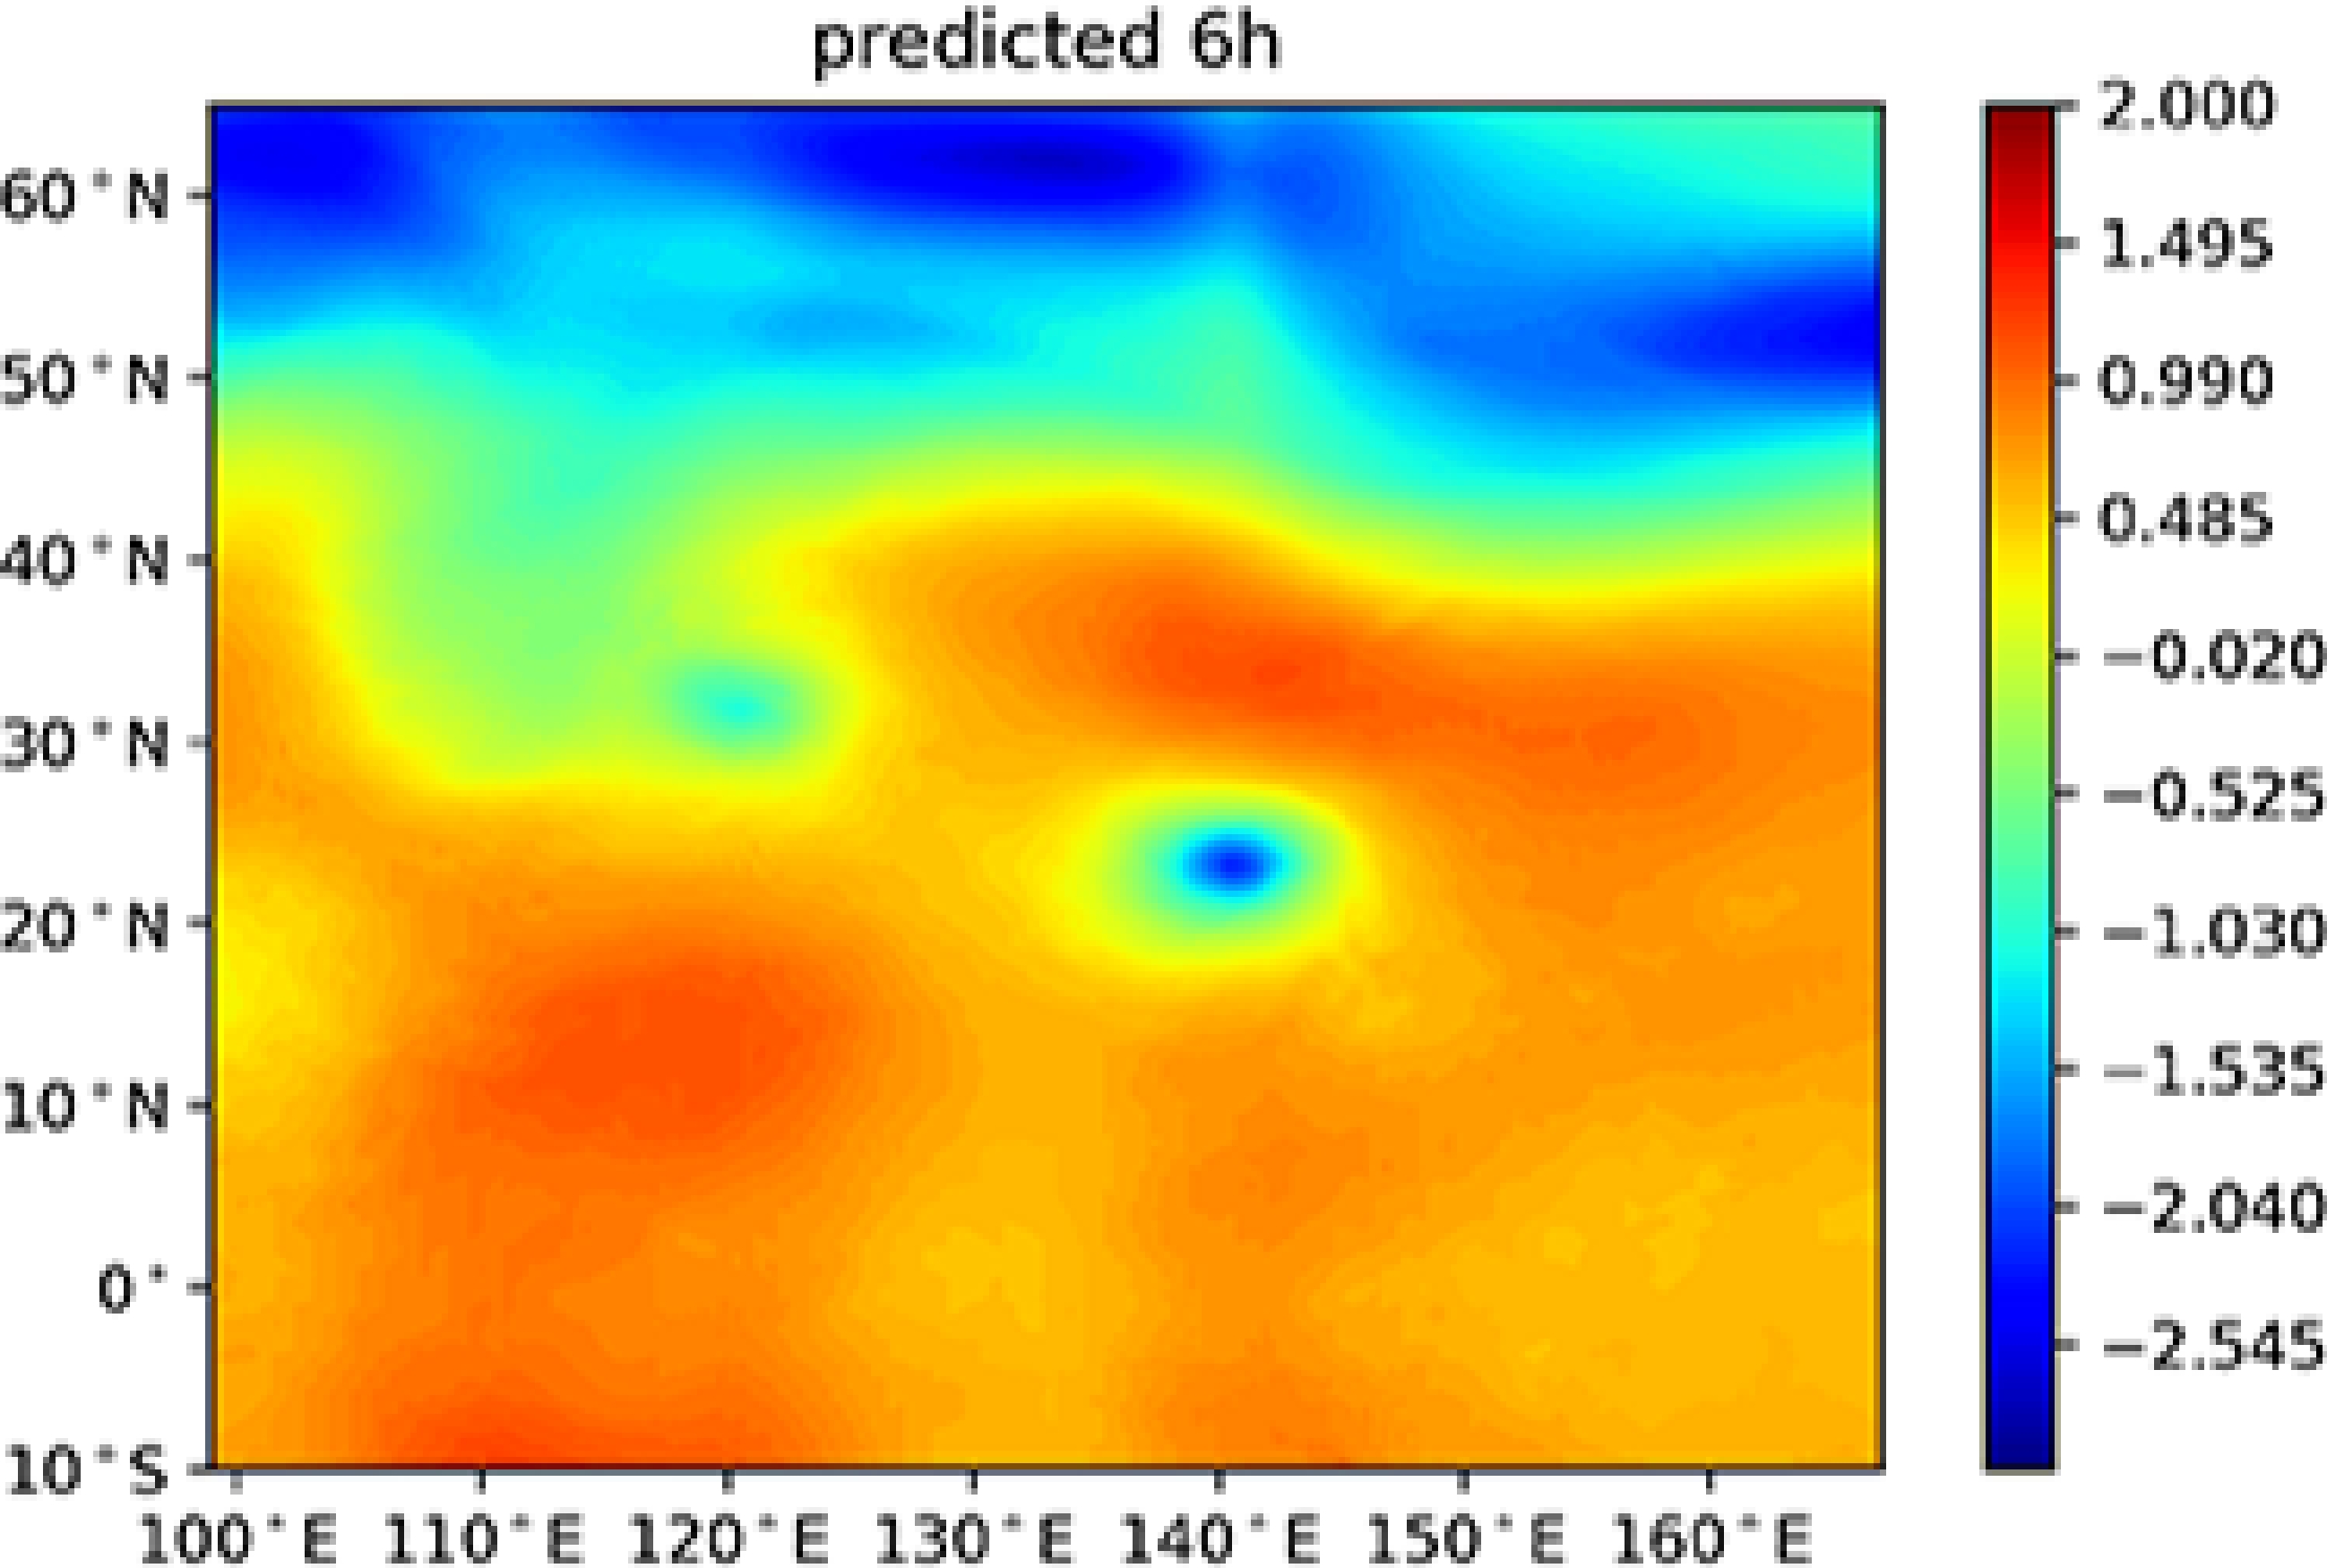
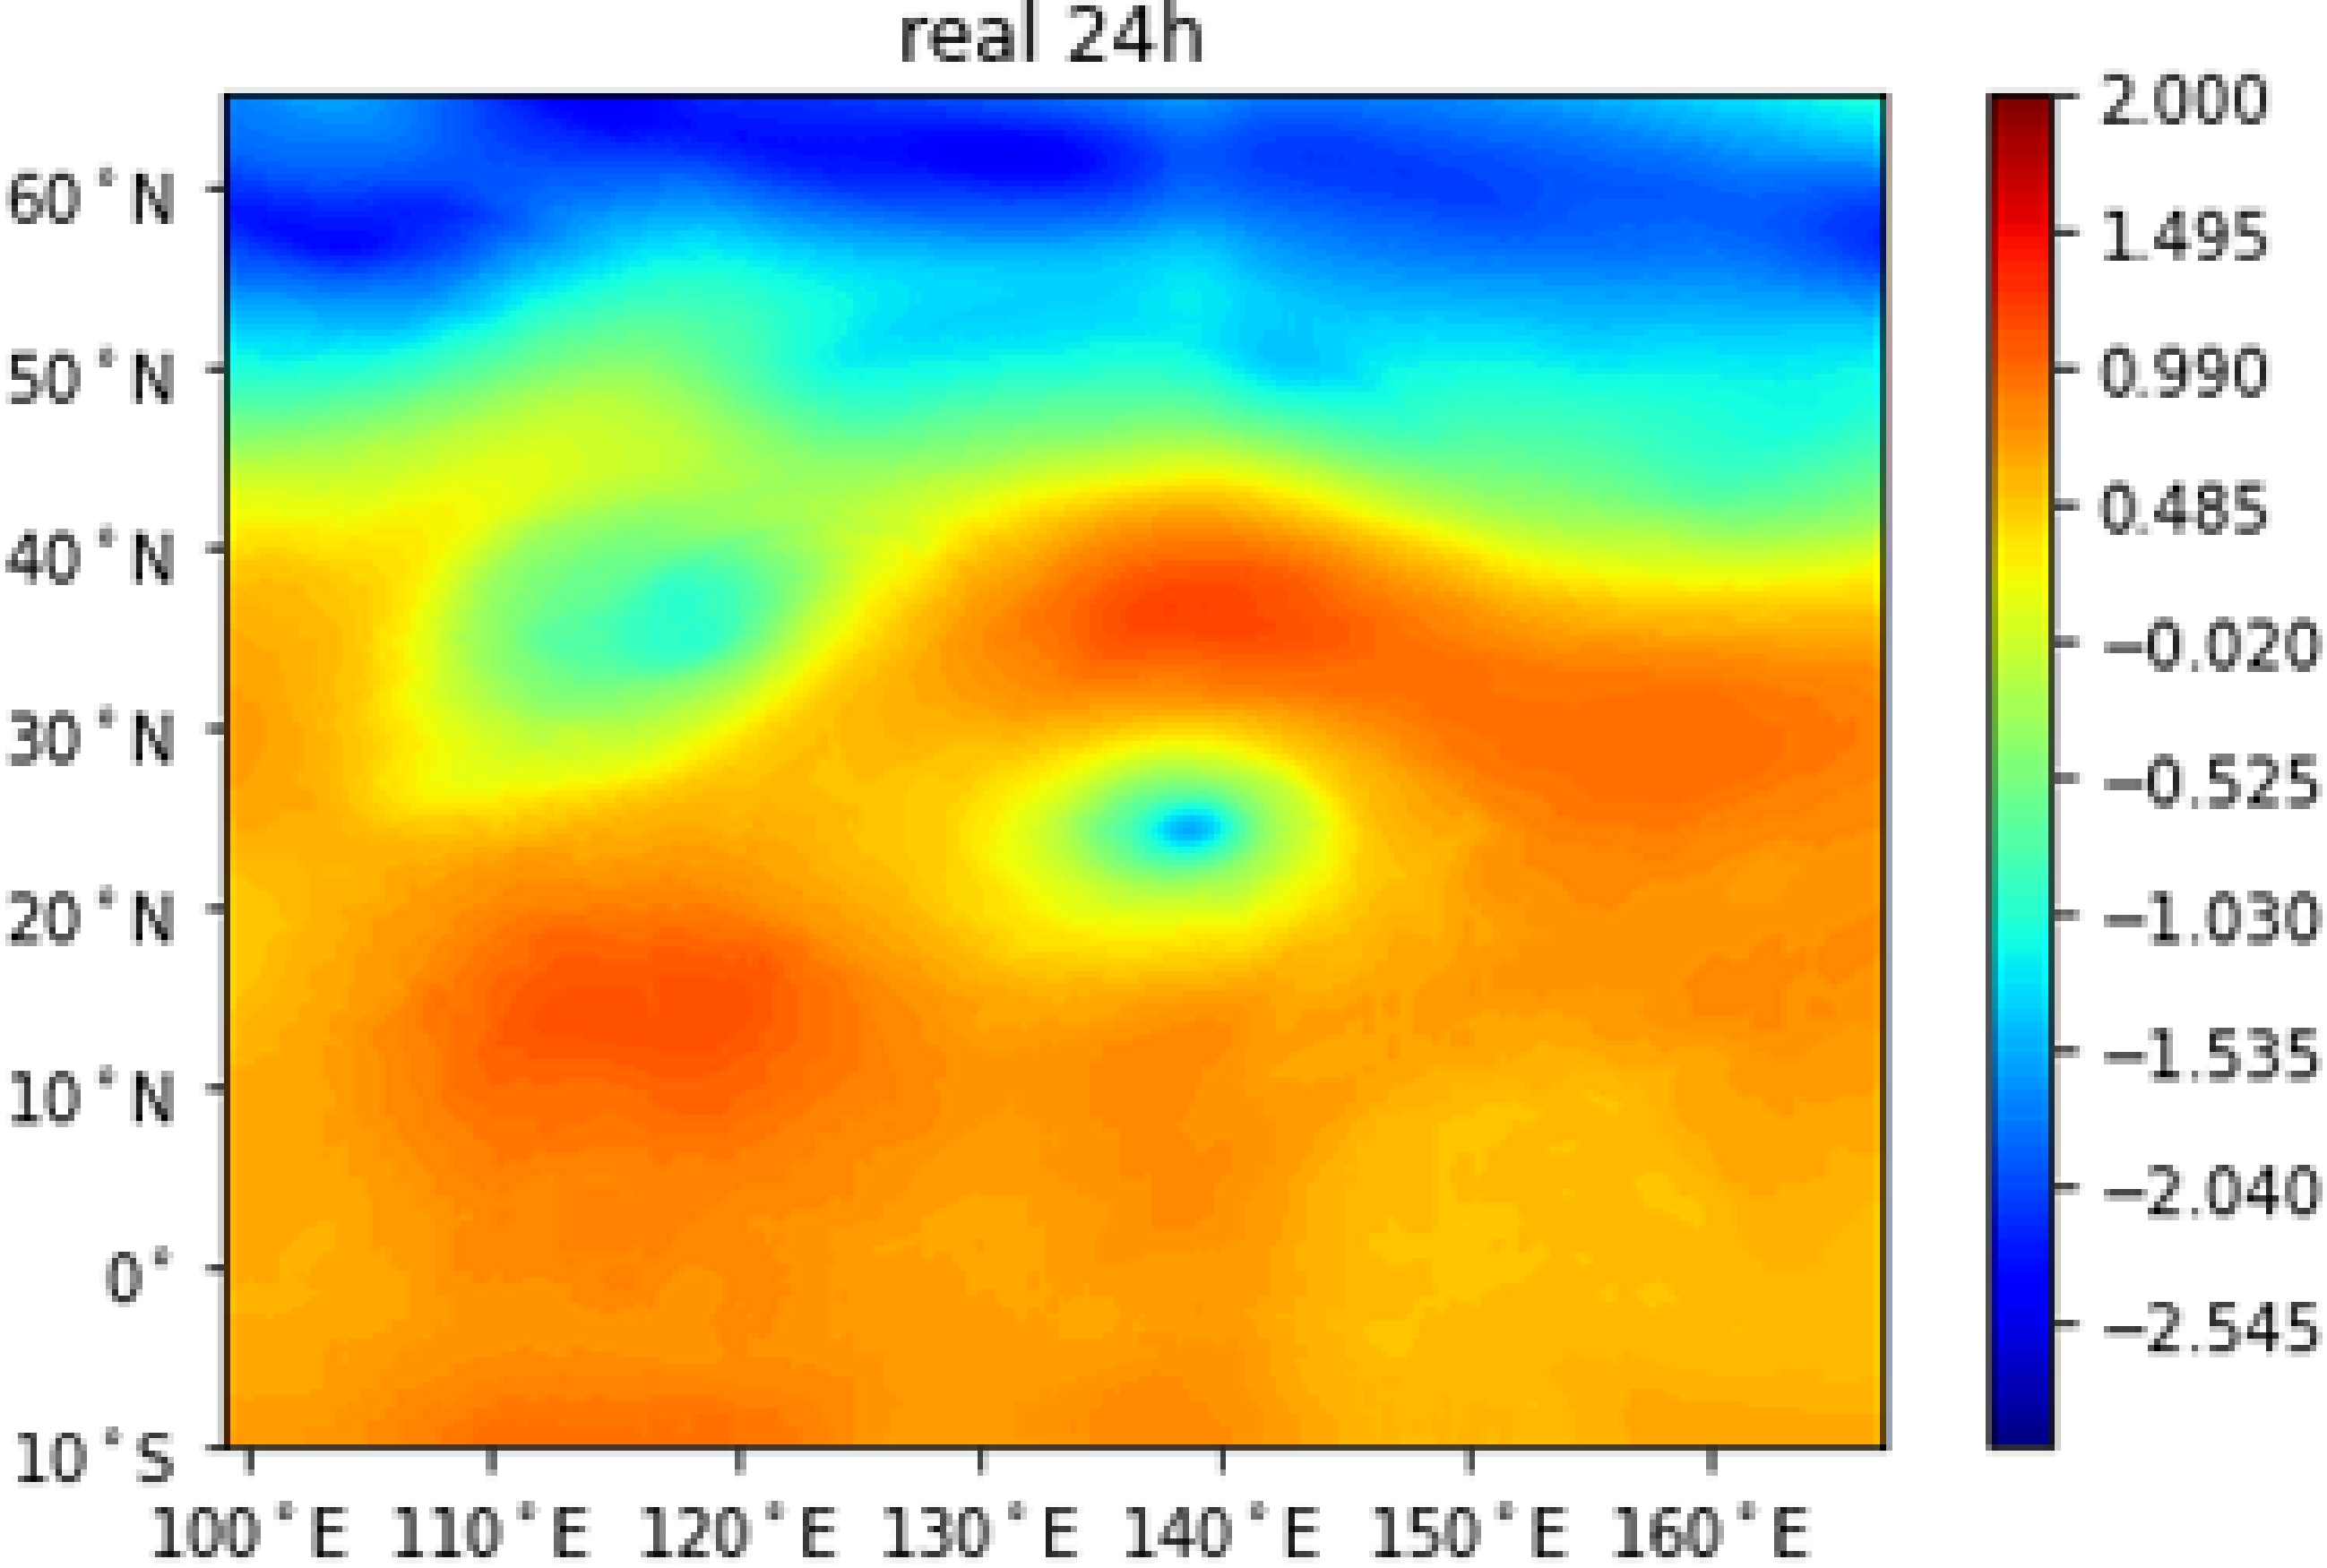
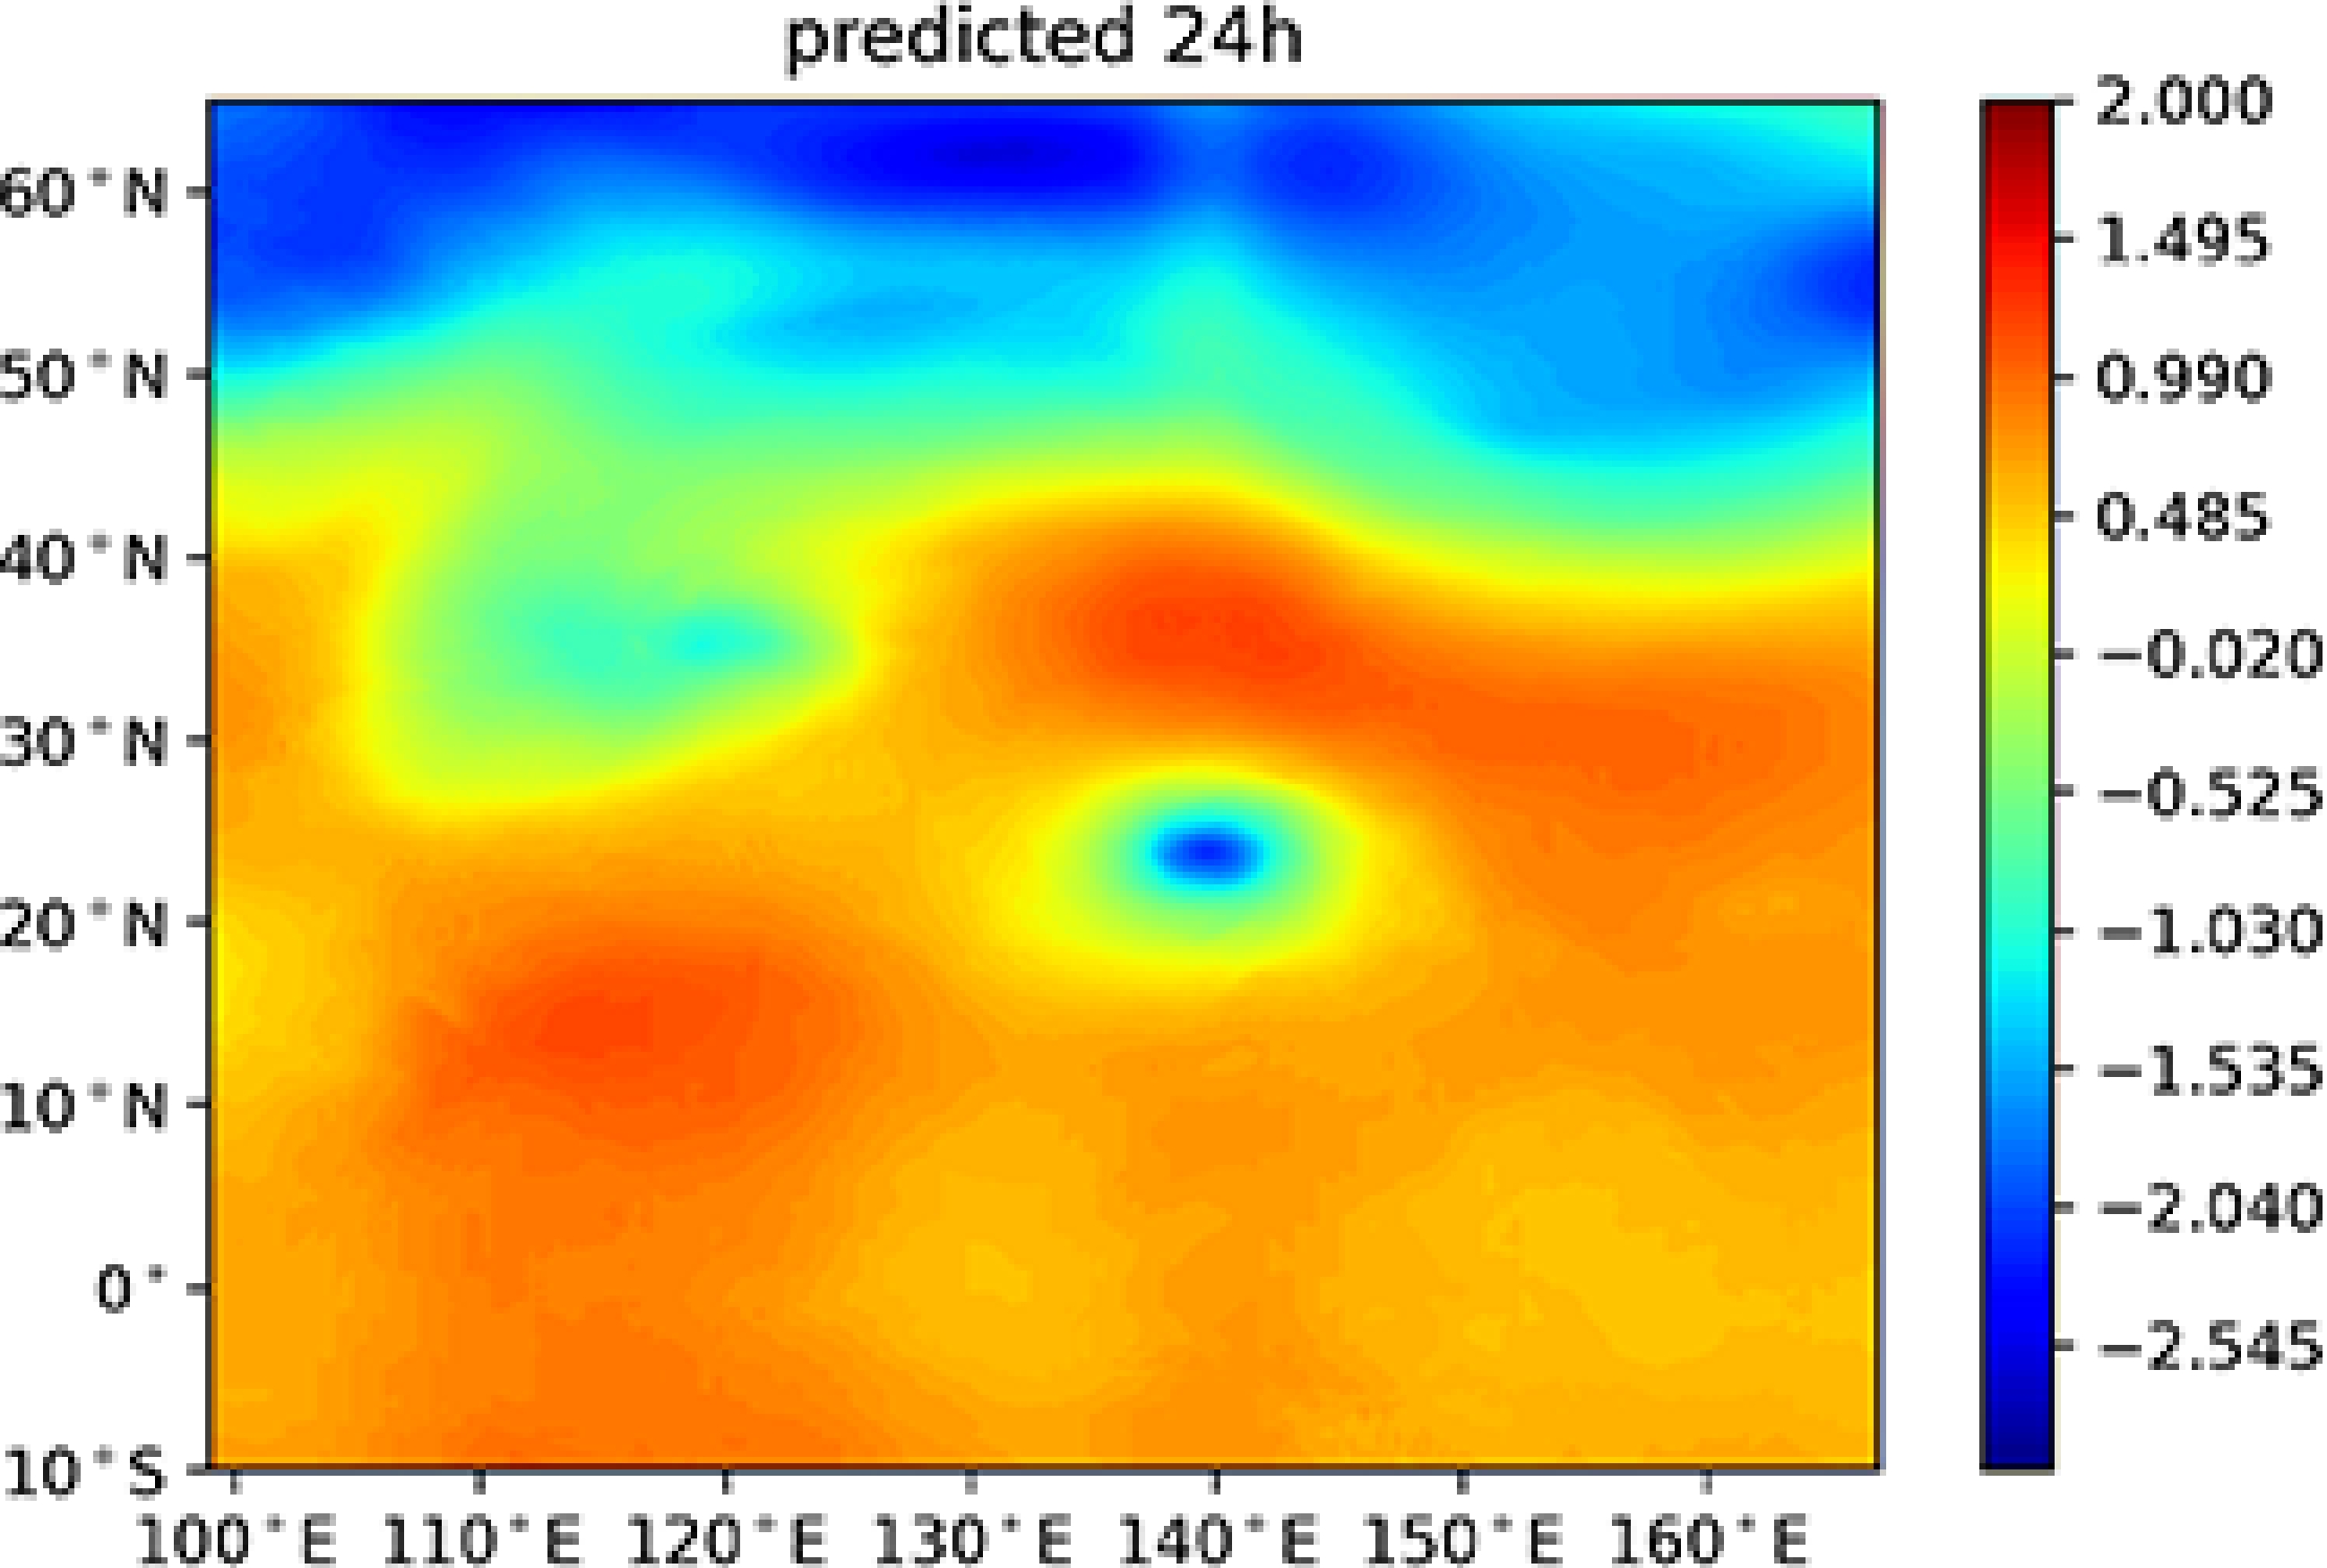
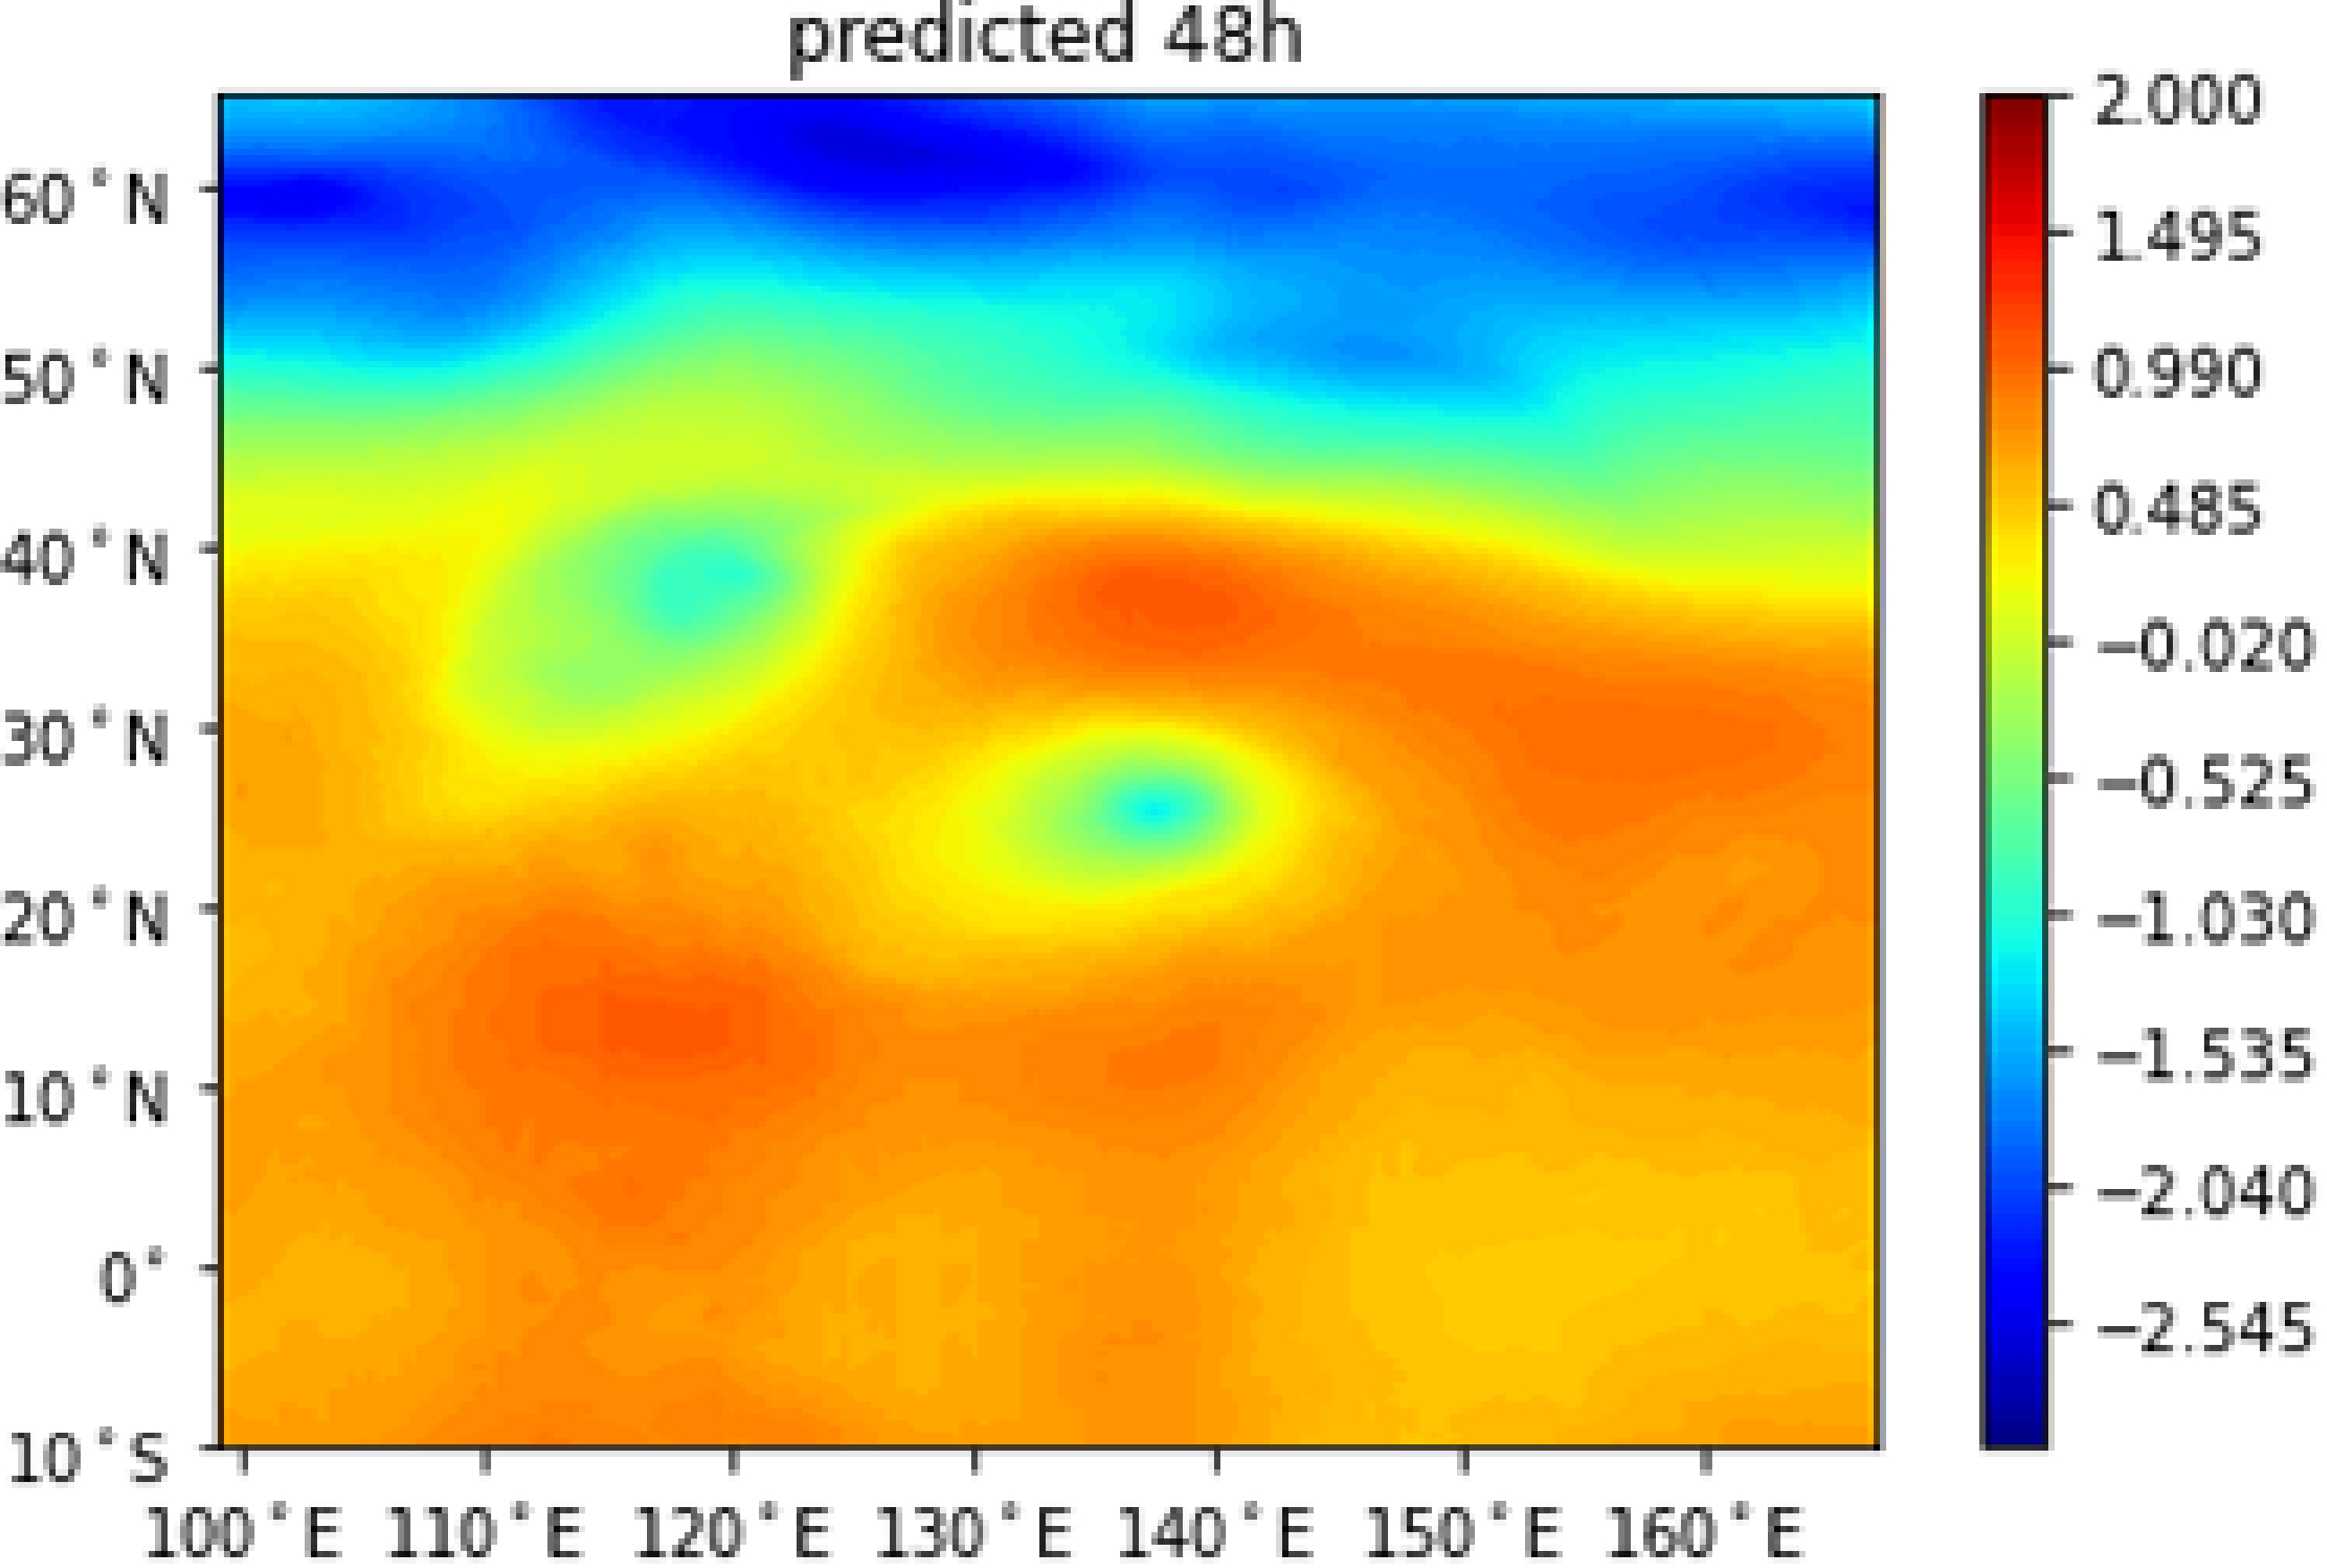
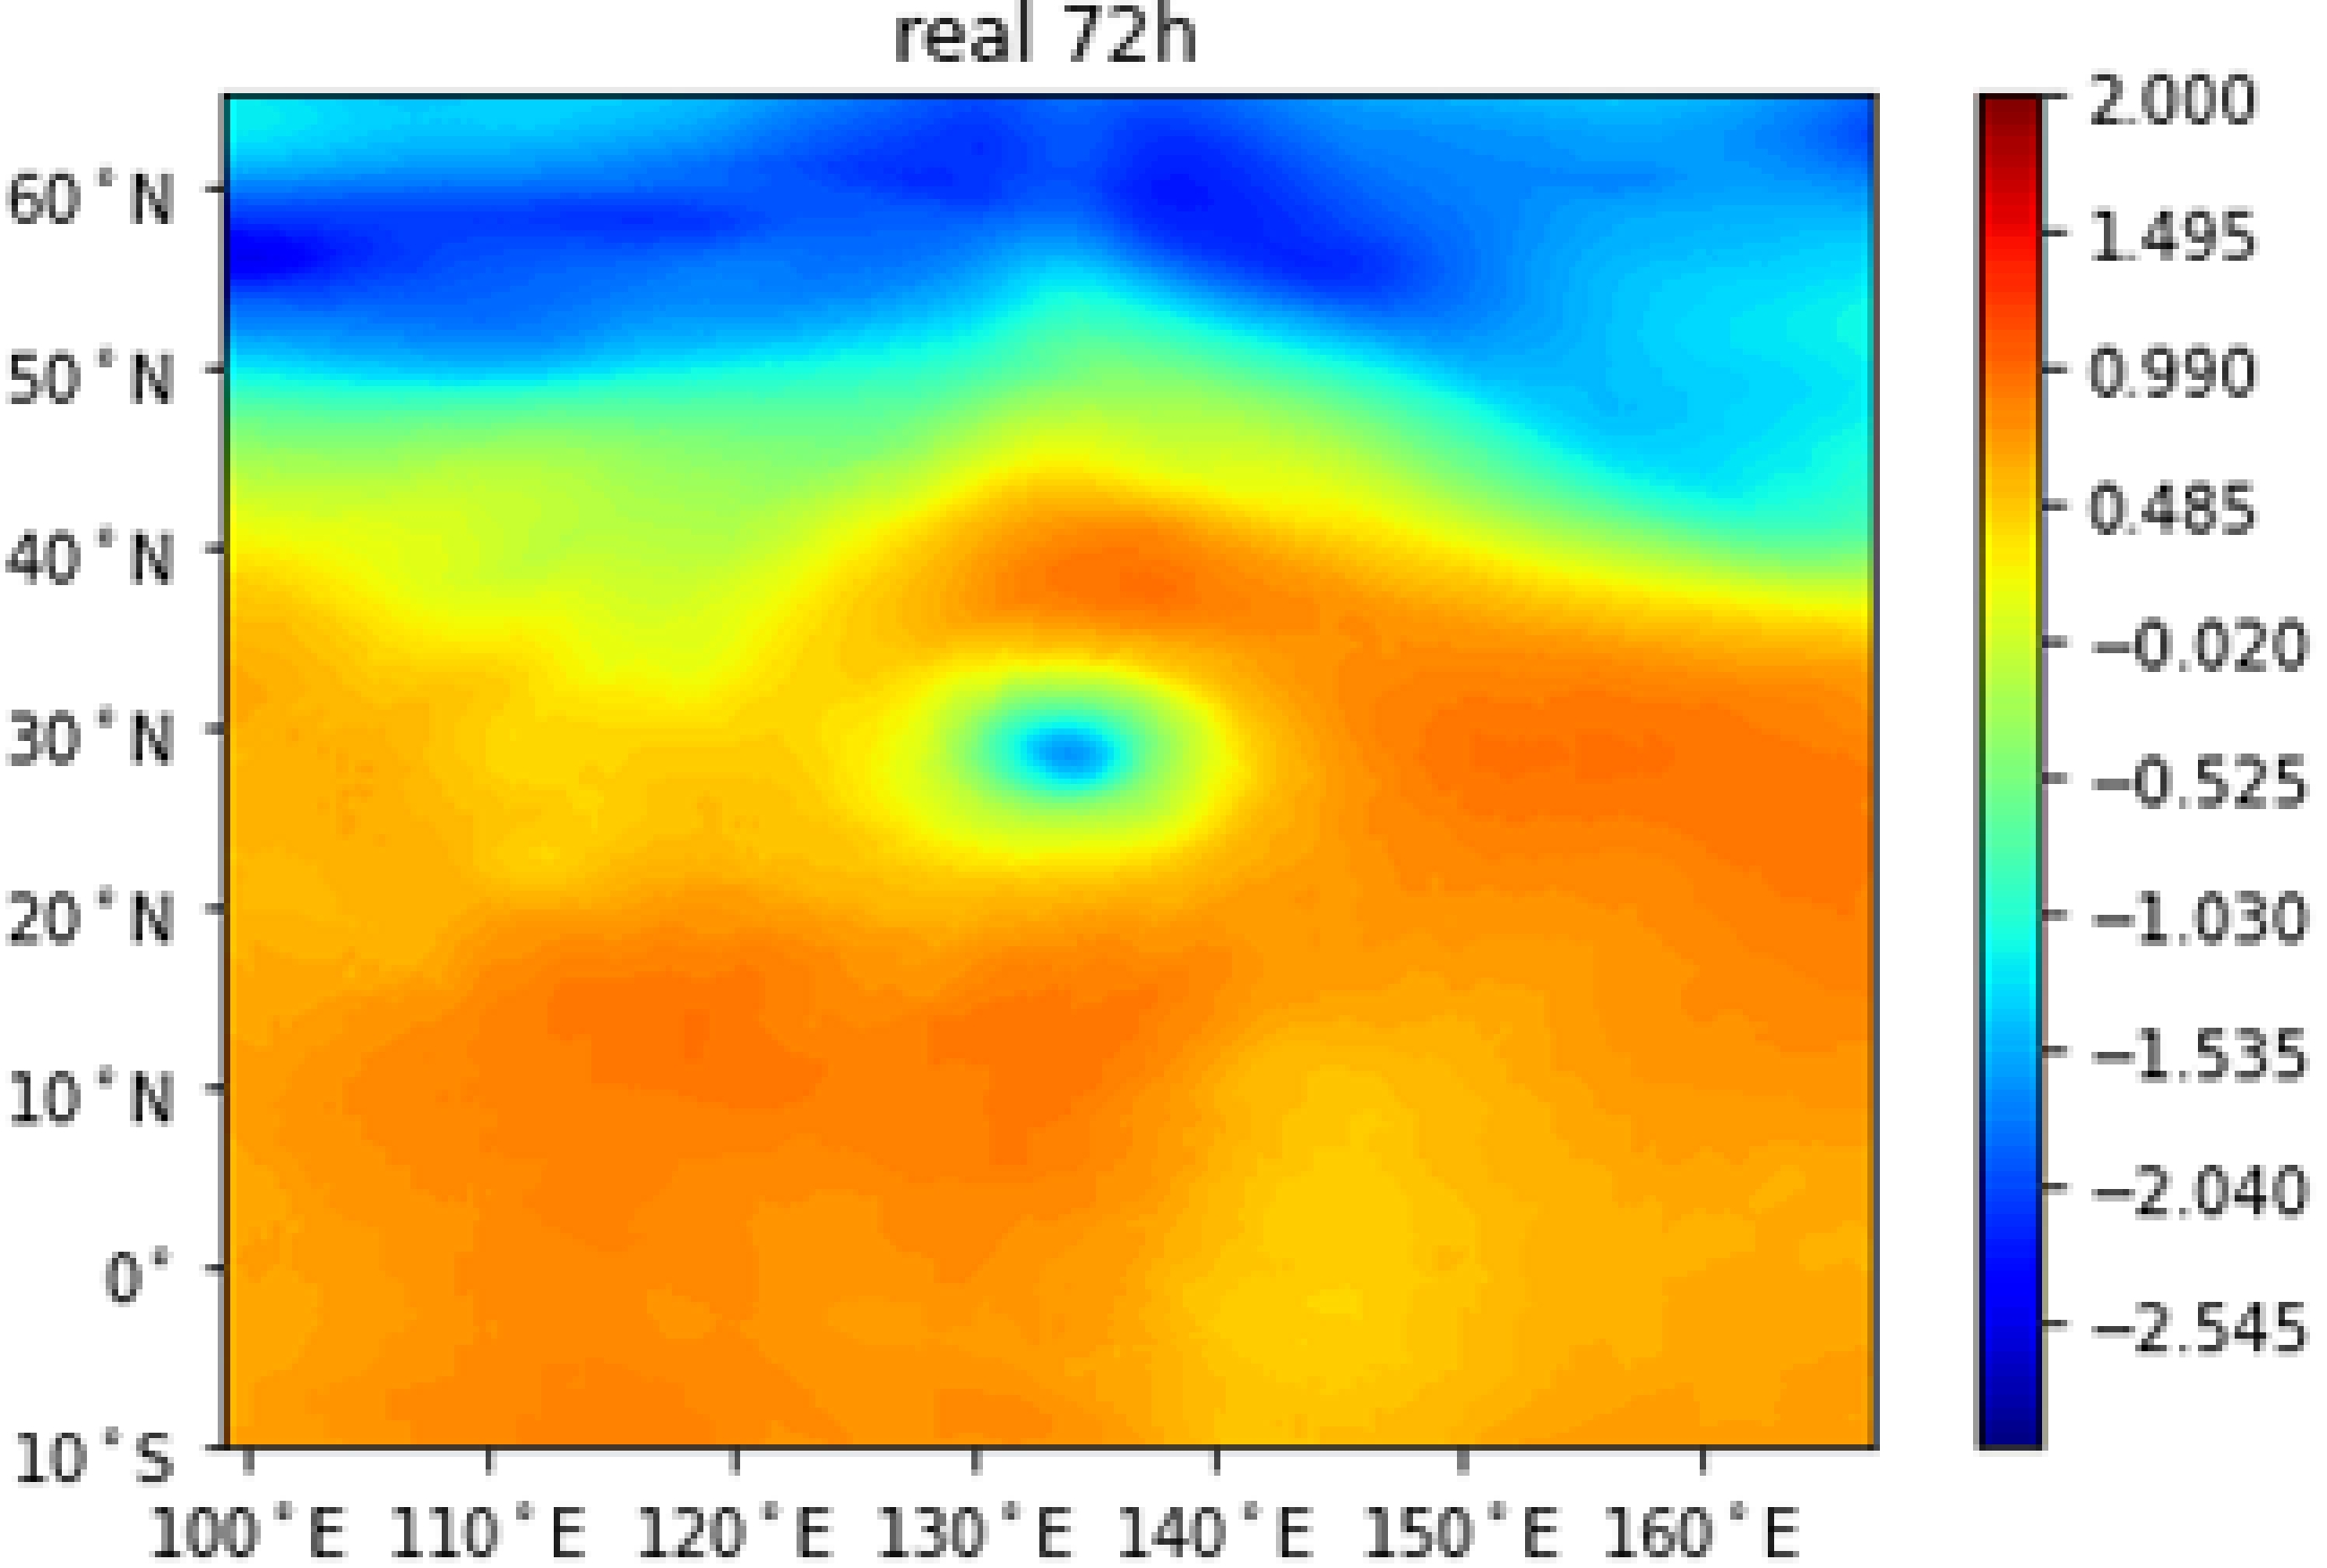
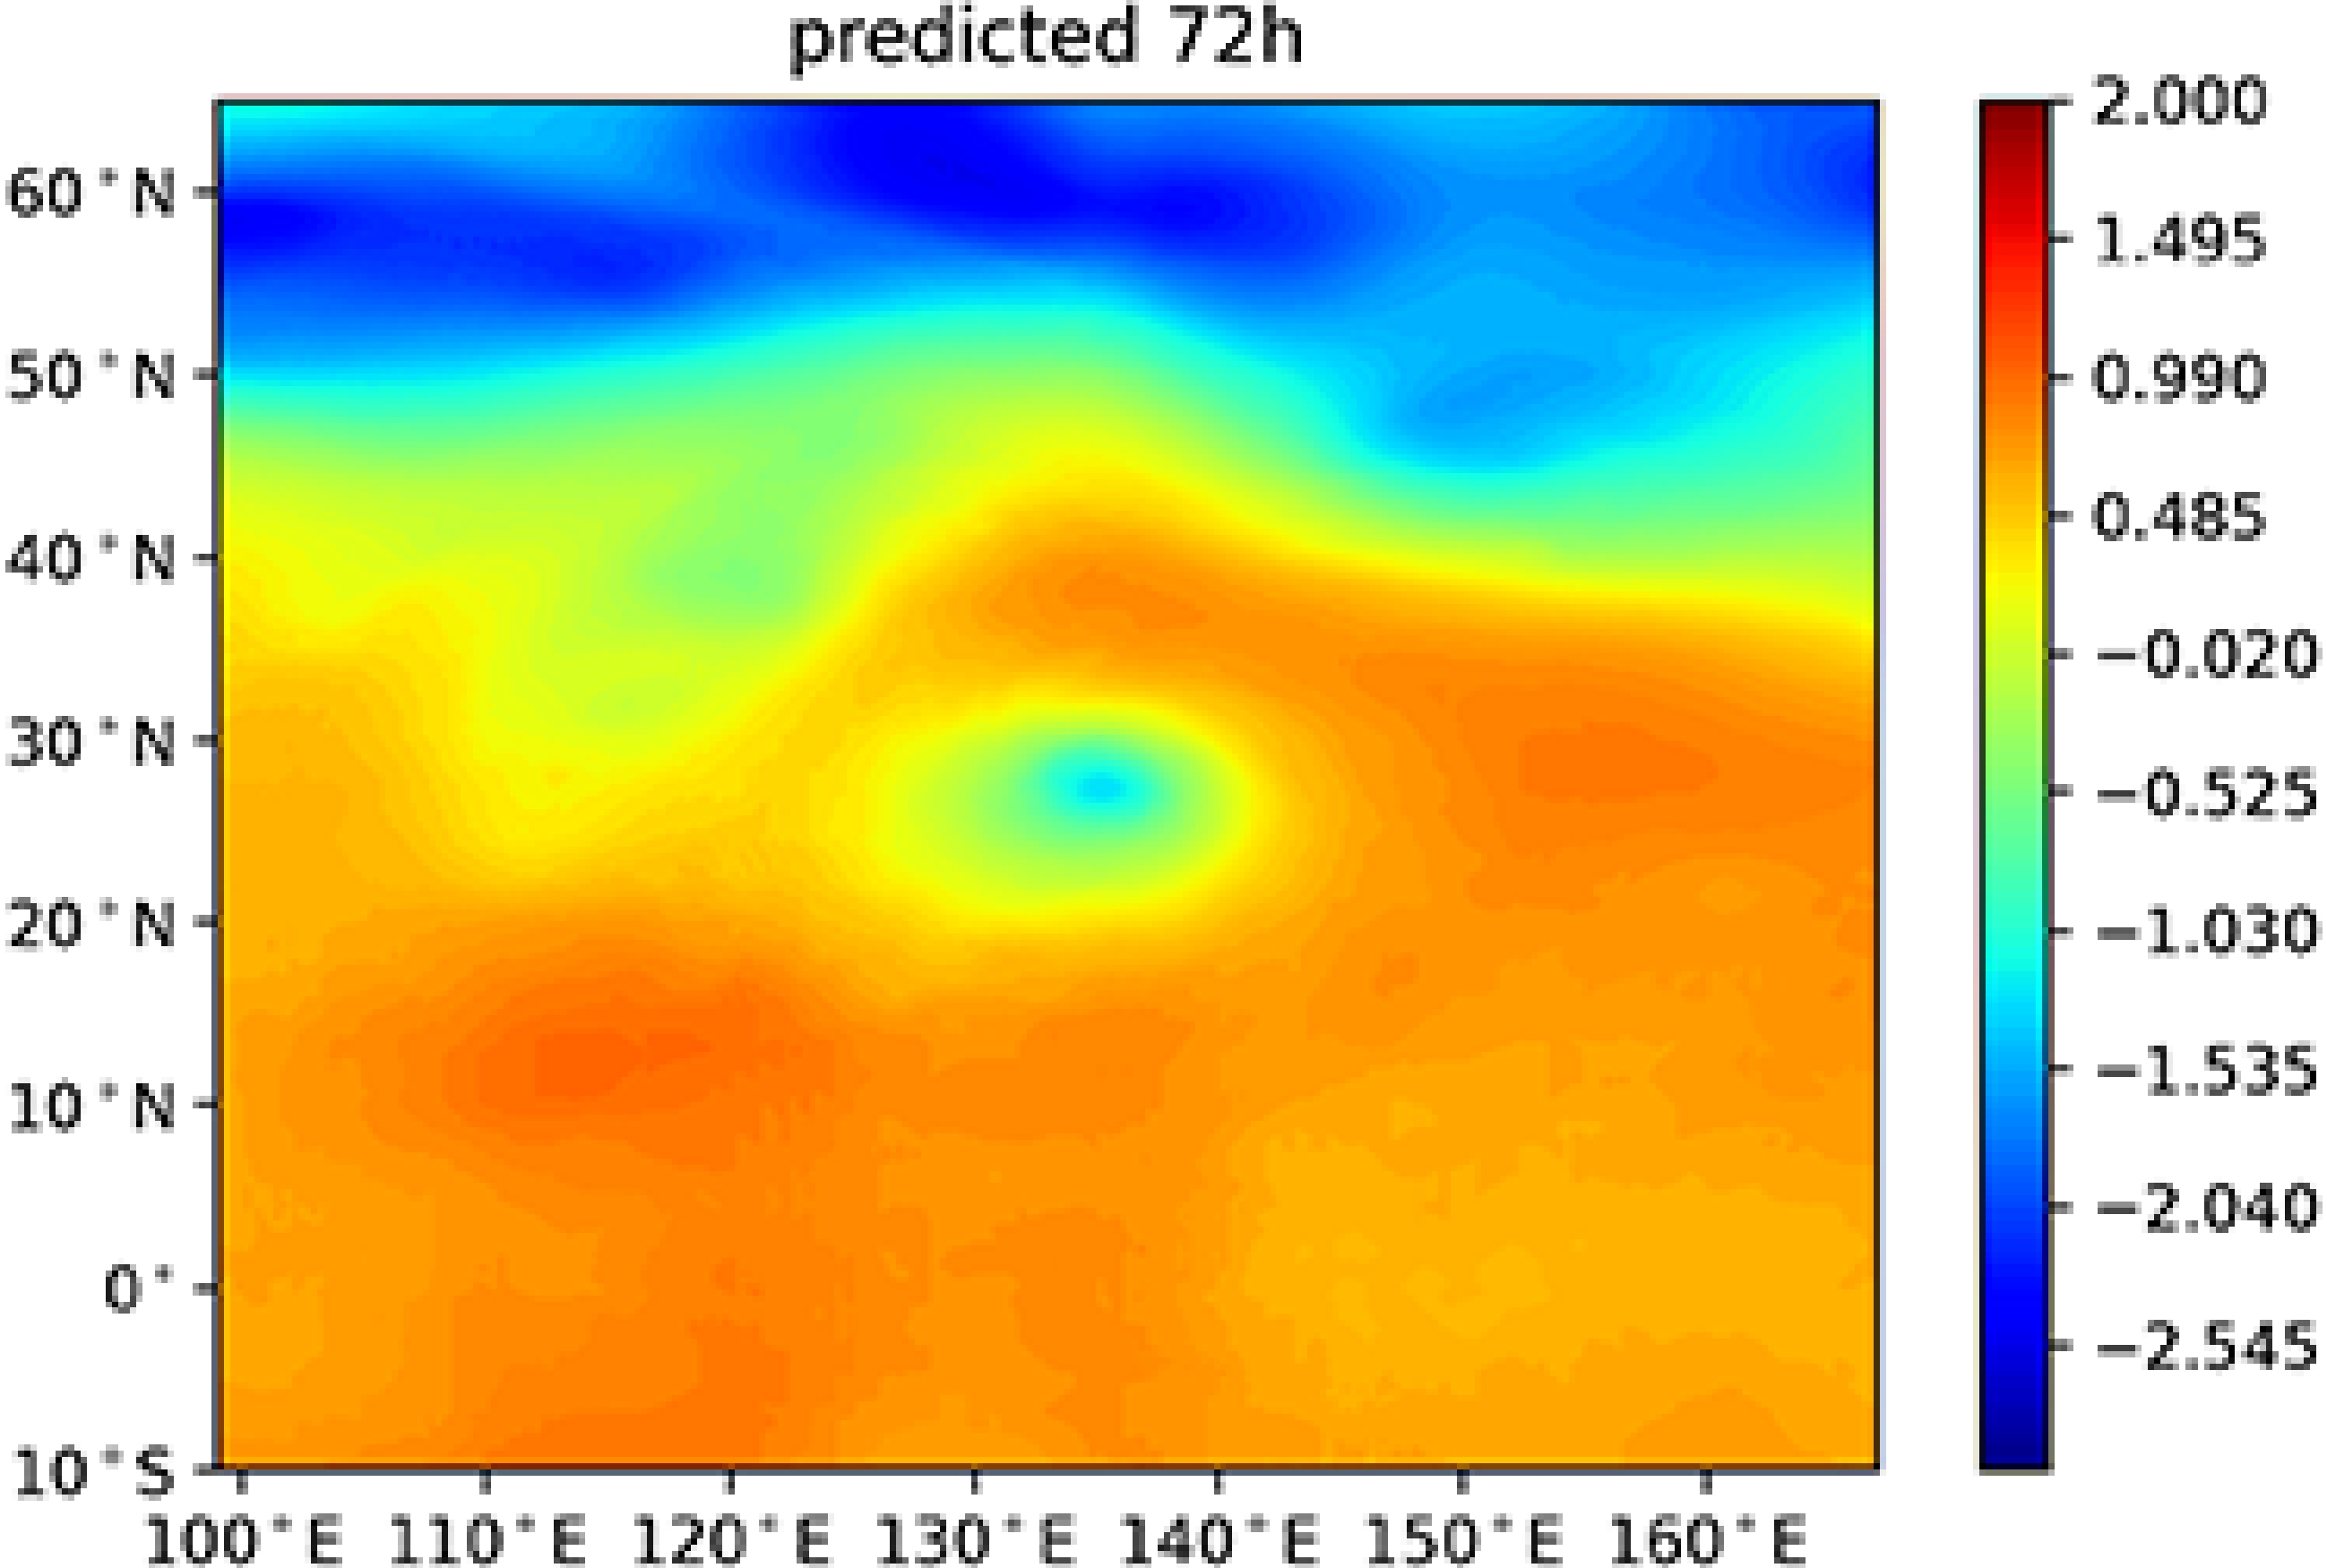
To explore the representativeness of this hybrid model, 500 hPa geopotential height field are also generated using an additional Decode CNN model (Noh et al., 2015), which reconstruct the image with the same shape as the original input image by up-sampling. Table 4 illustrates the predicted experiment results for a standardized 500 hPa geopotential height field estimated by a renovated hybrid model based on reanalysis of the data every 6 h at 0.5°×0.5° resolution during typhoon Lekim, which occurred on August 9-10, 2019. MSE and structural similarity (SSIM) are selected as evaluation criteria. It can be seen from Table 4 that there is an obvious low centre of the typhoon in the real geopotential height field after 6 h, and the coordinate is(24°N,140°E). The image predicted by 6 h performs very well on this key feature, and SSIM is 0.92. We conclude that the two images agree with each other fairly well. In the real geopotential height field after 72 hours, the low centre of the typhoon obviously moved to the northwest. Compared with the predicted image, we find that the position of the predicted typhoon centre is basically consistent, although there is still an error in the strength prediction, as SSIM is 0.71. Figure 6 shows the 32 feature maps of the CNN2D layer, from which it can be seen that the position and characteristics of the typhoon eye and the geopotential height centre are obvious. This finding indicates that the model has good explanatory properties in terms of the characteristics of the physical field.
Table
4.
Comparison of prediction results of 6 h, 24 h, 48 h, and 72 h with real images, the evaluation criteria are mean absolute error (MSE) and structural similarity (SSIM)
In general, compared with the WRF numerical model, the hybrid depth model proposed in this paper has some advantages in that the model can learn the nonlinear relationship based on a large amount of historical data, which saving a lot of calculation time in short-term forecasting and obtaining better results. The shortcomings are that as a technology with only statistical significance, this hybrid cannot replace traditional numerical forecasts in medium-term and long-term forecasts, and even significantly surpass numerical forecasts. Future work should focus on the hybrid model of deep learning and physics to solve the forecast’s bottleneck problems while achieving breakthroughs in artificial intelligence theory.
7.
Conclusions
This paper proposes a hybrid deep neural network model for subtropical high index prediction. The subtropical high index during a typhoon affects the distribution and intensity of precipitation in East Asia. Atmospheric variable field data are from 9 years of ECMWF ERA-5 reanalysis in the West Pacific Ocean during the typhoon activity from 2011 to 2019. The typhoon data comes from JMA. This article first analyses the predictive factors and studies the impact of typhoon activity on the WPSH index in three parts. The first part is to count the WPSH index anomalies corresponding to the three typhoon paths; the second part is the corresponding relationship between the SST, the 850 hPa wind field, the vorticity field, and the geopotential height field during the three typhoon activities. Third, sensitivity experiments are carried out for the SST, wind field and vorticity field of 850 hPa within the $ 15^{\circ} \times 15^{\circ} $ range of the typhoon, and the concept of a sensitivity coefficient is proposed and used as a standard to measure the influence of the above physical field on the WPSH index. Next, the model for predicting the WPSH index combines reanalysis data and typhoon information, and the data flow goes through a ConvLSTM Module, CNN module, and FCN module. The parameters in the model are updated round by round through the backward propagation algorithm. The model's prediction on the validation set demonstrated its promising performance. The hybrid model proposed in this study also has provided insights into the WPSH 500 hPa geopotential height field prediction by replacing the CNN module with DeCNN. The feature map of the model well reflects its physical interpretation and provides good evidence for the availability of deep learning in atmospheric science.
Jianyin Zhou, Jie Xiang, Huadong Du, Suhong Ma. Forecasting the western Pacific subtropical high index during typhoon activity using a hybrid deep learning model[J]. Acta Oceanologica Sinica.
Jianyin Zhou, Jie Xiang, Huadong Du, Suhong Ma. Forecasting the western Pacific subtropical high index during typhoon activity using a hybrid deep learning model[J]. Acta Oceanologica Sinica.
Table
4.
Comparison of prediction results of 6 h, 24 h, 48 h, and 72 h with real images, the evaluation criteria are mean absolute error (MSE) and structural similarity (SSIM)
Figure 1. The anomalies of the WPSH index corresponding to the three types of typhoon paths. The data used in the statistics are the WPSH index corresponding to the typhoon in Table 1.
Figure 2. The distribution of west bound, northwest bound, and steering typhoon paths and intensity with corresponding 500 hPa pressure field anomalies.
Figure 3. The anomaly distribution of the sea surface temperature, 850 hPa wind speed, and vorticity corresponding to the three types of typhoons.
Figure 4. The architecture of hybrid deep learning model used for forecasting the WPSH index.
Figure 5. Box plots depicting the mean absolute error of model forecasted WPSH index.
Figure 6. The 32 feature maps of the CNN layer, taking the 24 hour prediction model as an example


 DownLoad:

 DownLoad:


 DownLoad: